1. Introduction
Photographs primarily serve three roles: to record, communicate, and express. Before the internet became commonplace, photos were primarily used for recording. However, with the proliferation of the internet, individuals now have ways to convey information they want to share, such as through personal websites. As a result, the value of photos and images that can succinctly express one’s message has risen, leading to the use of photography as a tool for communication.
In 2004, a community site called Flickr (
https://www.flickr.com/, accessed on 20 May 2023) was developed as a photo-sharing platform. With such online photo-sharing systems, it became possible to inform people living far away about one’s current situation more realistically, strengthening connections with family, friends, and community members.
Furthermore, the proliferation of smartphones and social networks in recent years has accelerated photo sharing. This is because the same device can be used to both shoot and share photos. In fact, the number of users of Instagram, a photo-sharing and -posting app, is increasing annually, spreading a culture of shooting photos with the awareness of having them viewed by others. As a result, photos have also come to be used as a tool for expression, and the number of people who desire to take good photos has increased.
Next, let us discuss two perspectives on photographic expression. The ability to express oneself through photography involves two elements. One is the ability to discover interesting subjects, which includes not only finding subjects from vague scenes but also identifying interesting aspects within the subjects. The other is the ability to determine how to shoot subjects to convey the intended expression, which requires attention to photographic rudiments such as position, angle, and camera parameters. Therefore, there are two axes—‘what to shoot’ and ‘how to shoot’—and honing them enhances photographic expressiveness.
However, people who desire to take good photos face several challenges. For instance, finding people willing to be photographed is difficult, making practice opportunities hard to come by. They may also lack someone to provide advice, and the parameters specific to cameras and lenses can be hard to intuitively understand without firsthand experience. Even with knowledge, however, the pace of improvement is often slow without repeated practice.
Here, we propose a self-training system for photography, focusing on shooting photos of people. Specifically, we present a VR Photo Training System that provides a space for practicing photography in a VR environment and offers feedback and evaluation on the photos taken within this virtual space. Since the subjects in this system are people, it places emphasis on the latter element of photographic expression, namely ‘how to shoot’.
Soliciting someone to model for portrait photography practice can be a considerable challenge. However, with the VR Photo Training System, generating a subject is as simple as pressing a button, allowing for convenient, on-demand practice. Without access to a digital camera, such as an SLR, comprehending camera parameters can be a daunting task. However, the VR Photo Training System facilitates understanding these parameters through hands-on experience. Through immersive practice and personalized feedback, we anticipate users will experiment and learn how to capture high-scoring photos. Furthermore, the composition recommendation feature can offer users innovative perspectives that they might not ordinarily conceive.
3. VR Photo Training System
3.1. Overview
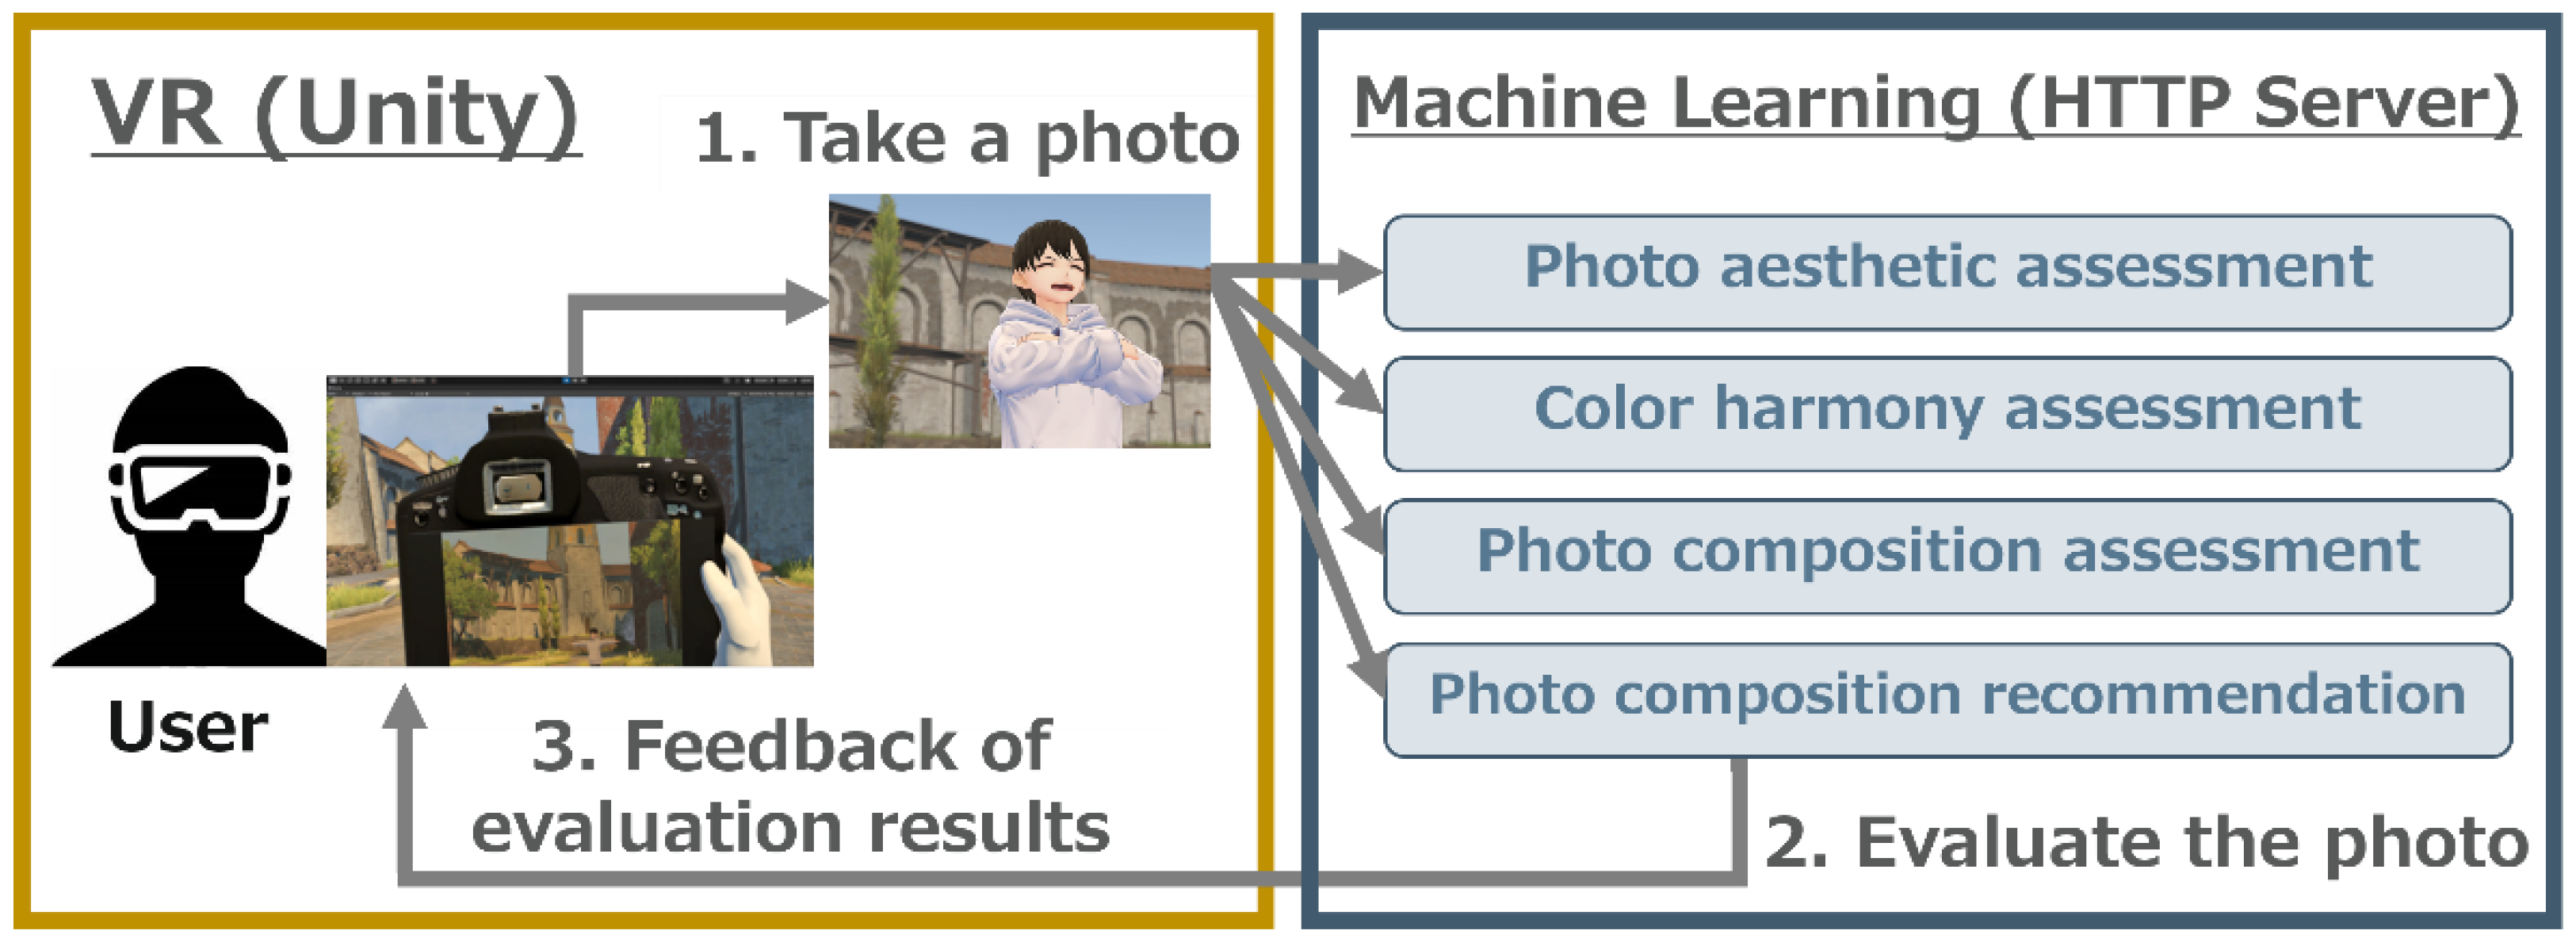
In this research, we set up a photography practice environment in VR. The configuration of our system is shown in
Figure 1. In our system, we take photos of stationary avatars within the virtual space and evaluate these photos in real time. For this study, we used the Meta Quest2 (
https://www.meta.com/quest/products/quest-2/, accessed on 20 May 2023) as our VR device.
Utilizing this system involves the following steps: First, employ the VR controller to choose camera parameters such as aperture value and lens focal length from a panel within the VR interface (as shown on the left in
Figure 2). After parameter selection, manipulate the virtual camera using the VR controller to take a photo of the subject (center of
Figure 2). Select the captured photo from the virtual album for it to be automatically evaluated (right in
Figure 2). If required, a sample image demonstrating a more optimal composition will be presented.
For the development of the training system, we used Unity (
https://unity.com/, accessed on 20 May 2023), a game engine developed by Unity Technologies. For the machine-learning inference, we utilized Flask (
https://flask.palletsprojects.com/, accessed on 20 May 2023), a Python library, to operate an HTTP server. The program on the server side waits while the pre-trained machine learning models are loaded, and it is implemented to immediately return inference results for the photos sent from the client side (Unity).
3.2. Constructing a VR Environment for Photography
In this research, we utilized background and camera assets downloaded from the Unity Asset Store (
https://assetstore.unity.com/, accessed on 20 May 2023) to construct a VR environment.
We used a free background asset called Sun Temple (
https://assetstore.unity.com/packages/3d/environments/sun-temple-115417, accessed on 20 May 2023), which includes environments such as temples, gardens, and residential areas. However, as it was, the rendering load was too large, and the screen would stutter when played in VR. Therefore, we exported the background objects to an FBX file in Unity and merged the objects using Blender (
https://www.blender.org/, accessed on 20 May 2023). We then reloaded the merged object in Unity and confirmed a reduction in rendering load.
In terms of camera functionality, it is undesirable for differences to arise between the virtual world camera and the real-world camera in our system. Therefore, in this research, we used a paid asset called Cinema Pro Cams (
https://transforminteractive.com/cinema-pro-cams/, accessed on 20 May 2023), a standard toolbox within Unity that assists in the creation of real-world cameras. With this asset, it is possible to adjust aperture values and lens settings.
Then, we created six avatars to be the subjects using VRoid Studio (
https://vroid.com/studio, accessed on 20 May 2023). The created avatars are shown in
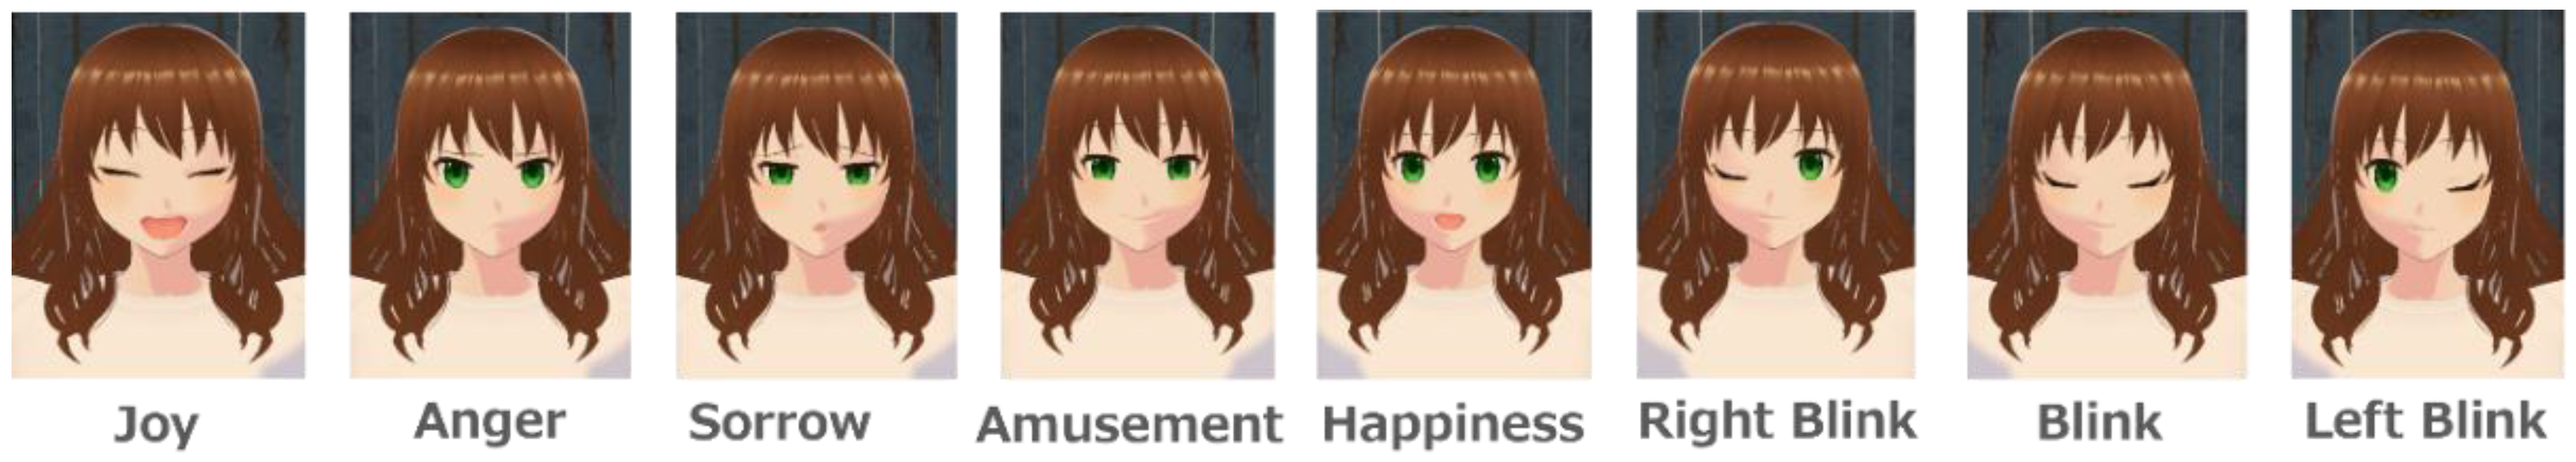
Figure 3. To create the avatars’ poses, we downloaded a Unity package (free version) that contains an assortment of poses from a site called BOOTH (
https://booth.pm/, accessed on 20 May 2023). We then used blend shapes to create expressions. In this research, we uswd the eight types of expressions shown in
Figure 4.
3.3. Aesthetic Photo Evaluation Model
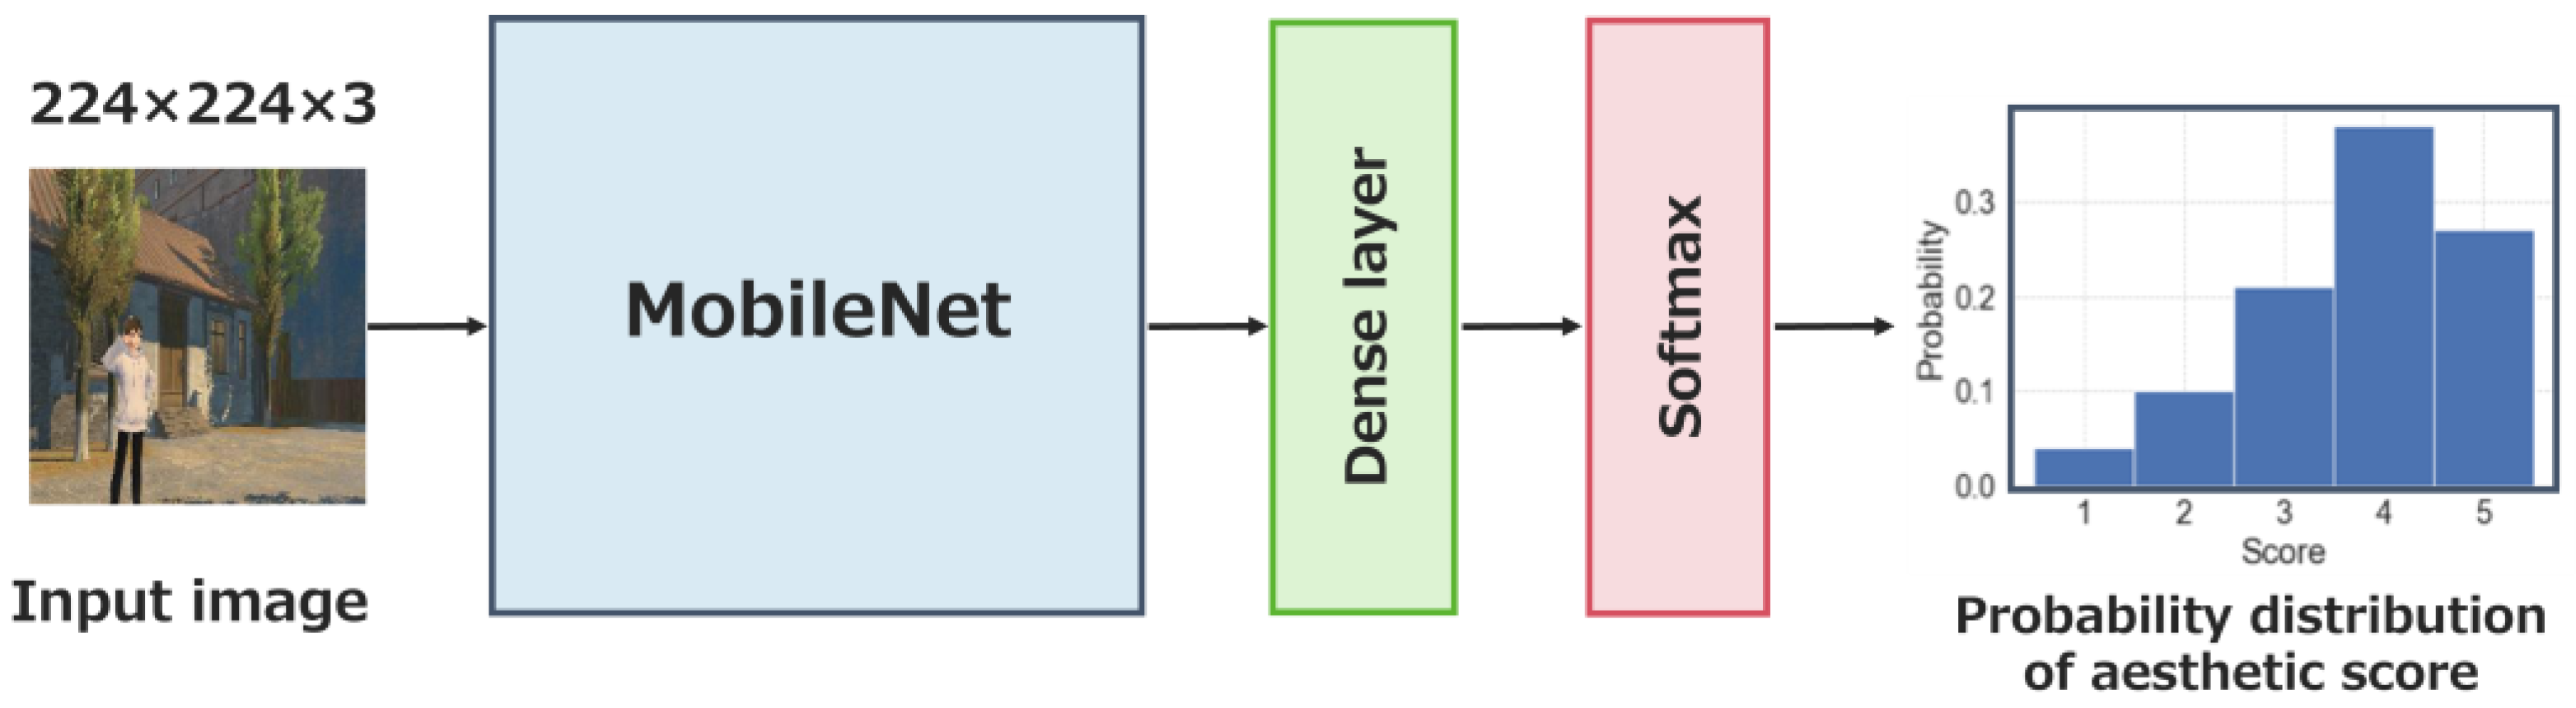
In this research, we used an aesthetic evaluation model based on a convolutional neural network (CNN) to assess photographs. An aesthetic evaluation model is a model designed to extract features, such as the composition, color scheme, and blur of an image, and to evaluate the quality of the photograph. From the perspective of accuracy and computational cost, we utilized the NIMA (neural image assessment) model [
1]. The architecture of the NIMA model is shown in
Figure 5. The MobileNet [
19] shown in
Figure 5 is one of the architectures used in image classification tasks, and it is known as a model that emphasizes maximizing accuracy while being lightweight.
MobileNet employs a unique computational technique known as “depthwise separable convolutions”, which provides a more streamlined alternative to traditional convolution operations. Regular convolutional operations apply convolutional filters to all input image channels (such as red, green, and blue in an RGB image), affecting spatial and channel convolutions simultaneously. However, depthwise separable convolutions partition this operation into two sequential steps, namely “Depthwise Convolution” and “Pointwise Convolution”, thereby diminishing computational demands. To elucidate, Depthwise Convolution involves performing convolutions individually for each channel, meaning each filter interacts with just one channel. Following this, in Pointwise Convolution, the output from each channel via Depthwise Convolution is merged through a 1 × 1 convolution operation. Hence, after the spatial convolution in Depthwise Convolution, channel convolution is carried out in Pointwise Convolution. This sequential, rather than simultaneous, operation of spatial and channel convolutions curbs computational expenses. For instance, with a 3 × 3 filter size, 64 input channels, and 128 output channels, standard convolution operations would necessitate a total of 73,728 multiplications (3 × 3 × 64 × 128). In contrast, depthwise separable convolutions only require 576 multiplications (3 × 3 × 64) in the depthwise phase and 8192 (64 × 128) in the pointwise phase, culminating in 8768 operations in total. This stark contrast showcases the significant reduction in computational complexity. Considering the need for real-time feedback in this study, the NIMA model employing MobileNet, with its low computational burden, was deemed an appropriate choice.
The NIMA model takes a single image as input and outputs a probability distribution of aesthetic scores. By calculating the weighted average of the outputted probability distribution, a binary classification is performed to determine if the image is aesthetically pleasing. Therefore, the loss function uses the EMD (Earth Mover’s Distance) [
20], which measures the distance between two probability distributions, rather than the typical Binary Cross Entropy. The EMD can be expressed with the formula:
On the left side of the equation,
and
represent the probability distribution of the correct score and the predicted score, respectively. On the right side,
denotes the number of ordered classes,
represents the cumulative distribution function, and
represents the norm. In this research, based on Talebi and Milanfar [
1], we set
.
In this study, the evaluation was conducted as a binary classification problem based on previous research [
1], so we followed that and used binary classification as the output of the photo aesthetic evaluation model. However, since the NIMA model uses the EMD loss to predict the histogram of scores, it would not be a problem to calculate the weighted mean and output it as it is with continuous values.
3.4. Dataset
For the dataset of real-world photos, we use a large-scale dataset called AVA (Aesthetic Visual Analysis) [
21].
Figure 6 shows examples of photos included in the AVA dataset. The AVA dataset contains approximately 255,000 photos, annotated with scores ranging from 1 to 10 by hundreds of amateur and professional photographers.
On the other hand, differences are expected between photos taken in the real world and those taken in a virtual world. Therefore, we conducted automated shooting to collect data from photos taken in the virtual world. The procedure for automatic shooting was as follows:
1. Randomly select an avatar and pose, and generate the avatar at an arbitrary location.
2. Obtain the distance, angle, and height from the avatar randomly, and move the camera to that location.
3. Randomly select the values for the lens (focal length), F-value (aperture), and brightness.
4. Take photos of the avatar both facing and not facing the camera.
5. Delete the generated avatar.
We collected 5000 photos using this procedure.
Figure 7 shows examples of the automatically shot photos.
Photos taken in the virtual world differ from real-world photos. For instance, the avatar’s eyes are larger, and the texture for trees or buildings is slightly different. Due to these differences, we performed annotation work on the 5000 photos taken automatically and created the VR Photo dataset.
Annotation work was carried out with the help of 19 individuals who have posted more than 10 times on Instagram, and each photo was evaluated by two people on a five-point scale. Although annotations were provided for all 5000 photos, not all of the data could necessarily be used for learning. That is, it was unclear whether all evaluators labeled appropriately. Therefore, in this study, we conducted an investigation of inter-rater agreement. Specifically, we used Cohen’s weighted Kappa coefficient [
22], a measure of the degree of agreement between two ratings. Unlike the general Kappa coefficient [
23], this coefficient is used for ordered labels. The definition of the weighted Kappa coefficient is:
In Equation (2), the “o” in represents “observed”, and the “e” in represents “expected”. That is, and represent the observed weighted probability and the expected weighted probability of chance agreement, respectively. Thus, the calculation of agreement was performed with chance agreement excluded.
In this study, based on Cohen [
22], we decided to use data with a Kappa coefficient value greater than 0.4. As a result, we collected a total of 3800 pieces of data.
3.5. Results of Aesthetic Evaluation Model Training
In this study, we performed pre-training of the NIMA model [
1] using the AVA dataset [
21], then split the VR Photo dataset into 8:1:1 (training:validation:test) and carried out fine-tuning.
Table 1 shows the accuracy of the pre-training model and the fine-tuning model on the test data of the VR Photo dataset. The results confirm that fine-tuning with photos taken within VR improved accuracy.
Figure 8 shows the evaluation of photos taken in the VR environment.
In this section, we explained how we created a practice field for photo shooting in a VR environment and built an aesthetic evaluation model for photos. In the next section, we will evaluate photos from a more detailed perspective. Specifically, we will construct evaluation models for composition and color.
4. Automatic Evaluation Models for Composition and Color
4.1. Focal Points of Composition and Color in Photo Evaluation
Composition refers to the positional relationships between elements that make up the screen. By being aware of the composition, photographers can guide the viewer’s gaze to where you want them to look. According to Peterson [
24], the appeal of a photo does not depend solely on “what you shoot”. What is needed to create a photo that appeals to people’s emotions is “how you arrange and present the elements composing the photo”; in other words, the composition is crucial. Therefore, in the evaluation of composition in this study, we focused on the arrangement of objects in the photo when deciding to make the avatar the main character.
On the other hand, color is expressed through three elements: light, object, and vision. When light hits an object, the object not only absorbs it but also reflects some of it back. Then, the wavelength of this reflected light reaches the eye, and we can recognize colors.
Furthermore, Albert Henry Munsell [
25] decomposed color into three axes—hue, saturation, and brightness—and standardized it by quantifying it. These three axes are called “the three attributes of color”.
Figure 9 shows examples of hue, saturation, and brightness.
4.1.1. Focal Points of Composition
In assessing the composition of a photo, individuals usually take into account various elements. For this study, we were required to conduct a manual evaluation of the composition. Hence, we consolidated the key points of composition based on Peterson’s work [
24], which identifies seven focal points in the composition.
The first one is “Is the main character clear and outstanding?”
Figure 10 shows examples of photos with and without a clearly outstanding main character when the soap is designated as the main character. In the photo on the right, the main character is vague, and it is unclear where the viewer’s gaze should be directed. On the other hand, in the photo on the left, by getting closer to a specific subject, a relationship between the main and supporting characters is established, and the viewer’s gaze is guided. Thus, it could be said that a photo with a clear main character and a photo with an ambiguous one give different impressions to the viewer.
The second one is “Is the background chosen appropriately?” The background is important. You cannot take a photo without a background. Because the background has the role of highlighting the main character, if there is anything unnecessary, it becomes noise that distracts the viewer’s gaze from the main character. Therefore, a simple background (containing only the intended elements) or a unified one is desirable.
The third one is “Is the rule of thirds considered?” The rule of thirds is a composition where the main subject or horizon is placed on the intersections or lines of a grid dividing the screen into thirds. Practicing the rule of thirds creates moderate white space and has the effect of nicely tying together the entire screen.
The fourth one is “Is there space in the direction the subject is facing?” If there is ample space in the direction the body is facing or the gaze is flowing, it can be considered natural.
The fifth one is “Can depth be perceived?”
Figure 11 shows examples of photos where depth can be perceived. Specifically, depth can be felt when there are objects in front of the main character or when there are lines guiding the gaze. In photos where depth can be felt, the addition of a 3D element to what should be a 2D photo enhances the expressive power of the photo.
The sixth one is “Doesn’t it have a taboo composition?” Compositions in which it looks like a pole or something is piercing the head (a “skewered composition”), lines are entering toward the eyes (an “eye-stabbing composition”), or the neck appears to be cut off due to a background roof or fence (a “neck-cut composition”), are considered bad luck and should be avoided.
The seventh one is “Can symmetry be perceived?” A symmetrical composition that is symmetrical either vertically or horizontally can give a well-balanced and stable impression.
These are the focal points of composition. It is not necessarily required to meet all of them, but it can be considered that the more of these points that are met, the better the composition will be.
4.1.2. Focal Points of Color
Similar to composition, when evaluating color, judgment is made from multiple perspectives. In this study, we summarized the focal points of color, drawing from Peterson and Schellenberg [
26]. There are three focal points of color.
The first one is “Is the photo high in contrast?” Generally, contrast refers to the difference between the bright and dark parts of an image. However, in this study, since we are dealing with color contrast, we take into account the contrast of hue, saturation, and brightness. When contrast is strongly felt, it is considered that the subject is highlighted.
The second one is “Does the color scheme feel harmonious?” A color scheme refers to the combination of colors. In the field of color engineering, various studies have been conducted on the harmony and disharmony of color schemes [
27,
28,
29]. Among them, the Moon–Spencer color harmony model [
27] is often used. This model targets simple color schemes consisting of two colors and identifies whether these two colors are harmonious based on rules, focusing on differences in hue, saturation, and brightness. There are three types of perceived harmony: “Contrast” for colors with large differences, “Similarity” for close colors, and “Identity” for the same color.
Figure 12 shows examples of the three types of harmony.
The third one is “Is the brightness of the photo and the direction of light appropriate?” Attention is paid to whether the photo feels overall dark, too bright, or whether there is a sense of discomfort in the skin color.
4.2. Data Collection
In this study, automatic photo shooting was conducted again to create a photo dataset of compositions and colors shot in VR. The procedure for automatic shooting is as follows:
1. Select an avatar, pose, and expression randomly and generate the avatar in any location.
2. Determine camera parameters (F-value, brightness value) randomly.
3. Place a camera object in any location.
4. Delete the generated avatar.
Here, we explain Step 3 in more detail.
Figure 13 shows an outline of how the camera object is placed. When setting up the camera in this study, we randomly determined four parameters: the distance between the avatar and the camera, the height of the camera, the revolution angle of the camera, and its rotation angle.
Using the method above, the distance between the avatar and the camera was randomly obtained from two ranges (1.0–4.0 m and 4.0–7.0 m for horizontal images, 2.0–5.0 m and 5.0–8.0 m for vertical images), and a total of eight photos were taken per scene. However, if the two obtained values were close, we ensured there was a difference of at least 1.0 m. In addition, if the avatar’s “eyes” and “mouth” were not visible in the camera, or if there was an obstacle between the avatar and the camera, we did not take the shot. We then collected 250 scenes (2000 photos) each of horizontal and vertical photos where all eight photos were present.
Figure 14 shows examples of the eight photos taken automatically.
Furthermore, we performed data augmentation to increase the number of photos taken of the same scene. Using a recommendation model for composition [
30] trained with real-world photo data, we obtained 24 images per scene (generating 16 trimmed images from the 8 original images).
4.3. Creation of Annotation Systems
In this study, we created annotation systems for composition and color evaluation using HTML, CSS, and JavaScript.
The annotation system for composition evaluation is shown in
Figure 15. In this annotation system, pictures taken of the same scene are compared, and users are asked to select the best images. The system comprises nine steps for each scene; from Step 1 to 8, users choose one out of three images, and in Step 9, they choose three out of the eight images that have been selected up to Step 8. In this study, evaluators were asked to label 300 scenes. However, as it would be difficult to evaluate 300 scenes at once, we divided the task into four parts, with 75 scenes each.
The annotation system for color evaluation is shown in
Figure 16. This system encourages evaluators to focus on the colors that make up the photos. Specifically, evaluators first divide the images of the photo and then rate them on a five-level scale from a color perspective. In addition, evaluators are asked questions such as, “Do you feel the contrast?”, “Is the brightness appropriate?”, and “Do you feel the overall color coordination is harmonious?” In this study, evaluators were asked to label 500 photos. However, as it would be challenging to evaluate all photos at once, we divided the task into four parts, with 125 photos each.
Both annotation systems have four implemented features: image selection, screen transition, alert messaging, and data saving to local storage. First, in the image selection feature, when an evaluator selects an image, the selected image is surrounded by a red frame. Next, in the screen transition feature, there are ‘Next’ and ‘Back’ buttons, allowing for review and modification of the previously selected images. The message feature displays a cautionary message when leaving the page. Lastly, the local storage saving feature saves the information up to the evaluated part, and when accessed again, users can start from where they left off, even if they navigated away or reloaded the scene.
4.4. Composition Dataset
Among real-world composition datasets, a large-scale dataset exists known as the CPC (Comparative Photo Composition) dataset [
30]. This dataset contains over one million pairs of images that have been evaluated for composition quality.
In this study, we used automatically captured photos within VR to create a composition dataset. For this purpose, we engaged six people with over two years of camera experience to work on the annotation task. The annotation was evaluated using Fleiss’s Kappa coefficient [
31].
Fleiss’s Kappa coefficient is an indicator for measuring the degree of agreement among three or more evaluators. In this study, we measured the degree of agreement using the data obtained from Step 1 to 8 of the annotation system for composition evaluation. Specifically, since six evaluators performed the task of “selecting one image out of three” a total of 2400 times (300 scenes × 8 steps), we measured the value of the Kappa coefficient using that annotation data. Generally, it is desirable for the Kappa coefficient value to exceed 0.4. However, when we measured it using the annotation data from the six evaluators, the Kappa coefficient was 0.388. Therefore, we measured it again using the annotation data from five evaluators. The highest score combination was 0.460, so in this study, we created paired images using the annotation data from those five evaluators.
Based on Wei et al. [
30], paired images were created in two ways. The first method was to create them from the annotation data from Step 1 to 8. We focused on the number of people who agreed on the image selection and created paired images from combinations where there was a difference in the opinions of two or more people. The second method was to create the paired images from the annotation data of Step 9. In Step 9, images selected by three or more out of five people were paired with other images from the same scene. With these methods, we created exactly 13,000 sets of paired images with established superiority and inferiority.
4.5. Building the Composition Evaluation Model
The VEN model [
30] was used as the model for evaluating composition. The VEN model is a model that utilizes the structure of VGG16 [
32], one of the CNNs for image classification. The structure of the VEN model is shown in
Figure 17.
VGG16 is an architectural model that includes two blocks of “convolutional layer, convolutional layer, pooling layer” repeated twice; three blocks of “convolutional layer, convolutional layer, convolutional layer, pooling layer” repeated three times; and culminates in three fully connected layers. Essentially, it is a 21-layer neural network comprising 13 convolutional layers, 5 pooling layers, and 3 fully connected layers. In addition, while VGG16 produces 1000 outputs, the VEN model only generates a single composition score. As such, in reference [
30], VGG16’s three fully connected layers were removed, retaining only the feature extraction portion of the model. Subsequently, two new fully connected layers and a single output layer were added to achieve the desired outputs. By adjusting the number of units in the fully connected layer to align with the fewer number of outputs, we succeeded in designing a model that is less complex than the original VGG16.
Next, we explain the learning method of the VEN model. During the training, we used a framework called a Siamese network [
33], as shown in
Figure 18. Here, a Siamese network is a mechanism that compares the outputs of two input images through the same network with shared weights.
More specifically, the input is a pair of images (image
, image
) with composition ranking, and the output corresponds to the composition score of the input images
. The loss function is defined as follows based on Kong et al. [
34].
However, in Equation (3), image is assumed to have a composition superior to that of image .
Next, we describe the learning results of the VEN model. In this study, we conducted pre-training using the CPC dataset mentioned in the previous section. Then, we fine-tuned the model by dividing the created 13,000 pairs of images into a 9:1 ratio (training:validation).
Figure 19 shows the transition of the VEN model’s loss function and swap error [
35]. Here, the swap error is the ratio of pairs that were mistakenly ranked as a result of inference for paired images with ranking.
Continuing, we evaluated the created composition evaluation model using the FLMS dataset [
36]. The FLMS dataset was created to evaluate the performance of image cropping tasks. Although this dataset consists of photos taken of the real world, we believe it is desirable to be able to appropriately evaluate composition even with real photos. The dataset includes 500 images, each with 10 correct labels (coordinates of rectangular areas).
In previous studies [
35,
37,
38], IOU and displacement error were used as evaluation metrics for cropping tasks. Therefore, we decided to use these evaluation metrics in this study as well. The two evaluation metrics are defined as follows.
where
represents the correct bounding box,
represents the predicted bounding box, and
Bk represents the normalized boundary conditions. Finally, we show the results of the evaluation using the FLMS dataset [
36] in
Table 2. From the results, we confirmed that sufficient accuracy was achieved even in cropping tasks with real photos.
4.6. Building the Color Evaluation Model
In this study, we used the Gated CNN model [
39] for evaluating color. The structure of the Gated CNN model is shown in
Figure 20. This model equally divides the input image (224 × 224 × 3) into patches (16 × 16 × 3), creating five patches for each set, which include the center patch (16 × 16 × 3) and its four neighboring patches (16 × 16 × 3). These are sequentially fed into the model. Including not only the center patch but also the neighboring patches allows for the learning of spatial positional information between patches. In Lu et al. [
39], training was performed with 10 sets extracted at random, but in this study, we used all possible patch sets (144 sets) for learning.
In this context, the ResNet depicted in
Figure 20 does not follow the standard 152-layer network structure. Instead, it adopts a structure akin to what is shown in
Figure 21. Similar to the conventional ResNet, this model utilizes the shortcut connection mechanism, which allows for the direct addition of input from the preceding layers to the succeeding layers. This mechanism effectively mitigates the issue of gradient vanishing, a common problem in deep neural networks.
Next, let us discuss the Gated CNN block in red in
Figure 20. The structure of the Gated CNN block is illustrated in
Figure 22.
In the Gated CNN model, the activation function for the convolutional layer diverges from the traditional ReLU function and instead employs the Gated Activation [
40]. The definition of this activation function is as follows:
Here,
represents element-wise multiplication (Hadamard product), which calculates the product of matrix elements;
and
represent the feature maps divided into two from the output of the convolutional layer; and
represents the convolution operator. Equation (6) is also used in models such as WaveNet [
41], which is a leading model in speech recognition and synthesis technology.
In the above model, the output is composed of two harmony probabilities: the harmony probability
within the center patch, and the harmony probability
between the center patch and the neighboring patches. Therefore, the overall harmony probability for the image was defined in Lu et al. [
39] as follows:
where
K is the number of center patches, and
and
are hyperparameters. In this study, we followed Lu et al. [
39] and set
= 0.1 and
= 0.9. The loss function used was binary cross entropy.
Next, we created a color dataset. In this study, we used annotated data that were rated on a five-point scale for color, and adopted the data from the two individuals who had the highest value of Cohen’s weighted Kappa coefficient [
22] (Kappa coefficient: 0.545). For the five-point rating of annotated data, we created a histogram and converted it into a binary classification of ‘Good’ and ‘Bad’.
Finally, we present the learning results for the Gated CNN model. In this study, we divided 500 photo data into an 8:1:1 ratio, and for the training data, we performed data augmentation by rotating the images by 90 degrees, 180 degrees, and 270 degrees. We show the accuracy for the validation data and test data in
Table 3. From the results, it seems that a relatively sufficient accuracy was obtained as an evaluation function of the training system, even in the color task.
6. Concluding Remarks
In this study, we proposed a VR Photo Training System designed to improve the photography skills of beginners and those without a camera. Specifically, we created a photography practice environment in VR and applied multiple machine-learning models to the system, resulting in a training system equipped with automatic evaluation and composition recommendation functions.
Regarding the contributions of this study, although there are currently camera schools, there are, to our knowledge, no applications or systems to support photography skill improvement. Thus, in this research, we demonstrated that by integrating individual models for the aesthetic evaluation of photography, composition evaluation, and color evaluation, these models can be applied to a photography training system. Moreover, by applying the VPN model [
30] in VR, we showed the ability to take simultaneous photos from various positions and angles, enabling composition recommendations that consider different angles.
In this study, we could not assess nor confirm whether the participants’ photography skills improved using the VR Photo Training System. As a result, we could not provide evidence of actual skill improvement. Evaluating the system through experiments with test subjects is a necessary future task. To evaluate the system, we propose having several individuals use it for at least three months. On the first and last day, participants would take 20 photos, which would be reviewed by a professional photographer to determine skill improvement. In addition, a questionnaire survey would gather user opinions and assess the system’s ease of use.
The source codes and datasets for the machine learning models developed in this study, along with a demonstration video, are provided in the
Supplementary Materials as indicated below.


