
Unleashing the Hidden Potential: The Dynamic Duo of Antimicrobial Photodynamic Therapy and Photobiomodulation: A Spectrophotometric Study

 , , and
Abstract
:1. Introduction
2. Materials and Methods
2.1. Photosensitizers and Laser Sources
- Methylene blue (Methylene Blue, Sigma-Aldrich Merck KGaA, Darmstadt, Germany) at 0.05, 0.10 and 10.00 mg/mL (w/v), respectively, in sterile distilled water.
- Toluidine blue gel (ready to use syringe) (BluLase PDT Gel, Schneider-Dental, Pilsach, Germany). Information regarding the concentration present and the preparation is not provided by the manufacturer.
- Indocyanine green (Emundo®, A.R.C. laser GmbH, Nurnberg, Germany) at 1.00 mg/mL and 0.10 mg/mL (w/v) in sterile distilled water.
- For the higher concentration, a single tablet containing 1.00 mg was dissolved in a 1.00 mL volume of sterile distilled water, according to the manufacturer’s instructions. For the lower concentration, one tablet of 1.00 mg was dissolved in 10.00 mL of sterile distilled water.
- Curcumin (UltraCur+Pro®, Weber Μedical GmbH, Lauenförde, Germany) at 5.00 mg/mL; according to the manufacturer, this product is water-soluble, which resolves the obstacle of low water solubility [8]. For this purpose, one tablet of 60 mg was dissolved in 12.00 mL of sterile distilled water.
- A methylene blue derivative (ready to use syringe) (Photolase® Europe Ltd., Hamburg, Germany). Information concerning the concentration present and the preparation of this solution was not provided by the manufacturer.
- a 445 nm wavelength device (SiroLaser Blue, Sirona Dental Systems GmbH, Bensheim, Germany), at 150 mW of power output and with an applicator tip of a 6 mm diameter.
- a 635 nm wavelength device (Klas-DX/LX162, Konftec Corporation, New Taipei City, Taiwan), at 150 mW of power output and with an applicator tip of a 6 mm diameter.
- a 660 nm wavelength device (Klas-DX/LX161, Konftec Corporation, New Taipei City, Taiwan), at 150 mW of power output and with an applicator tip of a 6 mm diameter.
- a 808 nm wavelength device (Klas-DX/LX182, Konftec Corporation, New Taipei City, Taiwan), at 150 mW of power output and with an applicator tip of a 6 mm diameter.
2.2. Testing Procedure
2.3. Data Collection
2.4. Statistical Analysis
3. Results
4. Discussion
4.1. Photosensitizers
4.2. Light Pathway
4.3. Oxygenation
4.4. PBM
- The photosensitizer’s characteristics, such as its concentration and wavelength-dependent extinction coefficient.
- The precise nature of the surrounding tissues that will determine the light penetration depth.
- The tissue oxygenation status that will be enhanced by applying low fluences with longer irradiation times, along with some “time-off” intervals.
- The new concept of “photon fluence”, where the individual wavelength-specific photon energy (in eV) is considered.
5. Conclusions
Author Contributions
Funding
Institutional Review Board Statement
Informed Consent Statement
Data Availability Statement
Conflicts of Interest
References
- Nicolau, D.P. Current challenges in the management of the infected patient. Curr. Opin. Infect. Dis. 2011, 24, S1–S10. [Google Scholar] [CrossRef] [PubMed]
- Norrby, S.R.; Nord, C.E.; Finch, R. European Society of Clinical Microbiology and Infectious Diseases. Lack of development of new antimicrobial drugs: A potential serious threat to public health. Lancet Infect. Dis. 2005, 5, 115–119. [Google Scholar] [CrossRef] [PubMed]
- Yin, R.; Hamblin, M.R. Antimicrobial Photosensitizers: Drug Discovery under the Spotlight. Curr. Med. Chem. 2015, 22, 2159–2185. [Google Scholar] [CrossRef] [PubMed]
- Hamblin, M.R.; Hasan, T. Photodynamic therapy: A new antimicrobial approach to infectious disease? Photochem. Photobiol. Sci. 2004, 3, 436–450. [Google Scholar] [CrossRef] [PubMed] [Green Version]
- Garcia-Diaz, M.; Huang, Y.Y.; Hamblin, M.R. Use of fluorescent probes for ROS to tease apart Type I and Type II photochemical pathways in photodynamic therapy. Methods 2016, 109, 158–166. [Google Scholar] [CrossRef] [Green Version]
- Carrera, E.T.; Dias, H.B.; Corbi, S.C.T.; Marcantonio, R.A.C.; Bernardi, A.C.A.; Bagnato, V.S.; Hamblin, M.R.; Rastelli, A.N.S. The application of antimicrobial photodynamic therapy (aPDT) in dentistry: A critical review. Laser Phys. 2016, 26, 12300. [Google Scholar] [CrossRef] [Green Version]
- Nyman, E.S.; Hynninen, P.H. Research advances in the use of tetrapyrrolic photosensitizers for photodynamic therapy. J. Photochem. Photobiol. B Biol. 2004, 73, 1–28. [Google Scholar] [CrossRef]
- Chiniforush, N.; Pourhajibagher, M.; Shahabi, S.; Bahador, A. Clinical approach of high technology techniques for control and elimination of endodontic microbiota. J. Lasers Med. Sci. 2015, 6, 139–150. [Google Scholar] [CrossRef]
- Parker, S. The use of diffuse laser photonic energy and indocyanine green photosensitiser as an adjunct to periodontal therapy. Br. Dent. J. 2013, 215, 167–171. [Google Scholar] [CrossRef] [Green Version]
- Raab, O. Ueber die Wirkung fluorizierender Stoffe auf Infusorien. Z. Biol. 1900, 39, 524–546. [Google Scholar]
- Mylona, V.; Anagnostaki, E.; Parker, S.; Cronshaw, M.; Lynch, E.; Grootveld, M. Laser-Assisted aPDT Protocols in Randomized Controlled Clinical Trials in Dentistry: A Systematic Review. Dent. J. 2020, 8, 107. [Google Scholar] [CrossRef] [PubMed]
- Wainwright, M.; Maisch, T.; Nonell, S.; Plaetzer, K.; Almeida, A.; Tegos, G.P.; Hamblin, M.R. Personal View Photoantimicrobials—Are we afraid of the light? Lancet Infect Dis. 2017, 17, e49–e55. [Google Scholar] [CrossRef] [PubMed]
- Wenzler, J.-S.; Böcher, S.; Frankenberger, R.; Braun, A. Feasibility of transgingival laser irradiation for antimicrobial photodynamic therapy. Photodiagnosis Photodyn. Ther. 2019, 28, 75–79. [Google Scholar] [CrossRef] [PubMed]
- Cronshaw, M.; Parker, S.; Arany, P. Feeling the Heat: Evolutionary and Microbial Basis for the Analgesic Mechanisms of Photobiomodulation Therapy. Photobiomodulation Photomed. Laser Surg. 2019, 37, 517–526. [Google Scholar] [CrossRef] [PubMed]
- Khan, I.; Arany, P. Biophysical Approaches for Oral Wound Healing: Emphasis on Photobiomodulation. Adv. Wound Care 2015, 4, 724–737. [Google Scholar] [CrossRef] [Green Version]
- Karu, T.I. Cellular and molecular mechanisms of photobiomodulation (low-power laser therapy). IEEE J. Sel. Top. Quantum Electron. 2014, 20, 143–148. [Google Scholar] [CrossRef]
- Amaroli, A.; Benedicenti, A.; Ferrando, S.; Parker, S.; Selting, W.; Gallus, L.; Benedicenti, S. Photobiomodulation by Infrared Diode Laser: Effects on Intracellular Calcium Concentration and Nitric Oxide Production of Paramecium. Photochem. Photobiol. 2016, 92, 854–862. [Google Scholar] [CrossRef]
- Wang, Y.; Huang, Y.Y.; Wang, Y.; Lyu, P.; Hamblin, M.R. Photobiomodulation (blue and green light) encourages osteoblastic-differentiation of human adipose-derived stem cells: Role of intracellular calcium and light-gated ion channels. Sci. Rep. 2016, 6, 33719. [Google Scholar] [CrossRef] [Green Version]
- Cronshaw, M.; Parker, S.; Anagnostaki, E.; Mylona, V.; Lynch, E.; Grootveld, M. Photobiomodulation Dose Parameters in Dentistry: A Systematic Review and Meta-Analysis. Dent. J. 2020, 8, 114. [Google Scholar] [CrossRef]
- Amaroli, A.; Ravera, S.; Baldini, F.; Benedicenti, S.; Panfoli, I.; Vergani, L. Photobiomodulation with 808-nm diode laser light promotes wound healing of human endothelial cells through increased reactive oxygen species production stimulating mitochondrial oxidative phosphorylation. Lasers Med. Sci. 2019, 34, 495–504. [Google Scholar] [CrossRef]
- Abrahamse, H.; Hamblin, M.R. Photomedicine and Stem Cells: The Janus Face of Photodynamic Therapy (PDT) to Kill Cancer Stem Cells, and Photobiomodulation (PBM) to Stimulate Normal Stem Cells; Morgan & Claypool: San Rafael, CA, USA, 2017; ISBN 978-1-6817-4321-9. [Google Scholar] [CrossRef]
- Niemz, M.H. Laser-Tissue Interactions: Fundamentals and Applications; Springer: Berlin/Heidelberg, Germany, 2007; Volume 3, ISBN 9783540721918. [Google Scholar]
- Kim, M.M.; Darafsheh, A. Light Sources and Dosimetry Techniques for Photodynamic Therapy. Photochem. Photobiol. 2020, 96, 280–294. [Google Scholar] [CrossRef] [PubMed] [Green Version]
- Al-Karadaghi, T.S.; Al-Saedi, A.A.; Al-Maliky, M.A.; Mahmood, A.S. The effect of bleaching gel and (940 nm and 980 nm) diode lasers photoactivation on intrapulpal temperature and teeth whitening efficiency. Aust. Endod. J. 2016, 42, 112–118. [Google Scholar] [CrossRef] [PubMed]
- Anagnostaki, E.; Mylona, V.; Kosma, K.; Parker, S.; Chala, M.; Cronshaw, M.; Dimitriou, V.; Tatarakis, M.; Papadogiannis, N.; Lynch, E.; et al. A Spectrophotometric Study on Light Attenuation Properties of Dental Bleaching Gels: Potential Relevance to Irradiation Parameters. Dent. J. 2020, 8, 137. [Google Scholar] [CrossRef] [PubMed]
- Pourhajibagher, M.; Kazemian, H.; Chiniforush, N.; Hosseini, N.; Pourakbari, B.; Azizollahi, A.; Rezaei, F.; Bahador, A. Exploring different photosensitizers to optimize elimination of planktonic and biofilm forms of Enterococcus faecalis from infected root canal during antimicrobial photodynamic therapy. Photodiagnosis Photodyn. Ther. 2018, 24, 206–211. [Google Scholar] [CrossRef]
- Ormond, A.B.; Freeman, H.S. Dye sensitizers for photodynamic therapy. Materials 2013, 6, 817–840. [Google Scholar] [CrossRef] [Green Version]
- Grimm, W.D.; Fritsch, T.; Vukovic, M.A. Therapeutic Window of Photodynamic Treatment (PDT) in Conservative Periodontal Therapy—Analysis of Cell Migration Within A Three Dimensional Collagen Matrix. Online J. Dent. Oral Health 2021, 4, 1–10. [Google Scholar] [CrossRef]
- Arentz, J. Paradigmenwechsel in der PAR-Therapie? DZW Spez. 2009, 6, 1–2. [Google Scholar]
- Meire, M.A.; Poelman, D.; De Moor, R.J. Optical properties of root canal irrigants in the 300-3,000-nm wavelength region. Lasers Med. Sci. 2014, 29, 1557–1562. [Google Scholar] [CrossRef]
- Available online: https://www.gigacalculator.com/calculators/power-sample-size-calculator.php (accessed on 19 June 2023).
- Mayerhöfer, T.G.; Pahlow, S.; Popp, J. The Bouguer-Beer-Lambert Law: Shining Light on the Obscure. ChemPhysChem 2020, 21, 2029–2046. [Google Scholar] [CrossRef]
- Sharma, S.K.; Chiang, L.Y.; Hamblin, M.R. Photodynamic therapy with fullerenes in vivo: Reality or a dream? Nanomedicine 2011, 6, 1813–1825. [Google Scholar] [CrossRef] [Green Version]
- Finlay, J.C. Multimodality Dosimetry. In Handbook of Photomedicine, 1st ed.; Hamblin, M.R., Huang, Y., Eds.; Taylor and Francis: Boca Raton, FL, USA, 2014; pp. 296–298. ISBN 978-1-4398-8470-6. [Google Scholar]
- Garcez, A.S.; Hamblin, M.R. Methylene Blue and Hydrogen Peroxide for Photodynamic Inactivation in Root Canal—A New Protocol for Use in Endodontics. Eur. Endod. J. 2017, 2, 29. [Google Scholar] [CrossRef] [PubMed]
- Coluzzi, D.; Aoki, A.; Chiniforush, N. Chapter 14.6. Light source. In Lasers in Dentistry-Current Concepts, 1st ed.; Coluzzi, D., Parker, S., Eds.; Springer: Cham, Switzerland, 2017; p. 309. ISBN 978-3-319-51944-9. [Google Scholar]
- George, S.; Hamblin, M.R.; Kishen, A. Uptake pathways of anionic and cationic photosensitizers into bacteria. Photochem. Photobiol. Sci. 2009, 8, 788. [Google Scholar] [CrossRef] [PubMed] [Green Version]
- Landsman, M.L.; Kwant, G.; Mook, G.A.; Zijlstra, W.G. Light-absorbing properties, stability, and spectral stabilization of indocyanine green. J. Appl. Physiol. 1976, 40, 575–583. [Google Scholar] [CrossRef] [PubMed]
- Attia, M.; Cao, J.; Chan, R.; Ling, J.; Ye, J.Y. Optical properties of indocyanine green under ultrasound treatment. J. Photochem. Photobiol. 2020, 2, 100005. [Google Scholar] [CrossRef]
- Monzavi, A.; Chinipardaz, Z.; Mousavi, M.; Fekrazad, R.; Moslemi, N.; Azaripour, A.; Bagherpasand, O.; Chiniforush, N. Antimicrobial photodynamic therapy using diode laser activated indocyanine green as an adjunct in the treatment of chronic periodontitis: A randomized clinical trial. Photodiagnosis Photodyn. Ther. 2016, 14, 93–97. [Google Scholar] [CrossRef]
- Wang, Y.G.; Kim, H.; Mun, S.; Kim, D.; Choi, Y. Indocyanine green-loaded perfluorocarbon nanoemulsions for bimodal (19)F-magnetic resonance/nearinfrared fluorescence imaging and subsequent phototherapy. Quant. Imaging Med. Surg. 2013, 3, 132–140. [Google Scholar] [CrossRef]
- Kazantzis, K.T.; Koutsonikoli, K.; Mavroidi, B.; Zachariadis, M.; Alexiou, P.; Pelecanou, M.; Politopoulos, K.; Alexandratou, E.; Sagnou, M. Curcumin derivatives as photosensitizers in photodynamic therapy: Photophysical properties and: In vitro studies with prostate cancer cells. Photochem. Photobiol. Sci. 2020, 19, 193–206. [Google Scholar] [CrossRef]
- Etemadi, A.; Hamidain, M.; Parker, S.; Chiniforush, N. Blue Light Photodynamic Therapy with Curcumin and Riboflavin in the Management of Periodontitis: A Systematic Review. J. Lasers Med. Sci. 2021, 12, e15. [Google Scholar] [CrossRef]
- Mahmood, T.; Anwer, F.; Mahmood, I.; Kishwar, F.; Wahab, A. Solvatochromic effect of Methylene Blue in different solvents with different polarity. Eur. Acad. Res. 2013, 1, 1100–1109. [Google Scholar]
- Selifonov, A.A.; Zyuryukina, O.A.; Lazareva, E.N.; Skibina, Y.S.; Zagorovskaya, T.M.; Syrova, O.V.; Aleshkina, O.Y.; Tuchin, V.V. Measurement of optical properties of human gums and dentin in the spectral range from 350 to 800 nm. Izv. Saratov Univ. New Ser. Phys. 2020, 20, 258–267. [Google Scholar] [CrossRef]
- Kim, J.; Lee, G.; Chang, W.S.; Ki, S.H.; Park, J.C. Comparison and contrast of bone and dentin in genetic disorder, morphology and regeneration: A review. J. Bone Metab. 2021, 28, 1–10. [Google Scholar] [CrossRef] [PubMed]
- Rossi, V.M.; Gustafson, S.B.; Jacques, S.L. Characterizing the Optical Properties of Bone Using a Multi-Fiber Array and Diffuse Reflectance Spectroscopy. Front. Opt./Laser Sci. XXV OSA Opt. Photonics Tech. Dig. 2009, 7166, 1–12. [Google Scholar] [CrossRef]
- Nogueira, A.C.; Graciano, A.X.; Nagata, J.Y.; Fujimaki, M.; Terada, R.S.S.; Bento, A.C.; Astrath, N.G.C.; Baesso, M.L. Photosensitizer and light diffusion through dentin in photodynamic therapy. J. Biomed. Opt. 2013, 18, 055004. [Google Scholar] [CrossRef] [PubMed] [Green Version]
- Tuchin, V.V. Tissue Optics: Light Scattering Methods and Instruments for Medical Diagnosis; SPIE: Bellingham, WA, USA, 2015; ISBN 9781628415162. [Google Scholar] [CrossRef]
- Sterenborg, H.; van Veen, R.; Aans, J.B.; Amelink, A.; Robinson, D.J. Light Dosimetry for Photodynamic Therapy: Basic Concepts. In Handbook of Photomedicine, 1st ed.; Hamblin, M.R., Huang, Y., Eds.; Taylor and Francis: Boca Raton, FL, USA, 2014; pp. 283–287. ISBN 978-1-4398-8470-6. [Google Scholar]
- Kareliotis, G.; Liossi, S.; Makropoulou, M. Assessment of singlet oxygen dosimetry concepts in photodynamic therapy through computational modeling. Photodiagnosis Photodyn. Ther. 2018, 21, 224–233. [Google Scholar] [CrossRef]
- Cottrell, W.J.; Paquette, A.D.; Keymel, K.R.; Foster, T.H.; Oseroff, A.R. Irradiance-dependent photobleaching and pain in δ-aminolevulinic acid-photodynamic therapy of superficial basal cell carcinomas. Clin. Cancer Res. 2008, 14, 4475–4483. [Google Scholar] [CrossRef] [PubMed] [Green Version]
- Jarvi, M.T.; Patterson, M.S.; Wilson, B.C. Insights into photodynamic therapy dosimetry: Simultaneous singlet oxygen luminescence and photosensitizer photobleaching measurements. Biophys. J. 2012, 102, 661–671. [Google Scholar] [CrossRef] [PubMed] [Green Version]
- Wilson, B.C.; Patterson, M.S. The physics, biophysics and technology of photodynamic therapy. Phys. Med. Biol. 2008, 53, R61–R109. [Google Scholar] [CrossRef]
- Huang, L.; St. Denis, T.G.; Xuan, Y.; Huang, Y.Y.; Tanaka, M.; Zadlo, A.; Sarna, T.; Hamblin, M.R. Paradoxical potentiation of methylene blue-mediated antimicrobial photodynamic inactivation by sodium azide: Role of ambient oxygen and azide radicals. Free Radic. Biol. Med. 2012, 53, 2062–2071. [Google Scholar] [CrossRef] [Green Version]
- Agostinis, P.; Berg, K.; Cengel, K.A.; Foster, T.H.; Girotti, A.W.; Gollnick, S.O.; Hahn, S.M.; Hamblin, M.R.; Juzeniene, A.; Kessel, D.; et al. Photodynamic therapy of cancer: An update. CA Cancer J. Clin. 2011, 61, 250–281. [Google Scholar] [CrossRef]
- Coutier, S.; Bezdetnaya, L.N.; Foster, T.H.; Parache, R.M.; Guillemin, F. Effect of irradiation fluence rate on the efficacy of photodynamic therapy and tumor oxygenation in meta-tetra (hydroxyphenyl) chlorin (mTHPC)-sensitized HT29 xenografts in nude mice. Radiat. Res. 2002, 158, 339–345. [Google Scholar] [CrossRef]
- Henderson, B.W.; Gollnick, S.O.; Snyder, J.W.; Busch, T.M.; Kousis, P.C.; Cheney, R.T.; Morgan, J. Choice of oxygen-conserving treatment regimen determines the inflammatory response and outcome of photodynamic therapy of tumors. Cancer Res. 2004, 64, 2120–2126. [Google Scholar] [CrossRef] [PubMed] [Green Version]
- Busch, T.M. Local physiological changes during photodynamic therapy. Lasers Surg. Med. 2006, 38, 494–499. [Google Scholar] [CrossRef] [PubMed]
- Pogue, B.W.; Elliott, J.T.; Kanick, S.C.; Davis, S.C.; Samkoe, K.S.; Maytin, E.V.; Pereira, S.P.; Hasan, T. Revisiting photodynamic therapy dosimetry: Reductionist & surrogate approaches to facilitate clinical success. Phys. Med. Biol. 2016, 61, 57–89. [Google Scholar] [CrossRef] [Green Version]
- Fekrazad, R.; Asefi, S.; Khorsandi, K.; Nejatifard, M. Photo biostimulatory effect of low dose photodynamic therapy on human mesenchymal stem cells. Photodiagnosis Photodyn. Ther. 2020, 31, 101886. [Google Scholar] [CrossRef]
- Zancanela, D.C.; Primo, F.L.; Rosa, A.L.; Ciancaglini, P.; Tedesco, A.C. The effect of photosensitizer drugs and light stimulation on osteoblast growth. Photomed. Laser Surg. 2011, 29, 699–705. [Google Scholar] [CrossRef]
- Algorri, J.F.; Ochoa, M.; Roldán-Varona, P.; Rodríguez-Cobo, L.; López-Higuera, J.M. Light technology for efficient and effective photodynamic therapy: A critical review. Cancers 2021, 13, 3484. [Google Scholar] [CrossRef]
- Arentz, J.; von der Heide, H.J. Evaluation of methylene blue based photodynamic inactivation (PDI) against intracellular B-CoV and SARS-CoV2 viruses under different light sources in vitro as a basis for new local treatment strategies in the early phase of a Covid19 infection. Photodiagnosis Photodyn. Ther. 2022, 37, 102642. [Google Scholar] [CrossRef]
- Young, N.C.; Maximiano, V.; Arany, P.R. Thermodynamic basis for comparative photobiomodulation dosing with multiple wavelengths to direct odontoblast differentiation. J. Biophotonics 2022, 15, e202100398. [Google Scholar] [CrossRef] [PubMed]
- Cronshaw, M.; Bordin-Aykroyd, S.R.; Lynch, E. Pain, Inflammation and Infection: A Daily Challenge in Every Clinical Practice; Role for Lasers? EC Dent. Sci. 2019, 18, 1352–1353. [Google Scholar]
- Kalhori, K.A.M.; Vahdatinia, F.; Jamalpour, M.R.; Vescovi, P.; Fornaini, C.; Merigo, E.; Fekrazad, R. Photobiomodulation in Oral Medicine. Photobiomodulation Photomed. Laser Surg. 2019, 37, 837–861. [Google Scholar] [CrossRef]
- Donato, H.A.R.; Pratavieira, S.; Grecco, C.; Brugnera-Júnior, A.; Bagnato, V.S.; Kurachi, C. Clinical Comparison of Two Photosensitizers for Oral Cavity Decontamination. Photomed. Laser Surg. 2017, 35, 105–110. [Google Scholar] [CrossRef] [PubMed] [Green Version]
- Collins, J.R.; Veras, K.; Hernández, M.; Hou, W.; Hong, H.; Romanos, G.E. Anti-inflammatory effect of salt water and chlorhexidine 0.12% mouthrinse after periodontal surgery: A randomized prospective clinical study. Clin. Oral Investig. 2021, 25, 4349–4357. [Google Scholar] [CrossRef] [PubMed]
- Govaerts, D.; Piccart, F.; Ockerman, A.; Coropciuc, R.; Politis, C.; Jacobs, R. Adjuvant therapies for MRONJ: A systematic review. Bone 2020, 141, 115676. [Google Scholar] [CrossRef]
- Sharifi, R.; Fekrazad, R.; Taheri, M.M.; Kasaeian, A.; Babaei, A. Effect of photobiomodulation on recovery from neurosensory disturbances after sagittal split ramus osteotomy: A triple-blind randomised controlled trial. Br. J. Oral Maxillofac. Surg. 2020, 58, 535–541. [Google Scholar] [CrossRef] [PubMed]
- Estrin, N.E.; Romanos, G.E.; Tatch, W.; Pikos, M.; Miron, R.J. Biological Characterization, Properties, and Clinical Use of a Novel Homeopathic Antiseptic Oral Recovery Kit: A Narrative Review. Oral Health Prev. Dent. 2022, 20, 485–499. [Google Scholar] [CrossRef] [PubMed]
- Del Vecchio, A.; Tenore, G.; Pergolini, D.; Rocchetti, F.; Palaia, G.; Romeo, U. The Role of the Laser Photobiomodulation (PBM) in the Management of Patients at Risk or Affected by MRONJ. Oral 2022, 2, 7–15. [Google Scholar] [CrossRef]
- Mylona, V.; Anagnostaki, E.; Chiniforush, N.; Barikani, H.; Lynch, E.; Grootveld, M. Photobiomodulation effects on periodontal ligament stem cells: A systematic review of in-vitro studies. Curr. Stem Cell Res. Ther. 2022, 17, 1–15. [Google Scholar] [CrossRef]
- Butera, A.; Pascadopoli, M.; Pellegrini, M.; Gallo, S.; Zampetti, P.; Scribante, A. Oral Microbiota in Patients with Peri-Implant Disease: A Narrative Review. Appl. Sci. 2022, 12, 3250. [Google Scholar] [CrossRef]
- Vale, G.C.; Mayer, M.P.A. Effect of probiotic Lactobacillus rhamnosus by-products on gingival epithelial cells challenged with Porphyromonas gingivalis. Arch. Oral Biol. 2021, 128, 105174. [Google Scholar] [CrossRef]
- Butera, A.; Pascadopoli, M.; Pellegrini, M.; Gallo, S.; Zampetti, P.; Cuggia, G.; Scribante, A. Domiciliary Use of Chlorhexidine vs. Postbiotic Gels in Patients with Peri-Implant Mucositis: A Split-Mouth Randomized Clinical Trial. Appl. Sci. 2022, 12, 2800. [Google Scholar] [CrossRef]
- Aziz, H.A. Comparison between field research and Controlled Laboratory Research. Arch. Clin. Biomed. Res. 2017, 1, 101–104. [Google Scholar] [CrossRef] [Green Version]

| Photosensitizers | Brand Name/Manufacturer | Concentration (mg/mL) | Laser Wavelength (nm) | Power Output (mW) | Tip Diameter (mm) |
|---|---|---|---|---|---|
| Curcumin | Ultracur+Pro®, Weber Μedical GmbH, Lauenförde, Germany | 5 | 445 | 150 | 6 |
| Methylene blue | Methylene Blue, Sigma-Aldrich Merck KGaA, Darmstadt, Germany | 0.05 | 660 | 150 | 6 |
| Methylene blue | Methylene Blue, Sigma-Aldrich Merck KGaA, Darmstadt, Germany | 0.10 | 660 | 150 | 6 |
| Methylene blue | Methylene Blue, Sigma-Aldrich Merck KGaA, Darmstadt, Germany | 10.00 | 660 | 150 | 6 |
| Methylene blue derivative | Photolase®, Europe Ltd., Hamburg, Germany | unknown | 660 | 150 | 6 |
| Methylene blue derivative | Photolase® Europe Ltd., Hamburg, Germany | unknown | 808 | 150 | 6 |
| Toluidine blue | BluLase PDT Gel, Schneider-Dental, Pilsach Germany | unknown | 635 | 150 | 6 |
| Toluidine blue | BluLase PDT Gel, Schneider-Dental, Pilsach Germany | unknown | 808 | 150 | 6 |
| Indocyanine green | Emundo®, A.R.C. laser GmbH, Nurnberg, Germany | 0.10 | 808 | 150 | 6 |
| Indocyanine green | Emundo®, A.R.C. laser GmbH, Nurnberg, Germany | 1.00 | 808 | 150 | 6 |
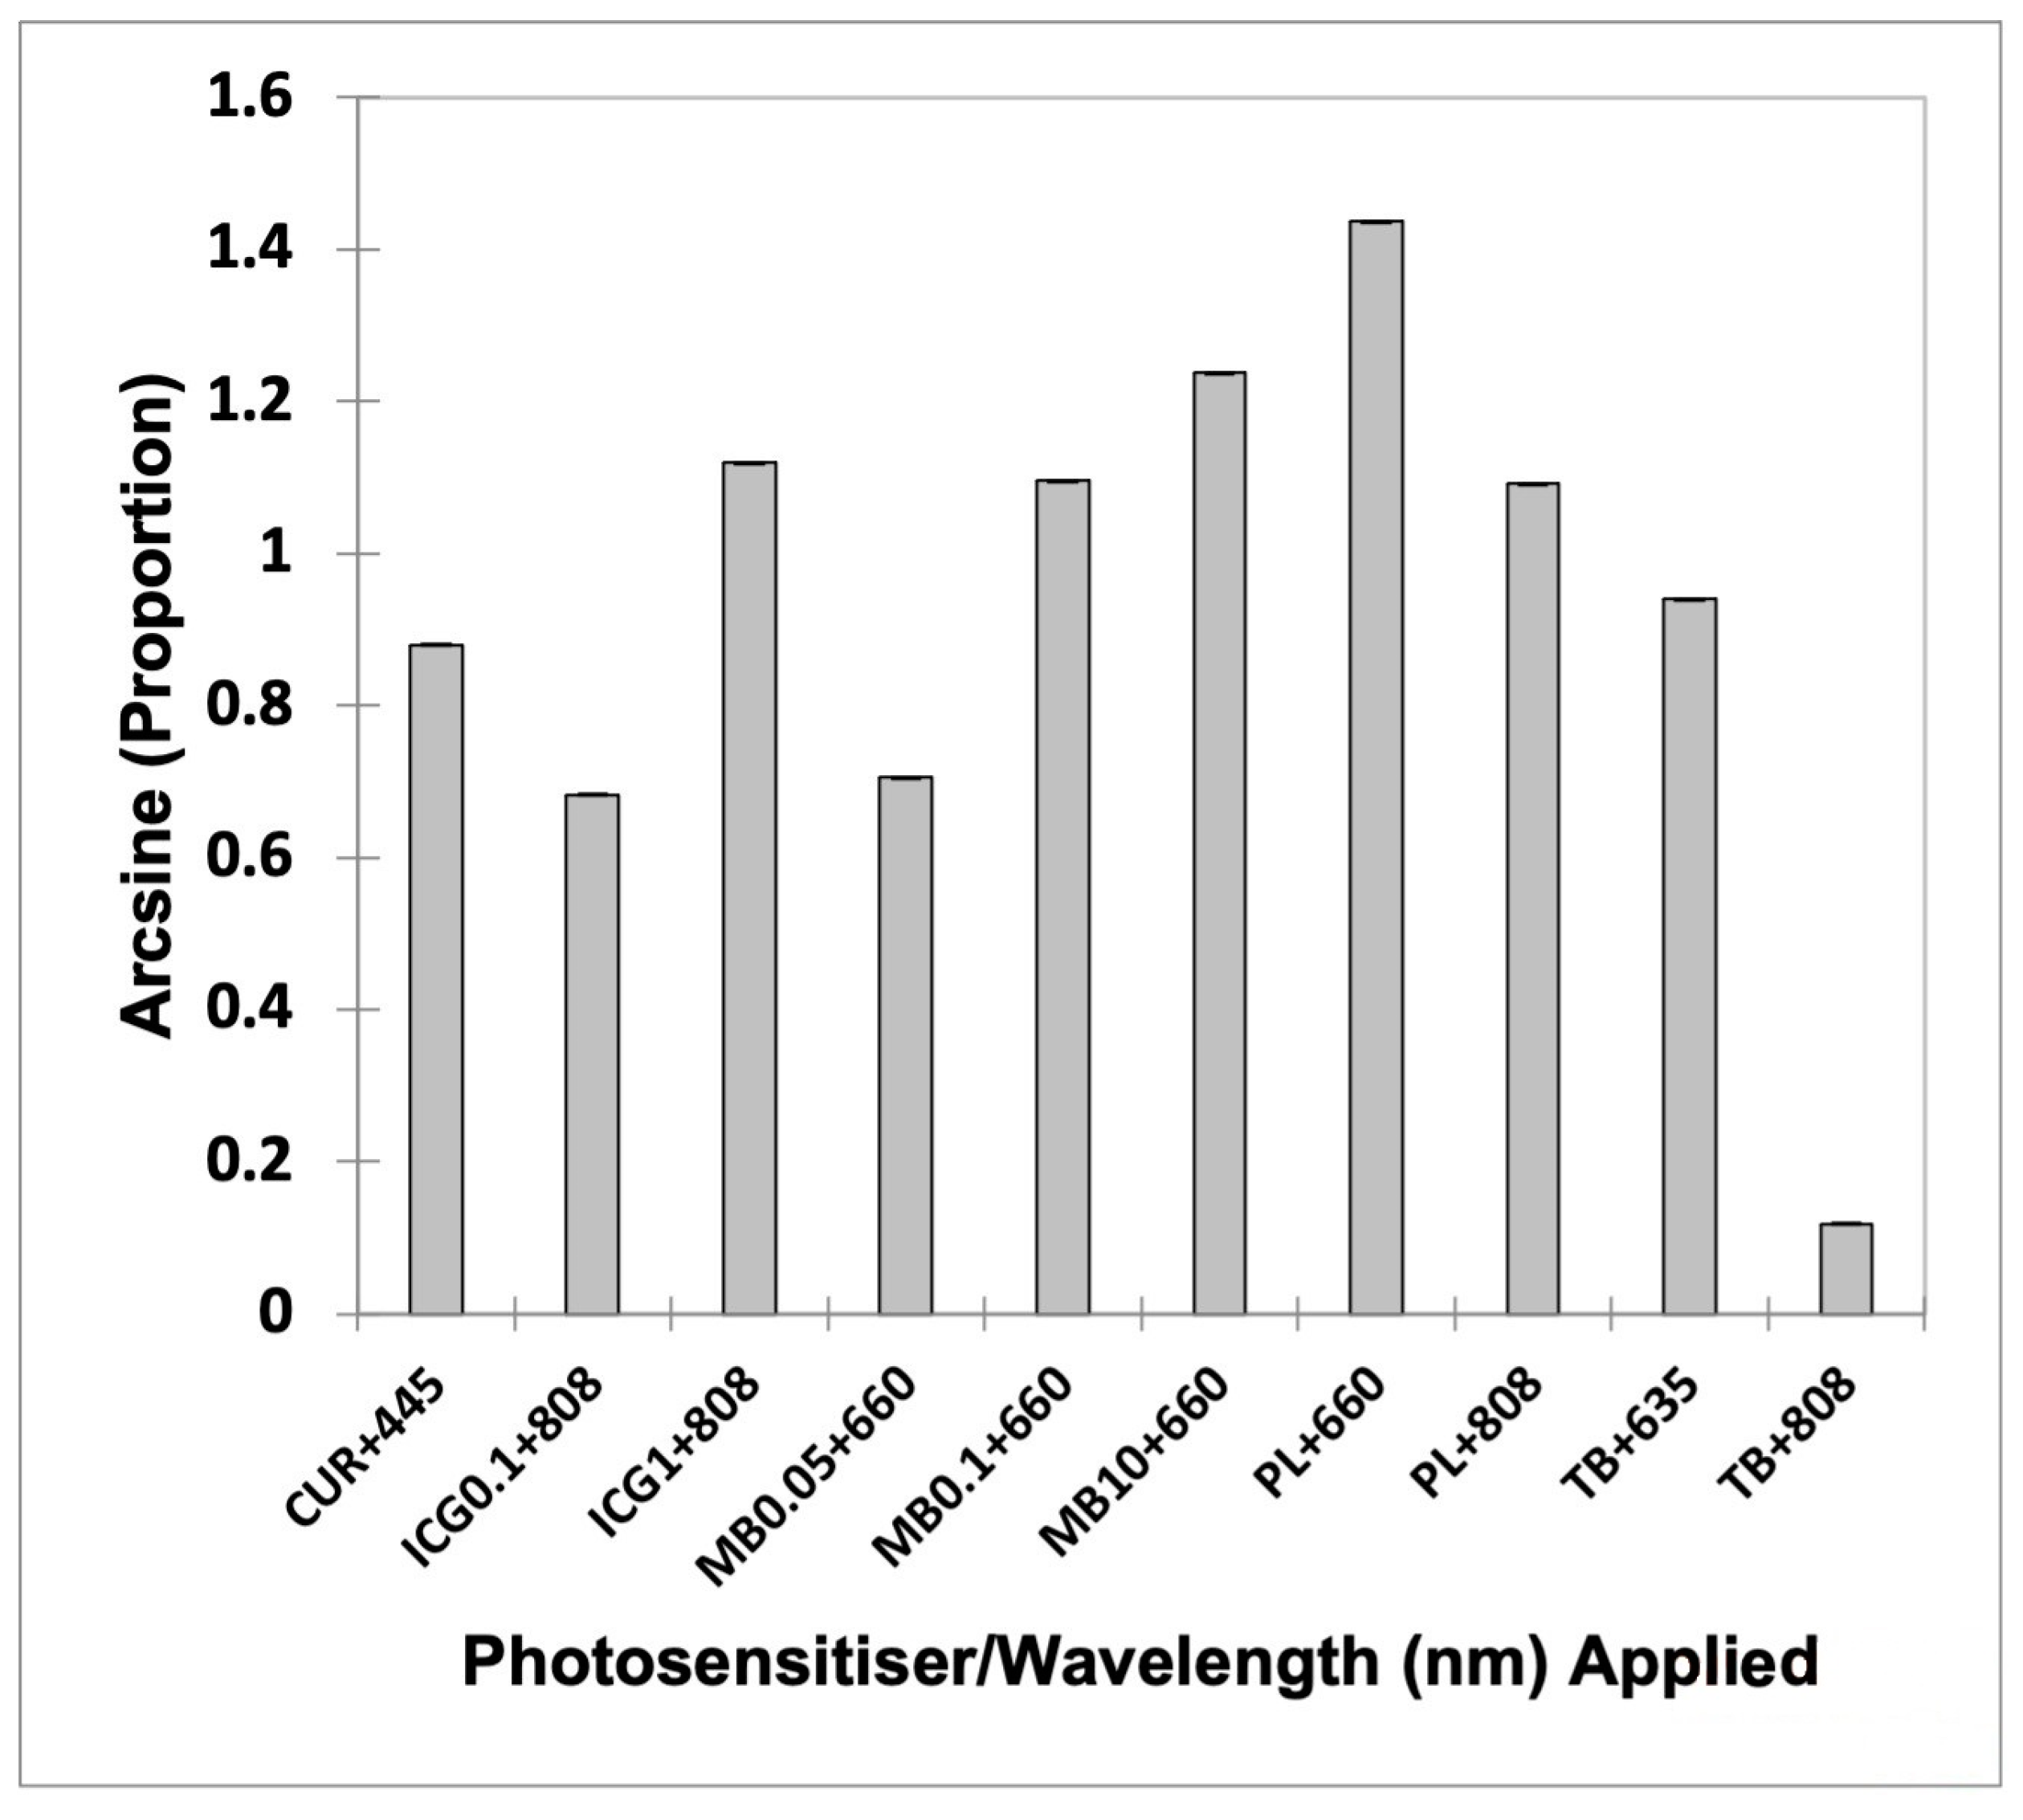
| Group | Mean | Lower Bound (95%) | Upper Bound (95%) |
|---|---|---|---|
| CUR + 445 | 0.880 | 0.879 | 0.881 |
| ICG0.1 + 808 | 0.683 | 0.682 | 0.683 |
| ICG1 + 808 | 1.119 | 1.118 | 1.120 |
| MB0.05 + 660 | 0.705 | 0.704 | 0.706 |
| MB0.1 + 660 | 1.096 | 1.095 | 1.096 |
| MB10 + 660 | 1.238 | 1.237 | 1.239 |
| PL + 660 | 1.437 | 1.436 | 1.438 |
| PL + 808 | 1.092 | 1.091 | 1.092 |
| TB + 635 | 0.940 | 0.939 | 0.941 |
| TB + 808 | 0.118 | 0.117 | 0.119 |
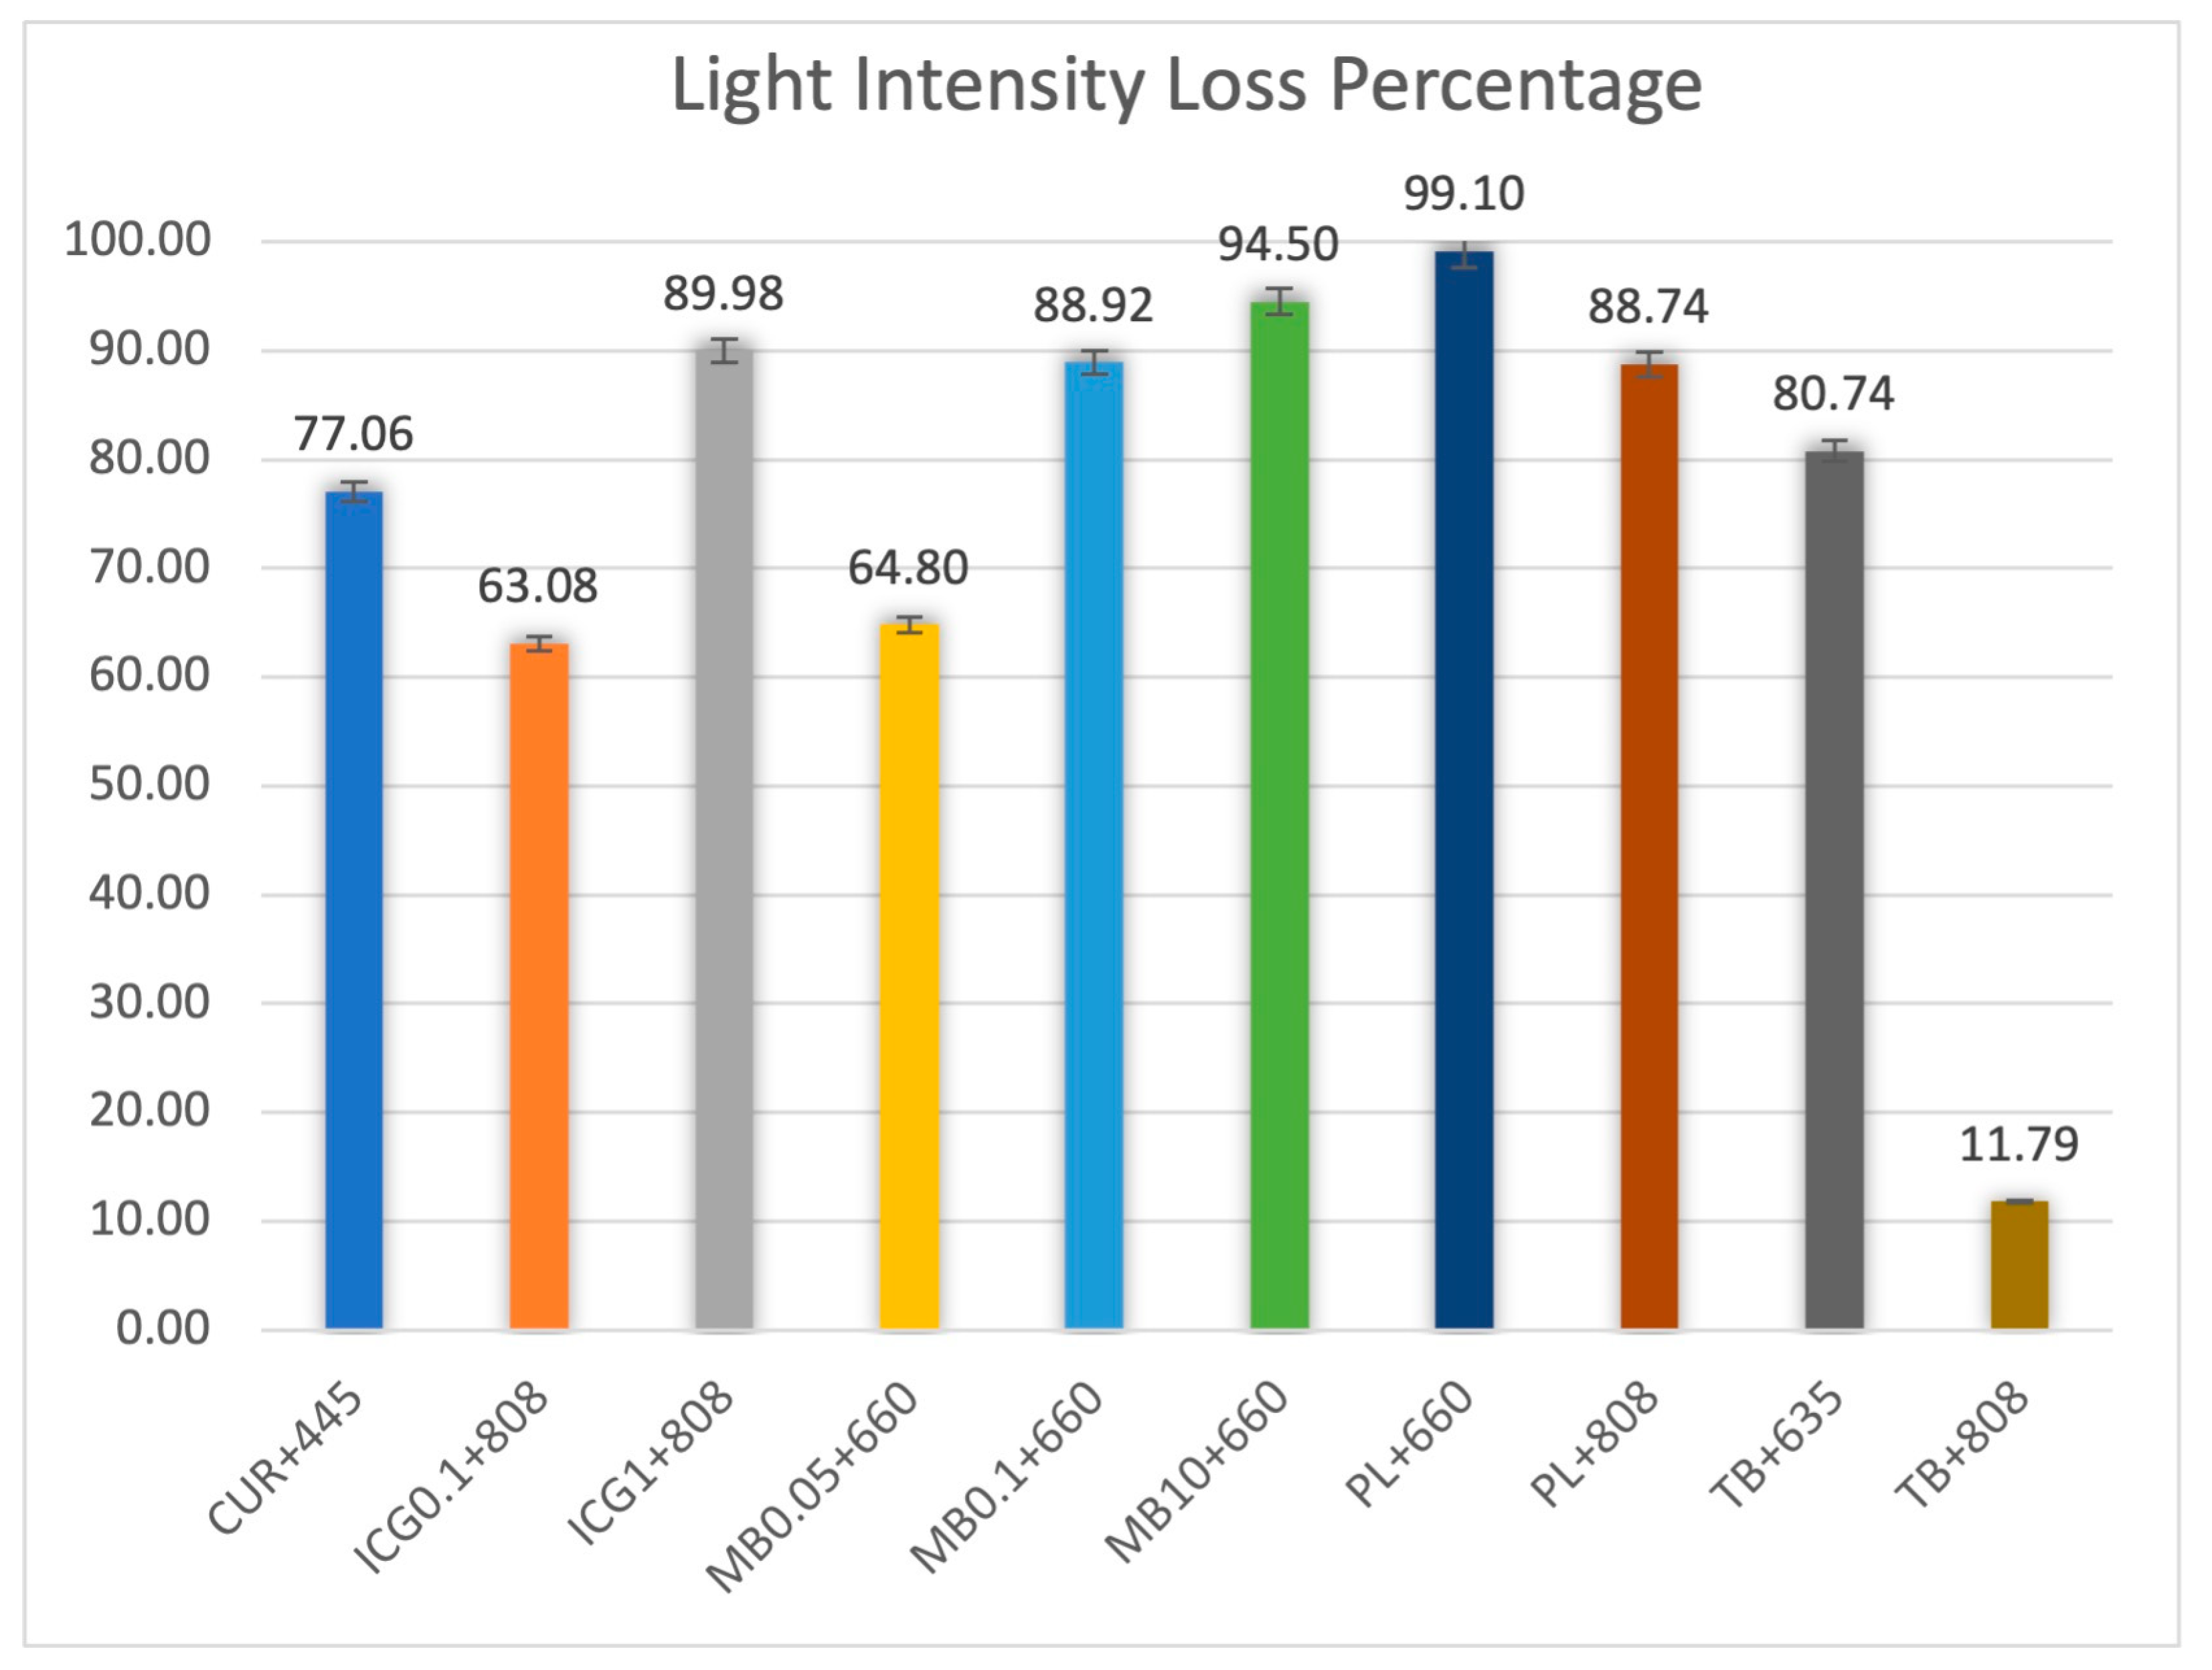
| Photosensitizers (Concentration in mg/mL) | Laser Wavelength (nm) | Intensity Loss (%) | Transmission (%) | Fluence Range Calculated (J/cm2) | Optimal Fluence Calculated (J/cm2) |
|---|---|---|---|---|---|
| Curcumin (5.00) | 445 | 77.06 | 22.94 | 8.72–43.59 | 21.80 |
| MB (0.05) | 660 | 64.80 | 35.20 | 5.68–28.41 | 14.20 |
| MB (0.10) | 660 | 88.92 | 11.08 | 18.05–90.25 | 45.12 |
| MB (10.00) | 660 | 94.50 | 5.50 | 36.36–181.81 | 90.90 |
| PL (unknown) | 660 | 99.10 | 0.90 | 222.22–1111.11 | 555.55 |
| TB (unknown) | 635 | 80.74 | 19.26 | 10.38–51.92 | 25.96 |
| ICG (0.10) | 808 | 63.08 | 36.92 | 5.42–27.08 | 13.54 |
| ICG (1.00) | 808 | 89.98 | 10.02 | 19.96–99.80 | 49.90 |
| PL (unknown) | 808 | 88.74 | 11.26 | 17.76–88.81 | 44.40 |
| TB (unknown) | 808 | 11.79 | 88.21 | 2.27–11.34 | 5.67 |
Disclaimer/Publisher’s Note: The statements, opinions and data contained in all publications are solely those of the individual author(s) and contributor(s) and not of MDPI and/or the editor(s). MDPI and/or the editor(s) disclaim responsibility for any injury to people or property resulting from any ideas, methods, instructions or products referred to in the content. |
© 2023 by the authors. Licensee MDPI, Basel, Switzerland. This article is an open access article distributed under the terms and conditions of the Creative Commons Attribution (CC BY) license (https://creativecommons.org/licenses/by/4.0/).
Share and Cite
Mylona, V.; Anagnostaki, E.; Petrakis, S.; Kosma, K.; Parker, S.; Cronshaw, M.; Papadogiannis, N.; Grootveld, M. Unleashing the Hidden Potential: The Dynamic Duo of Antimicrobial Photodynamic Therapy and Photobiomodulation: A Spectrophotometric Study. Appl. Sci. 2023, 13, 7647. https://doi.org/10.3390/app13137647
Mylona V, Anagnostaki E, Petrakis S, Kosma K, Parker S, Cronshaw M, Papadogiannis N, Grootveld M. Unleashing the Hidden Potential: The Dynamic Duo of Antimicrobial Photodynamic Therapy and Photobiomodulation: A Spectrophotometric Study. Applied Sciences. 2023; 13(13):7647. https://doi.org/10.3390/app13137647
Chicago/Turabian StyleMylona, Valina, Eugenia Anagnostaki, Stylianos Petrakis, Kyriaki Kosma, Steven Parker, Mark Cronshaw, Nektarios Papadogiannis, and Martin Grootveld. 2023. "Unleashing the Hidden Potential: The Dynamic Duo of Antimicrobial Photodynamic Therapy and Photobiomodulation: A Spectrophotometric Study" Applied Sciences 13, no. 13: 7647. https://doi.org/10.3390/app13137647
APA StyleMylona, V., Anagnostaki, E., Petrakis, S., Kosma, K., Parker, S., Cronshaw, M., Papadogiannis, N., & Grootveld, M. (2023). Unleashing the Hidden Potential: The Dynamic Duo of Antimicrobial Photodynamic Therapy and Photobiomodulation: A Spectrophotometric Study. Applied Sciences, 13(13), 7647. https://doi.org/10.3390/app13137647