Article

Response Surface Methodology as a Tool for Optimization of Extraction Process of Bioactive Compounds from Spent Coffee Grounds

by
Rita Brzezińska
*,
Agata Górska
*,
Magdalena Wirkowska-Wojdyła
and
Iga Piasecka
Department of Chemistry, Institute of Food Sciences, Warsaw University of Life Sciences, Nowoursynowska St. 159c, 02-787 Warsaw, Poland
*
Authors to whom correspondence should be addressed.
Appl. Sci. 2023, 13(13), 7634; https://doi.org/10.3390/app13137634
Submission received: 25 May 2023 / Revised: 21 June 2023 / Accepted: 26 June 2023 / Published: 28 June 2023

Abstract

:

Featured Application

The coffee processing industry is nowadays confronted with urgent challenges associated with the implementation of profitable and environmentally safe technological solutions for managing plant waste matter. Therefore, this sector of the food industry is cooperating with scientific communities to explore the possibility of using coffee by-products, especially spent coffee grounds, which can be considered as a valuable natural alternative to plant material with plentiful quantities of various components with antioxidant activity. However, additional investigations are needed to evaluate the potential for using spent coffee grounds in different forms as an ingredient of newly designed food products with functional properties or as a component of biodegradable packaging materials used in the agri-food processing system. These applications are in accordance with EU policies regarding the circular economy and sustainability of the food industry.

Abstract

The main goal of this research was to model and optimize the extraction process of bioactive compounds from spent coffee grounds (SCG). This study utilized response surface methodology (RSM) to determine the significance of the effects of independently tested extraction process conditions and their interactions. The quality of the SCG extracts was evaluated by performing the following determinations: total polyphenols content (TPC), ABTS and FRAP assays, browning index (BI), and caffeine and chlorogenic acids contents by high-performance liquid chromatography. The resultant optimal extraction conditions, which maximized recovery of antioxidant bioactive compounds, were 65% hydroethanolic solution (v/v) in a solvent–matrix ratio of 51 mL/g CS, followed by ultrasound-assisted extraction carried out for 30 min at 60 °C. The SCG extract obtained by this extraction variant had values for TPC, ABTS, FRAP and BI of approximately 38 mg GAE (gallic acid equivalent) per g d.m. SCG, 73 mg Trolox/g d.m. SCG, 81 µmol Fe (II)/g d.m. SCG, and 0.22, respectively. The sample was also characterized by a high content of caffeine (5 mg/g d.m. SCG) and chlorogenic acids (8 mg/g d.m. SCG). Based on the obtained results, SCG may be recognized as a coffee by-product that has abundant components with antioxidant activity and broad possible applications in agri-food processing fields.

Graphical Abstract

1. Introduction

Coffee is of the world’s most popular beverages and functional food commodities [1,2]. Spent coffee grounds (SCG) are a solid waste generated during the brewing of ground coffee beans and industrial processes such as instant coffee production [3]. SCG generation is estimated at around 650 kg of per ton of green coffee, and around 2 kg of wet SCG per kg of soluble coffee [4]. Considering the constant increase in global coffee consumption [5] and annual global coffee production reaching around 10 million tonnes [6], substantial amounts of waste SCG (around six million tonnes) are generated annually around the world [7]. Such high amounts of SCG waste may pose a great hazard to the environment if disposed of incorrectly [8].
The growing amounts of wastes generated in food processing and pollution of the environment led to the creation of the circular economy concept (CEC) [9]. CEC proposes a closed-loop of material flows and focuses on several paths for extending agro-industrial product life cycles and recycling plant waste materials, thus minimizing the environmental impact [10].
SCG waste is abundant in many valuable compounds, including phenolics, alkaloids (e.g., caffeine) and melanoidins, which are only partially extracted from crushed coffee beans during the brewing process [11]. These compounds are thought to be valuable due to a variety of bioactive effects, mainly antioxidant properties, and have substantial health benefits. Additionally, these compounds are valued ingredients in the functional food sector for enhancing the organoleptic properties of many plant-based foods or extending shelf-life when used as natural preservatives [12,13].
Many studies in recent years have concentrated on the extraction of bioactive compounds from spent coffee grounds, and the isolation of antioxidant components with biological activity from coffee by-products constantly attracts attention in scientific communities around the world [14,15,16,17,18,19]. Extractions can be performed by many varied methods. These techniques are divided into conventional (e.g., liquid–liquid, solid–liquid extraction) and non-conventional extraction techniques [20,21]. Traditional solid–liquid extraction techniques utilize a solid matrix and the extracting power of various solvents (pure solvents, mixtures, aqueous solutions), and they remain a commonly employed method for recovery of antioxidant compounds in the food industry. The major difficulties of conventional methods are the long extraction times, requirements for costly high-purity solvents, evaporation of the large amounts of extractant, low extraction selectivity, and thermal degradation of thermolabile compounds. To overcome these limitations of conventional extraction techniques, certain innovative non-conventional extraction techniques, such as ultrasound-assisted extraction, have been developed. Ultrasound-assisted extraction is based on a special type of soundwave which passes through the solution and generates cavitation [22,23]. The final yield of the extraction process is dependent on a number of factors, such as the solvent to matrix ratio, organic solvent concentration, length of the extraction process, procedure temperature and many more [24]. Conventionally, the effectiveness of the process can be optimized by conducting numerous experiments, which ultimately requires more time and financial costs [25]. To overcome these constraints, multivariate statistical optimization techniques such as factorial design or response surface methodology were introduced [26]. These techniques allow researchers to determine the optimal levels of process variables that maximize the effect levels and minimize the number of experimental runs needed [27].
For these reasons, the main objective of this study was to optimize the SCG extraction process for maximization of antioxidant activity and bioactive compound recovery by means of response surface methodology. Our research demonstrates a novel approach to the optimization of the extraction process of bioactive compounds from spent coffee grounds by varying a significant number of parameters using a two-stage experiment, whereas traditionally, most investigations exploit only one step of the response surface methodology. In the first stage of the extraction optimization, the significance of the factors influencing the isolation of bioactive components from spent coffee grounds was assessed, and then statistically non-significant independent process variables were excluded by utilizing a randomized half-fraction factorial design. The initial stage of the extraction optimization evaluated the impact of different types of solvents and process parameters to obtain extracts with high antioxidant activity due to their significant content of phenolic compounds. Based on the optimal extraction conditions selected in the first stage of the extraction optimization, a central composite design was used for further development of the ultrasound-assisted extraction to maximize the content of bioactive compounds isolated from spent coffee grounds, as well as the antioxidant activity.

2. Materials and Analytical Methods

2.1. Materials

A dried spent coffee grounds (SCG) blend was utilized as the research material. The SCG blend was prepared by combining the spent coffee grounds generated after coffee beverage preparation in local commercial establishments serving coffee. The SCG blend sample collection strategy was based on the sampling scheme for unpacked batches reported in the PN-ISO 3534-2:2010 standard [28]. In brief, basic SCG samples were collected six times every 3 days from local cafeterias to obtain general SCG blend samples. Every daily SCG batch was dried at 103 °C until a constant weight was reached. The SCG moisture content was determined in accordance with the analytical procedure described in the PN-ISO 11294:2002 standard [29]. Subsequently, the SCG blends were combined to produce a representative laboratory SCG blend sample. The laboratory SCG blend was kept in closed containers in the dark at room temperature until further analysis.

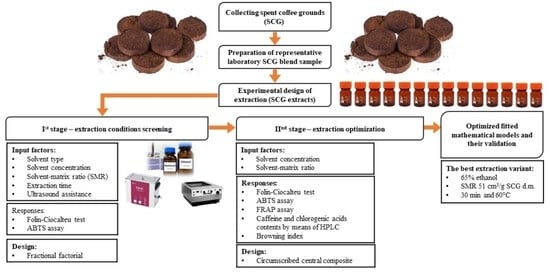
2.2. Preparation of SCG Extracts

In all of the verified variants of the extraction procedures, the preparation of SCG extracts was performed in accordance with the experimental extraction optimization design scheme. Briefly, the appropriate measured volume of solvent was added to one gram of dried sample of SCG blend in a Schott bottle. The extraction process was conducted at 60 °C for the desired time (Table 1). A laboratory shaker Elpin Plus type 357 (Lubawa, Poland) together with a water bath or laboratory Emmi-D60 ultrasonic heater bath (Salach, Germany) was used. After extraction, the sample was centrifuged (2500× g, 20 min, 4 °C). The collected supernatant was filtered through filter paper (Munktell, grade 389). The SCG extracts were kept at 2–8 °C in the dark until further analysis. The volume of the SCG extract obtained after each extraction variant was measured and used for calculations.

2.3. Statistical Approach in the Experimental Design of Extraction Optimization

Optimization of the extraction process was performed as a two-step experiment. In the first step, the effects of different conditions on the extraction process were assessed. The influence of organic solvent concentration (% organic solvent in water solution (v/v)), extraction time, solvent–matrix ratio (SMR), ultrasound assistance, and solvent type on antioxidant activity and total phenolics content (TPC) was evaluated using a randomized half-fraction factorial design (25-1) with four central points. The statistical model included aliases defined as follows: organic solvent concentration (A), extraction time (B), SMR (C), ultrasound assistance (D), and solvent type (E). The extraction factors and their levels used in the experiment are presented in Table 1. The quality assessment of the model was based on the coefficient of determination (R2). Central points were used to evaluate the curvature of the model-testing adequacy of the first-order model.
According to the most desirable parameters found in the first stage, the second stage of the experiment was constructed to optimize the extraction process further. The influence of organic solvent concentration and SMR on antioxidant activity measured by means of ABTS and FRAP assays, TPC, caffeine and chlorogenic acids content, and browning index (BI) was estimated with the use of a randomized 2-factor central composite design. Table 2 summarizes values of the parameters included in the second stage of the experiment.
All of the extraction runs and analyses were performed in triplicate, and the results are reported as means ± standard deviation. The experimental models were simplified by the reduction of statistically non-significant terms. Statistical analyses were performed using Minitab 21 software. The statistical significance of the operational extraction process variables was determined at the significance level of α = 0.05. The predictability of the developed models was verified to ensure model adequacy for approximation to the real values by means of statistical parameters, including different types of R2 (the coefficient of determination), the model p-value, and the lack-of-fit test.

2.4. Analytical Methods

2.4.1. Total Polyphenols Content (TPC) Determination

The determination of TPC in the SCG extracts was performed by colorimetric measurements with the Folin–Ciocalteu reagent, with modifications [30]. A 50 µL sample of the filtered SCG extract was diluted to 3.2 mL with distilled water and vortexed thoroughly. After that, 200 µL of Folin–Ciocalteu reagent (Chempur (Poland)) and 600 µL 20% (w/v) sodium carbonate solution were added to the SCG extract sample, and the obtained solution was mixed again. The solution was then placed in darkness and maintained at room temperature for 2 h. The absorbance of the examined SCG solutions was measured at 765 nm using a Shimadzu UV-1280 spectrophotometer (Kyoto, Japan). The gallic acid standard solutions were used to plot an external calibration curve, and the TPC results were expressed as mg of gallic acid equivalent per gram of spent coffee grounds dry matter (mg GAE/g SCG d.m.).

2.4.2. Antioxidant Activity Analysis by ABTS Assay

The ABTS assay was performed according to the analytical method presented by Re et al. [31] with slight modifications. Initially, the ABTS working solution was prepared by mixing 2.4 mM of potassium persulfate with 7.5 mM of ABTS. Subsequently, these reagents were allowed to react with each other in the dark at room temperature for 12 h. PBS buffer solution of pH 7.4 was used to dilute the ABTS working solution in order to reach its absorbance at the level of 0.7 ± 0.02 at 734 nm. In the next step, the reaction between 40 µL of SCG extract and 4 mL of the resulting ABTS solution was conducted for 6 min in darkness. After the desired duration time of the reaction, the absorbance of the tested solution was registered at 734 nm. The Trolox in PBS buffer standard solutions were used for calibration. The ABTS assay results are presented as mg of Trolox per gram of spent coffee grounds dry matter (mg Trolox/g SCG d.m.).

2.4.3. Antioxidant Activity Analysis by FRAP Assay

The FRAP assay was performed based on the slightly modified procedure reported by Benzie and Strain [32]. The working solution of FRAP reagent was prepared by mixing 10 mM TPTZ (2,4,6-tris (1-pyridyl)-5-triazine) solution in 40 mM HCl with a 20 mM FeCl3 solution and 0.3 M acetate buffer (pH 3.6) in appropriate proportions 1:1:10 (v/v/v). The appropriately diluted SCG extract sample was mixed with the working solution of FRAP reagent. Subsequently, the incubation of the obtained mixture was conducted at 37 °C for 30 min. After incubation, the absorbance was measured at 593 nm using a Shimadzu UV-1280 spectrophotometer (Kyoto, Japan). Distilled water was used as a blank sample. The aqueous solutions of ferrous sulfate (FeSO4·7H2O) were used to plot the standard curve. The FRAP results were expressed as µmol of ferrous equivalent per gram of spent coffee grounds dry matter (µmol Fe(II)/g SCG d.m.).

2.4.4. High-Performance Liquid Chromatographic (HPLC) Analysis of Caffeine and Chlorogenic Acids

The determination of the caffeine and chlorogenic acids content in the SCG extracts was performed according to the analytical procedure reported by Głowacka et al. [33]. Chromatographic analysis was carried out using a HPLC apparatus with a Dionex (Germering, Germany) pump P580, a DG 1210 degasser, an automatic injector ASI-100, a spectrophotometric detector UVD 170S and a column oven. The analytes separation was performed using a Supelco Discovery C18 analytical column (4.6 mm i.d. × 250 mm, 5-µm particle size) at ambient temperature. As the mobile phase, 0.3% (v/v) aqueous acetic acid solution (eluent A) and methanol of HPLC purity grade (eluent B) were used. The solvent gradient was as follows: 0 min, 20% B; 15–24 min, 50% B; and 27–29 min, 20% B. The flow rate of the mobile phase was 0.8 mL/min. The peaks of tested analytes present in the SCG extracts were identified based on their retention time by comparison with those of the analyte standards. Caffeine and chlorogenic acids were detected at 276 nm and 325 nm, respectively. The external standard curves were plotted for caffeine and chlorogenic acid (3-CQA). Chromeleon v.6.11 software (Dionex, Germering, Germany) was used for the data acquisition and processing.

2.4.5. Spectrophotometric Measurements of Browning Index (BI)

The BI measurements of SCG extracts were based on the procedure described by Bravo et al. [34]. The SCG extract (50 µL) was thoroughly mixed with 2 mL of distilled water. The BI values were determined based on the absorbance of the sample registered at 420 nm using a Shimadzu UV-1280 spectrophotometer (Kyoto, Japan) against the blank control sample, which was prepared by the same method, but without the addition of the SCG extract.

3. Results and Discussion

3.1. Determination of the Significant Factors Affecting the Extraction Process

The optimization of the process of bioactive compound extraction from spent coffee grounds (SCG) was performed in two stages. In the primary stage, the influence of several extraction parameters, namely, organic solvent concentration, solvent to matrix ratio, extraction time, ultrasound assistance and solvent type, on antioxidant activity and total phenolics content was evaluated. The results obtained in each of the runs are presented in Table 3. Ethanol, methanol and their hydroalcoholic mixtures were used at this stage. These solvents should ensure high levels of bioactive compound recovery from a plant-based matrix [35]. The highest level (above 100 mg Trolox/g SCG d.m.) of antioxidant activity was observed for the hydromethanolic extract in run 10. On the other hand, the hydroethanolic extract obtained in run 1 had the highest total phenolic content.
Pareto charts are a type of bar chart for monitoring the effects of the used operational extraction variables. This chart allows researchers to verify the significance of each tested extraction process variable and to monitor the influence on the used response analysis. Each bar represents the standardized effect of the examined term. The bars passing the vertical line are statistically significant at a 95% confidence level. It can be observed from Figure 1 that the extraction process of antioxidant bioactive compounds was affected by organic solvent concentration, SMR and the application of ultrasound. The remaining variables, namely, extraction time and solvent type, proved to be non-significant and were eliminated from the model.
Interestingly, for both ABTS and TPC, SMR proved to be the most crucial factor. Thus, finding the best solvent–matrix ratio is critical for optimization of the extraction process. The extracted compound recovery yield depends on the polarity of the solvent. During the extraction process, the solvent interacts with the matrix cells, causing the release of bioactive compounds. With the increase in the solvent to matrix ratio, the hydroxyl groups react with the phenolics and hydrophilic compounds, which negatively affects the extraction yield and leads to solvent wastage [36].
The extraction type has been shown to play a crucial role in the isolation process of most food components with bioactive potential. Techniques known as green technologies decrease the use of organic solvents and simultaneously reduce the risks associated with the toxicity of solvents and solvent residues in the extracts. According to the literature, an ultrasound-assisted extraction should be considered as a preferable method in the process of polyphenols extraction [37]. This technology is known for its simplicity and lower costs compared with other conventional extraction techniques [38]. The high-frequency waves promote cavitation, resulting in cell wall breakage and solvent diffusion [39]. Ultrasound-assisted extraction has advantages over other techniques, including the shorter residence time of sample particles in the solvent, the lower amounts of solvents needed, and higher yields [40].
The solvent type was found to be statistically non-significant considering ABTS and TPC levels in the SCG extracts. Methanol contains a smaller aliphatic fragment than ethanol, which should allow an easier solubilization of natural products with intermediate polarity. However, methanol is a highly toxic alcohol and must be completely removed from the extract. On the other hand, high molecular phenolics are preferably solubilized in ethanol, which is non-toxic and considered as GRAS (generally recognized as safe) [41]. For these reasons, ethanol and its hydroalcoholic mixtures were chosen as solvents in the second stage of the extraction optimization.
The adequacy and predictive efficiency of the model have to be verified with the adequate statistical expressions such as the coefficient of determination (R2), adjusted R2 and predicted R2 [26]. It is apparent from Table 4, that both the ABTS and TPC models present a very good fit to the data obtained, which was confirmed by the high values of R2 (>0.8). In addition, the adjusted R2 levels were in very close proximity to R2, which indicates that non-significant variables were not included in the final model. The predicted R2 for both the ABTS and TPC models were within 20% of the adjusted R2, indicating that the models are not overfitted.
Based on the acquired models, multiple response prediction for antioxidant activity (ABTS) and total phenolics content (TPC) was carried out. According to the analysis, the optimal conditions for maximizing the ABTS and TPC in SCG extracts were as follows: organic solvent concentration—60%, SMR—40 mL/g SCG d.m., and application of ultrasound assistance.

3.2. Optimization of the Extraction Process Parameters

For selection of the optimal extraction conditions that maximize the bioactive compound recovery yield and the level of the antioxidant activity, a central composite response surface design was used. As was evident in the first-stage results, the SMR and organic solvent concentration were considered as continuous factors with an extended range in comparison with the first step of the extraction optimization. The ultrasound-assisted extraction time was set to 30 min. Additionally, the range of analysis was extended to include the ABTS assay, FRAP assay, TPC determination, caffeine content, chlorogenic acids (3-CQA) content and browning index (BI). The results obtained in all of the runs are presented in Table 5.
Table 6 shows statistical information on the mathematical models obtained in the second stage of the extraction optimization. These models show changes in responses in individual analyses depending on the ethanol concentration and SMR. All the models were simplified by elimination of statistically non-significant terms. The lowest coefficient of determination (0.83) was found in the response model of TPC.
The obtained regression models were visualized by the response surface plots and their corresponding contour plots (Figure 2), which provide a better understanding in the behavior of the response at various levels of the extraction process variables.
The evaluation of the SCG extract antioxidant activity was performed using the ABTS and FRAP assays, which involve a mechanism reaction based on the transfer of a single electron, namely SET. These assays determine the capacity of the antioxidant compounds to transfer an electron and cause the reduction of free radicals or metallic ions, respectively [42].
In regard to the ABTS assay, the effects of all linear (A, B) and quadratic (A2, B2) terms were found to be statistically significant. According to the optimization results, maximum ABTS levels (74.96 mg Trolox/g SCG d.m.) should be obtained with 62% hydroethanolic solvent solution and 47 mL/g SCG d.m. Głowacka et al. [33] obtained similar results with the use of 60% hydromethanolic solvent solution and 40 mL/g SCG d.m. extracts. In contrast, the ABTS levels achieved were higher in comparison to those reported by Bravo et al. [43]. The discrepancies between the results outlined in the present research and those described in the related literature could be due to the use of different SCG matrices, types of solvent or types of extraction method.
Considering the FRAP assay, only the effects of linear terms (A, B) were observed to be statistically significant. Based on the optimization findings, the FRAP assay achieved the maximum value of 94.5 µmol Fe(II)/g SCG d.m. with 88% ethanol and 68 mL/g SCG d.m. It is apparent in the FRAP assay contour plot that the antioxidant activity of the SCG extracts was not negatively influenced either by the organic solvent concentration or by SMR. These findings match those observed in the work carried out by Mussatto et al. [44]. These researchers used the conventional solid–liquid extraction of antioxidant phenolic compounds from SCG using methanol as a solvent at different concentrations and determined the antioxidant activity in the range from 0.040 to 0.102 mM Fe(II)/g SCG. The results of their central composite design for extraction technique optimization are in accordance with the FRAP assay results presented in the current study. It is also interesting to note that in most cases, the antioxidant activity of SCG extracts measured by the FRAP assay reached higher values compared with the ABTS assay results. Likewise, Ballesteros et al. [45] observed discrepancies between the FRAP assay and DPPH assay results of antioxidant activity of coffee silverskin extracts. A possible explanation for these findings may be that the antioxidant activity procedures are based on different reaction mechanisms, antioxidants, target sample types and reaction conditions. In general, the FRAP assay is considered to be a SET-based non-radical method, but some authors have speculated that the FRAP assay has a low relationship with the radical quenching process and indicate the poor correlation with other commonly applied antioxidant activity measurements. For this reason, it is recommended to use it in combination with other antioxidant activity assays to discriminate the predominant mechanisms of various antioxidant phenolic compounds [42].
Regarding the TPC content of extracts, the effects of all the linear (A, B), as well as quadratic (A2, B2) terms were statistically significant. Maximization of TPC levels (36.38 mg GAE/g SCG d.m.) could be obtained with 65% ethanol aqueous solution and 56 mL/g SCG d.m. extracts. The total phenolics content levels in the tested SCG extracts were higher than those reported in other articles. The model proposed by Chatzimitakos et al. [19] suggested a maximum predicted value for TPC of 19.85 mg GAE/g SCG d.m. with the extraction parameters of 50% hydroethanolic solution, 35 mL/g SCG d.m., and extraction without the use of ultrasound assistance for 120 min at 65 °C, which is approx. 1.8 times lower than in this study. According to Bravo et al. [34], who used a Soxhlet extraction system for 6 min at 90 °C, the TPC in SCG ranged between 1.36 and 24.60 mg GAE/g SCG d.m. depending on the coffee species (Arabica, Robusta) and coffee preparation method (filter, espresso, plunger, mocha). As can be seen from these results, the differences in the amount of phenolic compounds could be attributed to the species and geographical origin of the coffee beans, the parameters applied during the roasting process and the extraction process conditions.
Concerning the caffeine content in the extracts, the effects of all examined parameters (A, B) and their interactions (AB), as well as both quadratic terms (A2, B2), were observed to be statistically significant. The maximum predicted value of caffeine content was 5.4 mg/g SCG d.m., which should be achieved with 54% hydroalcoholic solvent solution and 44.3 mL/g SCG d.m. The model introduced by Chatzimitakos et al. [19] showed the maximum predicted content of caffeine in SCG reached 6.14 mg/g SCG d.m. These results also accord with those of Andrade et al. [46], who evaluated the quality of SCG from beans of different geographical origins (1.94–3.91 mg caffeine/g SCG d.m.). The caffeine content in SCG presented in this study is comparable with the caffeine content in guarana seeds as described by Carciochi et al. [47]. Generally, the increase in ethanol concentration in the aqueous solvent solutions above a critical threshold results in significant decreases in the extraction yield of caffeine due to the hydrophilic nature of caffeine [48].
With regard to the chlorogenic acid content, the effects of all linear (A, B) and quadratic terms (A2, B2) were observed to be statistically significant. The optimization revealed that the maximum yield of chlorogenic acids (7.8 mg 3-CQA/g SCG d.m.) could be obtained with an ethanol solvent concentration of 64% and 46 mL/g SCG d.m. These results are in agreement with data collected by Panusa et al. [49], who proposed an environmentally safe procedure for isolation of bioactive compounds from spent coffee grounds.
The antioxidant activity of coffee and its by-products, especially spent coffee grounds, is known to be substantially affected by the roasting process, as well as coffee beverage preparation techniques [50]. The different phenolic compounds, including chlorogenic acids, originally identified in coffee beans are partially degraded during the roasting process [51]. Despite this, the antioxidant activity of coffee and its by-products can be maintained by the formation of new antioxidant constituents called melanoidins [52]. Melanoidins are known as water-soluble, nitrogen-containing macromolecular browning compounds, which are responsible for the brownish color and unique aroma properties of roasted coffee beans. It has also been reported in the literature that diverse biological activities, namely, antioxidant, antimicrobial, anticarcinogenic, anti-inflammatory, antihypertensive, and antiglycative activities, have been attributed to these compounds [53]. For these reasons, it is important to estimate the content of the final Maillard reaction chemical products. Therefore, the browning index is recognized to be a straightforward indicator of the content of browning compounds generated via the caramelisation and Maillard reactions [54]. Our findings demonstrated that for the browning index levels, both linear (A, B) terms and their interactions (A × B) were statistically important. The optimization results showed maximum BI levels of 0.29 that could be achieved with an 88% organic solvent concentration and 11 mL/g SCG d.m. Additionally, the current study found that increasing both the SMR and the concentration of the organic solvent promotes a greater level of absorbance, resulting in greater amounts of melanoidins in the SCG extracts. The previously cited scientific investigation observed that the brown color can be directly associated with the concentration of Maillard reaction products. Notwithstanding this fact, in our experiment, we have not calculated the melanoidin content but have just concentrated on the brown color of SCG extracts as an indirect estimator of the amount of the final Maillard reaction products, which contain chromophore groups with a typical maximum absorption at 420 nm in their macromolecular structure. It is encouraging to compare our browning index results, which reached an absorbance of approximately 0.2, with the results reported by Del Pino-García et al. [52], who investigated the influence of the roasting degree on the antioxidant activity and genoprotective effect of instant coffee samples. Furthermore, our browning index values are consistent with those of Bravo et al. [34] who evaluated the quality of spent coffee grounds obtained from the most commonly used coffee beverage preparation methods. It can, therefore, be assumed that the analyzed spent coffee grounds are an abundant plant source of melanoidins.
The optimal conditions for the extraction yield of antioxidant bioactive compounds were determined based on the combination of predictor values that jointly optimized the fitted response. The tested SCG extracts showed the best results in terms of tested analytical responses with an organic solvent concentration of 64.9%, and an SMR of 50.6 mL/g SCG d.m.
In order to check the predictability and adequacy of the developed models, validation tests were performed. SCG extracts were newly prepared under the aforementioned optimal conditions. The results predicted by the models and the actual values of the validation tests are shown in Table 7. It was observed that the deviations between the actual and approximated values were within ±5%. The low level of deviations proved the mathematical models’ viability in the examined range.

4. Conclusions

Spent coffee grounds (SCG) are recognized as the most common form of coffee waste throughout the globe and are generated in notable amounts after coffee beverage preparation in commercial coffee establishments. Therefore, this investigation addresses the tremendous problem of coffee waste accumulation if it is inappropriately discharged into the environment. Our research demonstrates that multivariate statistical methods, including response surface methodology, can be applied effectively for modelling and optimizing the process of extracting antioxidant bioactive compounds from spent coffee grounds. This mathematical and statistical approach allows researchers to select the most crucial factors influencing the extraction process. The approach can also monitor the significance of the effect of each extraction process variable and their interactions with the chromatographic and spectrophotometric techniques used to evaluate responses. Additionally, the implementation of surface response methodology can determine the SCG extracts with the maximum recovery of antioxidant bioactive compounds whilst minimizing the required experiments and financial support. Our findings provide not only deeper insights into the influence of extraction parameters on the physiochemical and antioxidant properties of spent coffee grounds extracts, but also confront the urgent problem of finding an efficient and environmentally safe method for utilizing spent coffee grounds. The extraction yield of antioxidant bioactive compounds from spent coffee grounds depends significantly on the concentration of the organic solvent and the ratio of the solvent volume to the SCG solid matrix. Based on the experimental data, the ultrasound-assisted extraction technique, with 65% hydroethanolic solution (v/v) and a solvent–matrix ratio of 51 mL/g SCG for 30 min at 60 °C, proved to be an effective alternative technique for the extraction of bioactive compounds with high antioxidant activity. The SCG ethanolic extract produced with the most favourable variant of the extraction process was characterised by a high concentration of total phenolics (approx. 38 mg GAE/g SCG d.m.), caffeine (approx. 5 mg/g SCG d.m.) and chlorogenic acids (approx. 8 mg/g SCG d.m.). It also had a high antioxidant activity according to both antioxidant assays (approx. 73 mg Trolox/g SCG d.m. and 81 µg Fe(II)/g SCG d.m.). In conclusion, the obtained results clearly demonstrate that spent coffee grounds sourced from commercial coffee establishments should be considered as a substantial coffee by-product abundant in antioxidant bioactive compounds with the potential for innovative applications in the pharmaceutical and agro-industrial food processing areas. In addition, we recommend further research to investigate the application of spent coffee grounds in different forms as an innovative ingredient of functional food products or biodegradable packaging materials utilized in the agri-food processing chain.

Author Contributions

Conceptualization, R.B. and A.G.; methodology, R.B., A.G. and M.W.-W.; software, R.B.; validation, R.B., A.G. and M.W.-W.; formal analysis, R.B.; investigation, R.B.; data curation, R.B.; writing—original draft preparation, R.B.; writing—review and editing, A.G., M.W.-W. and I.P.; visualization, R.B. and I.P.; supervision, A.G. and M.W.-W.; project administration, R.B. and A.G.; funding acquisition, A.G. All authors have read and agreed to the published version of the manuscript.

Funding

The study was financially supported by sources of the Ministry of Education and Science and funds from the Institute of Food Sciences of Warsaw University of Life Sciences (WULS) for scientific research.

Institutional Review Board Statement

Not applicable.

Informed Consent Statement

Not applicable.

Data Availability Statement

Not applicable.

Conflicts of Interest

The authors declare no conflict of interest.

References

  1. Karmee, S.K. A spent coffee grounds based biorefinery for the production of biofuels, biopolymers, antioxidants and biocomposites. Waste Manag. 2018, 72, 240–254. [Google Scholar] [CrossRef] [PubMed]
  2. McNutt, J. Spent coffee grounds: A review on current utilization. J. Ind. Eng. Chem. 2019, 71, 78–88. [Google Scholar] [CrossRef]
  3. Gosalvitr, P.; Cuellar-Franca, R.; Smith, R.; Azapagic, A. An environmental and economic sustainability assessment of coffee production in the UK. Chem. Eng. J. 2023, 465, 142793. [Google Scholar] [CrossRef]
  4. Murthy, P.S.; Naidu, M.M. Sustainable management of coffee industry by-products and value addition—A review. Resour. Conserv. Recycl. 2012, 66, 45–58. [Google Scholar] [CrossRef]
  5. International Coffee Organization (ICO). Statistics. Trade Statistics Tables. World Coffee Consumption. Available online: http://www.ico.org/prices/new-consumption-table.pdf (accessed on 10 May 2023).
  6. International Coffee Organization (ICO). Historical Data on the Global Coffee Trade. Available online: https://www.ico.org/new_historical.asp (accessed on 10 May 2023).
  7. Wu, C.-T.; Agrawal, D.C.; Huang, W.-Y.; Hsu, H.-C.; Yang, S.-J.; Huang, S.-L.; Lin, Y.-S. Functionality analysis of spent cofee ground extracts obtained by the hydrothermal method. J. Chem. 2019, 2019, 4671438. [Google Scholar] [CrossRef] [Green Version]
  8. Iriondo-DeHond, A.; Garcia, N.A.; Fernandez-Gomez, B.; Guisantes-Batan, E.; Escobar, F.V.; Blanch, G.P.; San Andres, M.I.; Sanchez-Fortun, S.; del Castillo, M.D. Validation of coffee by-products as novel food ingredients. Innov. Food Sci. Emerg. 2019, 51, 194–204. [Google Scholar] [CrossRef] [Green Version]
  9. Winans, K.; Kendall, A.; Deng, H. The history and current applications of the circular economy concept. Renew. Sust. Energ. Rev. 2017, 68, 825–833. [Google Scholar] [CrossRef]
  10. Kirchherr, J.; Reike, D.; Hekkert, M. Conceptualizing the circular economy: An analysis of 114 definitions. Resour. Conserv. Recyl. 2017, 127, 221–232. [Google Scholar] [CrossRef]
  11. Campos-Vega, R.; Loarca-Piña, G.; Vergara-Castañeda, H.A.; Oomah, B.D. Spent coffee grounds: A review on current research and future prospects. Trends Food Sci. Tech. 2015, 45, 24–36. [Google Scholar] [CrossRef]
  12. Mesías, M.; Delgado-Andrade, C. Melanoidins as a potential functional food ingredient. Curr. Opin. Food Sci. 2017, 14, 37–42. [Google Scholar] [CrossRef]
  13. Bevilacqua, E.; Cruzat, V.; Singh, I.; Rose’Meyer, R.B.; Panchal, S.K.; Brown, L. The Potential of Spent Coffee Grounds in Functional Food Development. Nutrients 2023, 15, 994. [Google Scholar] [CrossRef] [PubMed]
  14. Mofijur, M.; Kusumo, F.; Fattah, I.M.R.; Mahmudul, H.M.; Rasul, M.G.; Shamsuddin, A.H.; Mahlia, T.M.I. Resource Recovery from Waste Coffee Grounds Using Ultrasonic-Assisted Technology for Bioenergy Production. Energies 2020, 13, 1770. [Google Scholar] [CrossRef] [Green Version]
  15. Gigliobianco, M.R.; Campisi, B.; Vargas Peregrina, D.; Censi, R.; Khamitova, G.; Angeloni, S.; Caprioli, G.; Zannotti, M.; Ferraro, S.; Giovannetti, R.; et al. Optimization of the Extraction from Spent Coffee Grounds Using the Desirability Approach. Antioxidants 2020, 9, 370. [Google Scholar] [CrossRef] [PubMed]
  16. Lee, K.H.; Jang, Y.W.; Lee, J.; Kim, S.; Park, C.; Yoo, H.Y. Statistical Optimization of Alkali Pretreatment to Improve Sugars Recovery from Spent Coffee Grounds and Utilization in Lactic Acid Fermentation. Processes 2021, 9, 494. [Google Scholar] [CrossRef]
  17. Mitraka, G.-C.; Kontogiannopoulos, K.N.; Batsioula, M.; Banias, G.F.; Assimopoulou, A.N. Spent Coffee Grounds’ Valorization towards the Recovery of Caffeine and Chlorogenic Acid: A Response Surface Methodology Approach. Sustainability 2021, 13, 8818. [Google Scholar] [CrossRef]
  18. Coelho, J.P.; Robalo, M.P.; Boyadzhieva, S.; Stateva, R.P. Microwave-Assisted Extraction of Phenolic Compounds from Spent Coffee Grounds. Process Optimization Applying Design of Experiments. Molecules 2021, 26, 7320. [Google Scholar] [CrossRef]
  19. Chatzimitakos, T.; Athanasiadis, V.; Kotsou, K.; Palaiogiannis, D.; Bozinou, E.; Lalas, S.I. Optimized Isolation Procedure for the Extraction of Bioactive Compounds from Spent Coffee Grounds. Appl. Sci. 2023, 13, 2819. [Google Scholar] [CrossRef]
  20. Balzano, M.; Loizzo, M.R.; Tundis, R.; Lucci, P.; Nunez, O.; Fiorini, D.; Giardinieri, A.; Frega, N.G.; Pacetti, D. Spent espresso coffee grounds as a source of anti-proliferative and antioxidant compounds. Innov. Food Sci. Emerg. 2022, 59, 102254. [Google Scholar] [CrossRef]
  21. Piasecka, I.; Wiktor, A.; Górska, A. Alternative methods of bioactive compounds and oils extraction from berry fruit by-products—A review. Appl. Sci. 2022, 12, 1734. [Google Scholar] [CrossRef]
  22. Chmelová, D.; Škulcová, D.; Legerská, B.; Horník, M.; Ondrejovič, M. Ultrasonic-assisted extraction of polyphenols and antioxidants from Picea abies bark. J. Biotech. 2020, 314, 25–33. [Google Scholar] [CrossRef]
  23. Azmir, J.; Zaidul, I.S.M.; Rahman, M.M.; Sharif, K.M.; Mohamed, A.; Sahena, F.; Jahurul, M.H.A.; Ghafoor, K.; Norulaini, N.A.N.; Omar, A.K.M. Techniques for extraction of bioactive compounds from plant materials: A review. J. Food Eng. 2013, 117, 426–436. [Google Scholar] [CrossRef]
  24. Usman, I.; Hussain, M.; Imran, A.; Afzaal, M.; Saeed, F.; Javed, M.; Afzal, A.; Ashfaq, I.; Al Jbawi, E.; Saewan, S.A. Traditional and innovative approaches for the extraction of bioactive compounds. Int. J. Food Prop. 2022, 25, 1215–1233. [Google Scholar] [CrossRef]
  25. Latha, S.; Sivaranjani, G.; Dhanasekaran, D. Response surface methodology: A non-conventional statistical tool to maximize the throughput of Streptomyces species biomass and their bioactive metabolites. Crit. Rev. Microbiol. 2017, 43, 567–582. [Google Scholar] [CrossRef] [PubMed]
  26. Box, G.E.; Wilson, K.B. On the Experimental Attainment of Optimum Conditions. In Breakthroughs in Statistics; Kotz, S., Johnson, N.L., Eds.; Springer Series in Statistics; Springer: New York, NY, USA, 1992; pp. 270–310. [Google Scholar]
  27. Weremfo, A.; Abassah-Oppong, S.; Adulley, F.; Dabie, K.; Seidu-Larry, S. Response surface methodology as a tool to optimize the extraction of bioactive compounds from plant sources. J. Sci. Food Agric. 2023, 103, 26–36. [Google Scholar] [CrossRef] [PubMed]
  28. Polish Norm: PN-ISO 3534-2:2010; Statistics—Vocabulary and Symbols—Part 2: Applied Statistics. Polish Committee for Standardization: Warsaw, Poland, 2010.
  29. Polish Norm: PN-ISO 11294:2002; Roasted Ground Coffee—Determination of Moisture Content—Method by Determination of Loss in Mass at 103 Degrees C (Routine Method). Polish Committee for Standardization: Warsaw, Poland, 2002.
  30. Singleton, V.L.; Rossi, J.A. Colorimetry of total phenolics with phosphomolybdic-phosphotungstic acid reagents. Am. J. Enol. Viticult. 1965, 16, 144–158. [Google Scholar] [CrossRef]
  31. Re, R.; Pellegrini, N.; Proteggente, A.; Pannala, A.; Yang, M.; Rice-Evans, C. Antioxidant activity applying an improved ABTS radical cation decolorization assay. Free Radic. Biol. Med. 1999, 26, 1231–1237. [Google Scholar] [CrossRef]
  32. Benzie, I.F.; Strain, J.J. The ferric reducing ability of plasma (FRAP) as a measure of “antioxidant power”: The FRAP assay. Anal. Biochem. 1996, 239, 70–76. [Google Scholar] [CrossRef] [PubMed] [Green Version]
  33. Głowacka, R.; Górska, A.; Wirkowska-Wojdyła, M.; Wołosiak, R.; Majewska, E.; Derewiaka, D. The influence of brewing method on bioactive compounds residues in spent coffee grounds of different roasting degree and geographical origin. Int. J. Food Sci. Technol. 2019, 54, 3008–3014. [Google Scholar] [CrossRef]
  34. Bravo, J.; Juàniz, I.; Monente, C.; Caemmerer, B.; Kroh, L.W.; Paz De Peña, M.; Cid, C. Evaluation of spent coffee obtained from the most common coffeemakers as a source of hydrophilic bioactive compounds. J. Agric. Food Chem. 2012, 60, 12565–12573. [Google Scholar] [CrossRef]
  35. Brzezińska, R.; Wirkowska-Wojdyła, M.; Piasecka, I.; Górska, A. Application of Response Surface Methodology to Optimize the Extraction Process of Bioactive Compounds Obtained from Coffee Silverskin. Appl. Sci. 2023, 13, 5388. [Google Scholar] [CrossRef]
  36. Shewale, S.; Rathod, V.K. Extraction of total phenolic content from Azadirachta indica or (neem) leaves: Kinetics study. Prep. Biochem. Biotech. 2018, 48, 312–320. [Google Scholar] [CrossRef] [PubMed]
  37. Luo, X.; Cui, J.; Zhang, H.; Duan, Y.; Zhang, D.; Cai, M.; Chen, G. Ultrasound assisted extraction of polyphenolic compounds from red sorghum (Sorghum bicolor L.) bran and their biological activities and polyphenolic compositions. Ind. Crops Prod. 2018, 112, 296–304. [Google Scholar] [CrossRef]
  38. Dai, J.; Mumper, R.J. Plant phenolics: Extraction, analysis and their antioxidant and anticancer properties. Molecules 2010, 15, 7313–7352. [Google Scholar] [CrossRef]
  39. Cares, M.G.; Vargas, Y.; Gaete, L.; Sainz, J.; Alarcon, J. Ultrasonically assisted extraction of bioactive principles from Quillaja Saponaria Molina. Phys. Procedia 2010, 3, 169–178. [Google Scholar] [CrossRef] [Green Version]
  40. Oroian, M.; Ursachi, F.; Dranca, F. Ultrasound-assisted extraction of polyphenols from crude pollen. Antioxidants 2020, 9, 322. [Google Scholar] [CrossRef] [Green Version]
  41. Galanakis, C.M. Emerging technologies for the production of nutraceuticals from agricultural by-products: A viewpoint of opportunities and challenges. Food Bioprod. Process. 2013, 91, 575–579. [Google Scholar] [CrossRef]
  42. Munteanu, I.G.; Apetrei, C. Analytical Methods Used in Determining Antioxidant Activity: A Review. Int. J. Mol. Sci. 2021, 22, 3380. [Google Scholar] [CrossRef] [PubMed]
  43. Bravo, J.; Monente, C.; Juaniz, I.; Paz De Peña, M.; Cid, C. Influence of extraction process on antioxidant capacity of spent coffee. Food Res. Int. 2013, 50, 610–616. [Google Scholar] [CrossRef]
  44. Mussatto, S.I.; Ballesteros, L.F.; Martins, S.; Teixeira, J.A. Extraction of antioxidant phenolic compounds from spent coffee grounds. Sep. Purif. Technol. 2011, 83, 173–179. [Google Scholar] [CrossRef] [Green Version]
  45. Ballesteros, L.F.; Teixeira, J.A.; Mussatto, S.I. Selection of the solvent and extraction conditions for maximum recovery of antioxidant phenolic compounds from coffee silverskin. Food Bioprocess Tech. 2014, 7, 1322–1332. [Google Scholar] [CrossRef] [Green Version]
  46. Andrade, C.; Perestrelo, R.; Câmara, J.S. Bioactive Compounds and Antioxidant Activity from Spent Coffee Grounds as a Powerful Approach for Its Valorization. Molecules 2022, 27, 7504. [Google Scholar] [CrossRef] [PubMed]
  47. Carciochi, R.A.; Dieu, V.; Vauchel, P.; Pradal, D.; Dimitrov, K. Reduction of environmental impacts of caffeine extraction from guarana by using ultrasound assistance. Food Bioprod. Proc. 2021, 127, 266–275. [Google Scholar] [CrossRef]
  48. Tavagnacco, L.; Schnupf, U.; Mason, P.E.; Saboungi, M.-L.; Cesàro, A.; Brady, J.W. Molecular Dynamics Simulation Studies of Caffeine Aggregation in Aqueous Solution. J. Phys. Chem. B 2011, 115, 10957–10966. [Google Scholar] [CrossRef] [Green Version]
  49. Panusa, A.; Zuorro, A.; Lavecchia, R.; Marrosu, G.; Petrucci, R. Recovery of natural antioxidants from spent coffee grounds. J. Agric. Food Chem. 2013, 61, 4162–4168. [Google Scholar] [CrossRef]
  50. Esquivel, P.; Jimenez, V.M. Functional properties of coffee and coffee by-products. Food Res. Int. 2012, 46, 488–495. [Google Scholar] [CrossRef]
  51. Dawidowicz, A.L.; Typek, R. Transformation of chlorogenic acids during the coffee beans roasting process. Eur. Food Res. Technol. 2017, 243, 379–390. [Google Scholar] [CrossRef]
  52. Del Pino-García, R.; Gonzalez-SanJose, M.L.; Rivero-Perez, M.D.; Muniz, P. Influence of the degree of roasting on the antioxidant capacity and genoprotective effect of instant coffee: Contribution of the melanoidin fraction. J. Agric. Food Chem. 2012, 60, 10530–10539. [Google Scholar] [CrossRef]
  53. Moreira, A.S.; Nunes, F.M.; Domingues, M.R.; Coimbra, M.A. Coffee melanoidins: Structures, mechanisms of formation and potential health impacts. Food Funct. 2012, 3, 903–915. [Google Scholar] [CrossRef]
  54. Starowicz, M.; Ostaszyk, A.; Zieliński, H. The Relationship between the Browning Index, Total Phenolics, Color, and Antioxidant Activity of Polish-Originated Honey Samples. Foods 2021, 10, 967. [Google Scholar] [CrossRef]
Figure 1. Pareto charts for the effects of organic solvent concentration (A), SMR (C), ultrasound assistance (D) on the antioxidant activity (a) and extraction of total phenolic compounds (b) after non-significant terms elimination.
Applsci 13 07634 g001
Figure 2. The surface response plots and their matching contour plots showing the ABTS radical scavenging assay (a), FRAP assay (b), the total polyphenols content (TPC) assay (c), caffeine content (d), and chlorogenic acid 3−CQA content (e), the spectrophotometric determination of (BI) browning index (f).
Applsci 13 07634 g002aApplsci 13 07634 g002b
Table 1. Experimental design used in the first step of the extraction optimization. The process variables are presented as real and (coded) values.
RunOrganic Solvent
Concentration
Extraction
Time
SMRUltrasound
Assistance
Solvent
Type
ABCDE
160 (−)30 (−)40 (+)Yes (−)Ethanol (−)
260 (−)90 (+)10 (−)No (+)Methanol (+)
3100 (+)30 (−)10 (−)Yes (−)Ethanol (−)
4100 (+)90 (+)10 (−)No (+)Ethanol (−)
560 (−)30 (−)10 (−)Yes (−)Methanol (+)
680 (0)60 (0)25 (0)Yes (−)Ethanol (−)
7100 (+)30 (−)40 (+)Yes (−)Methanol (+)
8100 (+)90 (+)10 (−)Yes (−)Methanol (+)
9100 (+)90 (+)40 (+)Yes (−)Ethanol (−)
1060 (−)30 (−)40 (+)No (+)Methanol (+)
11100 (+)30 (−)40 (+)No (+)Ethanol (−)
1260 (−)90 (+)10 (−)Yes (−)Ethanol (−)
1380 (0)60 (0)25 (0)Yes (−)Methanol (+)
1460 (−)90 (+)40 (+)No (+)Ethanol (−)
1580 (0)60 (0)25 (0)No (+)Methanol (+)
16100 (+)90 (+)40 (+)No (+)Methanol (+)
1760 (−)30 (−)10 (−)No (+)Ethanol (−)
1880 (0)60 (0)25 (0)No (+)Ethanol (−)
1960 (−)90 (+)40 (+)Yes (−)Methanol (+)
20100 (+)30 (−)10 (−)No (+)Methanol (+)
Table 2. Experimental design used in the second step of the extraction optimization. The process variables are presented as real and (coded) values.
RunOrganic Solvent
Concentration
SMR
AB
180.00 (1)20.00 (−1)
260.00 (0)40.00 (0)
340.00 (−1)20.00 (−1)
460.00 (0)40.00 (0)
560.00 (0)40.00 (0)
660.00 (0)11.71 (−1.414)
760.00 (0)40.00 (0)
880.00 (1)60.00 (1)
960.00 (0)68.28 (1.414)
1040.00 (−1)60.00 (1)
1131.71 (−1.414)40.00 (0)
1288.28 (1.414)40.00 (0)
1360.00 (0)40.00 (0)
Table 3. Results of the verified RSM responses in the first stage of the extraction optimization experimental design and the ABTS and TPC assay values for analyzed variants of spent coffee grounds extracts.
RunSolvent
Concentration
Extraction
Time
SMRUltrasound
Assistance
Solvent
Type
ABTSTPC
ABCDE
160 (−)30 (−)40 (+)Yes (−)Ethanol (−)70.02 ± 4.8539.34 ± 2.69
260 (−)90 (+)10 (−)No (+)Methanol (+)47.80 ± 3.2117.28 ± 1.18
3100 (+)30 (−)10 (−)Yes (−)Ethanol (−)25.97 ± 1.8220.94 ± 1.63
4100 (+)90 (+)10 (−)No (+)Ethanol (−)35.71 ± 2.4513.54 ± 0.99
560 (−)30 (−)10 (−)Yes (−)Methanol (+)35.15 ± 2.5118.72 ± 1.27
680 (0)60 (0)25 (0)Yes (−)Ethanol (−)37.15 ± 2.4223.58 ± 1.52
7100 (+)30 (−)40 (+)Yes (−)Methanol (+)68.45 ± 4.7931.35 ± 2.18
8100 (+)90 (+)10 (−)Yes (−)Methanol (+)21.80 ± 1.4516.26 ± 1.18
9100 (+)90 (+)40 (+)Yes (−)Ethanol (−)62.37 ± 4.2830.13 ± 2.06
1060 (−)30 (−)40 (+)No (+)Methanol (+)101.99 ± 5.9528.03 ± 2.02
11100 (+)30 (−)40 (+)No (+)Ethanol (−)66.15 ± 4.5222.35 ± 1.74
1260 (−)90 (+)10 (−)Yes (−)Ethanol (−)34.01 ± 2.3825.10 ± 1.25
1380 (0)60 (0)25 (0)Yes (−)Methanol (+)55.83 ± 3.2327.71 ± 1.84
1460 (−)90 (+)40 (+)No (+)Ethanol (−)97.16 ± 6.5233.07 ± 2.09
1580 (0)60 (0)25 (0)No (+)Methanol (+)35.88 ± 2.4117.81 ± 1.17
16100 (+)90 (+)40 (+)No (+)Methanol (+)68.68 ± 4.6329.37 ± 1.91
1760 (−)30 (−)10 (−)No (+)Ethanol (−)41.70 ± 2.8215.35 ± 0.92
1880 (0)60 (0)25 (0)No (+)Ethanol (−)79.01 ± 5.5525.69 ± 1.80
1960 (−)90 (+)40 (+)Yes (−)Methanol (+)57.56 ± 3.6734.73 ± 2.25
20100 (+)30 (−)10 (−)No (+)Methanol (+)34.38 ± 2.4112.70 ± 0.99
Table 4. Summary of first-stage extraction optimization models. Coded units as follows: A—organic solvent concentration (%), C—SMR (mL/g SCG d.m.), and D—ultrasound assistance.
ABTSTPC
Regression equationABTS = 46.40 − 0.32 × A + 1.32 × C + 7.01 × DTPC = 21.60 − 0.11 × A + 0.45 × C − 2.63 × D
Model p-value7.1 × 10−61.5 × 10⁻⁷
R280.23%87.84%
R2 (adjusted)76.53%85.56%
R2 (predicted)72.04%81.44%
Fitted value
(A:60; C:40; D:Yes)
72.9435.75
Table 5. Results of the RSM responses used in the second stage of the extraction optimization experimental design. ABTS, FRAP and TPC assays, BI values and caffeine and chlorogenic acids (3-CQA) contents for tested variants of ethanolic spent coffee grounds extracts.
RunSolvent
Concentration
SMRABTSFRAPTPCCaffeine3-CQABI
AB
180.00 (1)20.00 (−1)43.74 ± 2.1974.74 ± 3.7424.07 ± 1.213.01 ± 0.162.99 ± 0.170.24 ± 0.01
260.00 (0)40.00 (0)70.85 ± 3.4678.02 ± 3.8738.15 ± 1.754.99 ± 0.196.99 ± 0.330.21 ± 0.01
340.00 (−1)20.00 (−1)37.87 ± 1.8855.80 ± 2.8118.90 ± 0.951.56 ± 0.122.01 ± 0.120.08 ± 0.01
460.00 (0)40.00 (0)75.06 ± 3.5271.30 ± 3.5234.95 ± 1.724.72 ± 0.217.42 ± 0.350.22 ± 0.02
560.00 (0)40.00 (0)71.54 ± 3.6867.64 ± 3.3733.21 ± 1.564.21 ± 0.227.52 ± 0.380.18 ± 0.01
660.00 (0)11.71 (−1.414)27.14 ± 2.0153.42 ± 2.6416.83 ± 0.830.86 ± 0.092.28 ± 0.110.17 ± 0.01
760.00 (0)40.00 (0)72.92 ± 3.6275.92 ± 3.7929.17 ± 1.444.35 ± 0.137.78 ± 0.410.19 ± 0.02
880.00 (1)60.00 (1)62.85 ± 3.1691.58 ± 4.5131.70 ± 1.585.73 ± 0.215.42 ± 0.240.22 ± 0.02
960.00 (0)68.28 (1.414)60.77 ± 3.1583.81 ± 4.0137.15 ± 1.842.52 ± 0.205.92 ± 0.260.21 ± 0.01
1040.00 (−1)60.00 (1)54.24 ± 2.7369.58 ± 3.5126.64 ± 1.334.21 ± 0.233.87 ± 0.230.17 ± 0.01
1131.71 (−1.414)40.00 (0)48.47 ± 2.6263.27 ± 3.1419.91 ± 1.033.94 ± 0.283.14 ± 0.170.15 ± 0.02
1288.28 (1.414)40.00 (0)53.19 ± 2.5774.78 ± 3.7628.14 ± 1.415.02 ± 0.215.64 ± 0.250.25 ± 0.03
1360.00 (0)40.00 (0)73.87 ± 3.5268.33 ± 3.3933.54 ± 1.724.11 ± 0.097.85 ± 0.390.20 ± 0.02
Table 6. Summary of the models of the second stage of the extraction optimization. Coded units as follows: A—organic solvent concentration (%), B—SMR (mL/g SCG d.m.).
Tested
RSM
Response
ModelSimplified Fitted EquationR2Model
p-Value
Lack-of-Fit
p-Value
ABTS
assay
Reduced
quadratic
−105.29 + 3.26 × A + 3.29 × B + 0.03 × A2 − 0.03 × B298.24%4.7 × 10−70.1386
FRAP
assay
Linear31.54 + 0.36 × A + 0.46 × B83.08%1.4 × 10−40.4908
TPC
assay
Reduced quadratic−43.6 + 1.62 × A + 0.97 × B − 0.01 × A2 − 0.01 × B289.08%6.5 × 10−40.7185
Caffeine
(HPLC)
Quadratic−10.27 + 0.34 × A + 0.29 × B − 0.003 × A2 − 0.003 × B2 − 0.001 × A × B95.69%1.2 × 10−40.1433
3-CQA
(HPLC)
Reduced
quadratic
−20.18 + 0.56 × A + 0.43 × B − 0.004 × A2 − 0.005 × B297.09%3.5 × 10−60.1907
BI
(Abs420)
Linear with
interactions
−0.13 + 0.005 × A + 0.005 × B − 6.9 × 10⁻⁵ × A × B87.57%2.0 × 10−40.3521
Table 7. Verification of the developed mathematical models of the used RSM responses: comparison of the approximated values predicted by the statistical approach based on fitted equations and the real values of the validation analyses.
Used RSM ResponseApproximated ValueReal ValueDeviation (%)
ABTS (mg Trolox/g SCG d.m.)74.4973.04−1.9%
FRAP (µmol Fe(II)/g SCG d.m.)78.0080.763.5%
TPC (mg GAE/g SCG d.m.)36.1337.884.8%
Caffeine (mg/g SCG d.m.)4.864.82−0.8%
3-CQA (mg/g SCG d.m.)7.697.862.2%
BI (Abs420)0.210.224.8%
Optimal extraction conditions
Organic solvent concentration: 64.9%
SMR: 50.6 mL/g SCG d.m.
Disclaimer/Publisher’s Note: The statements, opinions and data contained in all publications are solely those of the individual author(s) and contributor(s) and not of MDPI and/or the editor(s). MDPI and/or the editor(s) disclaim responsibility for any injury to people or property resulting from any ideas, methods, instructions or products referred to in the content.

