Abstract
The ongoing influx of information regarding the presence of ethylene oxide in food requires the implementation of a simple and quick analytical procedure. This paper propounds one such effective procedure for the analysis of ethylene oxide (EtO) bactericides by GC-MS/MS in food. The presented method is based on the derivatization of ethylene oxide to 2-chloroethanol, with both the number of extraction steps and the volume of extraction solvent having been minimized. The purification of the final extract through a syringe filter has proved to significantly reduce the amount of recovery obtained. Since the definition of residue pesticide ethylene oxide, according to the directive 868/2015, states that ethylene oxide is the sum of ethylene oxide and 2-chloroethanol expressed as ethylene oxide, the validated method allows for the determination of this definition. The presented method has turned out to be faster than other methods and it complies with the latest European guidelines for the analysis of pesticide residues outlined in the SANTE/11312/2021 document. Linearity, limits of detection and quantification, matrix effects, accuracy, and precision of the method have been assessed with respect to the above-mentioned document. Expanded uncertainty RSDr was less than or equal to 20%, while the recovery achieved oscillated within the range of 70–120%. The laboratory has been accredited for using the described procedure of the chromatographic method, the competence of which has been confirmed by numerous proficiency tests.
1. Introduction
Ethylene oxide (EtO) has a boiling point of 10.8 °C at atmospheric pressure conditions. The compound is the simplest form of an organic cyclic ether and it is widely used as a fumigant with bactericidal and insecticidal properties. It is primarily used to eliminate industrially pathogenic bacteria such as Salmonella sp. [1].
Due to its bacteriological effect, ethylene oxide was widely employed in many industries; it was used in the sterilization of tools in medicine or in food products to extend the nutritional value and shelf life. Ethylene oxide is used commercially to sterilize medical devices that cannot be sterilized by other means such as steam or radiation. Even though EtO is banned in the European Union (EU), it is still used to sterilize certain foods, such as spices, dried herbs, dried vegetables, sesame seeds, and walnuts imported from countries outside of the EU. The presence of ethylene chlorohydrin (2-CE) in the finished extract is a marker of the use of fumigation as a form of sterilization of plant products, particularly spices. Ethylene chlorohydrin is formed by the spontaneous transformation of EtO with chloride ions, which are present in the plant matrix [2]. Despite being a very volatile molecule, ethylene oxide’s cyclic structure allows it to react with halogen atoms and water present in the environment or food products, generating less volatile and more stable metabolites like 2-chloroethanol (2-CE), 2-bromoethanol and ethylene glycol [3].
Toxicology studies conducted by the Agency for Toxic Substances and Disease Registry (ATSDR) and the Environmental Protection Agency (EPA) regarding oral exposure to food sterilized with ethylene oxide have confirmed the information on the toxicity, genotoxicity, and carcinogenicity of ethylene oxide. [4]. In particular, the studies focused on the inhalation exposure to EtO, which can lead to cancer because of ethylene oxide’s toxic effects on respiratory, hematologic, neurological, endocrine, and reproductive systems [5]. According to the International Agency for Research on Cancer (IARC) classification, it is included in Group 1 of carcinogenic substances. Cytotoxicity of EtO results from the occurrence of alkylating reactions with the nucleic acid, which can cause the coagulation of blood proteins and the deactivation of cellular enzymes [6].
Directive 86/355 of 21 July 1986 is one of the first documents to have mentioned the need to ban ethylene oxide usage for sterilization purposes across the European Union due to its toxicity. According to legislative documents, pursuant to the Regulations of the Council of the European Union (EC) 528/2012 and 1107/2009, this substance does not serve as a means to preserve the nutritional value of food products. The Regulation of the European Union 231/2012 prohibited the use of ethylene oxide for the fumigation of food products [7]. However, taking into consideration that several non-EU countries still permit the use of ethylene oxide as a food fumigant, this substance must be constantly monitored in imported food products [8].
Subsequent directives and regulations of the European Union imposed increasingly stringent requirements with regard to the maximum amount of ethylene oxide and 2-chloroethanol in plant products and food additives. A recent regulation, number (EU) 2022/1396, severely limited the level of these pesticides to 0.1 mg/kg in food additives. Implementing Regulation (EU) 2020/1540 increased the number of mandatory checks on sesame seed samples originating from India to 50% [9].
In 2020, the CVUA Stuttgart (Chemisches und Veterinäruntersuchungsamt Stuttgart) published an analytical method for the quantification of ethylene oxide and 2-chloroethanole in food commodities by GC-MS/MS based on the standards for the quick, easy, cheap, effective, rugged, and safe (QuEChERS) method or the multimethod commodities of high lipid and low water content (QuOil) extraction. The analytical method presented in this paper draws upon a modification of the QuOil CNT/TS 17062:2019 method and allows for the quick determination of the full MRL definition of ethylene oxide in food products [10].
The aim of the study is to present an easy and quick analytical GC-MS/MS method for detecting a residue called ethylene oxide, which is defined as the sum of ethylene oxide and 2-chloroethanol.
2. Materials and Methods
Chemicals and Reagents
Analytical reference standards of ethylene oxide (purity 97.7%) and 2-chloroethanol (purity 99.3%) were purchased from CPAchem (Bogomilovo, Bulgaria) and 4D-2-chloroethanol (purity 97.88%) was purchased from HPC Standard (Cunnersdrof, Germany). All analytical standards were compliant with ISO 17025 and 17034 norms.
Pesticide-grade acetonitrile was purchased from JT Baker Chemicals, and Ultrapure water was obtained from the Mili-Q Gradient Water System from Millipore. Sodium chloride, hydrochloric acid (C = 37%), magnesium sulphate, PSA sorbent, and C-18 sorbent were purchased from JT Baker Chemicals.
Analytical stock solutions of 2-chloroethanol and ethylene oxide (C = 1000 mg/L—solution A) were prepared in cold acetonitrile and were diluted to intermediate standard stock solutions with concentrations of 10 mg/L EtO (solution B), and used for recovery experiments.
Analytical stock solutions of 2-chloroethanol-4D—used as an internal standard (ILIS), have been prepared from analytical standards (C = 1000 mg/L) by diluting with acetonitrile to obtain a stock solution with a concentration of 10 mg/L.
All these solutions were stored in a freezer at −18 °C.
3. Instrument and Experimental Conditions
GC-MS/MS analyses were carried out with Shimadzu Nexis GC-2030, equipped with an AOC-6000 Plus auto-sampler, and coupled to a two quadrupole mass spectrometer (GCMS-TQ8040NX). The GC-MS/MS analyses were performed according to the method parameters presented below. The injector temperature was set at 180 °C. Split mode injection 4:1 was applied with an injection volume of 1 μL. The separation was performed on an HP-VOC fused silica capillary column 30 m × 0.2 mm; 1.12 µm of film thickness, Agilent J&W. Helium (purity 99.9995%) was used as carrier gas at a constant pressure flow rate of 1.0 mL/min. The column oven temperature program was as follows: the initial temperature was set at 40 °C and maintained for 2.5 min, then it was increased to 280 °C at a rate of 50 °C/min and held for 10 min. The total run time was 17.3 min. Retention times of individual compounds were as follows: ethylene oxides—2.646 min, 2-chloroethanols—4.862 min, 2-chloroethanols D4—4.870 min. The mass spectrometer was operated with an electron impact (EI) source using the multiple reaction monitoring (MRM) mode. In Table 1, the characterization of ions used for qualitative analysis of ethylene oxides and their derivatives is presented. The ion source and transfer line temperatures were set at 225 °C and 200 °C, respectively. LabSolutions GCMS (version 4.20) was used for instrument control, and data acquisition and processing.

Table 1.
Multiple reaction monitoring of analysis ethylene oxide and 2-chlorethanole.
4. Sample Preparation
4.1. Extraction Procedure
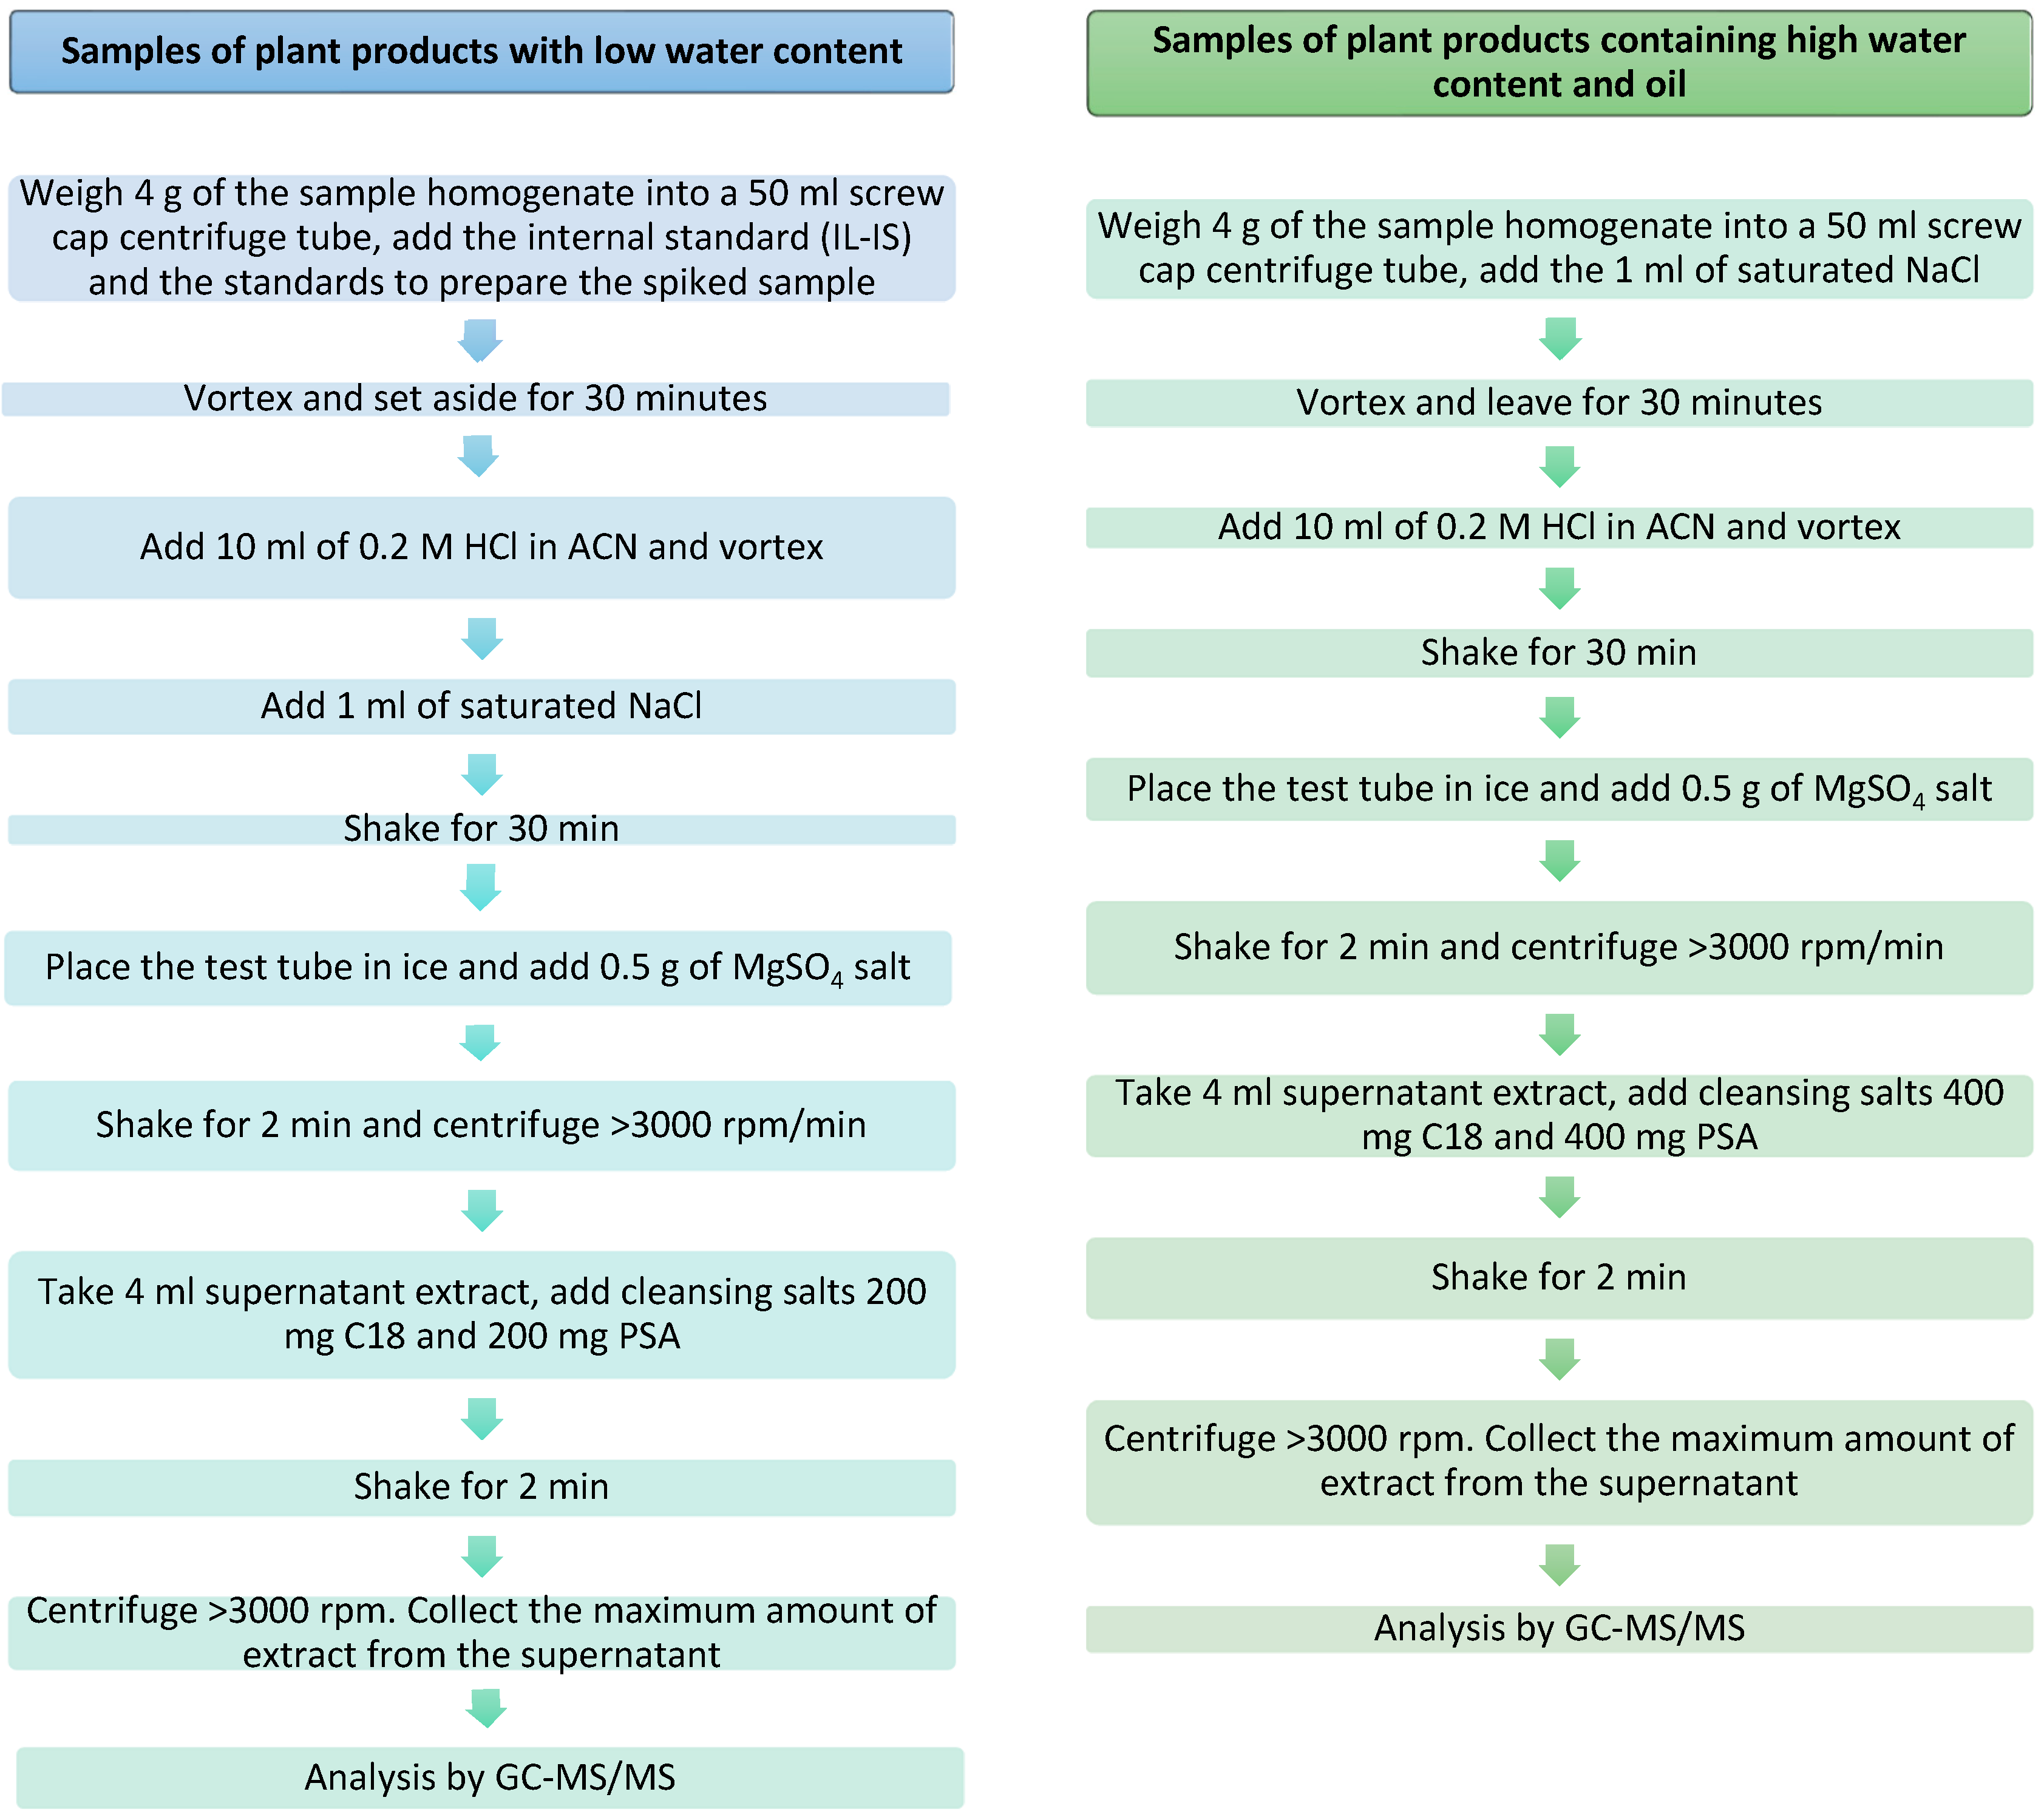
Commercial organic samples of sesame seeds, guar gum, wheat, and tomatoes were used as blanks for the method optimization and validation experiment. Before the start of the experiment, the samples were checked for the absence of 2-chloroethanol and ethylene oxide. Prior to the analysis, the samples were stored at −18 °C for 10 h and then homogenized with the addition of dry ice in a ratio of 1 dry ice: 3 samples. Figure 1 presents the extraction procedure of EtO and its derivatives from samples with a low water content and in samples with a high water content and oil according to annex A in SANTE/11312/2021.
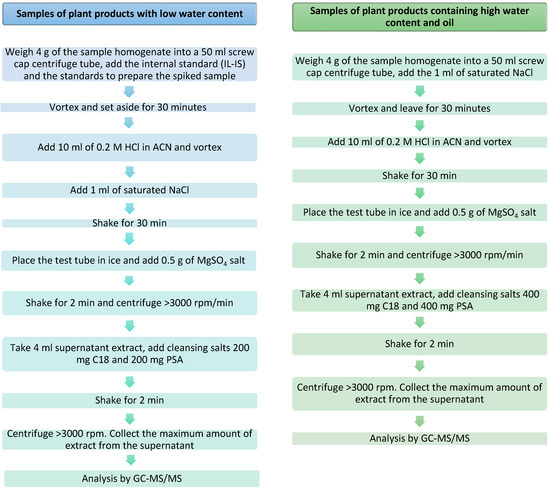
Figure 1.
The two methods for the preparation of the samples (with low and high water and oil content).
4.2. Extract Preparation Procedure
4.2.1. Samples of Plant Products with Low Water Content
About 4.00 g ± 0.03 g of homogenized guar gum was weighed into a 50 mL falcon and a known volume of solution B (first spiking level 11 µL, second spiking level 110 µL in gum guar; first spiking level 27.5 µL, second spiking level 275 µL in carob) was then added. Spiking 100 µL of internal standard (ILIS)—2CE-4D. The sample was immediately capped and vortexed for 30 s (Heidolph Instruments) and left for 30 min in a chilled ice water bath at <10 °C. Then, 10.0 mL of ACN containing 0.2 M HCl (1.7 mL HCl + 98.3 mL ACN), and 1.0 mL of saturated NaCl solution were added. The sample was shaken for 0.5 h and then 0.5 g of MgSO4 was added. It was shaken vigorously for 2 min and centrifuged at a spin speed of >3000 rpm/min. The maximum amount of supernatant extract (8 mL) was taken and then the extract was purified with a mixture of PSA and C18 sorbents (200 mg each). The sample was centrifuged for 2 min at a speed of >3000 rpm. The maximum amount of supernatant (4 mL) extract was taken to be analyzed by GC-MS/MS. Purified extracts were transferred to autosampler vials for GC-MS/MS analysis.
4.2.2. Samples of Plant Products Containing High Water Content and Oil
About 4.00 g ± 0.03 g of homogenized sesame seeds were weighed into a 50 mL falcon. An amount of 1.0 mL of supersaturated NaCl solution was then added and left for 15 min in a chilled ice water bath at <10 °C. After this time, the sample was spiked with solution B (at the first spiking level 11 µL, second spiking level 110 µL in tomato; first spiking level 44 µL, second spiking level 440 µL in sesame seeds), and 100 µL of internal standard (ILIS)—4D-2-chloroethanol, immediately capped and vortexed for 30 s, and left for 30 min in a chilled ice water bath. Then, 10.0 mL of ACN containing 0.2 M HCl (1.7 mL HCl + 98.3 mL ACN) was added. The sample was shaken for 0.5 h and then 0.5 g MgSO4 was added. It was shaken vigorously for 2 min and centrifuged at a spin speed of >3000 rpm/min. The maximum amount of supernatant extract (8 mL) was taken and then the extract was purified with a mixture of PSA and C18 sorbents (400 mg each). The sample was centrifuged for 2 min at a centrifugation speed of >3000 rpm. The maximum amount of supernatant (4 mL) extract was taken be analyzed by GC-MS/MS. Purified extracts were transferred to autosampler vials for GC-MS analysis.
4.3. Calculation of Results
The residual 2-chloroethanol is calculated according by the following formula:
where:
P—analyte residues
Cw—analyte concentration obtained from the calibration curve (µg/mL)
Vk—final extract volume (mL)
mp—sample weight taken for analysis (g)
F—analyte recovery—if applicable
or (in the case of internal standard calibration):
where:
Sa—analyte signal (height or surface area) in the analyzed extract
Sw—signal of a given analyte in a standard solution
Srww—internal standard signal in the standard solution
Spww—signal of the internal standard in the analyzed extract.
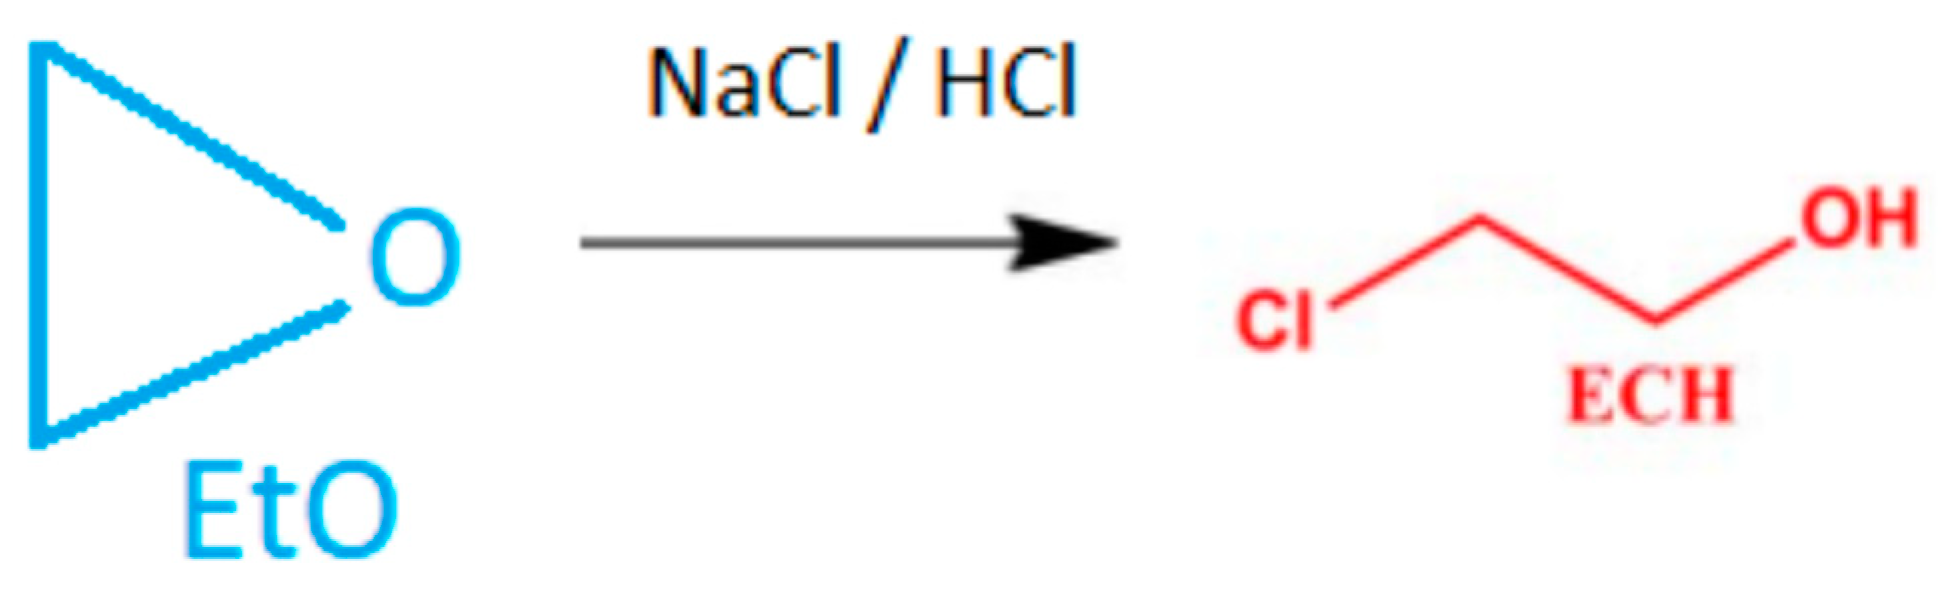
As a result of the derivatization reaction, the obtained result of 2-chloroethanol should be converted to ethylene oxide according to the following formula using the conversion factor (Cf) of 0,55. Cf is calculated from the molecular weight of 2-CE (80.52 g/mol) and EO (44.05 g/mol) (Figure 2).

Figure 2.
Chemical conversion of ethylene oxide to 2-chloroethanol.
Using the above calculations, the concentration of 2-chloroethanol at the level of 0.008 mg/kg corresponds to the content of the full definition of ethylene oxide of 0.011 mg/kg.
4.4. Method Validation
For method validation, linearity of the analytical curves, dynamic linear range, limit of detection (LOD), limit of quantification (LOQ), matrix effects (%), selectivity, precision (repeatability and intermediate precision), and trueness (expressed as % recovery) were assessed according to the guidance document on analytical quality control and method validation procedures for pesticides residues analysis in food and feed [11].
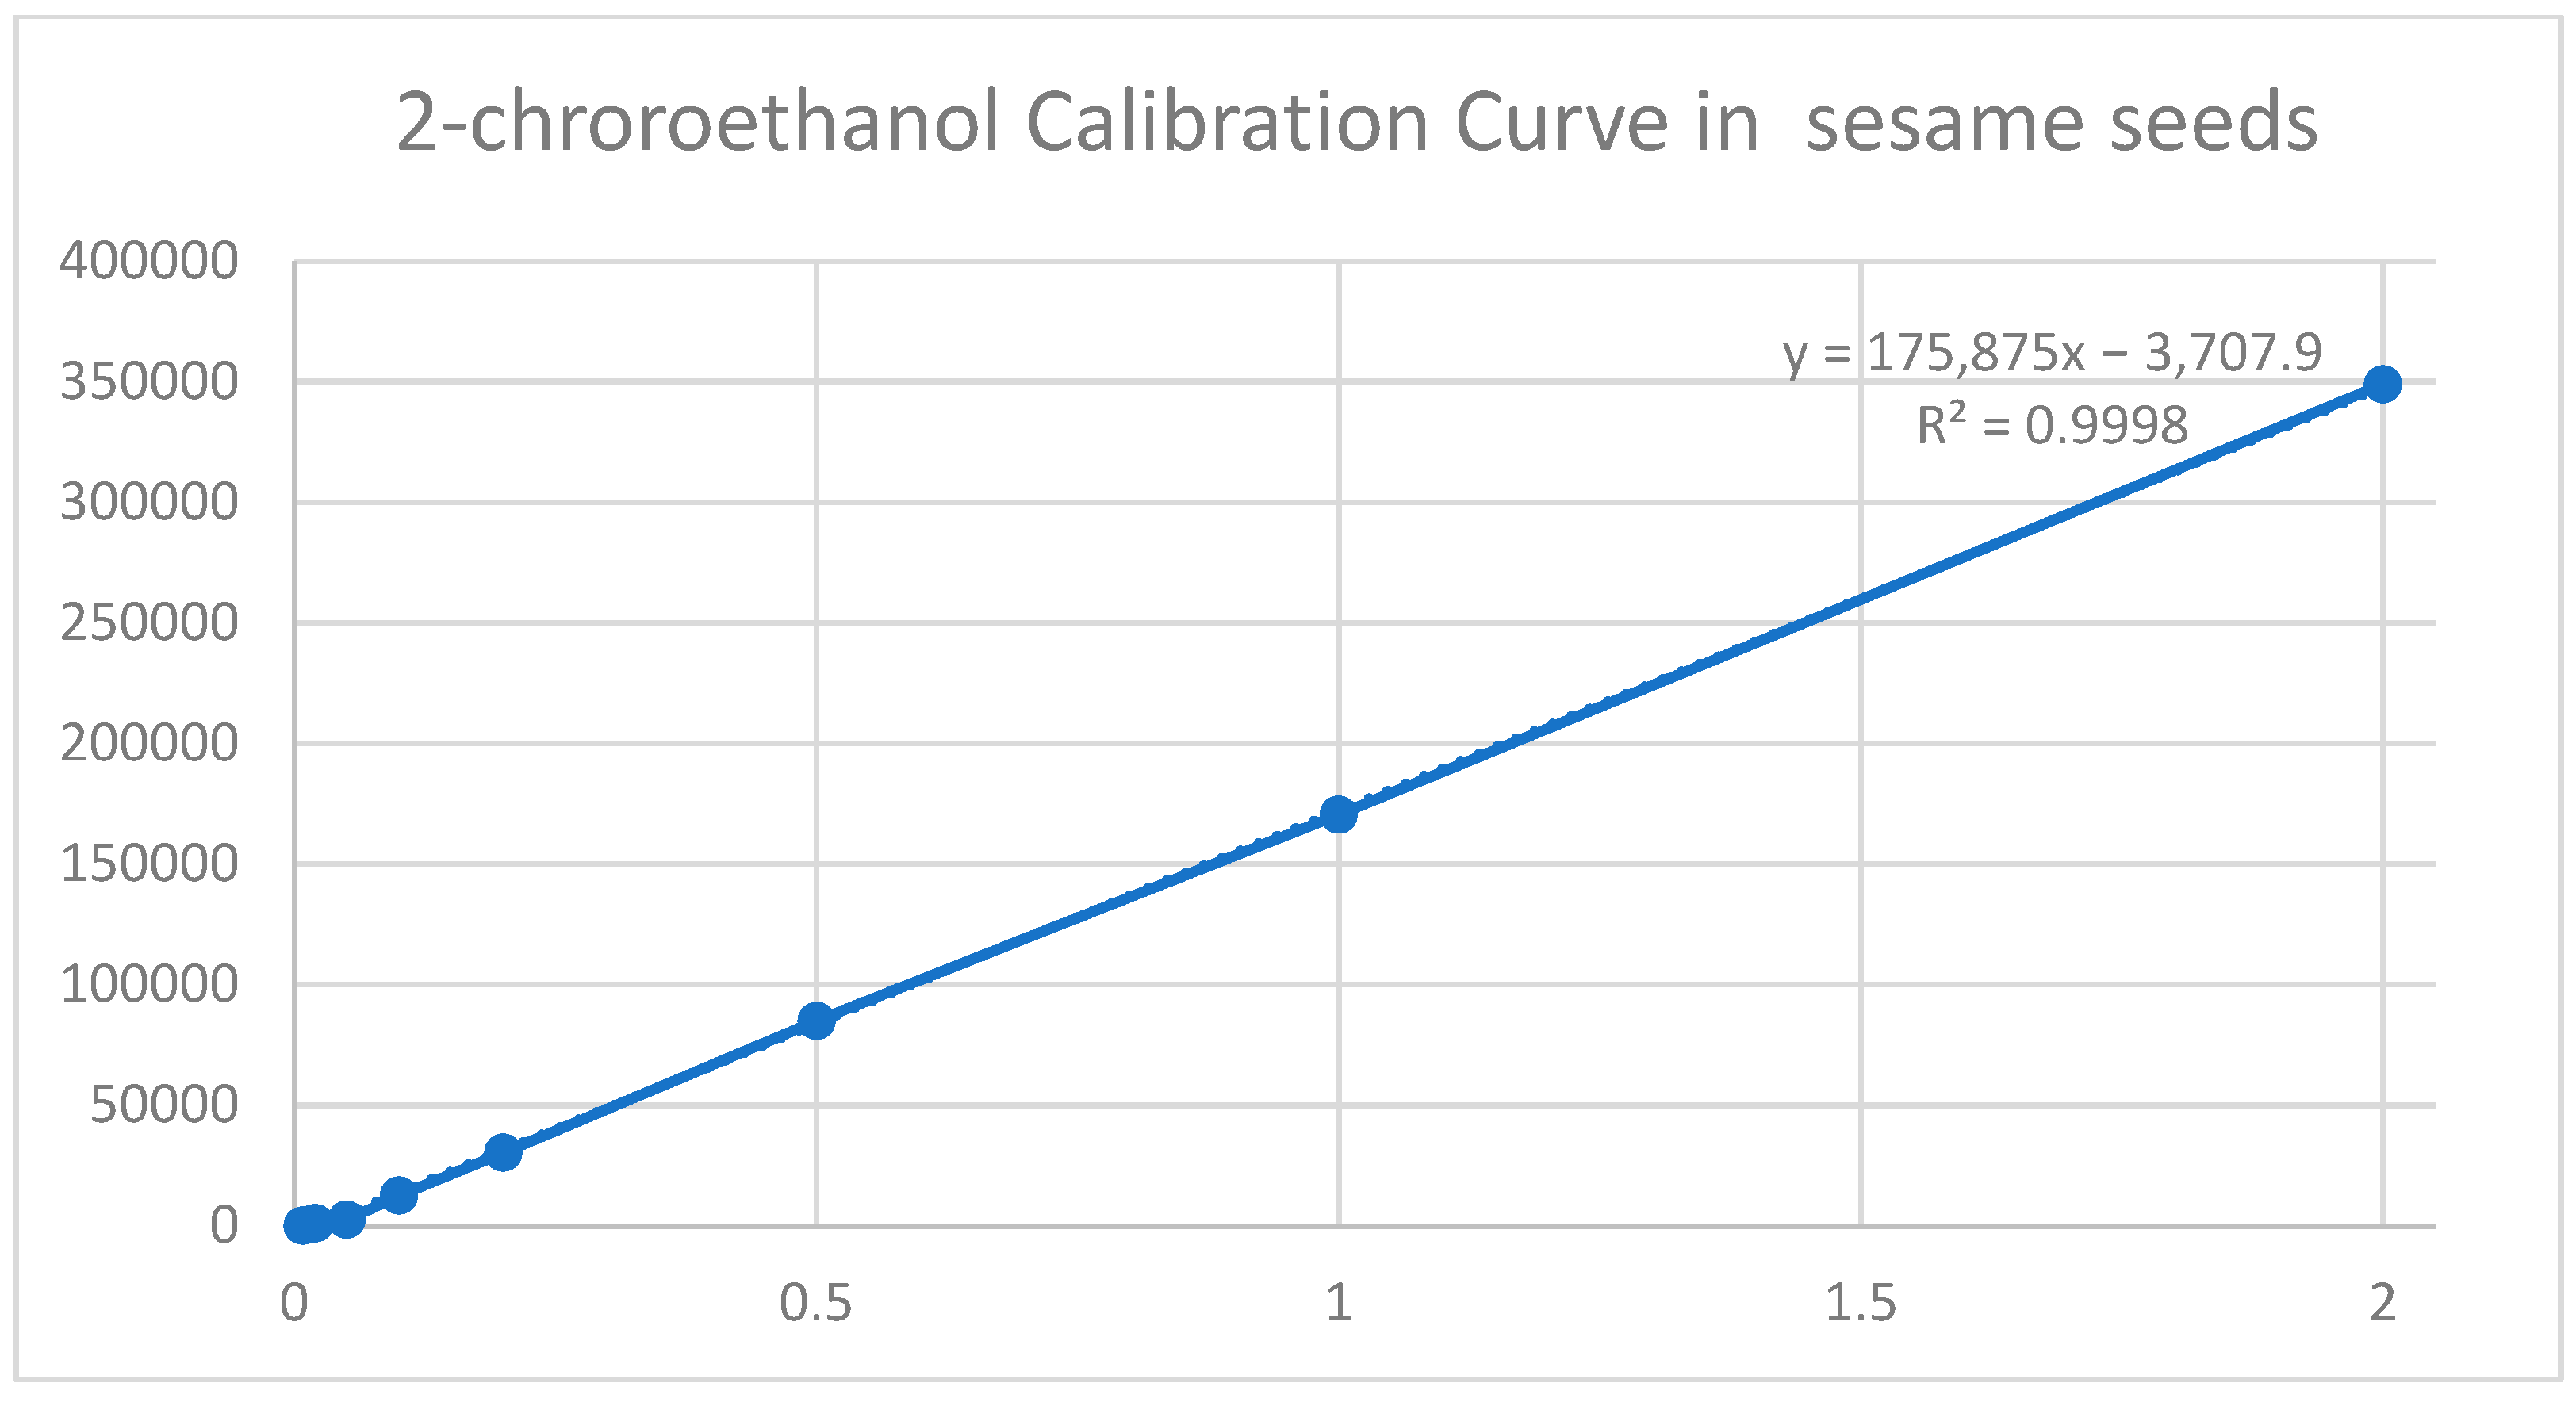
Linearity and matrix effects were assessed, analyzing 2-chloroethanol analytical solutions at nine concentrations (0.008; 0.016; 0.02; 0.05; 0.10; 0.20; 0.50; 1.0; 2.0 mg/kg), corresponding to sum EtO, and a sample concentration of 0.011 mg/kg to 2.75 mg/kg (Figure 3). The dilution factors for this method were 2.5x its ratio sample weight/extract volume.
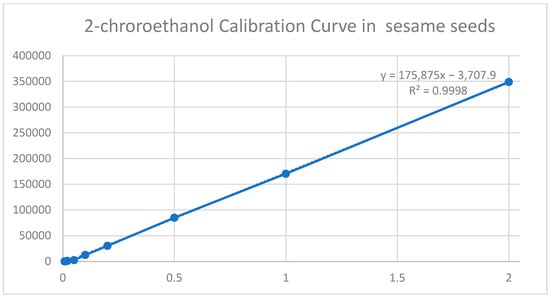
Figure 3.
Calibration curve of 2-chloroethanol in sesame seeds.
Solutions were prepared in a pure organic solvent (acetonitrile) and in an extract of the blank matrix. An enrichment experiment with a solution of 2-chloroethanol and ethylene oxide was carried out. The samples were spiked at two concentrations, respectively 0.011 mg/kg and 0.11 mg/kg for dry samples (guar gum) and 0.044 mg/kg and 0.44 mg/kg for samples containing high water and oil content (sesame seeds) [Figure 3]. LOD is defined as the lowest repeatable fivefold detectable concentration level (RSD < 20%). The lowest LOD level for guar gum where the peak intensity was the lowest was estimated at 0.0022 for the full definition of ethylene oxide. The intensity of the peak at this level could be achieved by using the appropriate signal boost. For the remaining food matrices, an identical analytical approach was used to determine the LOD. However, the matrix effect increased the signal intensity for the remaining food matrices. Samples at the first and second enrichment level were repeated five times. The injection of the standard curve was repeated in duplicate, both with respect to the standard curve prepared in the solvent and the standard curve prepared in the appropriate matrix. The lowest concentration with recovery in the range of 70–120% and repeatability with an RSD of a maximum of 20% was defined. The accuracy (precision and reproducibility) of the method was calculated. The calculated validation parameters met the guidelines of the document SANTE/11312/2021 (Implemented by 1 January 2022) (Table 2).
Table 2.
Average recovery and RSDwR for specific matrices.
4.5. The Experiment of the Procedure Preparation
The developed analytical method was prepared on the basis of the results obtained from a series of experiments based on various modifications of the QuOil method presented in the document from 2020 by the CVUA Stuttgart laboratory. The comprehensive analytical approach allowed information to be obtained that should be taken into account when performing routine analyses.
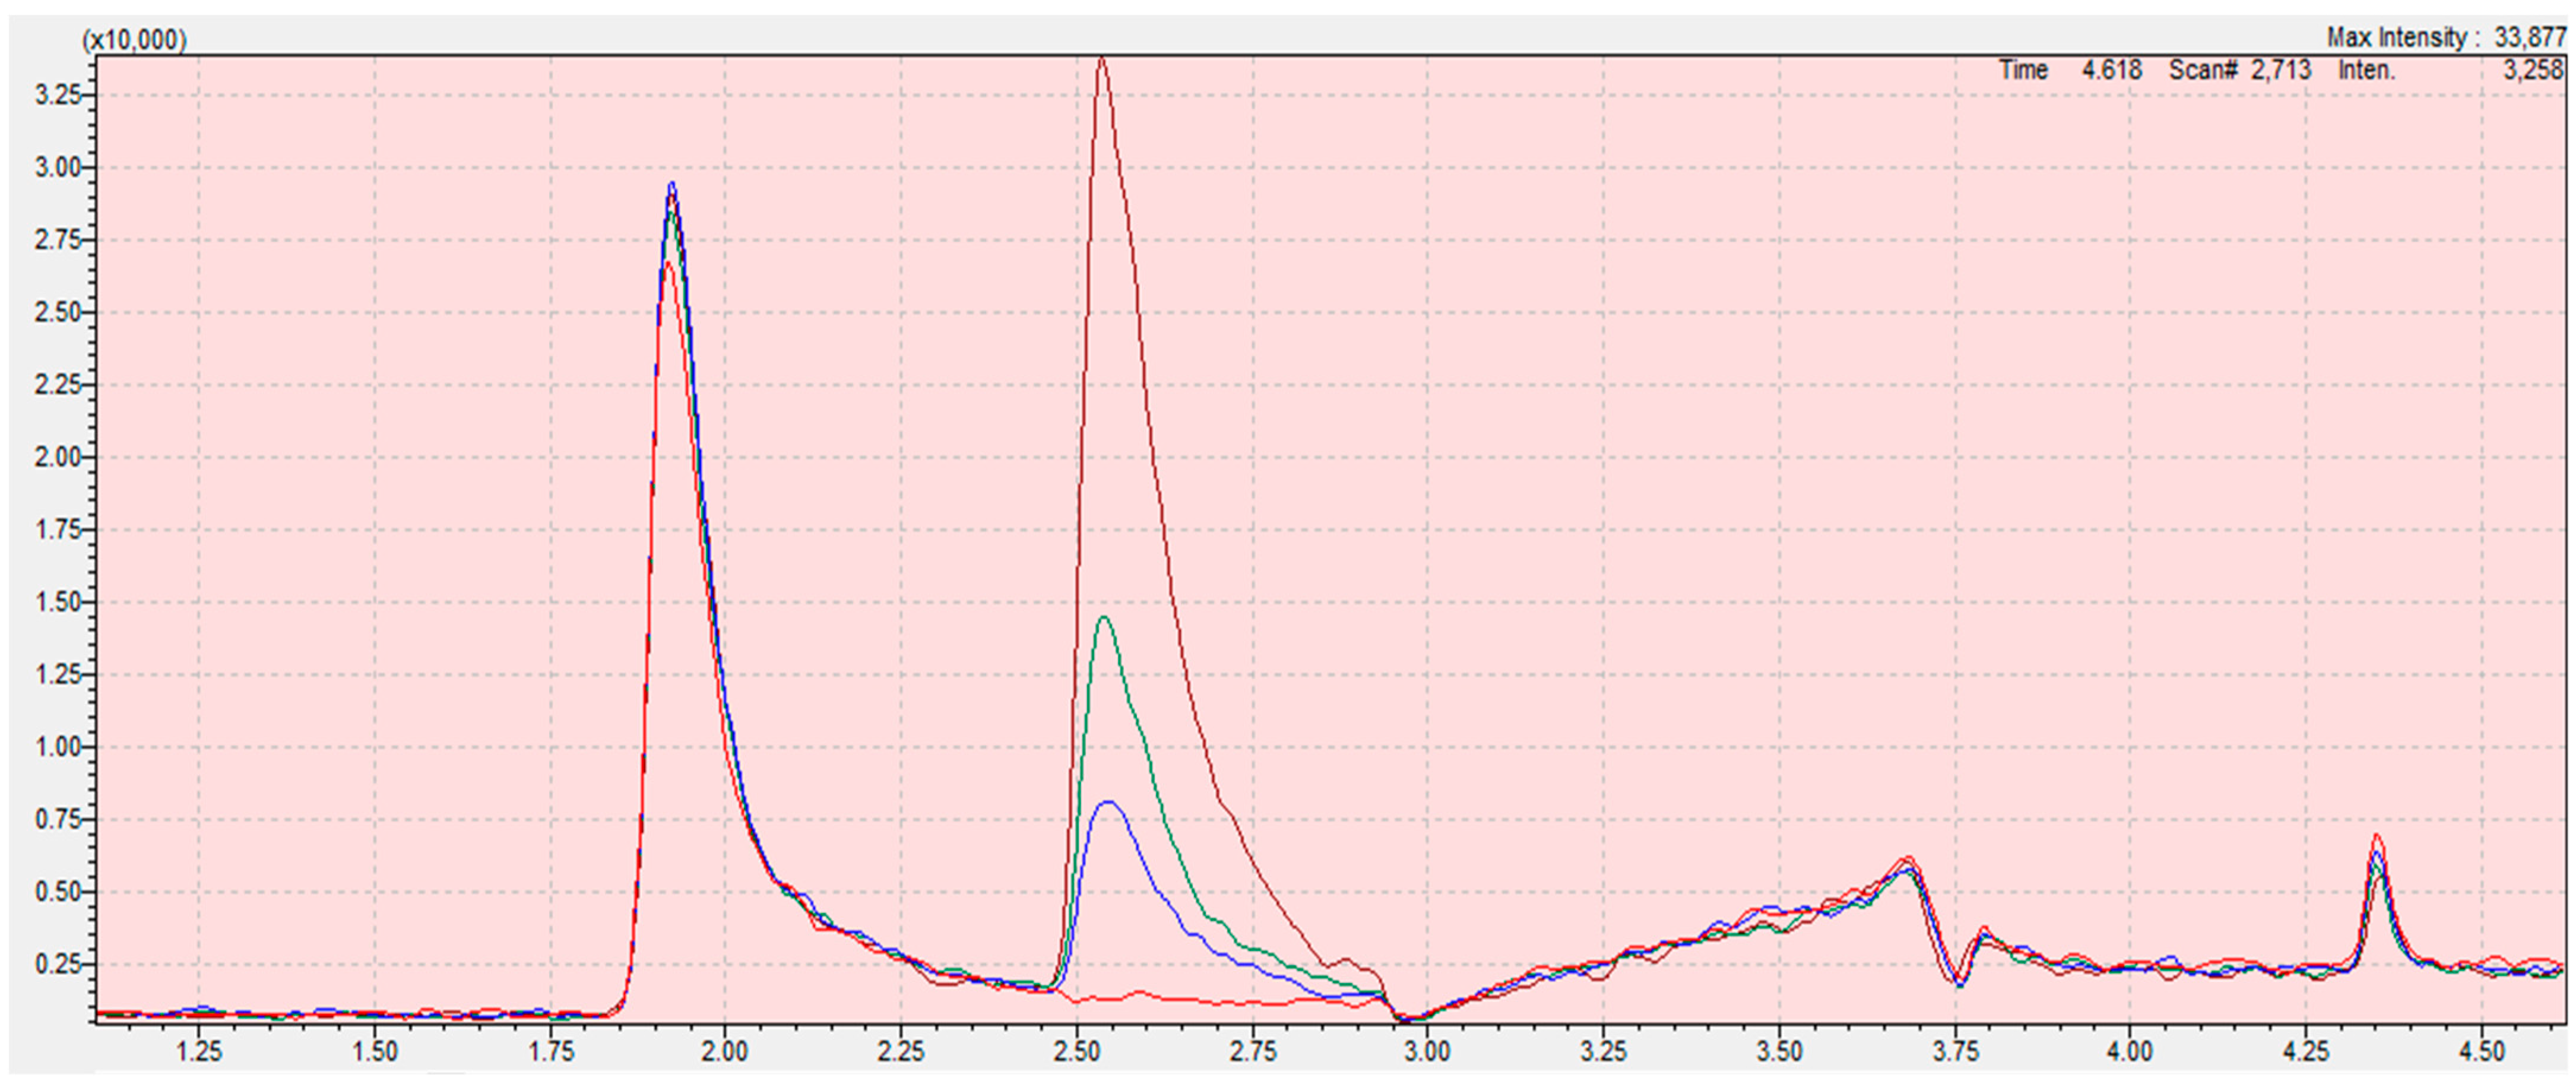
Due to the low sensitivity and the influence of solvent interference on the determination of the ethylene oxide content, the best solution is to determine only 2-chloroethanol in the derivatization reaction. Thanks to this solution, significant errors resulting from incorrect integration of the tailing peak of ethylene oxide were avoided (Figure 4; Figure 5).
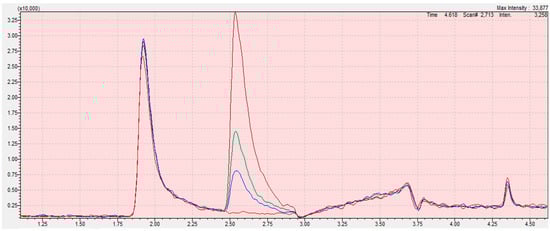
Figure 4.
Chromatograms from the program LabSolution Insight for ethylene oxide calibration curve samples (blank (red); 0.05 mg/kg (blue); 0.1 mg/kg (green); 0.3 mg/kg (claret)) in sesame seed matrix. The scope of the integration is contained in the interval from 2.45 to 2.95 for all samples. Retention time of ethylene oxide is 2.646 min. The X-axis is the total ion current (TIC), the Y-axis is the retention time of the compound.
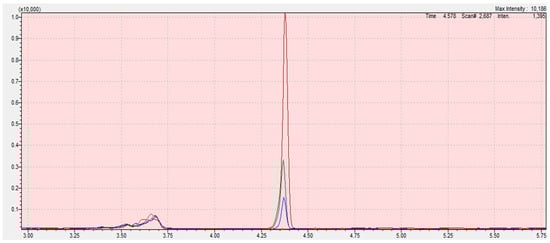
Figure 5.
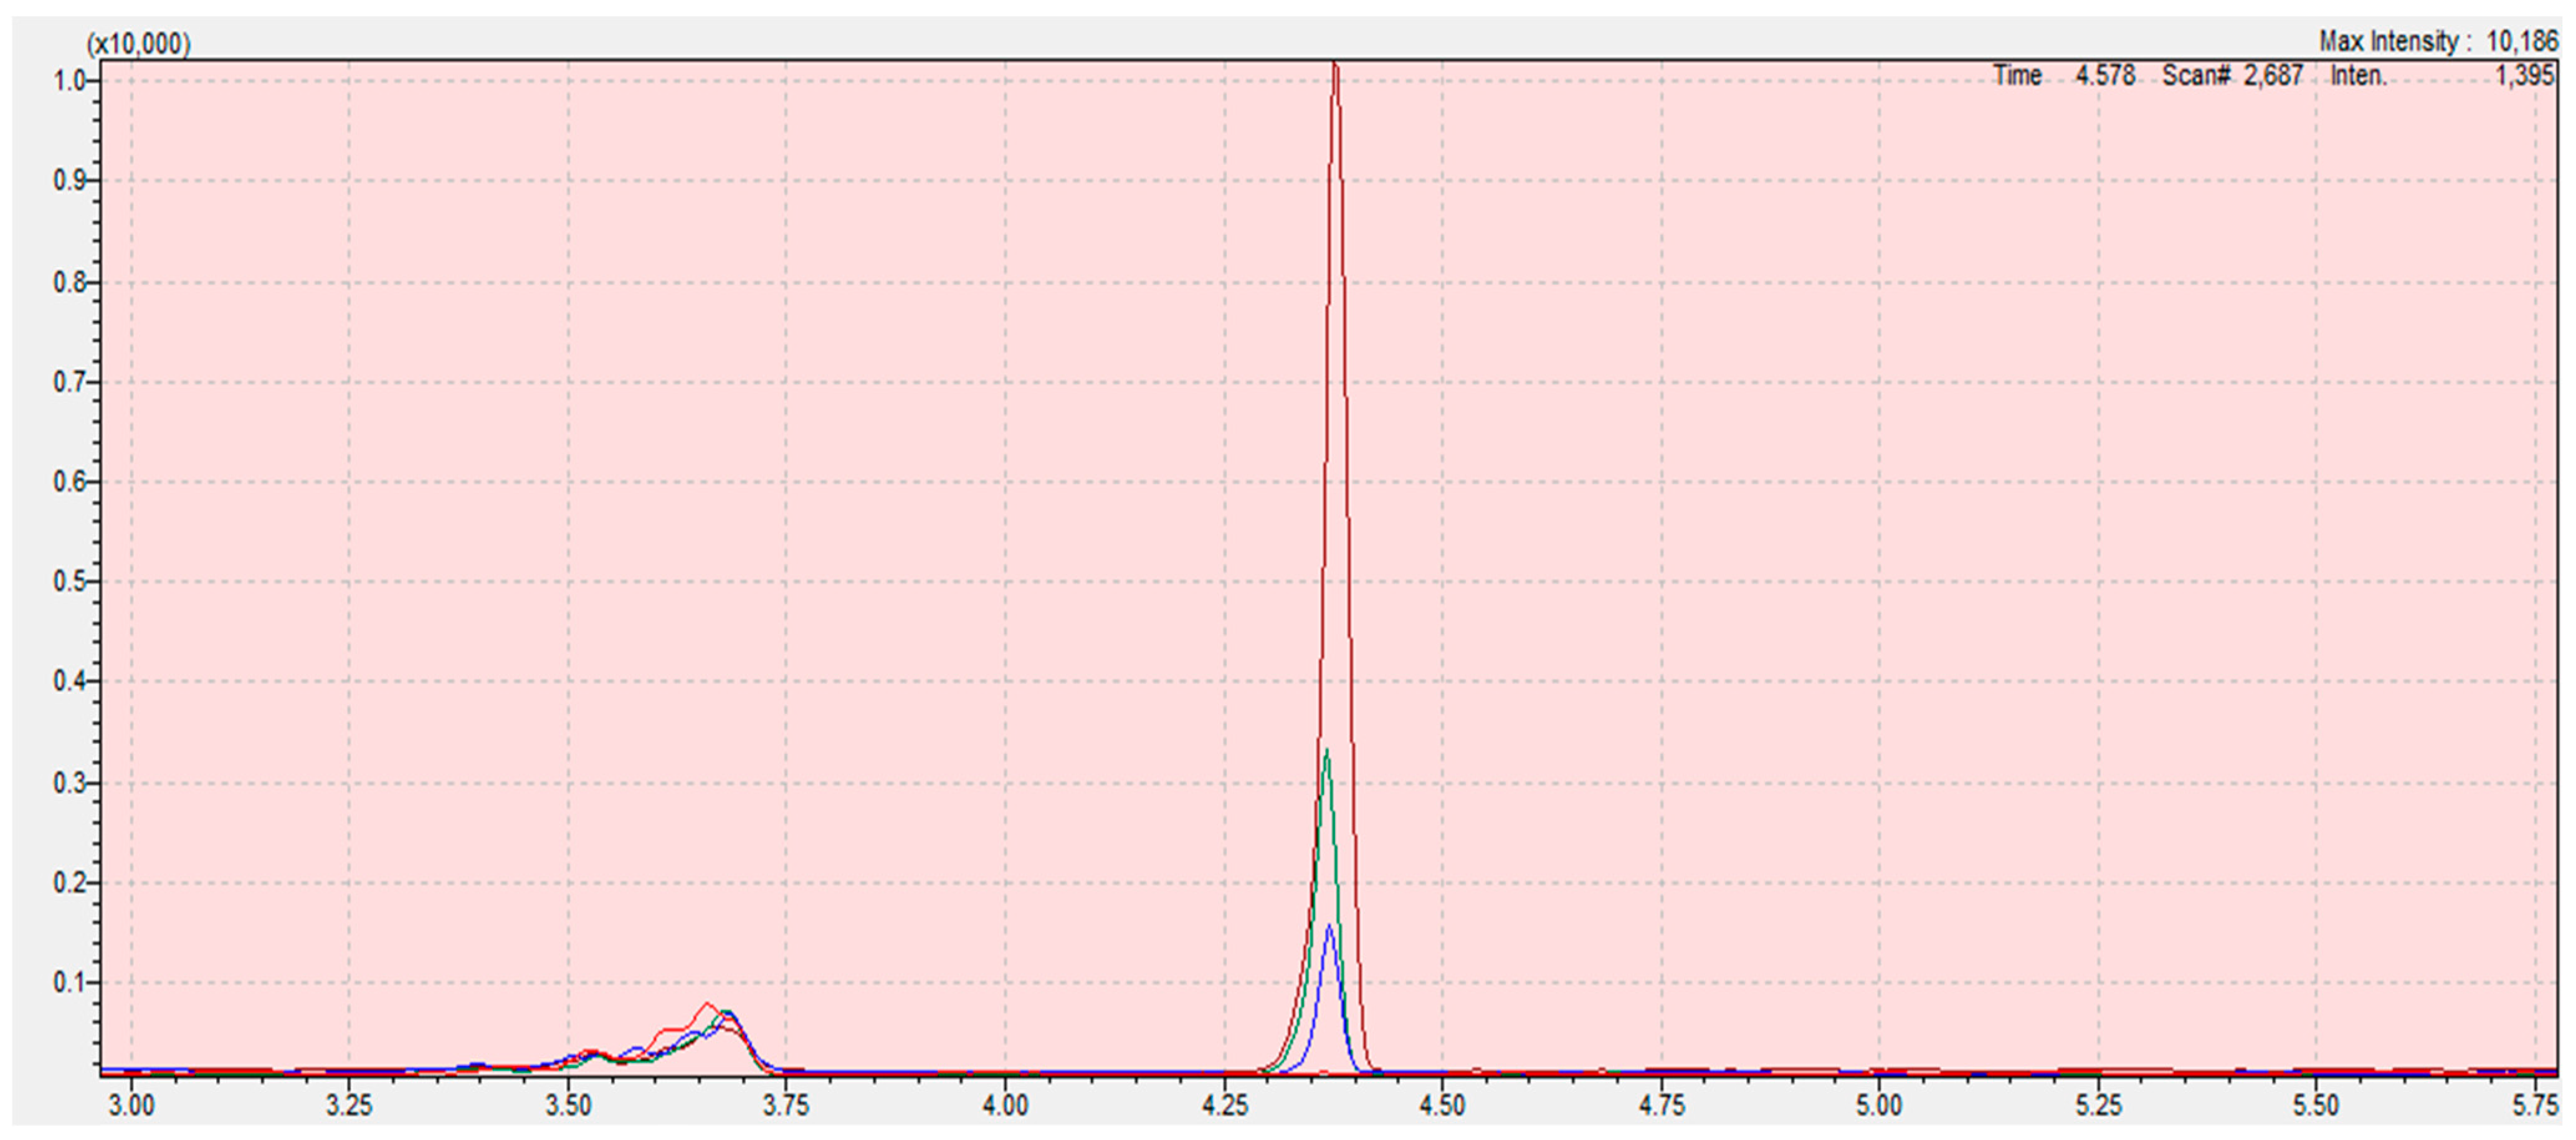
Chromatograms from the program LabSolution Insight of calibration curve samples (blank (red); 0.05 (blue); 0.1 (green); 0.3 mg/kg (claret)) of 2-chloroethanol in sesame seed matrix. The scope of the integration is contained in the interval 4.28 to 4.45 for all samples. Retention time of ethylene oxide is 4.862 min. The X-axis is the total ion current (TIC), the Y-axis is the retention time of the compound.
The basic QuOil method allows for the determination of both EtO and 2CE in this method. Thanks to our experiments introducing some changes in the QuOil method, a final method that allows performing derivatization reactions to 2CE in a quick, easy, and efficient way, was established. This procedure is much faster than the method with QuECheRs derivatization. Five different ways to modify the QuOil method were carried out.
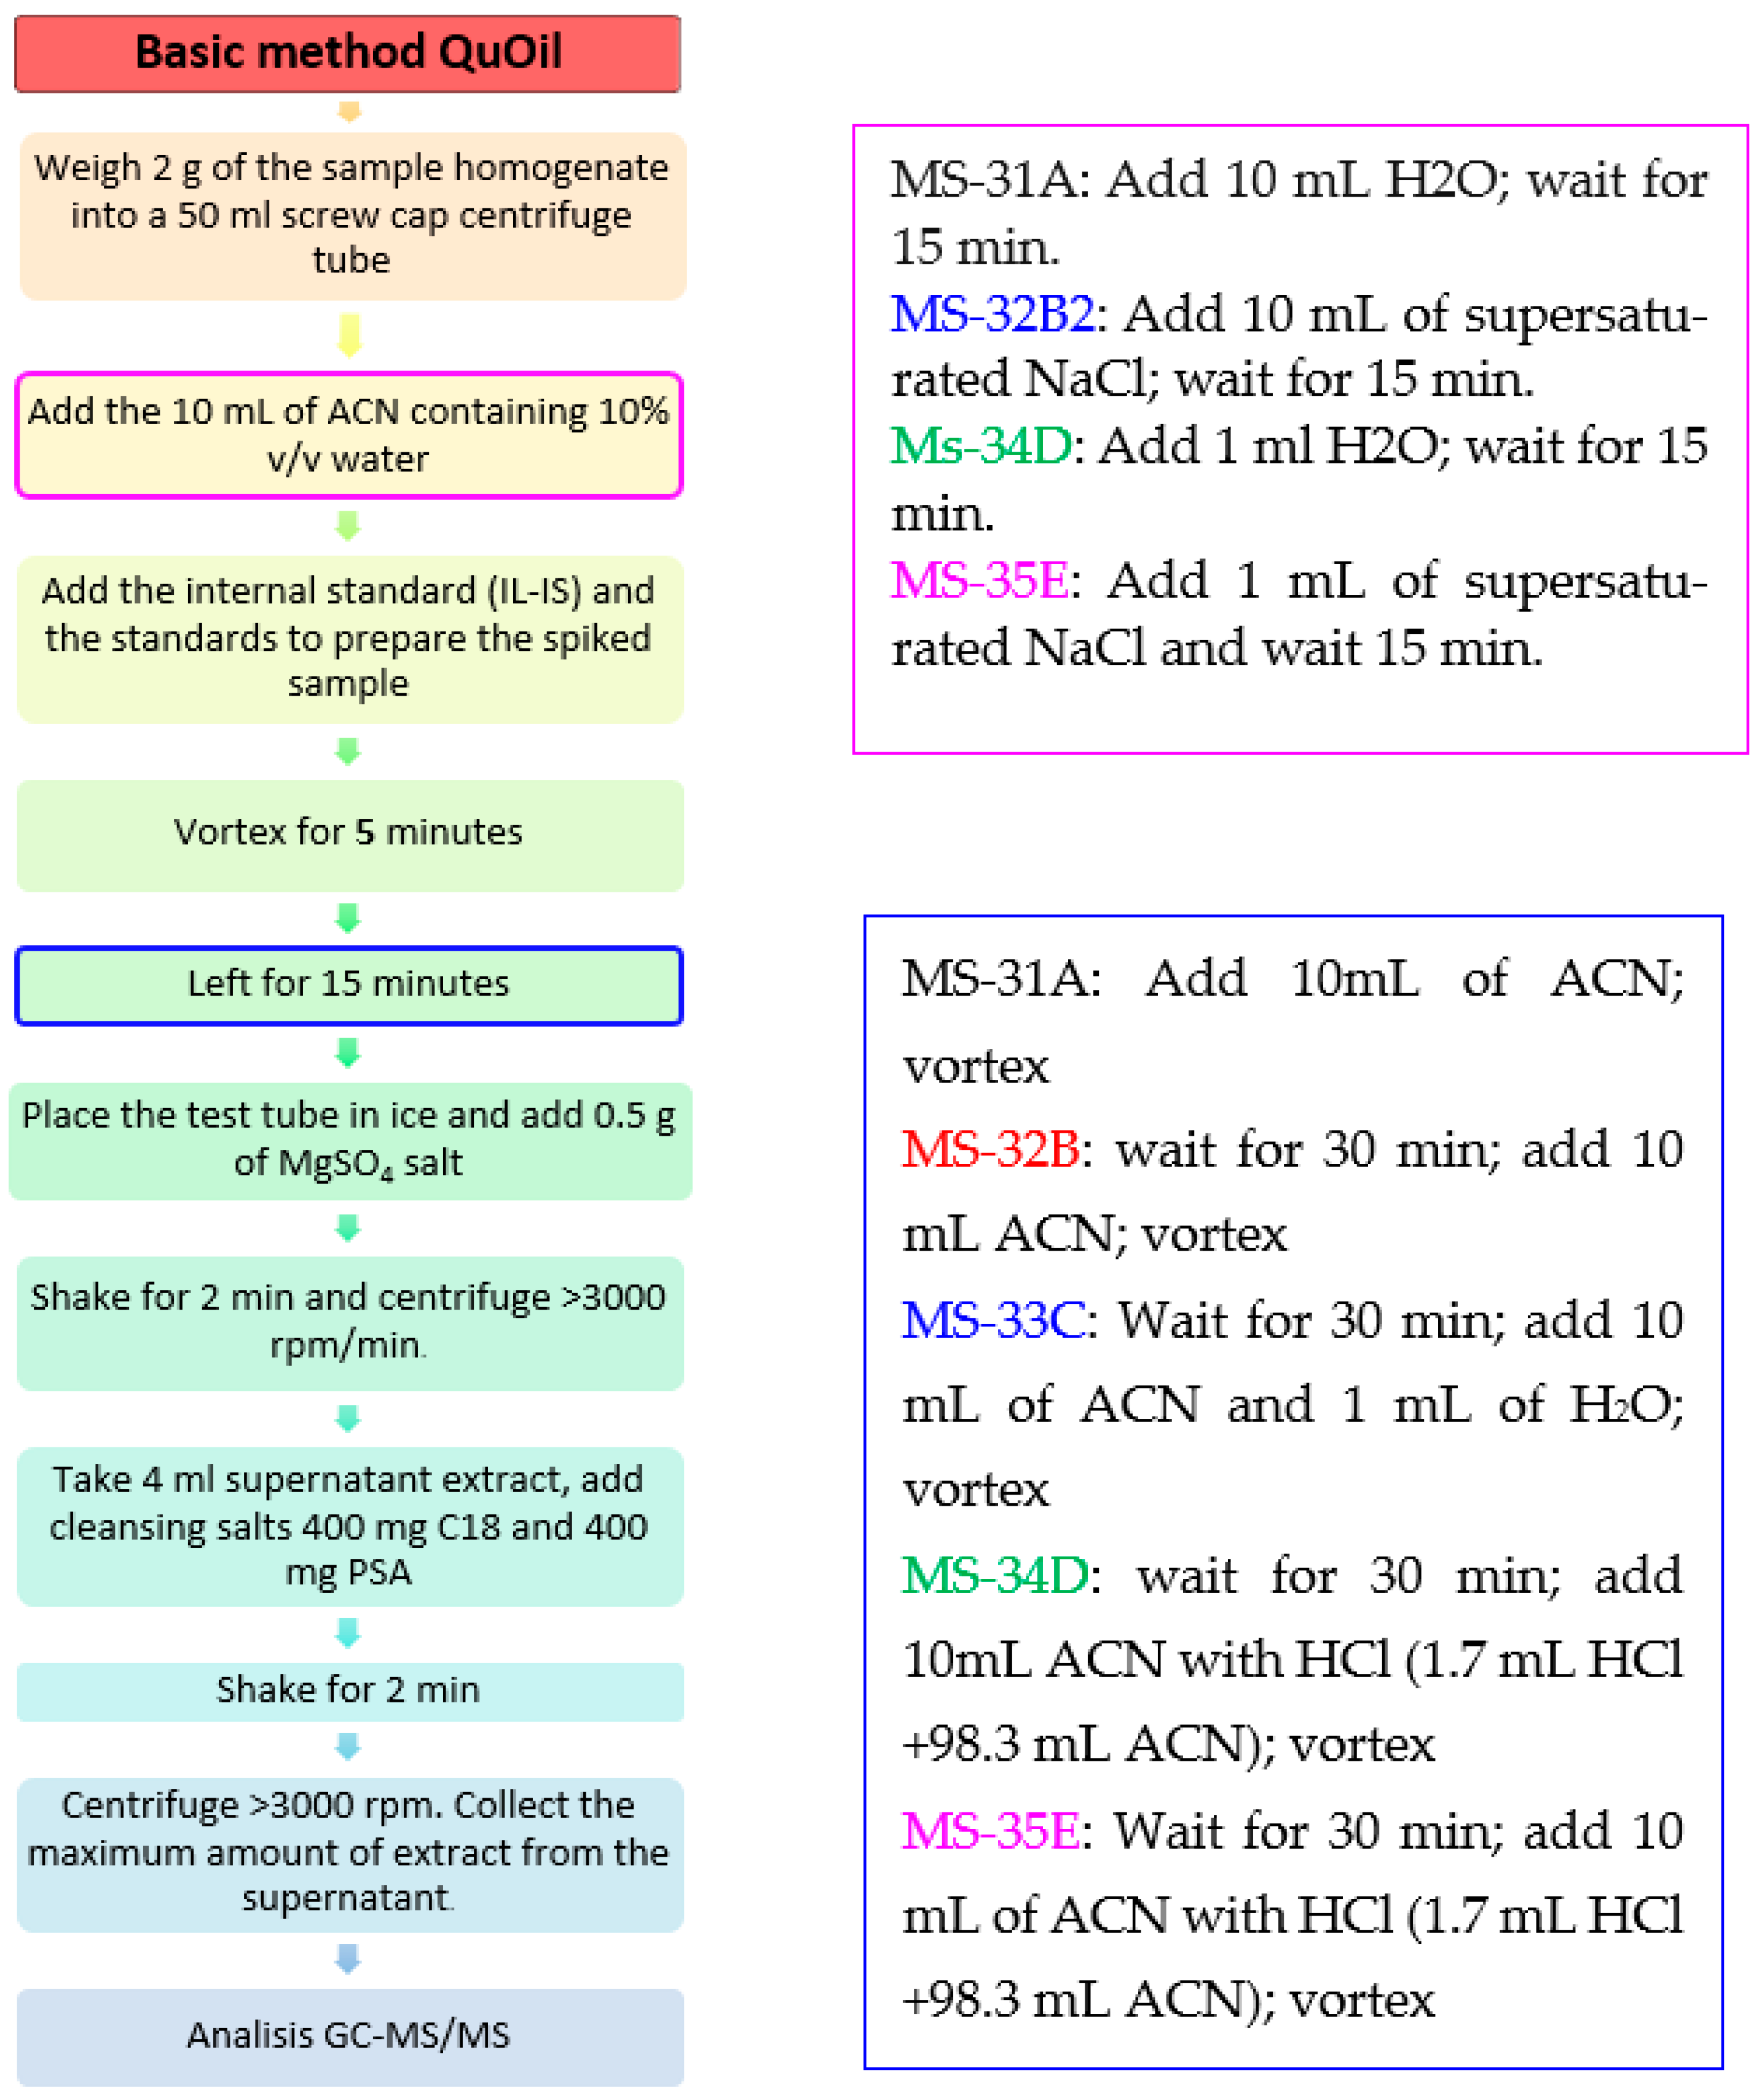
The developed procedure presented in the article was based on a series of experiments with the following modifications (Figure 6):
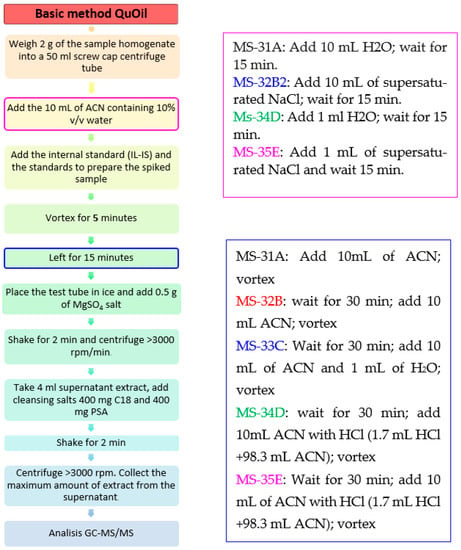
Figure 6.
Modifications of the QuOil method for ethylene oxide and 2-chloroethanol extraction.
Sample MS-31A: 2 g of sample—1 mL of H2O—wait for 15 min—add spiking solution—wait 30 min—add 10 mL of ACN-vortex
Sample MS-32B: 2 g of sample—1 mL of supersaturated NaCl—wait for 15 min—add spiking solution—wait for 30 min—add 10 mL of ACN-vortex
Sample MS-33C: 2 g of sample—add spiking solution—wait for 30 min + add 10 mL of ACN and 1 mL of H2O-vortex
Sample MS-34D: 2 g of sample—add 1 mL H2O—wait for 15 min—add spiking solution—wait for 30 min—then + 10 mL ACN with HCl (1.7 mL HCl + 98.3 mL ACN)-vortex
Sample MS-35E: 2 g of sample—add 1 mL of supersaturated NaCl—wait for 15 min—add spiking solution—wait for 30 min + add 10 mL of ACN with HCl (1.7 mL HCl + 98.3 mL ACN)-vortex
All samples prepared with the modifications listed above were prepared twice and filtered through a PTFE filter or left unfiltered.
Analyzing the obtained observations, we made the following conclusions:
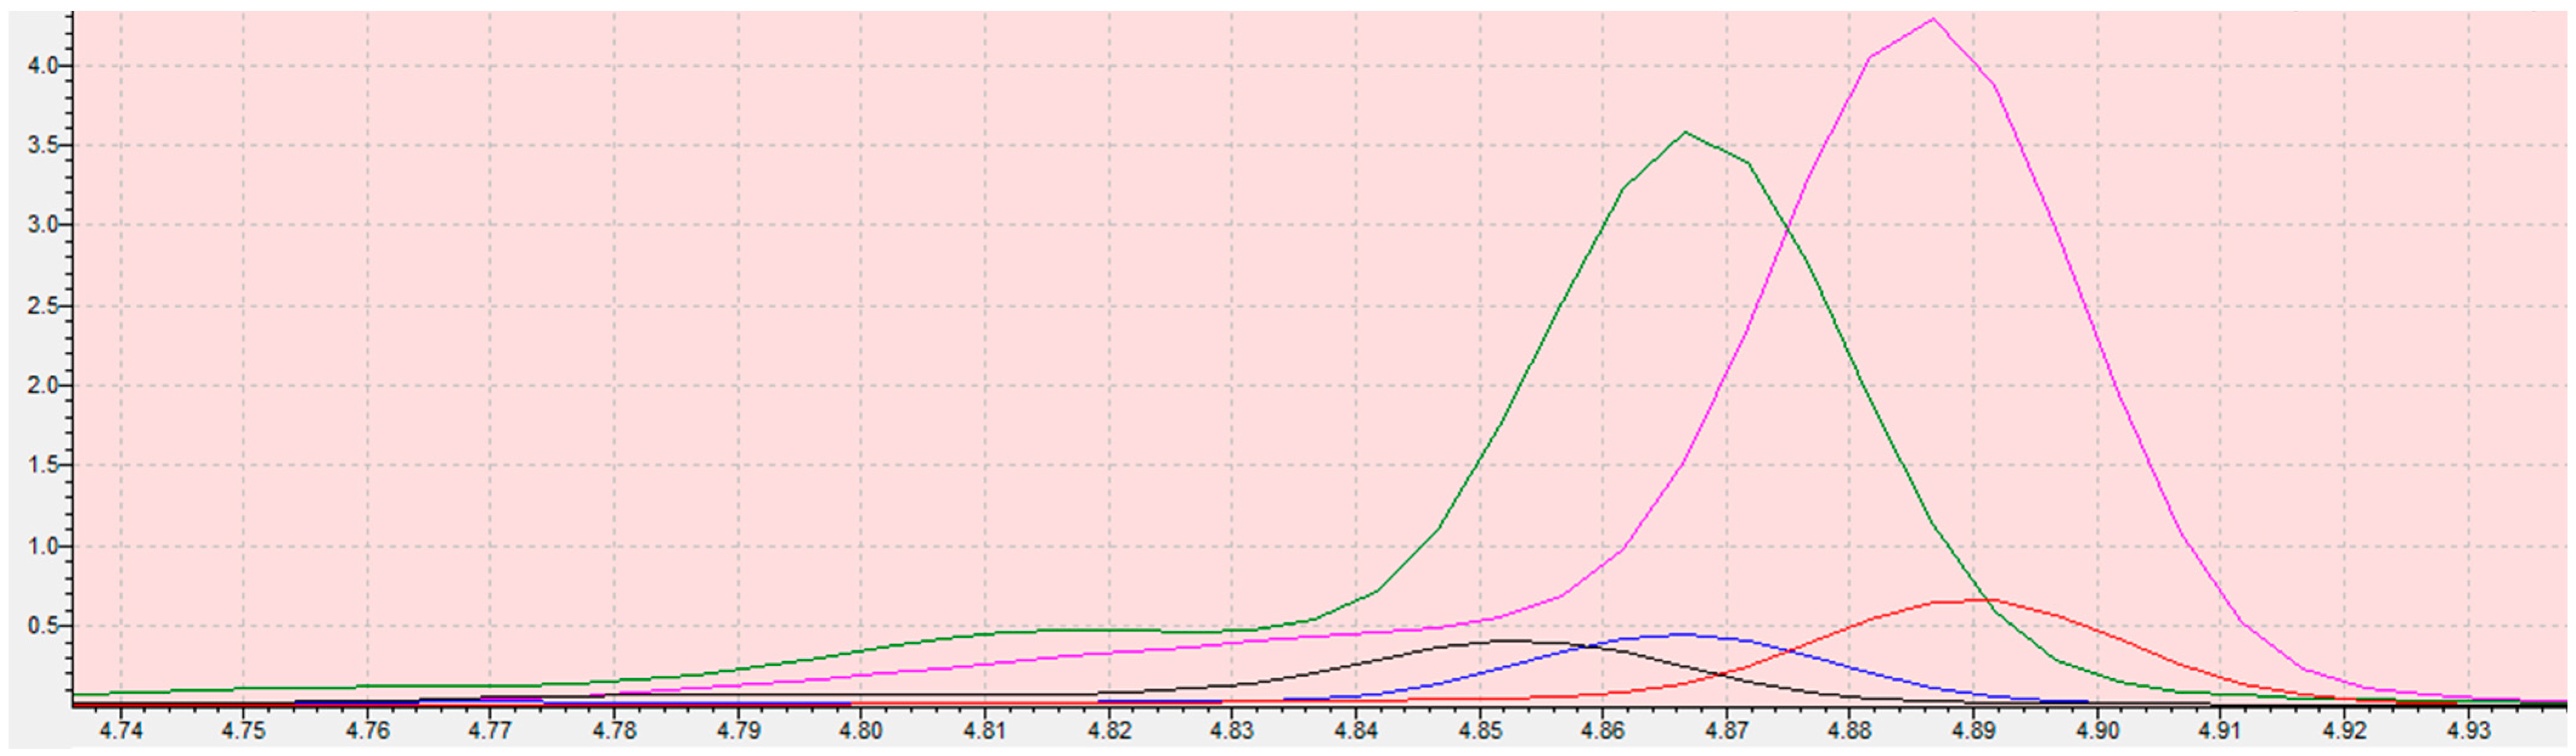
Based on the results of the experiment, the following observations were made: The addition of HCL (0.2M) to acetonitrile causes a significant increase in the signal for 2-chloroethanol; no signal from ethylene oxide was observed in those samples (MS-34 and MS-35).
The addition of supersaturated aqueous NaCl instead of water further increases the signal level for 2-CE (MS-35E).
For samples MS-31A, MS-32B, and MS-33C, EtOs signal was increased, compared to samples prepared differently.
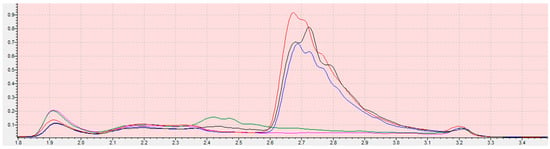
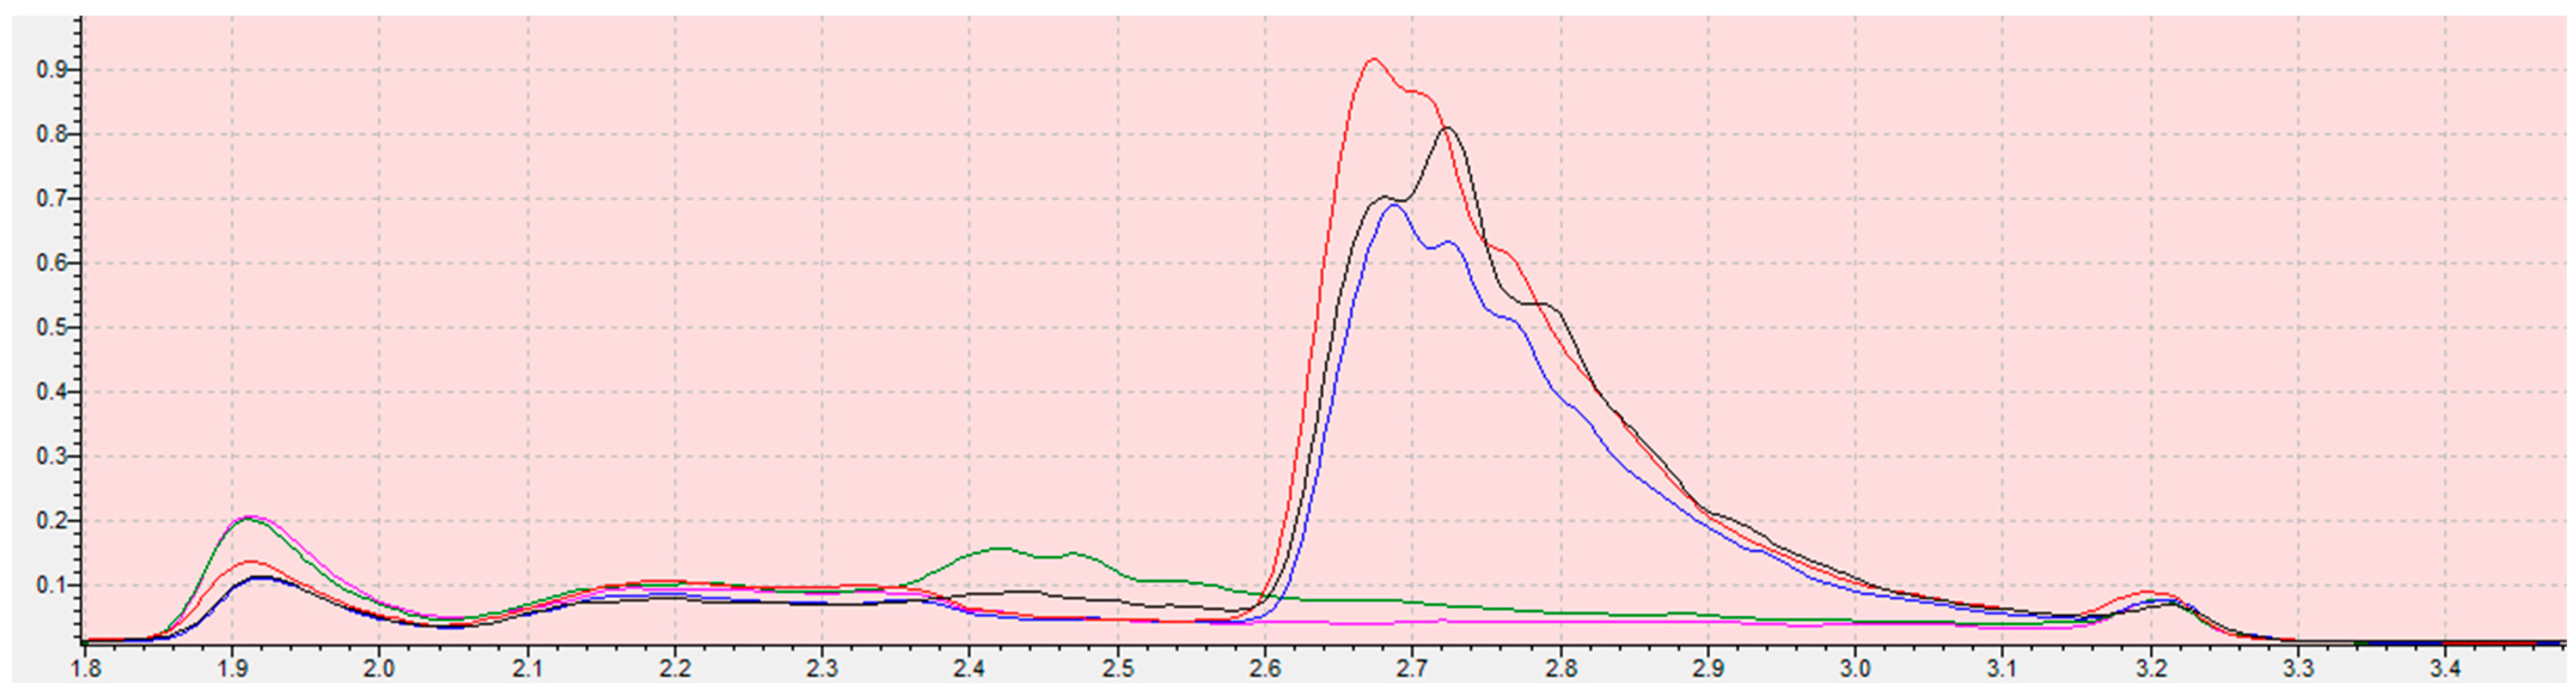
Figure 7.
Chromatogram of ethylene oxide in sesame seed matrix (sample: MS31A (black), MS32B (red), MS33C (blue), MS34D (green), MS35E (pink)). The scope of the integration is contained in the interval from 2.55 to 3.15 for all samples. Retention time of ethylene oxide is 2.646 min ± 0.1 min. The X-axis is the total ion current (TIC), the Y-axis is the retention time of the compound.
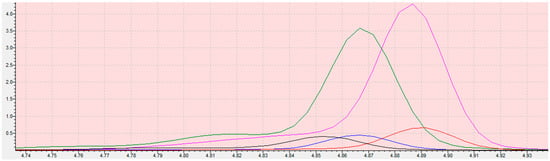
Figure 8.
Chromatogram of 2-chloroethanole in sesame seeds matrix (sample: MS31A (black), MS32B (red), MS33C (blue), MS34D (green), MS35E (pink)). The scope of the integration is contained in the interval 4.74 to 4.93. Retention time of ethylene oxide is 4.862 min ± 0.1 min. The X-axis is the total ion current (TIC), the Y-axis is the retention time of the compound.
The assayed extracts were injected directly into the apparatus and filtered through a PTFE filter and then injected, which significantly absorbed the amount of 2-chloroethanol in the extract obtained.
4.6. Optimization of Extraction and Purification Conditions
Since spices are a complex food matrix of plant origin for the detection of pesticide residues at trace concentrations, it is necessary to take steps to purify the initial extracts and remove residual water in order to ensure the selectivity of detection. The final amount of the appropriate salts (sample low water content: 200 mg PSA, C18; sample high water content and oil: 400 mg PSA, C18) has been carefully selected and their amount depends on the chemical composition of the plant sample.
PSA is a weak anion exchange sorbent that effectively removes polar components from the food matrix, such as organic acids (in this case chlorogenic acid), polar pigments, and sugars. Anhydrous MgSO4 was used to remove residual water from the extract. GCB was not used in the procedure due to the great difficulty of its removal from the extract. Although, GCB is extremely useful for removing pigments, especially those for which PSA is ineffective (Figure 9).
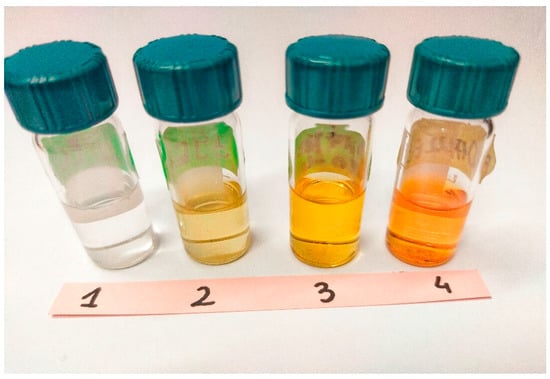
Figure 9.
Final extracts: 1. sesame seeds; 2. guar gum; 3. turmeric; 4. a mixture of spices.
5. Results and Discussion
Ethylene oxide is a dangerous chemical sterilant that poses a threat due to its high toxicity to human health as a result of occupational exposure to its impact, as well as high fire and explosion hazards (2.4% by volume). Sterilization with this agent is carried out at normal temperature and pressure, which is why it is classified as a cold sterilization technique due to its bactericidal effect and wide penetration of the materials being sterilized. In the USA, it is used as a pesticide and sterilizing agent in the food industry [5].
European Union law requires food monitoring based on compliance with regulations and thus sets the maximum permissible limits for the content of plant protection products that may have a negative impact on health. This is also the case with ethylene oxide content. Reports published in the RASFF database of exceedances of ethylene oxide levels in sesame seeds resulted in increased control of this parameter [1,12].
One of the first methods developed for the determination of ethylene oxide was presented by Jansen, which involved the reaction of converting 2-chloroethanol to ethylene oxide using sodium hydroxide, and its conversion to ethylene iodohydrin (EIH) in the presence of dilute sulfuric acid and sodium iodide [13].
Chromatographic analysis of ethylene oxide in food requires many steps to prevent losses of this compound in the analyzed sample due to its high volatility at room temperature. Analysis of ethylene oxide at a trace level requires a special approach and adaptation to the equipment resources of laboratories, which is why laboratories have developed a variety of methods for determining the full definition of ethylene oxide. Bessaire et al., 2021 presented a comparison of the results of samples run by five different laboratories that used different analytical procedures. None of the laboratories detected ethylene oxide in the six samples analyzed, while only 2-chloroethanol was detected during the analyses of the samples, ranging from 0.18 to 49.0 mg/kg [14].
Madsen et al., developed two SPME-GC/MS analysis methods in a low-viscosity hydroxypropyl methylcellulose that can be used as a food protection film. The range of the calibration curves for ethylene oxide was 10–100 mg/kg, and for 2-chloroethanol it was 20–120 mg/kg. The SPME fiber (85 mm Carboxen/PDMS) was used for this analysis. The characteristic of this method is that it avoids falsification of the ethylene oxide result from acetaldehyde. These methods achieve LODs of <7.0 mg/kg and <20.0 mg/kg [15].
Our research has shown that the critical parameter during the analysis is to keep the temperature <10 °C. The effectiveness of the method has a large impact on the sample weight (4 g) and its homogeneity obtained as a result of the sample preparation procedure, such as crushing and grinding. During the development of the procedure, it was observed that the process of soaking in the water had a negative impact on the recovery at the lowest concentration level, and therefore this activity was abandoned. The developed process of initial sample preparation will result in obtaining sample homogeneity and recoveries in the range of 70–120% according to the SANTE 11312/2021 document. A similar sample preparation process was presented in the study by Patil et al. The authors also noted the above regularities, including the method of homogenization, an extraction temperature of <10 °C, and a 4g sample weight using 10 mL of ACN. As noted, the lower sample weight makes it harder to achieve a LOQ of 10 ng/g. The study also emphasized that extending the training time to 15 min allowed for a better recovery result in the tested samples [16].
Tateo and Bononi, while analyzing samples of spices, found that the main analyte, marker of fumigation was 2-chloroethanol, while ethylene oxide, due to its high reactivity and volatility, is practically undetectable in these types of products. The researchers also performed a derivatization reaction using 2 mL of 0.02 N H2SO4 and 200 mL of a saturated NaCl solution; the extraction solvent was ethyl acetate. The validation experiment was performed in three repetitions with the recoveries of 65.5% for pepper with 100–200 mg/kg and 70.6% for pepper with 400–500 mg/kg. By comparison, our method is based on similar physicochemical assumptions, in which, under the conditions of acid hydrolysis with the addition of water, it leads to the formation of the free acid 2-chloroethanol. Teteo et al. used sulfuric acid, while our procedure and experiments have shown that the best choice is to use HCl. Work on optimizing the method has ensured that the recovery that was obtained in our study oscillated within the range of 85.6–103.6% [17].
Treating the sample with sodium chloride in the presence of sulfuric acid before solvent extraction results in a rapid conversion of ethylene oxide to 2-chloroethanol, which was implemented in the study by Bononiet et al. The recovery obtained for a concentration of 0.05 mg/kg was 62.5%, and for a concentration of 1.10 mg/kg was almost 98.9%. The LOQ was set at 50 µg/kg [18]. The validation experiment conducted by us did not confirm an increased efficiency of obtaining better recovery at higher concentration levels. However, the critical aspect of achieving a high level of recovery at low concentrations in food samples is through the strict observance of conditions of analysis, such as temperature.
A different analytical approach was presented by Bessaire et al. The sample extraction method was a modification of the QuEChERS extraction method (EN 15662) with minor changes. Recovery was in the range of 87–104% at the tested levels (0.02, 0.04, and 0.1 mg/kg 2-chloroethanol) [19,20]. Similar parameters for the QuEChERS procedure, performed in accordance with the description of the EU reference laboratory for single residue methods (EURL SRM 2020), allow for achieving similar levels of recovery [10].
Based on the GC-MS/MS SCAN mode of operation, retention times were determined for the following compounds: ethylene oxide—2.646 min, 2-chloroethanols—4.862 min, 2-chloroethanols D4—4.870 min; optimization allowed for the selection of the appropriate MRM transitions that were used during the validation assay methods. The relevant MRM transitions are presented in Table 1. The obtained chromatogram in Figure 7 shows that the integration of the ethylene oxide peak in the food matrix is hindered due to peak tailing caused by the low retention time and high solvent influence. The chromatogram of 2-chloroethanol retains the shape of the Gauss curve, which is desirable in the chromatographic determination, and therefore the method described in the text is based on the reaction of derivatization of ethylene oxide to 2-chloroethanol as the most accurate way to determine the full definition of ethylene oxide in accordance with directive 868/2015. The analyses carried out confirmed the compliance with the SANTE/11312/2021 document as to the requirements for the use of mass spectrometry. The retention times of the registered compounds corresponded to retention times with a tolerance of ±0.1 min. Enrichment with an analyte, which is isotopically modified and suspected to be present in the sample, will also help to increase the confidence of the identification. Before selecting the appropriate level of enrichment, it was empirically checked whether the isotope-labelled compound 4D-2-chloroethanol used as the internal standard was pure, and that the spectrum of the basic compound 2-chloroethanol does not appear during the assay. Table 2 presents a tally of the results obtained during the method validation. The recoveries obtained at the first and second level of enrichment for each of the matrices meet the requirements of the document SANTE/11312/2021; the recoveries should be in the range of 70–120% and the RSD may not exceed 20%. The best recovery and RSD were obtained for the enriched samples of Carob and guar gum while there were slightly weaker recovery results for the sesame seeds samples. Nevertheless, the obtained results are satisfactory and allow us to conclude that the presented method can be implemented for 2-CE and EtO markings [21].
The literature describes single methods for the determination of the full definition of ethylene oxide in plant products such as guar gum, sesame and spices [13,14,17,18]. However, in one article, attempts were made to determine this compound in cereal samples and products with a high-water content [16]. Our method was optimized and verified in this study in terms of the diversity of plant matrix groups: dry samples and products with a high water and oil content. All performed validations met the requirements of document SANTE/11312/2021. After obtaining positive results from the validation experiment, commercial samples were analyzed and available proficiency tests were performed.
6. Conclusions
This article presents a simple, fast, and efficient method for the derivatization of ethylene oxide to 2-chloroethanol and the extraction of 2-chloroethanol from samples of plant-derived products, especially low-water, oily, and high-water products. Validation criteria such as homogeneity, sensitivity, accuracy, and precision meet the criteria in accordance with the guidelines presented in the applicable document SANTE/11312/2021. For each food matrix, the laboratory obtained satisfactory results in proficiency tests accredited according to ISO 17034, which is a reliable source of confirmation of the competence to conduct this analysis and the commercial use to monitor the level of 2-chloroethanol and indirectly ethylene oxide in food samples [22]. Due to the impressive conversion efficiency of ethylene oxide to 2-chloroethanol, the method is reproducible and proves the ruggedness and reproducibility of the method. Currently, the laboratory is conducting validation experiments to extend the scope of the method to other food matrices as well as substances that are food additives.
Although the process of food fumigation with ethylene oxide has been banned in the European Union, food imported from countries outside of the EU requires control and monitoring of this compound as this process is still used to prevent the appearance of microbiological contamination in other countries. The safety of plant-based foods is of particular concern as it is now being promoted as a key component of a balanced diet and consumption is likely to increase as a result. A fast and effective analytical method allows for the successful control of the safety of the food chain and fast reaction of supervisory authorities in the event of non-compliance with EU requirements. As a result of the use of simple and easy analytical methods, errors resulting from multi-stage preparation and difficulties in interpreting the results were eliminated. Well-developed analytical methods lend credibility to the position that food products sold on the market are safe and provide only beneficial values for human health.
Author Contributions
Conceptualization, I.W. and I.B.; methodology, I.W., I.B., K.D. and K.K.; software, I.W. and K.D.; validation, I.W.; formal analysis, I.W. and K.D.; writing—original draft preparation, D.D. and I.W.; visualization, D.D. and I.W.; supervision, I.W. All authors have read and agreed to the published version of the manuscript.
Funding
This research received no external funding.
Institutional Review Board Statement
Not applicable.
Informed Consent Statement
Not applicable.
Data Availability Statement
Data supporting reported results are stored at the Voivodship Sanitary and Epidemiological Station in Warsaw.
Conflicts of Interest
The authors declare no conflict of interest.
References
- Kowalska, A.; Manning, L. Food Safety Governance and Guardianship: The Role of the Private Sector in Addressing the EU Ethylene Oxide Incident. Foods 2022, 11, 204. [Google Scholar] [CrossRef] [PubMed]
- Fowles, J.; Mitchell, J.; McGrath, H. Assessment of cancer risk from ethylene oxide residues in spices imported into New Zealand. Food Chem. Toxicol. 2001, 39, 1055–1062. [Google Scholar] [CrossRef] [PubMed]
- Dunkelberg, H. Carcinogenic activity of ethylene oxide and its reaction products 2-chloroethanol, 2-bromoethanol, ethylene glycol and diethylene glycol. I. Carcinogenicity of ethylene oxide in comparison with 1,2-propylene oxide after subcutaneous administration in mice. Zentralblatt Fur Bakteriologie Mikrobiologie Und Hygiene. 1. Abt. Originale B Hygiene 1981, 174, 383–404. [Google Scholar] [PubMed]
- Przybyla, J.; Roney, N.; Abadin, H.; Alman, B.; Wohlers, D.W.; Barber, L.; Diamond, G.L.; Citra, M.; Agency for Toxic Substances and Disease Registry. Toxicological Profile for Ethylene Oxide. 2022. Available online: https://www.atsdr.cdc.gov/toxprofiles/tp137.pdf (accessed on 4 May 2023).
- Jildeh, Z.B.; Wagner, P.H.; Schöning, M.J. Sterilization of Objects, Products, and Packaging Surfaces and Their Characterization in Different Fields of Industry: The Status in 2020. Phys. Status Solidi 2021, 218, 2000732. [Google Scholar] [CrossRef]
- Regulation (EC) No 1107/2009; Regulation (EC) No 1107/2009 of the European Parliament and of the Council of 21 October 2009 concerning the placing of plant protection products on the market and repealing Council Directives 79/117/EEC and 91/414/EEC. The European Parliament and The Council of the European Union: Brussels, Belgium, 2009; pp. 1–50. Available online: https://eur-lex.europa.eu/legal-content/EN/TXT/PDF/?uri=CELEX:32009R1107 (accessed on 7 February 2023).
- European Commission. Common Position No. 47/97 adopted by the Council on 27 October 1997 with a view to adopting Directive 97/…/EC of the European Parliament and of the Council of…on the establishment of a Community list of food and food ingredient treated with ionizing radiation (97/C 389/03). Off. J. Eur. Commun. 1997, L389, 47–48. Available online: https://eur-lex.europa.eu/legal-content/EN/TXT/?uri=CELEX%3A51997AG1222%2803%29&qid=1533581982397 (accessed on 7 February 2023).
- Regulation (EU) 2021/2246; Commission Implementing Regulation (EU) 2021/2246 of 15 December 2021 Amending Implementing Regulation (EU) 2019/1793 on the Temporary Increase of Official Controls and Emergency Measures Governing the Entry into the Union of Certain Goods from Certain Third Countries Implementing Regulations (EU) 2017/625 and (EC) No 178/2002 of the European Parliament and of the Council. European Commission: Brussels, Belgium, 2021; pp. 5–34. Available online: https://eur-lex.europa.eu/eli/reg_impl/2021/2246/oj (accessed on 8 February 2023).
- European Commission. Commission Implementing Regulation (EU) 2020/1540 of 22 October 2020 Amending Implementing Regulation (EU) 2019/1793 as Regards Sesamum Seeds Originating in India (Text with EEA Relevance) European Commission, Directorate-General for Health and Food Safety; European Commission: Brussels, Belgium, 2020; pp. 4–7. Available online: https://eur-lex.europa.eu/legal-content/EN/TXT/?uri=CELEX%3A32020R1540 (accessed on 8 February 2023).
- EURL EU Reference Laboratories for Residues of Pesticides SRM. Community Reference Laboratory for Single Residue Methods. Analytical Observations Report, Analysis of Ethylene Oxide and Its Metabolite 2-Chloroethanol by the QuOil or the QuEChERS Method and GC-MS/MS. Version 1.1. 2020. Available online: https://www.eurl-pesticides.eu/library/docs/srm/EurlSrm_Observation_EO_V1.pdf (accessed on 4 May 2023).
- European Commission. Guidance Document on Analytical Quality Control and Method Validation Procedures for Pesticides Residues Analysis in Food and Feed. Document No SANTE/12682/2019. 2020. Available online: https://www.eurl-pesticides.eu/userfiles/file/EurlALL/AqcGuidance_SANTE_2019_12682.pdf (accessed on 4 May 2023).
- Allemang, A.; Lester, C.; Roth, T.; Pfuhler, S.; Peuschel, H.; Kosemund, K.; Mahony, C.; Bergeland, T.; O’Keeffe, L. Assessing the genotoxicity and carcinogenicity of 2-chloroethanol through structure activity relationships and in vitro testing approaches. Food Chem. Toxicol. 2022, 168, 113290. [Google Scholar] [CrossRef] [PubMed]
- Jensen, K.G. Determination of ethylene oxide residues in processed food products by gas-liquid chromatography after derivatization. Z. Für Lebensm. Unters. Und-Forsch. 1988, 187, 535–540. [Google Scholar] [CrossRef] [PubMed]
- Bessaire, T.; Eriksen, B.; Laborie, S.; Mujahid, C.; Mottier, P.; Delatour, T.; Panchaud, A.; Stadler, R.H.; Stroheker, T. Confirmation of the full conversion of ethylene oxide to 2-chloroethanol in fumigated foodstuffs: Possible implications for risk assessment. Food Addit. Contam. Part A 2023, 40, 81–95. [Google Scholar] [CrossRef] [PubMed]
- Madsen, R.B.; Termansen, M.; Mintert, M.; Huettermann, C.; Serr, B. Trace-level quantification of ethylene oxide and 2-chloroethanol in low-viscosity hydroxypropyl methylcellulose with solid phase microextraction and GC-MS. Food Addit. Contam. Part A 2022, 39, 1893–1905. [Google Scholar] [CrossRef] [PubMed]
- Patil, R.; Langade, N.; Nerpagar, A.; Anastassiades, M. Development and Validation of a Residue Analysis Method for Ethylene Oxide and 2-Chloroethanol in Foods by Gas Chromatography Tandem Mass Spectrometry. ACS Agric. Sci. Technol. 2023, 3, 287–295. [Google Scholar] [CrossRef]
- Tateo, F.; Bononi, M. Determination of ethylene chlorohydrin as marker of spices fumigation with ethylene oxide. J. Food Compos. Anal. 2006, 19, 83–87. [Google Scholar] [CrossRef]
- Bononi, M.; Quaglia, G.; Tateo, F. Identification of ethylene oxide in herbs, spices and other dried vegetables imported into Italy. Food Addit. Contam. Part A 2014, 31, 271–275. [Google Scholar] [CrossRef] [PubMed]
- Bessaire, T.; Stroheker, T.; Eriksen, B.; Mujahid, C.; Hammel, Y.A.; Varela, J.; Delatour, T.; Panchaud, A.; Mottier, P.; Stadler, R.H. Analysis of ethylene oxide in ice creams manufactured with contaminated carob bean gum (E410). Food Addit. Contam. Part A 2021, 38, 2116–2127. [Google Scholar] [CrossRef]
- Standard Method EN 15662; Food of Plant Origin–Determination of Pesticide Residues using GC–MS and/or LC–MS/MS following Acetonitrile Extraction/Partitioning and Clean-Up by Dispersive SPE-QuEChERS Method. European Committee for Standardization (CEN): Brussels, Belgium, 2008.
- Main Changes Introduced in Document N° SANTE/11312/2021 with Respect to the Previous Version (Document N° SANTE 12682/2019). Available online: https://food.ec.europa.eu/system/files/2022-02/pesticides_mrl_guidelines_wrkdoc_2021-11312.pdf (accessed on 18 September 2022).
- ISO/IEC 17034; General Requirements for the Competence of Reference Material Producers. International Organization for Standardization: Geneva, Switzerland, 2016.

Disclaimer/Publisher’s Note: The statements, opinions and data contained in all publications are solely those of the individual author(s) and contributor(s) and not of MDPI and/or the editor(s). MDPI and/or the editor(s) disclaim responsibility for any injury to people or property resulting from any ideas, methods, instructions or products referred to in the content. |
© 2023 by the authors. Licensee MDPI, Basel, Switzerland. This article is an open access article distributed under the terms and conditions of the Creative Commons Attribution (CC BY) license (https://creativecommons.org/licenses/by/4.0/).