Article

Assessment of the Impact of Climate Change on Streamflow and Sediment in the Nagavali and Vamsadhara Watersheds in India

by
Nageswara Reddy Nagireddy
1,
Venkata Reddy Keesara
1,
Gundapuneni Venkata Rao
1,
Venkataramana Sridhar
2,* and
Raghavan Srinivasan
3
1
Department of Civil Engineering, National Institute of Technology Warangal, Telangana 506004, India
2
Department of Biological Systems Engineering, Virginia Polytechnic Institute and State University, Blacksburg, VA 24061, USA
3
Spatial Sciences Laboratory, Texas A&M University & Texas A&M Agrilife Blackland Research & Extension Center, College Station, TX 77843, USA
*
Author to whom correspondence should be addressed.
Appl. Sci. 2023, 13(13), 7554; https://doi.org/10.3390/app13137554
Submission received: 14 May 2023 / Revised: 22 June 2023 / Accepted: 25 June 2023 / Published: 26 June 2023

Abstract

:
Climate-induced changes in precipitation and temperature can have a profound impact on watershed hydrological regimes, ultimately affecting agricultural yields and the quantity and quality of surface water systems. In India, the majority of the watersheds are facing water quality and quantity issues due to changes in the precipitation and temperature, which requires assessment and adaptive measures. This study seeks to evaluate the effects of climate change on the water quality and quantity at a regional scale in the Nagavali and Vamsadhara watersheds of eastern India. The impact rainfall variations in the study watersheds were modeled using the Soil and Water Assessment Tool (SWAT) with bias-corrected, statistically downscaled models from Coupled Model Intercomparison Project-6 (CMIP-6) data for historical (1975–2014), near future (2022–2060), and far future (2061–2100) timeframes using three Shared Socioeconomic Pathways (SSP) scenarios. The range of projected changes in percentage of mean annual precipitation and mean temperature varies from 0 to 41.7% and 0.7 °C to 2.7 °C in the future climate, which indicates a warmer and wetter climate in the Nagavali and Vamsadhara watersheds. Under SSP245, the average monthly changes in precipitation range from a decrease of 4.6% to an increase of 25.5%, while the corresponding changes in streamflow and sediment yield range from −11.2% to 41.2% and −15.6% to 44.9%, respectively. Similarly, under SSP370, the average monthly change in precipitation ranges from −3.6% to 36.4%, while the corresponding changes in streamflow and sediment yield range from −21.53% to 77.71% and −28.6% to 129.8%. Under SSP585, the average monthly change in precipitation ranges from −2.5% to 60.5%, while the corresponding changes in streamflow and sediment yield range from −15.8% to 134.4% and −21% to 166.5%. In the Nagavali and Vamsadhara watersheds, historical simulations indicate that 2438 and 5120 sq. km of basin areas, respectively, were subjected to high soil erosion. In contrast, under the far future Cold-Wet SSP585 scenario, 7468 and 9426 sq. km of basin areas in the Nagavali and Vamsadhara watersheds, respectively, are projected to experience high soil erosion. These results indicate that increased rainfall in the future (compared to the present) will lead to higher streamflow and sediment yield in both watersheds. This could have negative impacts on soil properties, agricultural lands, and reservoir capacity. Therefore, it is important to implement soil and water management practices in these river basins to reduce sediment loadings and mitigate these negative impacts.

1. Introduction

The impacts of climate change on the hydrological cycle and water budgets have been extensively studied, and the findings highlight significant changes from global to regional scales [1,2]. Changes in temperature and precipitation caused by climate change can affect the flow and transport of sediment in watersheds [3]. These changes in streamflow can affect water availability, which can then impact irrigation, urban water supply, and hydropower production [4,5]. Additionally, changes in sediment load can affect river geomorphology, river ecosystems, and reservoir capacity [6]. According to the Intergovernmental Panel on Climate Change (IPCC), worldwide average precipitation and temperature at the surface, floods, and droughts have changed significantly and are expected to continue to do so [7]. Developing countries, such as India, are especially susceptible to the consequences of climate change on agriculture and water [8,9,10]. Climate change is also affecting soil types, as soil erosion and sediment yield are controlled by rainfall and runoff [11,12,13]. Overall, climate change is altering the hydrological process by changing rainfall patterns and the timing and magnitude of streamflow. In recent years, the importance of streamflow forecasting has gained significant recognition [14,15]. On the other hand, streamflow prediction plays a vital role in long-term water resources planning and management [16,17,18]. Streamflow predictions are based on climate models and scenarios, which provide insights into potential changes in streamflow patterns under different climate change scenarios [11,19,20]. There have been many studies on the consequences of climate change using Global Circulation Models (GCMs) [21,22,23]. Performing the ensemble mean of multiple GCMs blindly may account for the uncertainty caused by the presence of poor model performance. Furthermore, consideration of all models is thought to be constrained by time and computational resources. Alternatively, some climate change studies used different statistical metrics (root-mean-square error, correlation coefficients, standard deviation, skill scores, etc.) for model selection [24,25].
Understanding the flow of water and sediment in streams is essential for predicting the consequences of climate change on the environment. Researchers have used various methods, including empirical, statistical, and simulation techniques, to study these impacts. One model that has proven to be reliable in these analyses is the SWAT model, which is able to accurately assess hydrological and environmental changes in different land types and climate conditions [26,27,28]. It also includes output components that allow for the analysis of various water-related systems in watersheds. Recent studies have used the SWAT model to evaluate the consequences of changing the climate on streamflow and sediment load [22,29,30]. For example, Mohseni et al. (2023) [18] used the SWAT model to evaluate the impact of climate change and land use change on streamflow over the Parvara Mula Basin, India. The findings of the study indicate an increase in streamflow for future periods. Ma et al. (2021) [31] used the model to study the upstream region of the Mekong Basin, finding that both temperature and precipitation were projected to increase, while changes in sediment load were inconsistent. Pandey and Palmate (2019) [32] identified critical sub-watersheds in the Betwa Basin, India that were most vulnerable to sediment yield under both current and future climate conditions using SWAT model. This information can be used to prioritize and manage these areas for better water resource management. Several studies have been conducted in recent years to better comprehend the consequences of changing climate on streamflow and sediment in various watersheds around the world. Azari et al. (2016) [33] assessed the consequences of climate change on streamflow and sediment yield in the Gorganroud watershed, Iran using the SWAT model. They observed that climate change had a greater consequence on sediment yield compared to streamflow. Overall, these studies highlight the importance of considering the consequences of climate change on river systems and need for proactive measures to mitigate and adapt to these impacts. Nilawar and Waikar (2019) [11] analyzed the effects of two RCP scenarios, 4.5 and 8.5, on streamflow and sediment at the Purna River Basin, India. They found that both of these variables increased during the monsoon months. Jin et al. (2018) [34] investigated the consequences of changing climate as well as socioeconomic conditions on the Mahanadi River watershed using the Integrated Catchment Model (INCA). They assessed future flows, changes in irrigation water demand, and the impact of changing land uses under various Shared Socioeconomic Pathways (SSPs). According to the findings of this study, monsoon flows are expected to significantly increase in the 2050s and 2090s under future climate conditions, and socioeconomic factors have a significant impact on water quality. Rao et al. (2020) [35] forecasted future variations in rainfall extremes throughout the northeast monsoon period over southern India using statistically downscaled high-resolution NEX-GDDP datasets. They found that rainfall would increase in future. Similarly, Mishra et al. (2020) [36] estimated the frequency of temperature and rainfall extremes over the Godavari River Basin using bias-corrected CMIP6 projections, finding that the far period had higher frequencies than the near-term climate. Hengade et al. (2018) [37] investigated the consequences of future daily rainfall on the hydrology of the Godavari Basin under the CMIP5 and two RCP scenarios, 4.5 and 8.5, and discovered an increase in future rainfall. The multimodel mean Indian monsoon rainfall also showed an increasing trend. Pandey et al. (2017) [38] quantified the consequences climate change on the hydrology of the Armur watershed in the Godavari basin using SWAT model, concluding that an increase in mean annual temperature, rainfall, evapotranspiration, and water yield is expected under GHG scenarios in the future period. Singh and Saravanan (2020) [8] predicted the future hydrological component responses under RCP 4.5 and 8.5 scenarios over the Wunna, Mahanadi, and Bharathpuzha watersheds, with their results showing that surface runoff and sediment are expected to increase over the watersheds. Finally, Swain (2014) [39] investigated the consequences of climate variability on the Mahanadi Basin and concluded that the effects would be severe for India’s river basins. The findings suggest that the basin is prone to flooding and that the intensity may be severe in the future. Furthermore, rising mean temperatures and other issues such as silt deposition and storms in the Bay of Bengal may aggravate the situation.
Nagavali and Vamsadhara watersheds in India are two important interstate east-flowing tropical rivers that are prone to frequent flooding and are situated between the Godavari and Mahanadi basins. These watersheds are primarily used for agriculture, domestic, and drinking purposes. The Nagavali watershed has three major reservoirs—Madduvalasa, Thotapalli, and Janjavathi reservoirs—and three minor reservoirs—Vottigedda Vengalarayasagar, and Vegavathi reservoirs. The Vamsadhara watershed has three reservoirs—Badnalla, Harabhangi, and Gotta barrage. Both watersheds are prone to flooding, resulting in upland soil erosion and sediment deposition in the channels and reservoirs. Every year, erosion and deposition take place, leading to a reduction in reservoir storage capacity. The Gotta barrage on the Vamsadhara watershed lost approximately 62 percent of its live storage between 1977 and 2004 [40]. Amminedu et al. (2013) [41] conducted soil erosion studies in the Vamsadhara Basin and discovered that the region with minimal vegetation and shifting cultivation, combined with heavy precipitation on steep slopes, resulted in the loss of fine fertile topsoil with runoff, leading to the sedimentation and silting up of the drainage course in the lower reach of the Vamsadhara watershed. Rao et al. (2020) [42] conducted spatio-temporal assessment of rainfall extremes over the Nagavali and Vamsadhara watersheds. According to Rao et al. [42,43], there has been an increase in annual rainfall for these two river basins at a rate of 2 mm and 8 mm per decade, respectively, and an increase in monsoon rainfall at a rate of 4 mm and 9 mm per decade. Increased rainfall is expected to increase soil erosion and sediment yield in the future. In addition, according to Ge et al. (2021) [44], future monsoon rainfall forecasts from CMIP3 to CMIP6 models indicate that the Asian region will experience intensification and an increase in precipitation extremes. This will have significant impacts on the socioeconomic sectors of these regions. As of now, climate change analysis using a multimodel ensemble of CMIP5 data under RCP scenarios has been conducted for the Mahanadi and Godavari basins.
The aforementioned previous studies have already highlighted the adverse effects of climate change on precipitation patterns, with increased rainfall rates observed in the Godavari and Mahanadi basins. The Nagavali and Vamsadhara watersheds are located between the Godavari and Mahanadi basins. However, a comprehensive regional assessment of streamflow and sediment response to climate change is lacking in these specific watersheds. Thus, the motivation for our study is to understand the potential changes in streamflow and sediment dynamics resulting from climate change, which will provide valuable insights into the future water availability, soil erosion, and sediment yield in the Nagavali and Vamsadhara watersheds. The state government of Andhra Pradesh has planning to interlink Nagavali and Vamsadhara watersheds, which is aimed at improving the water resources management for agricultural as well as domestic purposes. Hence, this study can be impactful in making decisions regarding the interlinking project. The novelty of this study lies in considering the Warm-Wet, Cold-Wet, Cold-Dry, and Warm-Dry analyses over the Nagavali and Vamsadhara river basins under various Shared Socio-economic Pathway scenarios (SSPs). The results of this research will be useful for developing adaptive strategies for managing soil and water resources in the face of climate change. Additionally, understanding how streamflow and sediment load may be affected by climate change can provide policymakers with the scientific evidence needed to create sustainable watershed management plans.

2. Materials and Methods

2.1. Study Area

The Nagavali and Vamsadhara watersheds are two significant water sources that flow through the eastern regions of northern Andhra Pradesh and southern Odisha (Figure 1). These medium-sized river basin watersheds are mainly used for agricultural purposes. The tribal communities reside in the two river basins and carry out their daily agricultural practices. The tribal people directly use the river water for their domestic and drinking purposes. Furthermore, these rivers are crucial lifelines for farmers in southern Odisha and northern Andhra Pradesh. The Nagavali and Vamsadhara rivers both originate near the villages of Lakhbahal and Lanjigarh in the Kalahandi district of Odisha, respectively. They both travel a distance of 256 and 254 km and have watershed areas of 9200 and 10,450 sq. km, respectively, before emptying into the Bay of Bengal near the Srikakulam district. These river basins are mainly influenced by the Southwest monsoon and cyclonic rainfall caused by depressions in the Bay of Bengal.

2.2. Datasets

2.2.1. Spatial Data

In this study, we utilized several types of spatial data to analyze the Nagavali and Vamsadhara watersheds. These included a digital elevation model (DEM) obtained from the Shuttle Radar Topography Mission (SRTM) through the USGS Earth Explorer website, a Land Use Land Cover (LULC) dataset from NRSC Bhuvan, and a soil map from the International Soil Reference and Information Centre (ISRIC). The SRTM DEM was used to define the watersheds, classify slopes, and extract stream networks in the two river basins. We considered 0–2%, 2–8%, and more than 8% slope bands in both watersheds. The LULC data from 2005 were used to identify the various land cover types present in the watersheds. In the Nagavali watershed, agricultural land accounted for 43% of the area, followed by 34% forest, 19% barren land, 2.91% water bodies, and 1.15% built-up land. In the Vamsadhara watershed, 51.1% of the area was covered by forest, 29.3% was agricultural land, 17.23% was barren land, 1.84% was water bodies, and 0.44% was built-up land. We compared the LULC data from 2005 with those of 2015 and identified an increase of 2–3% in agricultural land and a corresponding decrease of 2–3% in barren land in both basins. This change can be attributed to shifting cultivation by tribal people. The 1 km resolution soil map provided information on the different soil textures present in the basins, which included sandy loam, loam, clay loam, sandy clay loam, and clay soil.

2.2.2. Weather Data

Daily gridded rainfall data with a spatial resolution of 0.25° × 0.25° and maximum and minimum temperature datasets with a resolution of 1° × 1° were obtained from the Indian Meteorological Department (IMD) website. The average yearly rainfall for the Nagavali and Vamsadhara watersheds for the period of 1901–2018 is 1230 and 1260 mm, respectively.

2.2.3. Climate Models Data

The study utilized a bias-corrected dataset created by Mishra et al. (2020) [45] with a high resolution of 0.25° × 0.25° for historic and projected climates for the four SSP scenarios in South Asia. The dataset was developed using the Empirical Quantile Mapping (EQM) method and output from 13 GCMs as part of CMIP6. Mishra et al. (2020) [36] compared the dataset against observations for average and extreme rainfall and maximum and minimum temperatures using daily rainfall and temperature data from IMD for the Indian region. The authors found a dry bias in average annual rainfall for most of South Asia, a significant cold bias in the Himalayan region for mean annual maximum and minimum temperatures, and a warm bias in average annual minimum temperature for most of South Asia, excluding the Himalayas, by calculating the multi-model ensemble mean bias in rainfall and maximum and minimum temperatures. To rectify the bias in the CMIP6-GCM output, the EQM approach was used at the daily timescale. The bias correction substantially reduced the bias in all three variables, and the bias-corrected dataset was able to accurately capture the co-variability of monsoon season rainfall and air temperature. The study predicts that South Asia will have a warmer and wetter climate in the 21st century, with a rise of 3–5 °C in temperature and 13–30% in rainfall.

2.2.4. Shared Socio-Economic Pathways (SSPs)

Socio-economic changes, such as population growth, development of industries, and agriculture and land use change, can greatly impact the streamflow and water quality in watersheds. To address these issues, it is important to consider socio-economic pathways as a way to integrate the social aspects of future changes. According to IPCC, there are five different socio-economic pathways (SSPs) that can be used to analyze these changes. These SSPs include: SSP1 stands for Sustainability, SSP2 stands for Business as Usual, SSP3 stands for Fragmented World, SSP4 stands for Inequality Rules, and SSP5 stands for Regular Progress in terms of energy sources. Three SSP-based scenarios were considered in this study: SSP2, SSP3, and SSP5, which represent “medium, medium −, and medium +”, respectively. These scenarios are regionally specific and align with the RCP 8.5 scenario [34,46]. The medium − and medium + scenarios indicate low and high growth in the economy, respectively.

2.2.5. Hydrological Data

In this study, daily streamflow and sediment concentration data from the Srikakulam station in the Nagavali watershed and the Kashinagar station in the Vamsadhara watershed were used. These data obtained from the Central Water Commission (CWC), Orissa, India. The yearly average streamflow in the Nagavali and Vamsadhara watersheds is 79 m3/s and 82 m3/s, respectively, with an annual average sediment load of 3.7 million tons in both basins.

2.3. Methodology

The goal of the present study is to examine the potential impacts of climate change on streamflow and sediment yield in the Nagavali and Vamsadhara watersheds for three timeframes, historical (1975–2014), near future (2022–2060), and far future (2061–2100). A calibrated SWAT model was used to simulate both historical and future scenarios, taking climate change projections into account. The research framework, illustrated in Figure 2, involves several steps to achieve the goal. Initially, DEM, LULC, soil, meteorological variables, hydrological and sediment concentration data were collected and prepared for SWAT model format. The SWAT model was set up with the prepared input data, including details of reservoirs and existing agricultural management conditions and simulations were carried out for using meteorological data. Calibration and validation [47] was performed then the calibrated SWAT model was updated with fitted parameters and climate model data. Simulations were carried out for historical and future climate data for impact assessment under different climate models (dry, warm, wet, and cold) and SSP scenarios.

2.4. Model Setup

The SWAT model is a complex, ongoing system developed by the United States Agricultural Department to analyze and predict hydrologic processes over long time periods. It is designed to simulate the flow of water, surface runoff, sediment yield, and nutrient and chemical loads in agricultural settings on a daily basis. The model has been thoroughly documented by Neitsch et al. (2011) [48] and has been widely studied and refined by [49,50,51]. To begin with, the SWAT model was constructed using projected DEM (digital elevation model), landuse, and soil maps; in this study, WGS 1984 UTM 44N was used as a projection. The Nagavali watershed was split into 34 sub-basins and 2153 hydrological response units (HRUs), while the Vamsadhara watershed was split into 30 sub-basins and 2183 HRUs based on homogeneity of spatial data and a threshold area of 100 ha, using the QSWAT tool on the QGIS interface. The SWAT model was then fed with IMD precipitation data as well as maximum and minimum temperature and reservoir information for simulations. The SWAT model was initially calibrated and validated using streamflow and sediment data.

2.5. Selection and Shortlisting of Downscaled GCMs

The range of projections from global circulation models (GCMs) is quite broad, with high levels of uncertainty [52]. The GCMs were downscaled to higher resolution (0.25° × 0.25°) by considering local topographic and physical characteristics, which have gained popularity due to accurate and reliable estimation of future earth climate scenarios in regional hydrological impact studies [17,18,20,36]. Even after downscaling, future climate projections can vary significantly from one another, ranging from very wet to extremely dry or from extremely hot to very cold. As a result, the models can be classified as representing the Warm-Wet, Warm-Dry, Cold-Wet, and Cold-Dry corners of the full spectrum. In the present study, model behavior with respect to future in terms of precipitation and temperature is considered. From the available 13 models under the SSP245, SSP370, and SSP585 scenarios, a selection was made based on the changes in average annual precipitation (ΔP) and average temperature (ΔT) across the Nagavali and Vamsadhara watersheds between the model’s historic data (1975–2015) and the projected future data (2022–2100). Additional details on the selection and shortlisting of the models are available in Nagireddy et al. (2022) [47]. According to Khan and Koch (2018) [53], the 10th, 50th, and 90th percentile values for ΔP and ΔT were first calculated as the goal was to select a few models that best represent the four corners and the center of the entire spectrum as shown in Table 1.

3. Results and Discussion

3.1. Shortlisting of Climate Models

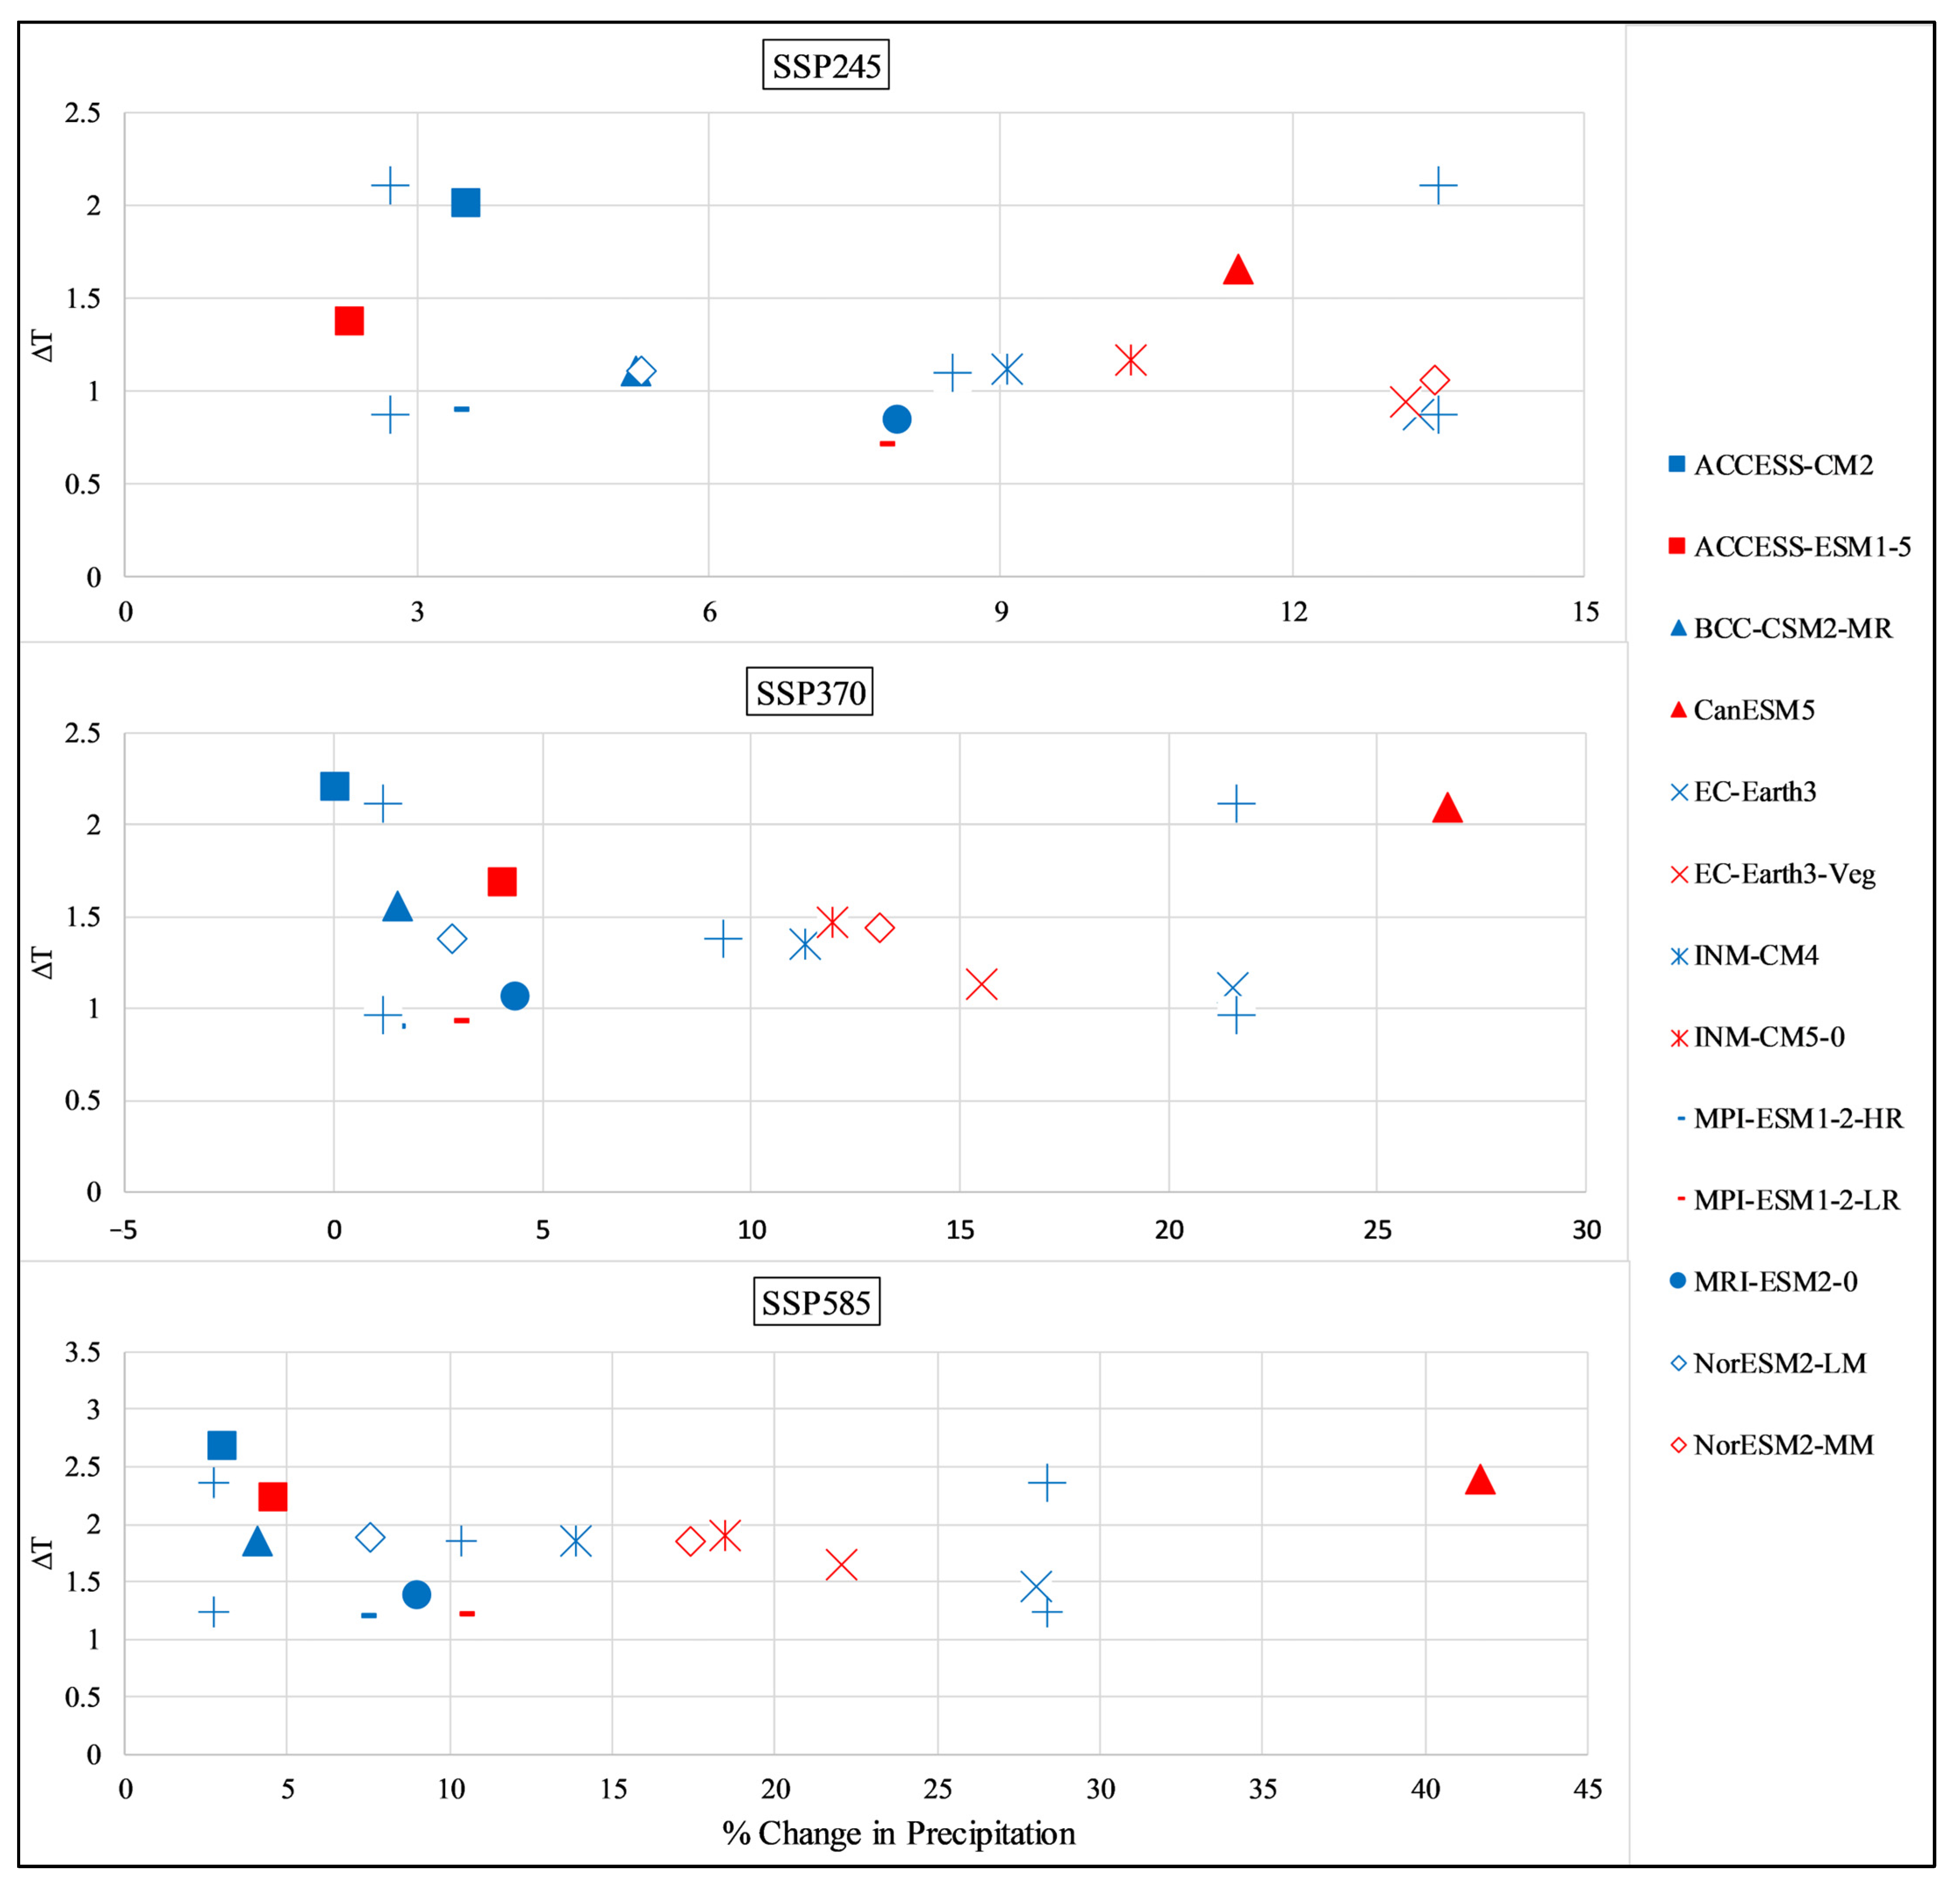
The results of the shortlisting process for the downscaled General Circulation Models (GCMs) are presented in Figure 3. According to the Shared Socioeconomic Pathway (SSP) 245 scenario, the range of percentage change in mean annual precipitation (ΔP) and change in mean temperature (ΔT) in the future is between 2.3% and 13.5% and 0.7 °C to 2 °C, respectively. Under the SSP 370 scenario, the range is between 0% and 26.7% for ΔP and 0.89 °C to 2.2 °C for ΔT. For the SSP 585 scenario, the range is 3% to 41.69% for ΔP and 1.2 °C to 2.67 °C for ΔT. All available models predict an increase in mean rainfall and temperature in the future in all scenarios. During this process, the GCMs in all scenarios were evaluated based on the 10th, 50th, and 90th percentile values of ΔT (°C) and ΔP (%). Based on this approach, the Cold-Wet, Cold-Dry, Warm-Wet, Warm-Dry, and central models are shown in Table 2. It is important to note that the phrase “Cold” in the “Wet-Cold” and “Dry-Cold” models refers to a lower level of warming compared to the Warm models, rather than a future temperature that is colder than the reference period. Correspondingly, the phrase “Dry” in the “Dry-Cold” and “Dry-Warm” models refers only to their position in comparison to other climate models.

3.2. Consequence of Climate Change on Precipitation

The SWAT model was calibrated and validated for simulations of streamflow and sediment load over the Nagavali and Vamsadhara watersheds. The sensitivity analysis, parameters, and their fitted values and statistics were found in Nagireddy et al. (2022) [47]. When contrasted with standard model statistics, statistical results for the SWAT model setup for the Nagavali and Vamsadhara watersheds were good [54].
The average annual precipitation for the Nagavali and Vamsadhara watersheds over a period of 40 years (1975–2014) is 1259 mm and 1314 mm, respectively. Table 3 shows the percentage bias between the precipitation predicted by the IMD gridded model and climate models for these watersheds. The climate models exhibited varying predictions, ranging from −4.73% to 1.59% for the Nagavali watershed and −2.86% to 3.71% for the Vamsadhara watershed (Table 3). Four climate models (Ecearth3, MPI-ESM1-2HR, CanESM5, and INMCM4) slightly underestimate the precipitation, while the ACCESS-CM2 model slightly overestimates it in both watersheds.
Table 4 presents the percentage change in precipitation predicted by climate models for the near future (2022–2060) and far future (2061–2100) compared to historical data (1975–2014) in both watersheds. The Cold-Dry model consistently underestimated precipitation across all three scenarios (SSP245, SSP370, and SSP585) in the near future. During the near future, the Warm-Wet model showed the highest overestimation of precipitation under the SSP370 and SSP585 scenarios, while the Cold-Wet model showed the greatest overestimation under the SSP245 scenario. In the far future, the Warm-Wet and Cold-Wet models showed the highest overestimation of precipitation, while the Warm-Dry model showed the lowest overestimation.
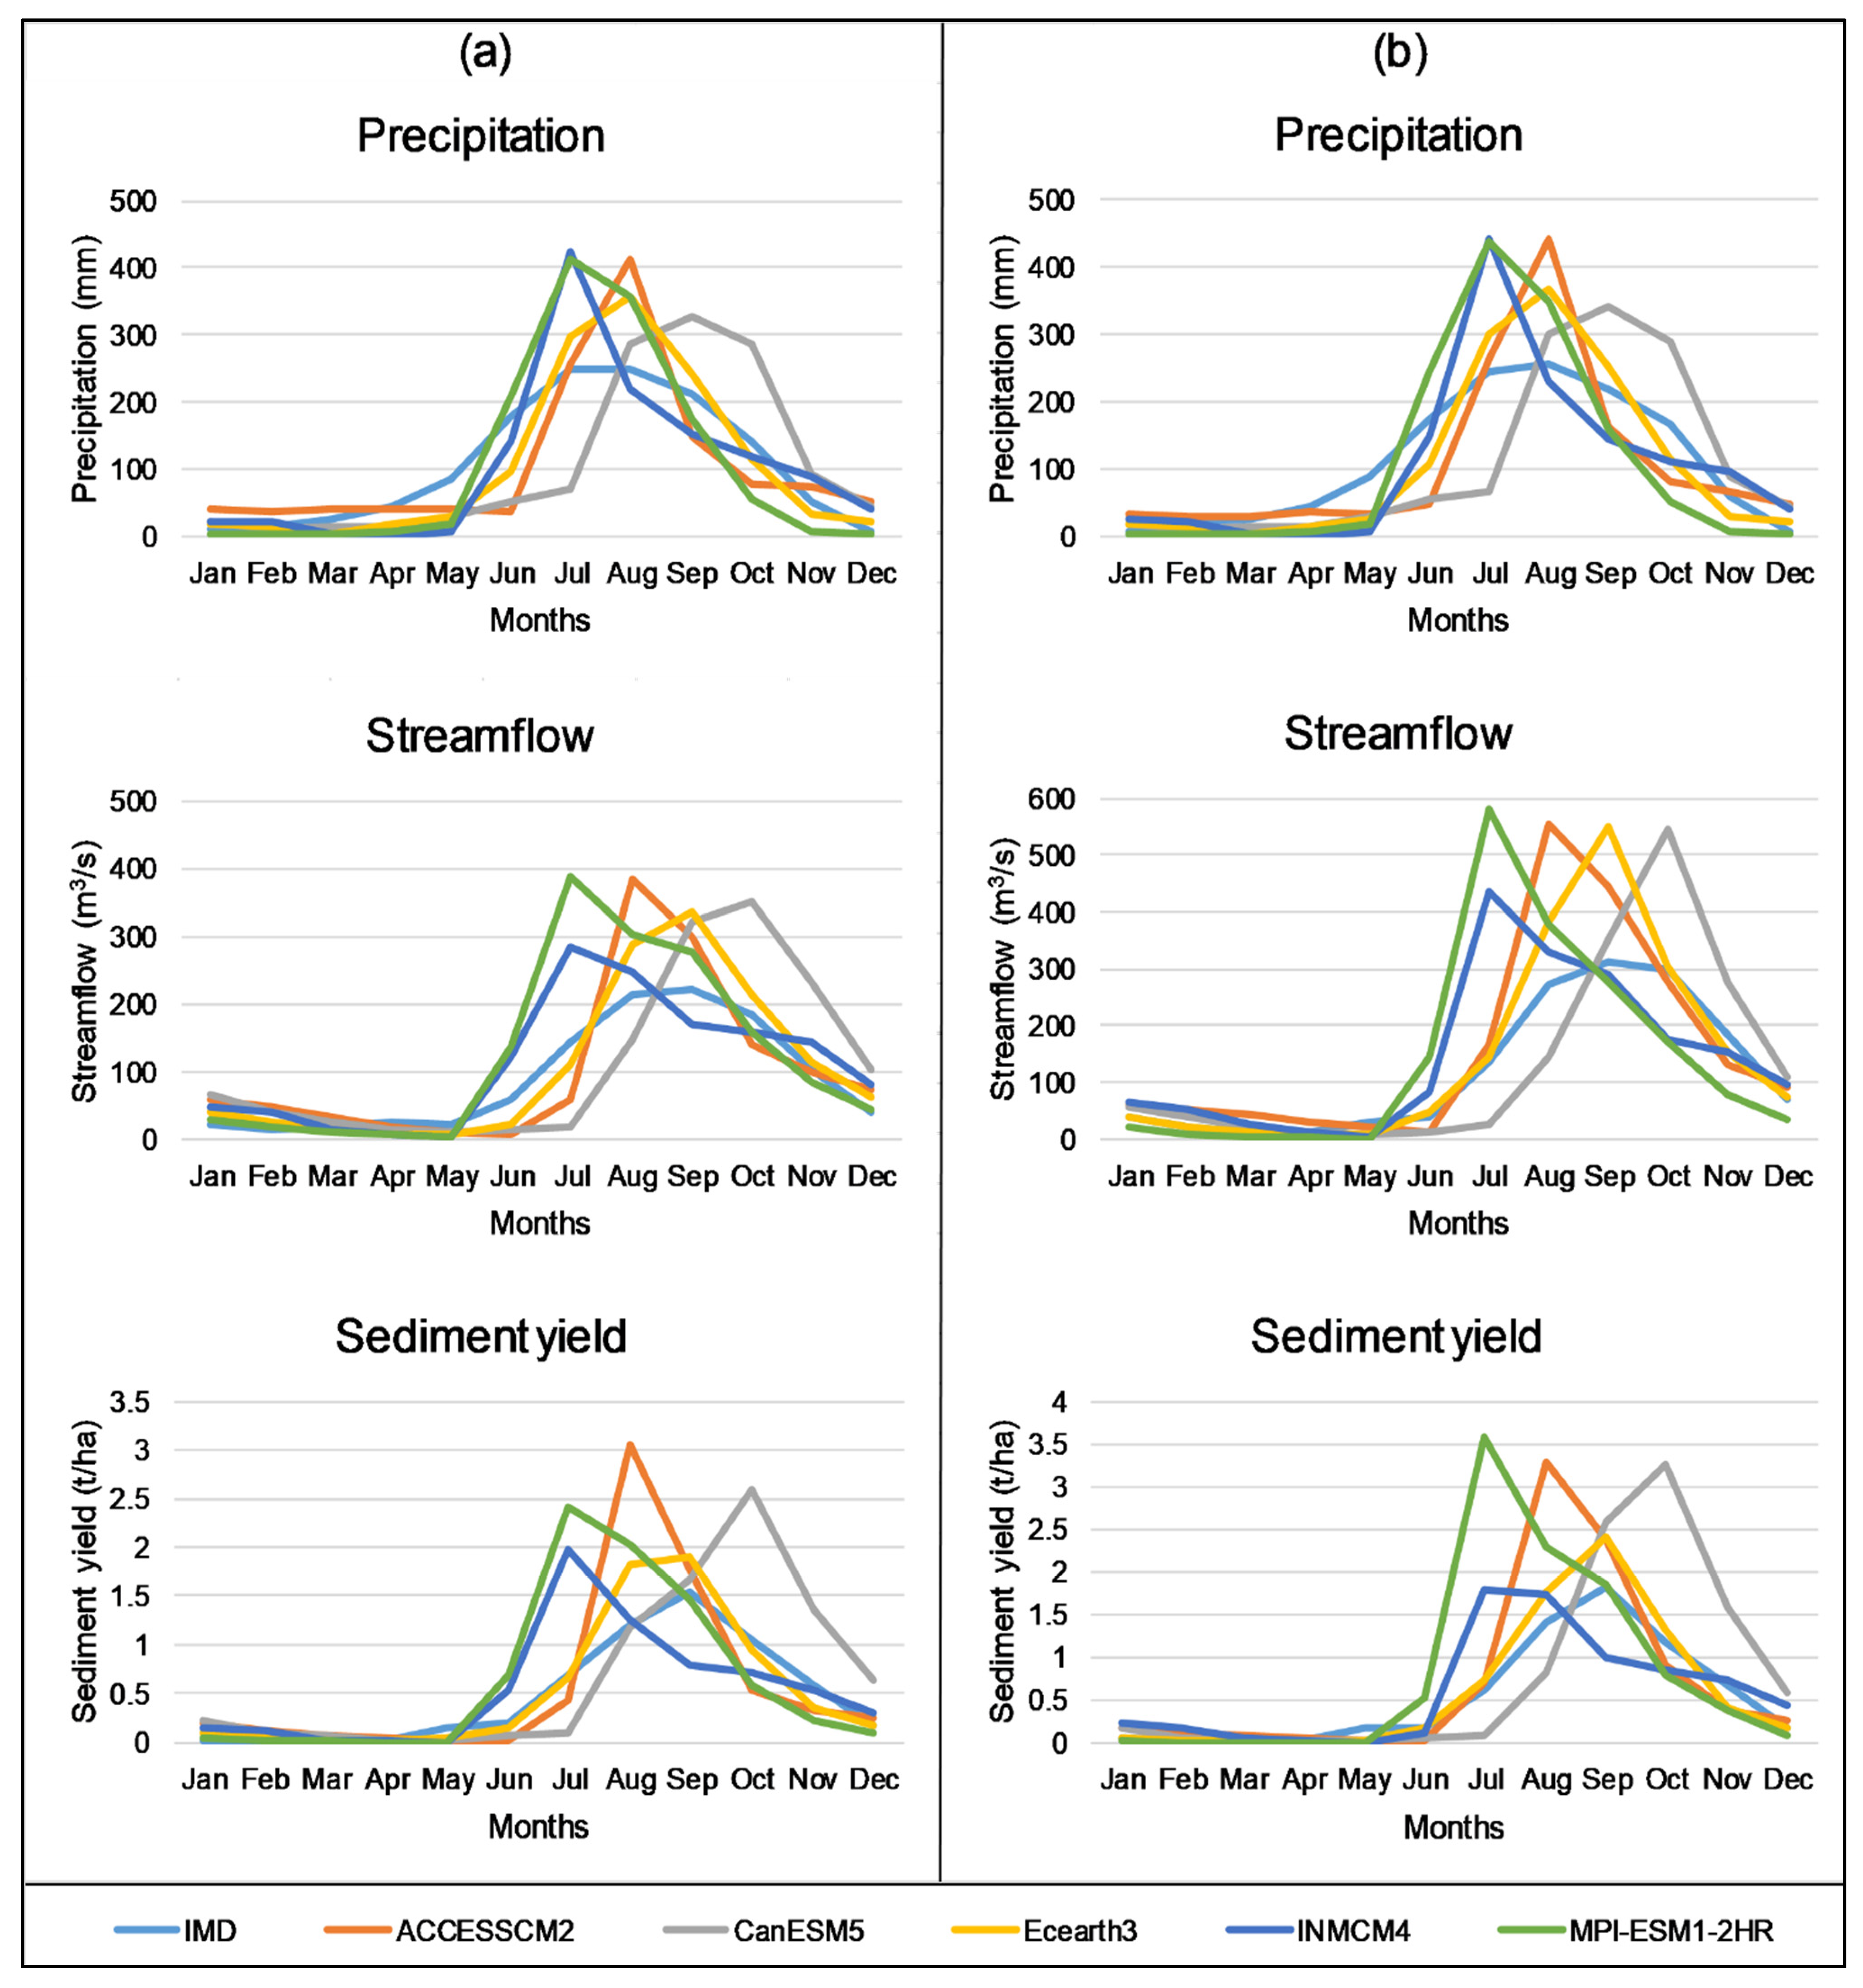
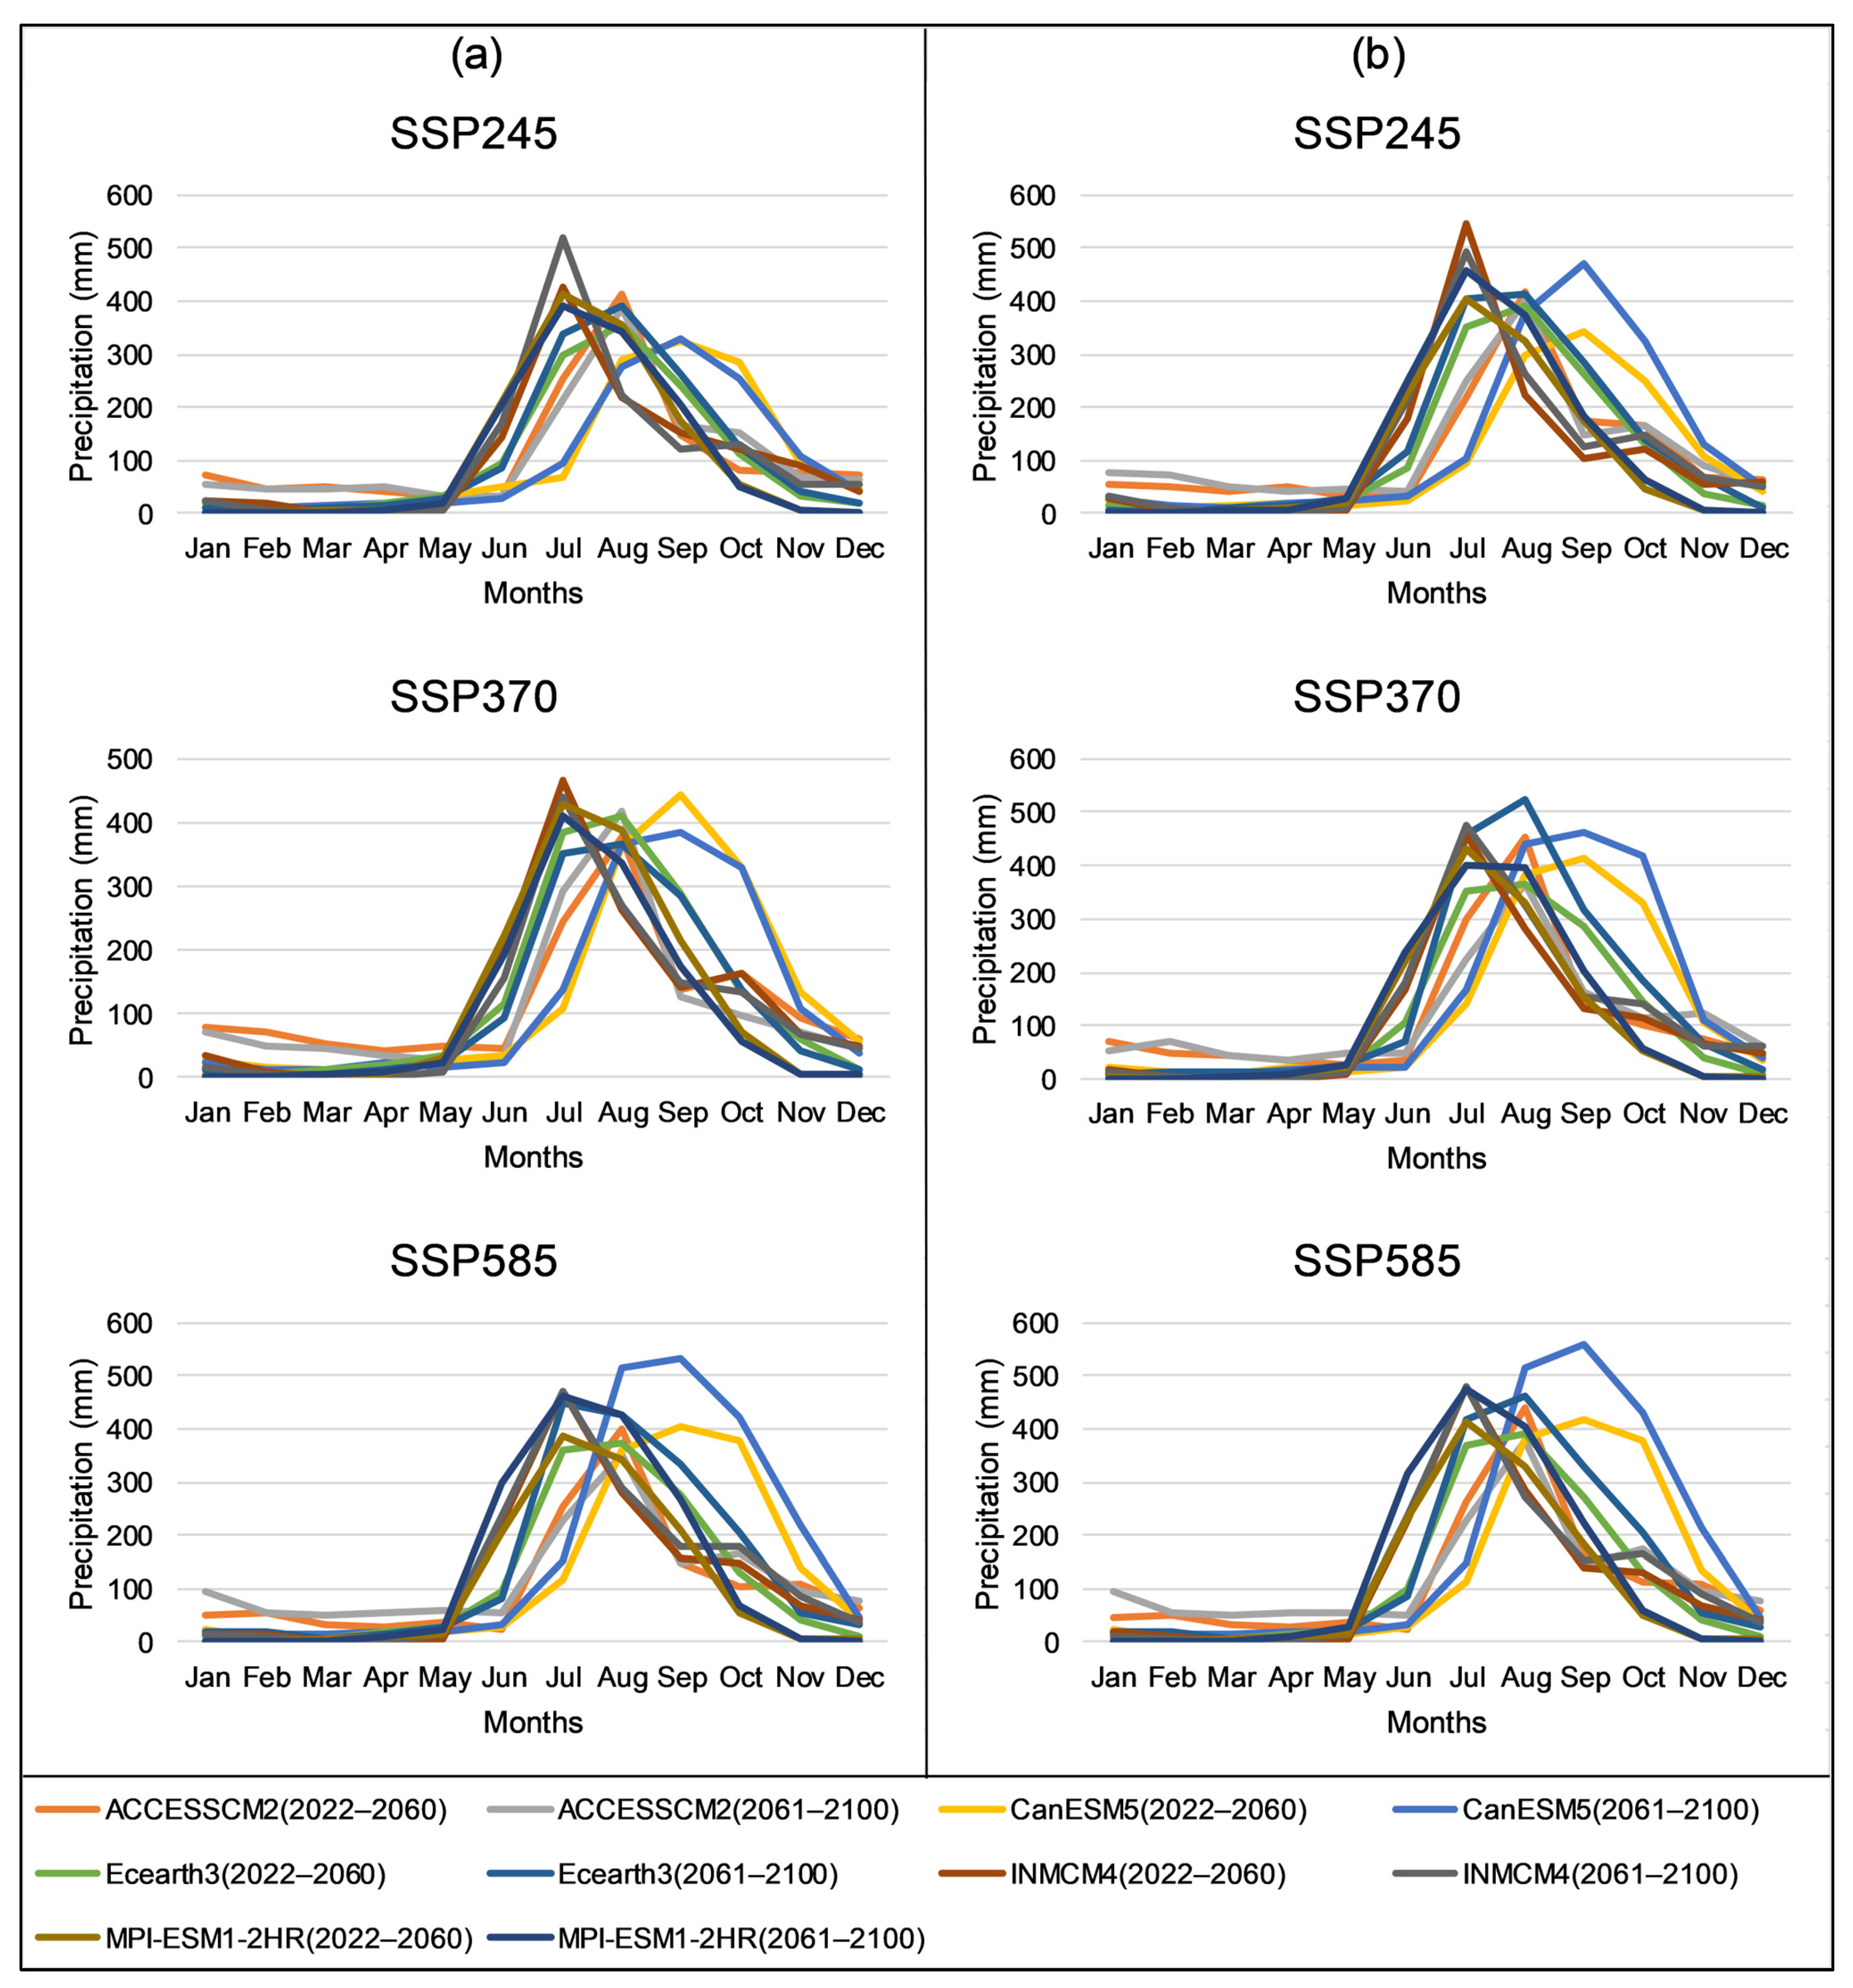
The highest levels of monthly precipitation patterns were observed in August for both the Nagavali and Vamsadhara watersheds (Figure 4), with intensities of 247.85 mm and 255.6 mm, respectively. However, the INMCM4 and MPI-ESM1-2HR models showed their peak precipitation in July, while the ACCESS-CM2 and Ecearth3 models showed their peaks in August, and the CanESM5 model showed their peaks in September for both watersheds. Figure 5 shows the future projections of mean monthly precipitation under different scenarios. These projections followed a similar pattern to the historical precipitation data. Figure 4 and Figure 5 indicate that in both watersheds, the majority of rainfall occurs during the monsoon season, and approximately 80% of the annual runoff is generated during this period [47,55]. These findings highlight the importance of implementing watershed management structures in both watersheds.

3.3. Implications of Climate Change on Streamflow

The average annual streamflow for the Nagavali and Vamsadhara watersheds during the baseline period of 1975 to 2014 was 1061 m3/s and 1425 m3/s, respectively. Table 5 presents the percentage change in predicted streamflow for the near and far future scenarios compared to historical data. The Cold-Dry model consistently underestimated streamflow in both watersheds under all scenarios. The Warm-Dry model also exhibited underestimation in the Nagavali watershed, while the Warm-Wet model showed the greatest overestimation under the SSP370 and SSP585 scenarios. The Cold-Wet model had the highest overestimation in the Nagavali watershed under the SSP245 scenario, while the Average model had the highest overestimation in the Vamsadhara watershed. In the far future, the Warm-Wet and Cold-Wet models had the highest overestimation of streamflow. The Cold-Dry model in the Nagavali watershed under SSP370 in the near future and the Warm-Dry model in the Vamsadhara watershed under SSP370 in the far future showed the maximum underestimation of streamflow change. Conversely, the Warm-Wet model under SSP585 in the far future exhibited the maximum overestimation of streamflow change for both watersheds. Overall, the projections indicated a wetter and more humid future climate in both watersheds.
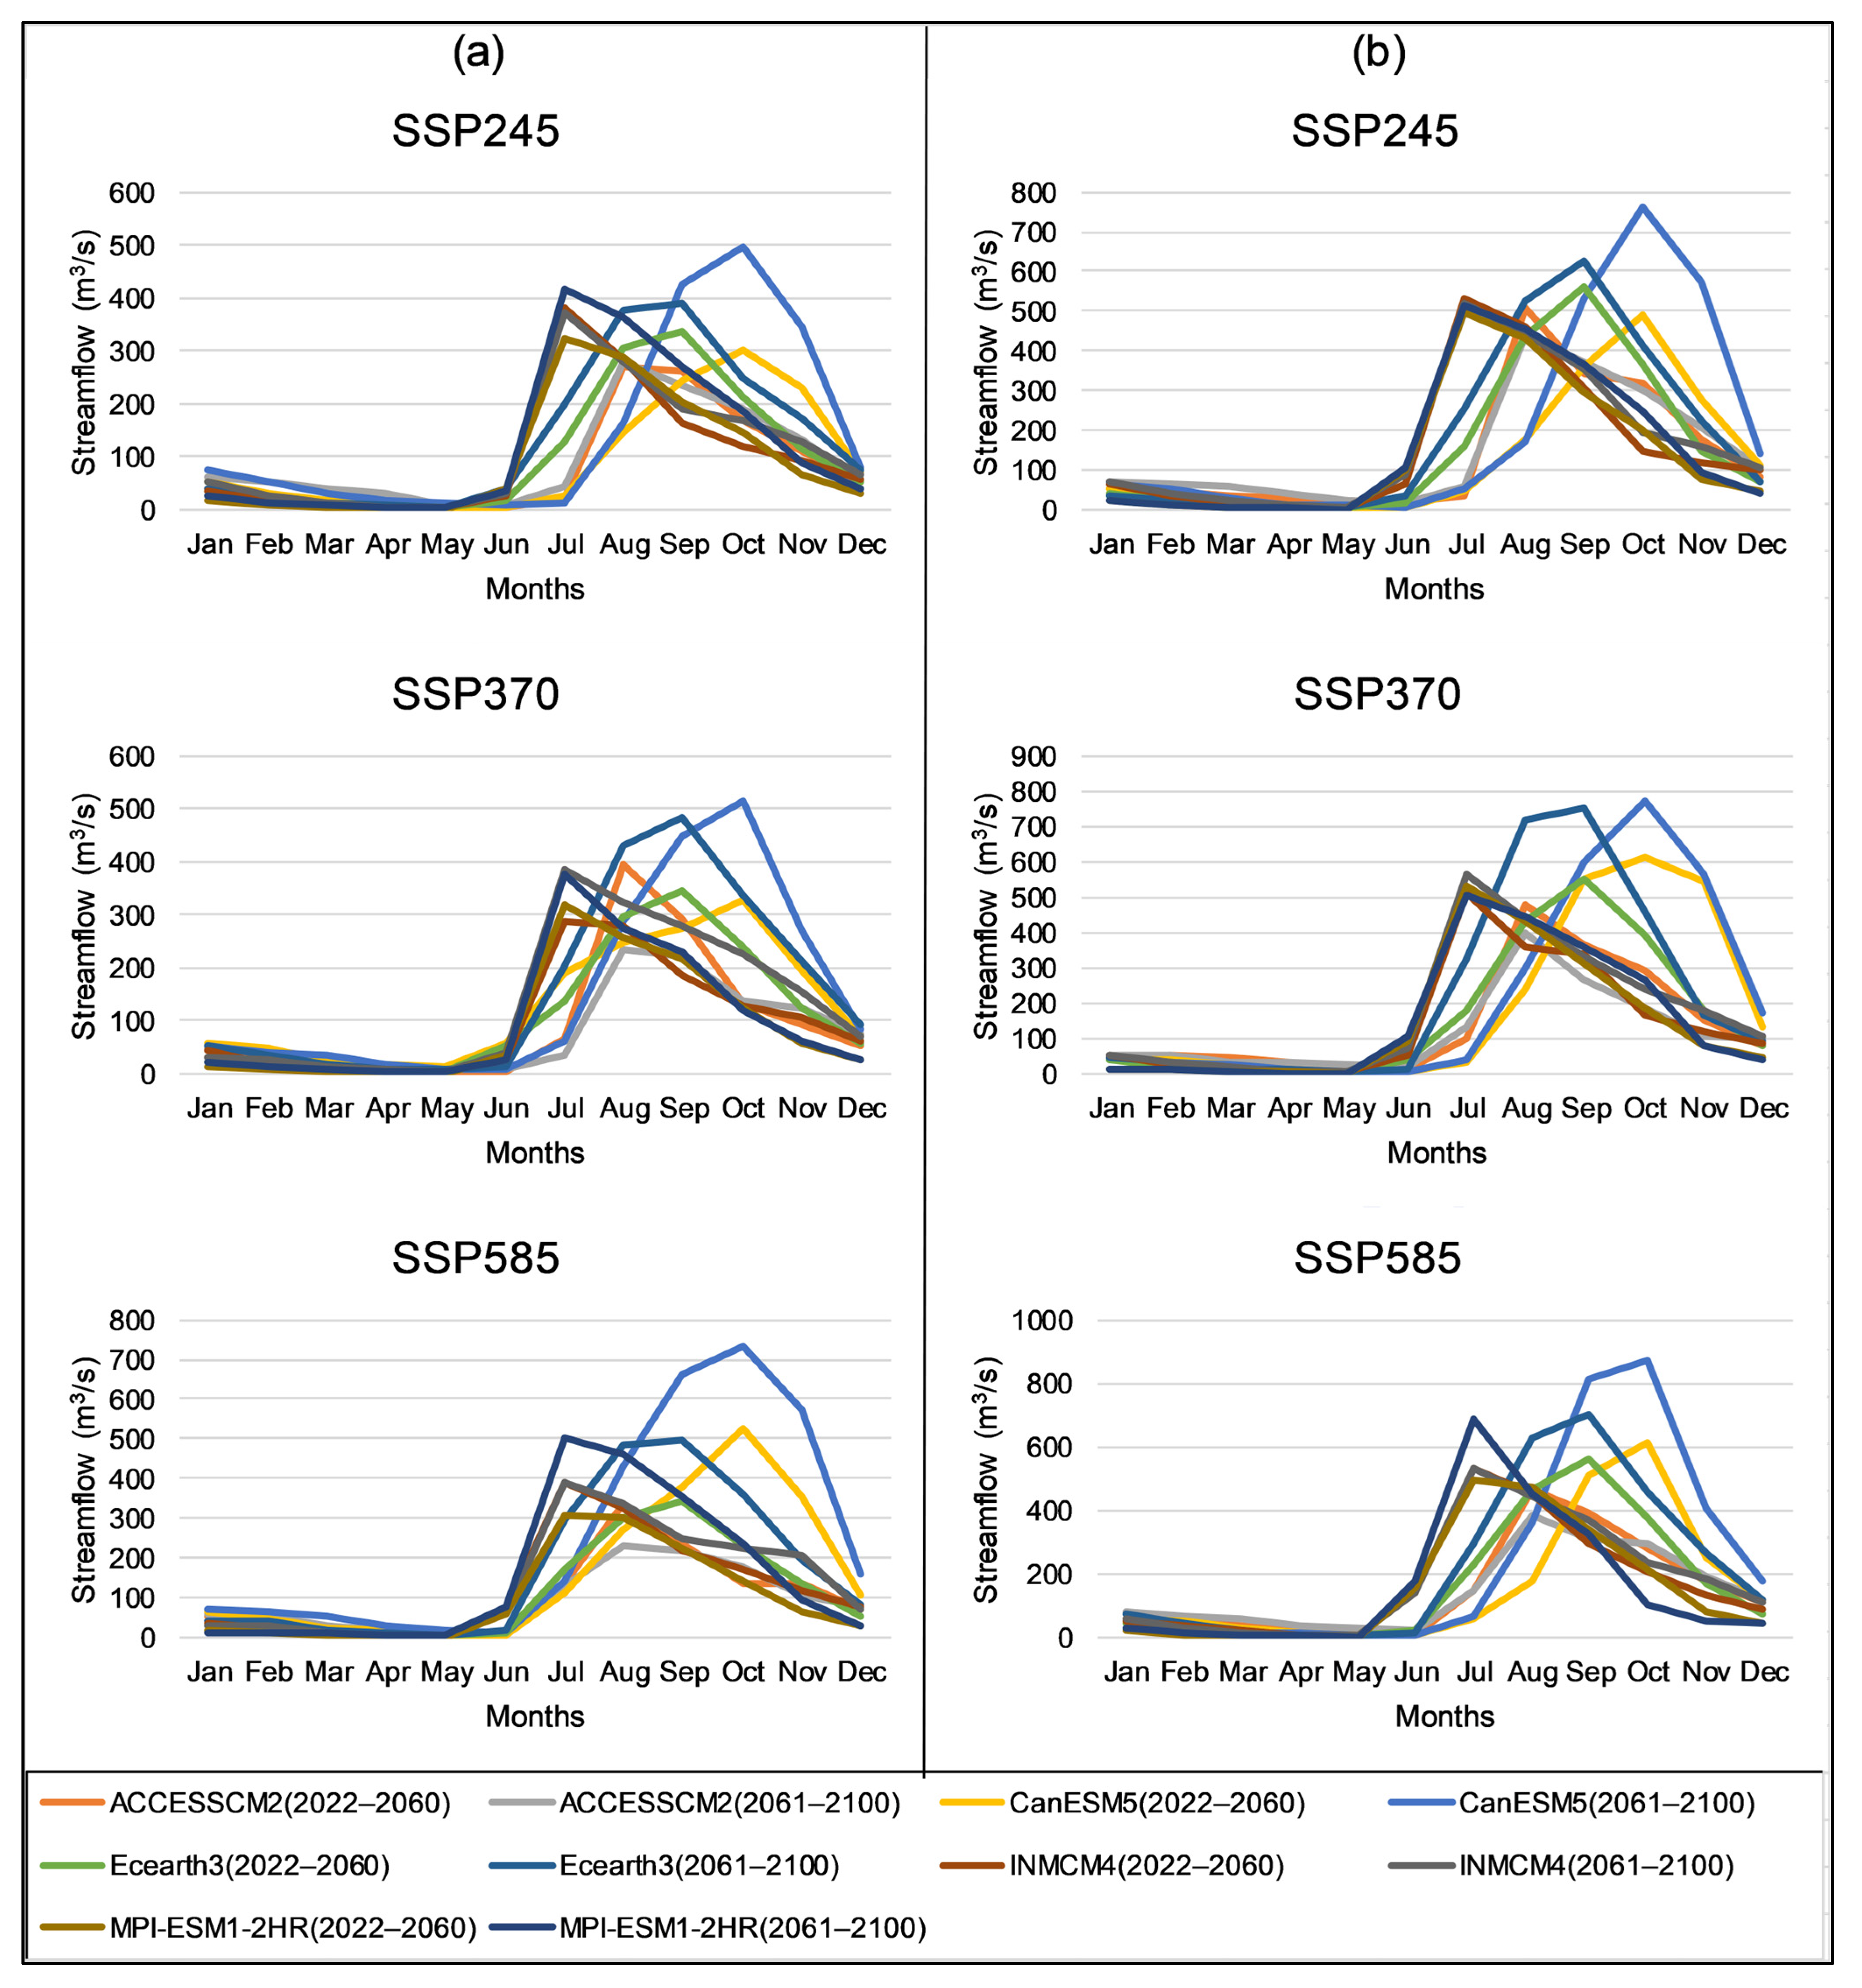
Figure 4 showed the highest observed streamflow in September for both watersheds, with variations among climate models regarding the timing of peak streamflow. The INMCM4 and MPI-ESM1-2HR models showed peak streamflow in July, while the ACCESS-CM2 model indicated a peak in August. The Ecearth3 model showed a peak in September for streamflow, while the CanESM5 model exhibited a peak in October. Figure 6 also showed the future streamflow predictions followed the similar historical patterns of streamflow peaks in both watersheds under all scenarios.

3.4. Implications of Climate Change on Sediment Yield

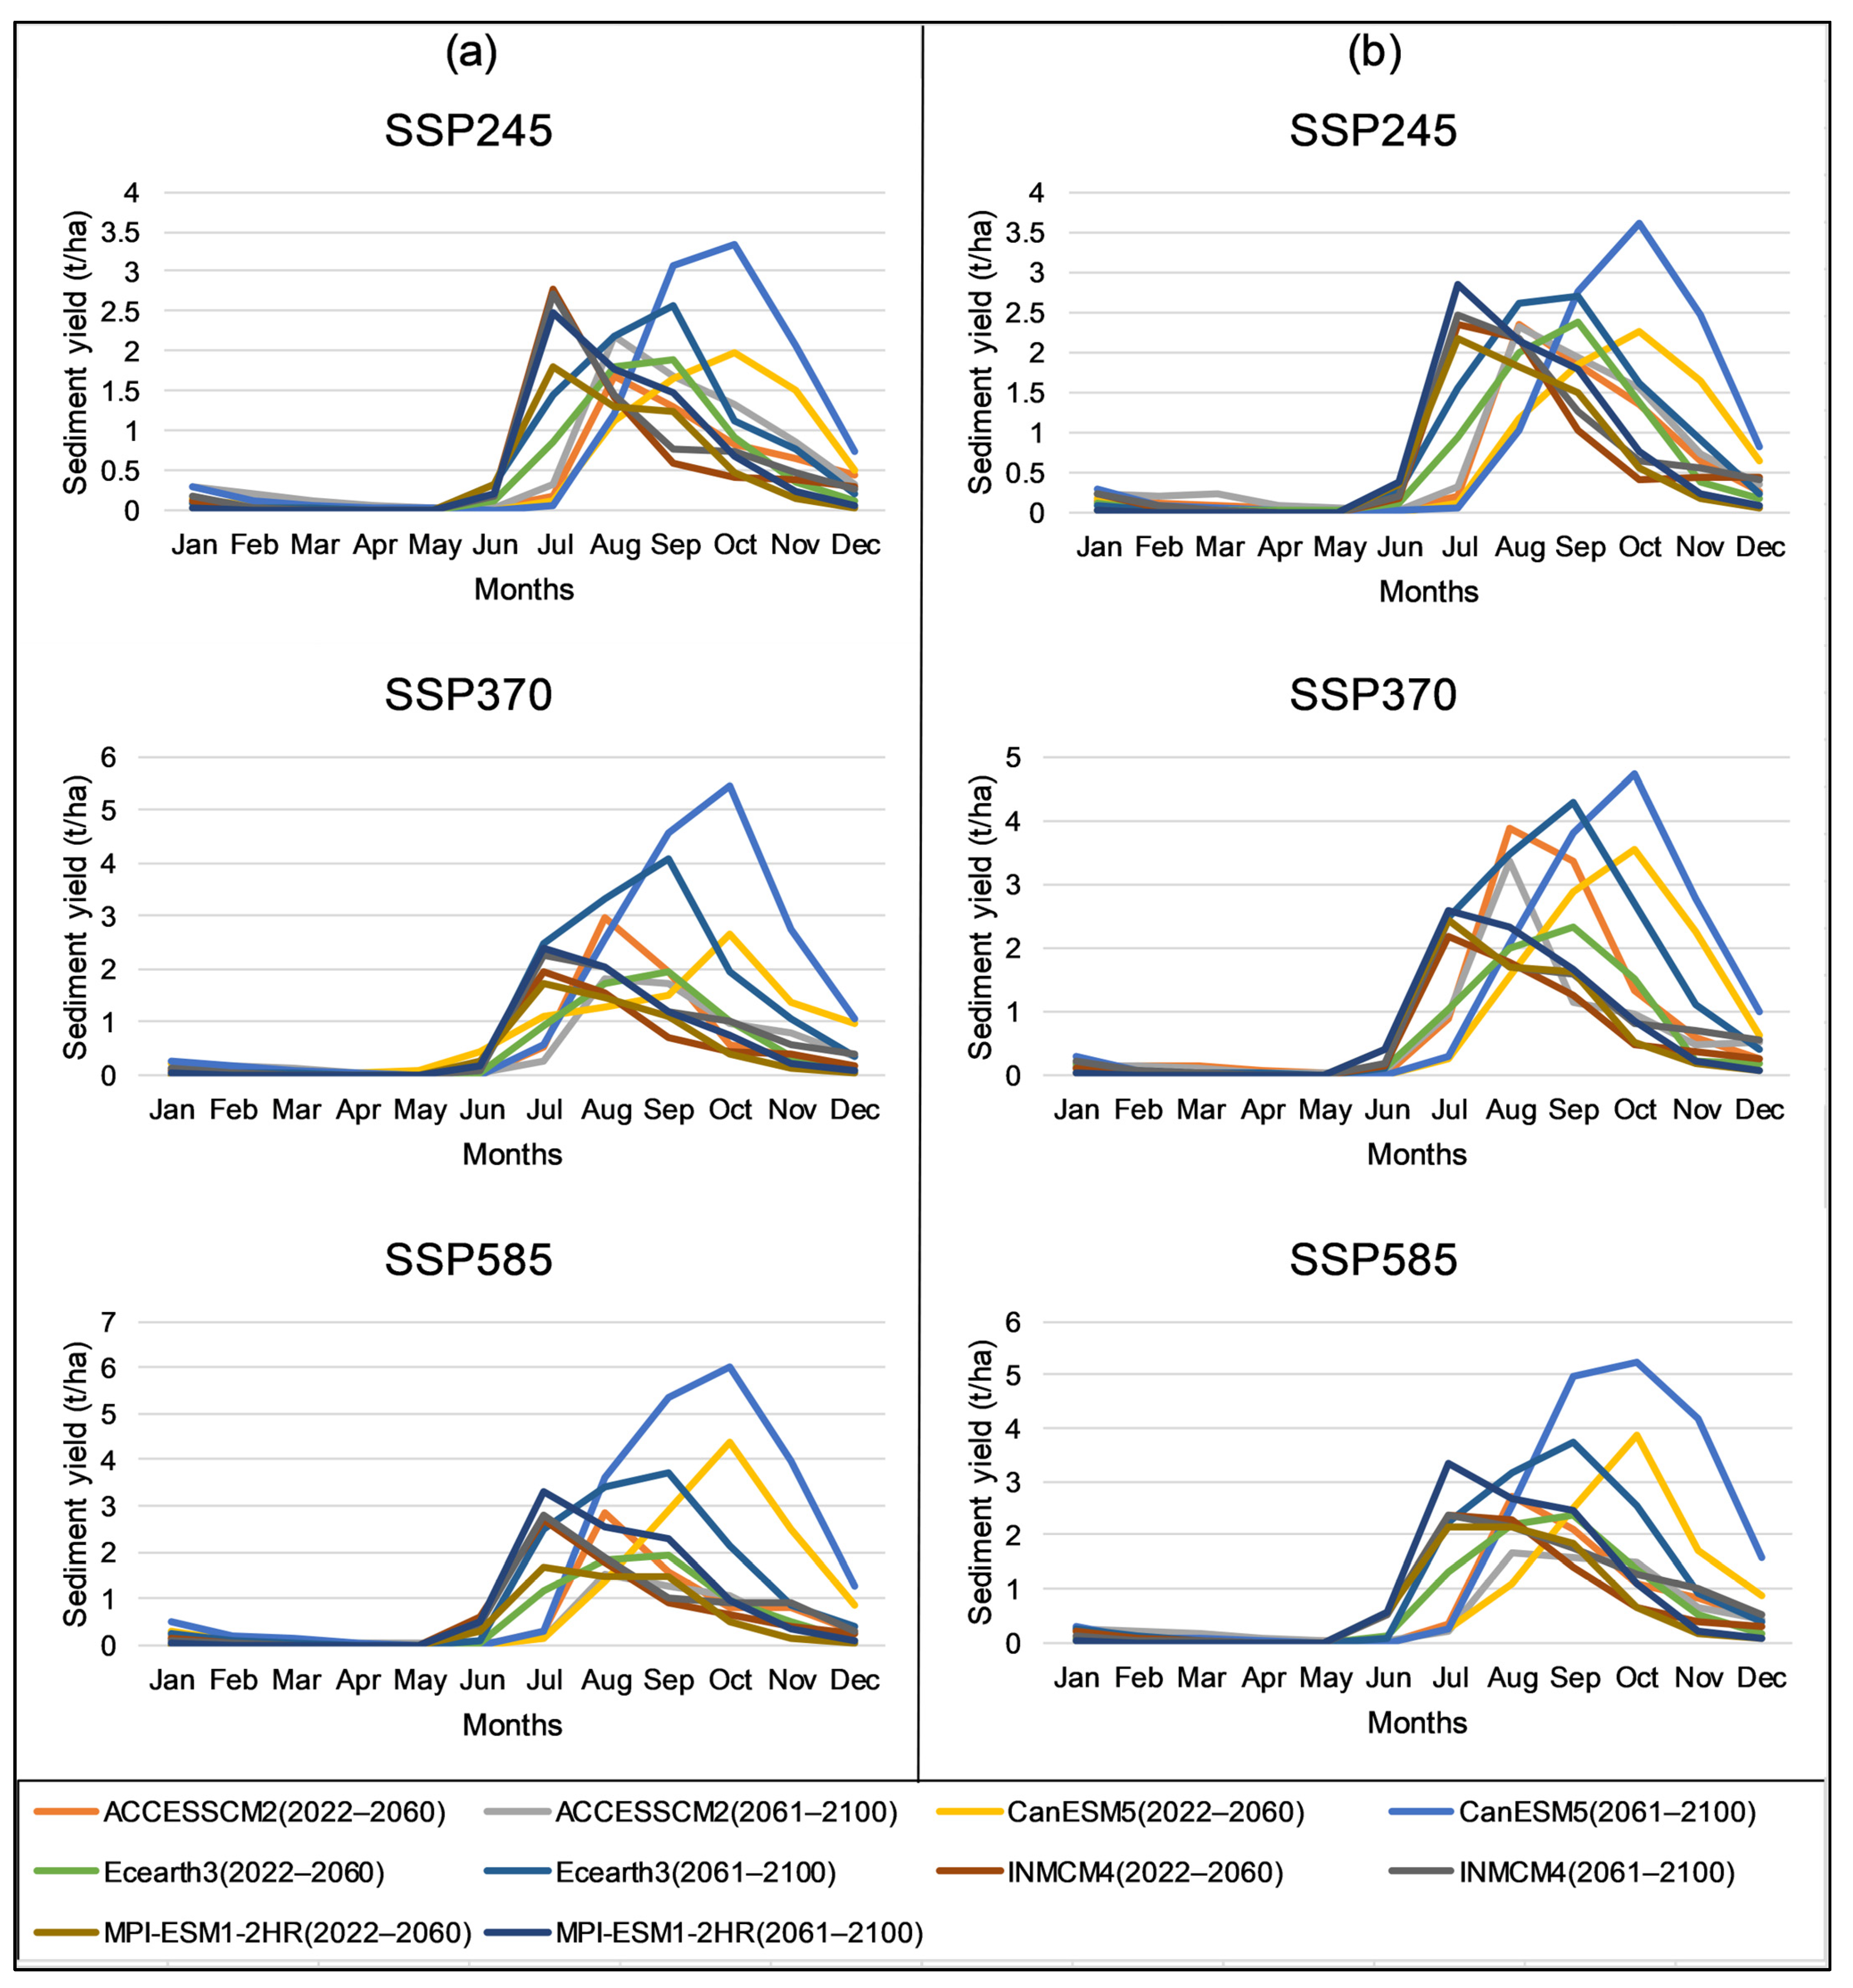
The sediment cycle in the Nagavali and Vamsadhara watersheds exhibits a strong correlation with streamflow and precipitation patterns. The mean peak sediment yield followed the mean peak streamflow patterns. During the 40-year baseline period (1975–2014), the average annual sediment yield was 6.68 t/ha/yr in the Nagavali watershed and 7.3 t/ha/yr in the Vamsadhara watershed. Table 5 presents the percentage change in sediment yield predicted by climate models for the near future (2022–2060) and far future (2061–2100) compared to the historical sediment yield (1975–2014). The percentage change in the sediment yield of different models under all scenarios followed the percentage change in streamflow patterns over both watersheds. In the near future, the Warm-Wet model shows the highest overestimation of sediment yield under the SSP370 and SSP585 scenarios. The Average model exhibits the highest overestimation in the Nagavali watershed, while the Cold-Wet model shows the highest overestimation in the Vamsadhara watershed under the SSP245 scenario. In the far future, the Warm-Wet and Cold-Wet models consistently show the highest overestimation of sediment yield under all scenarios. According to Figure 4 and Figure 7, the historical and future sediment yield peaks under all scenarios align with streamflow peaks, indicating a strong correlation between these variables. However, the specific timing and intensity of monthly sediment yield values varied among the climate models. These findings highlight the uncertainties in predicting sediment yield under future climate scenarios and the importance of considering multiple climate models to capture the range of possible outcomes. Understanding sediment yield dynamics is crucial for effective watershed management, as increased sediment yield can negatively impact soil properties, reservoir capacity, and water quality.
Reservoirs estimated the average sediment trapping efficiency under IMD data over the Nagavali and Vamsadhara watersheds to be 85.14% and 62.1%, respectively, during a 40-year period (1975–2014). The sediment trapping efficiency, which is the ability of a reservoir to retain or trap sediment that flows into it from upstream areas, instead of allowing the sediment to continue downstream, in the Nagavali and Vamsadhara watersheds ranged from 78% to 88.21% and 61.56% to 64.3%, respectively, according to climate models. It will range from 71% to 88.5% and 61.5% to 65.43% in the near future, and from 61.26% to 86.34% and 61% to 64% in the far future over the Nagavali and Vamsadhara watersheds, respectively. In general, trap efficiency decreases with age because silt deposition reduces reservoir capacity. Future periods in both watersheds are expected to report lower sediment trapping efficiency than historical periods, while wetter models will have lower sediment trapping efficiency than drier models. According to a report by the Central Water Commission (CWC, 2020), many Indian reservoirs were reducing their storage capacity at a rate of 1% per year due to sedimentation. In order to save reservoir capacities, agricultural areas, and water quality in these basins, water and soil management methods must be planned and implemented.

3.5. Spatial Distribution of Precipitation, Streamflow and Sediment Yield under Dry-Warm and Cold-Wet Models

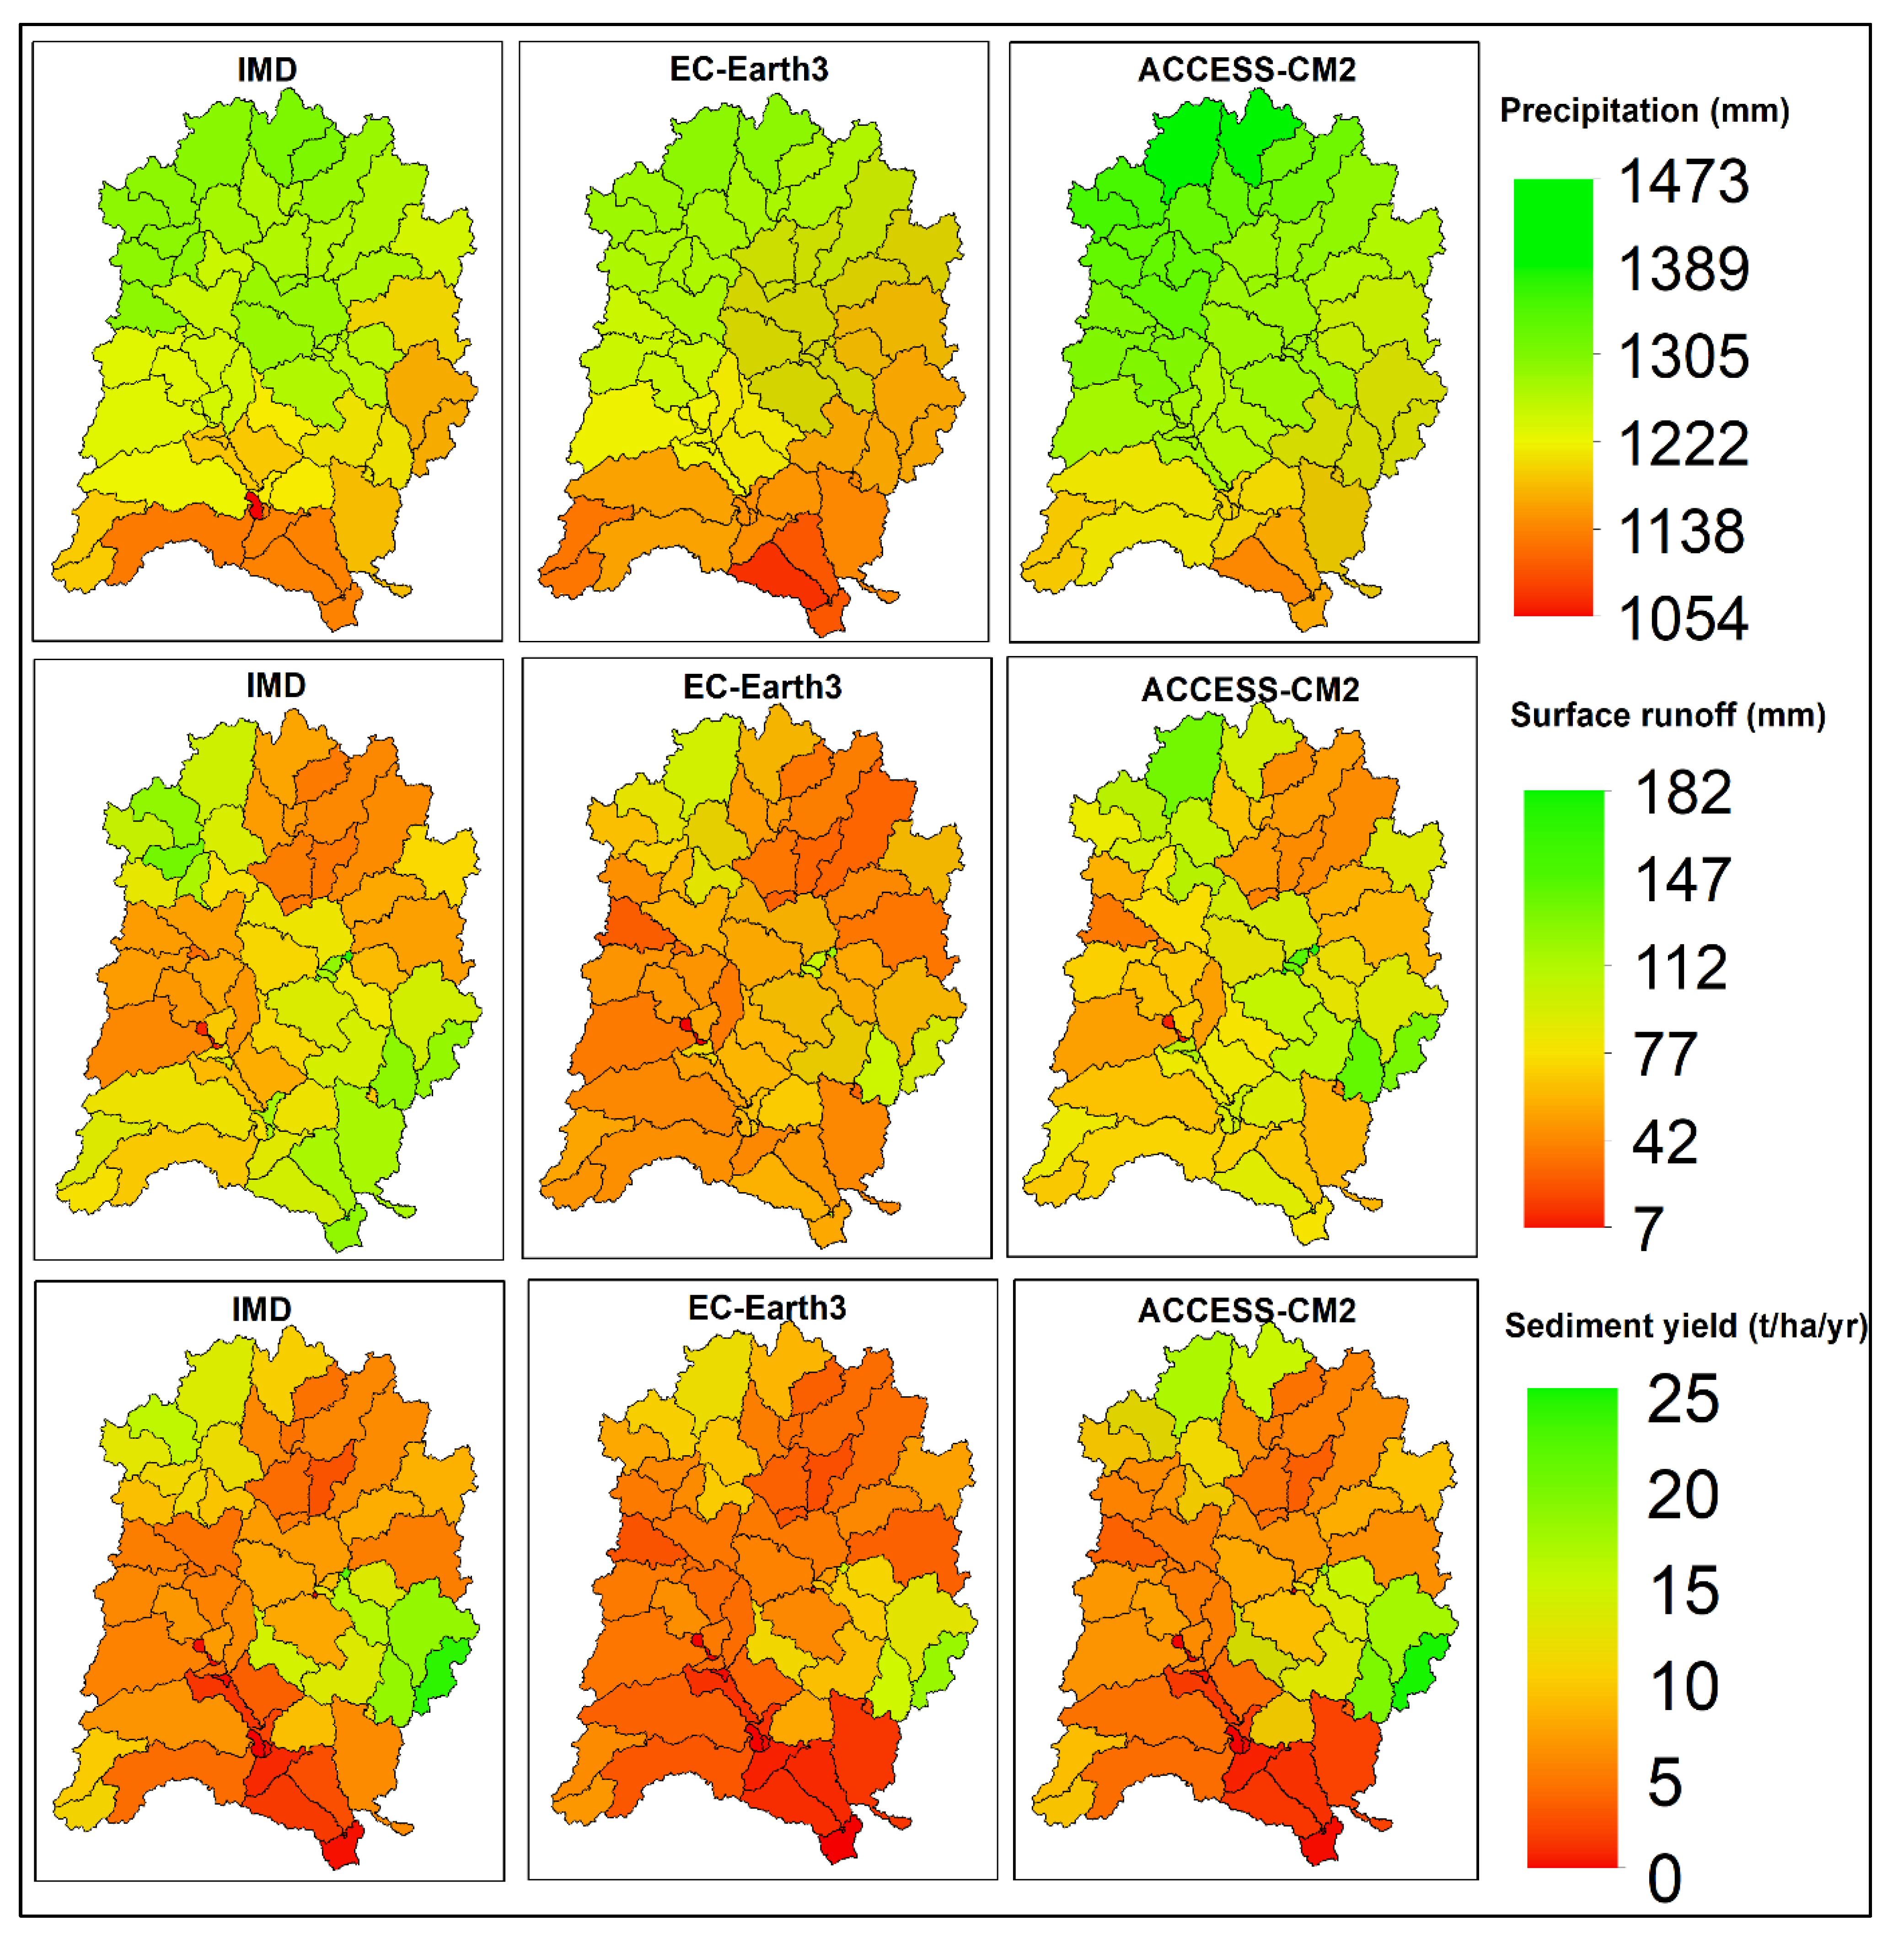
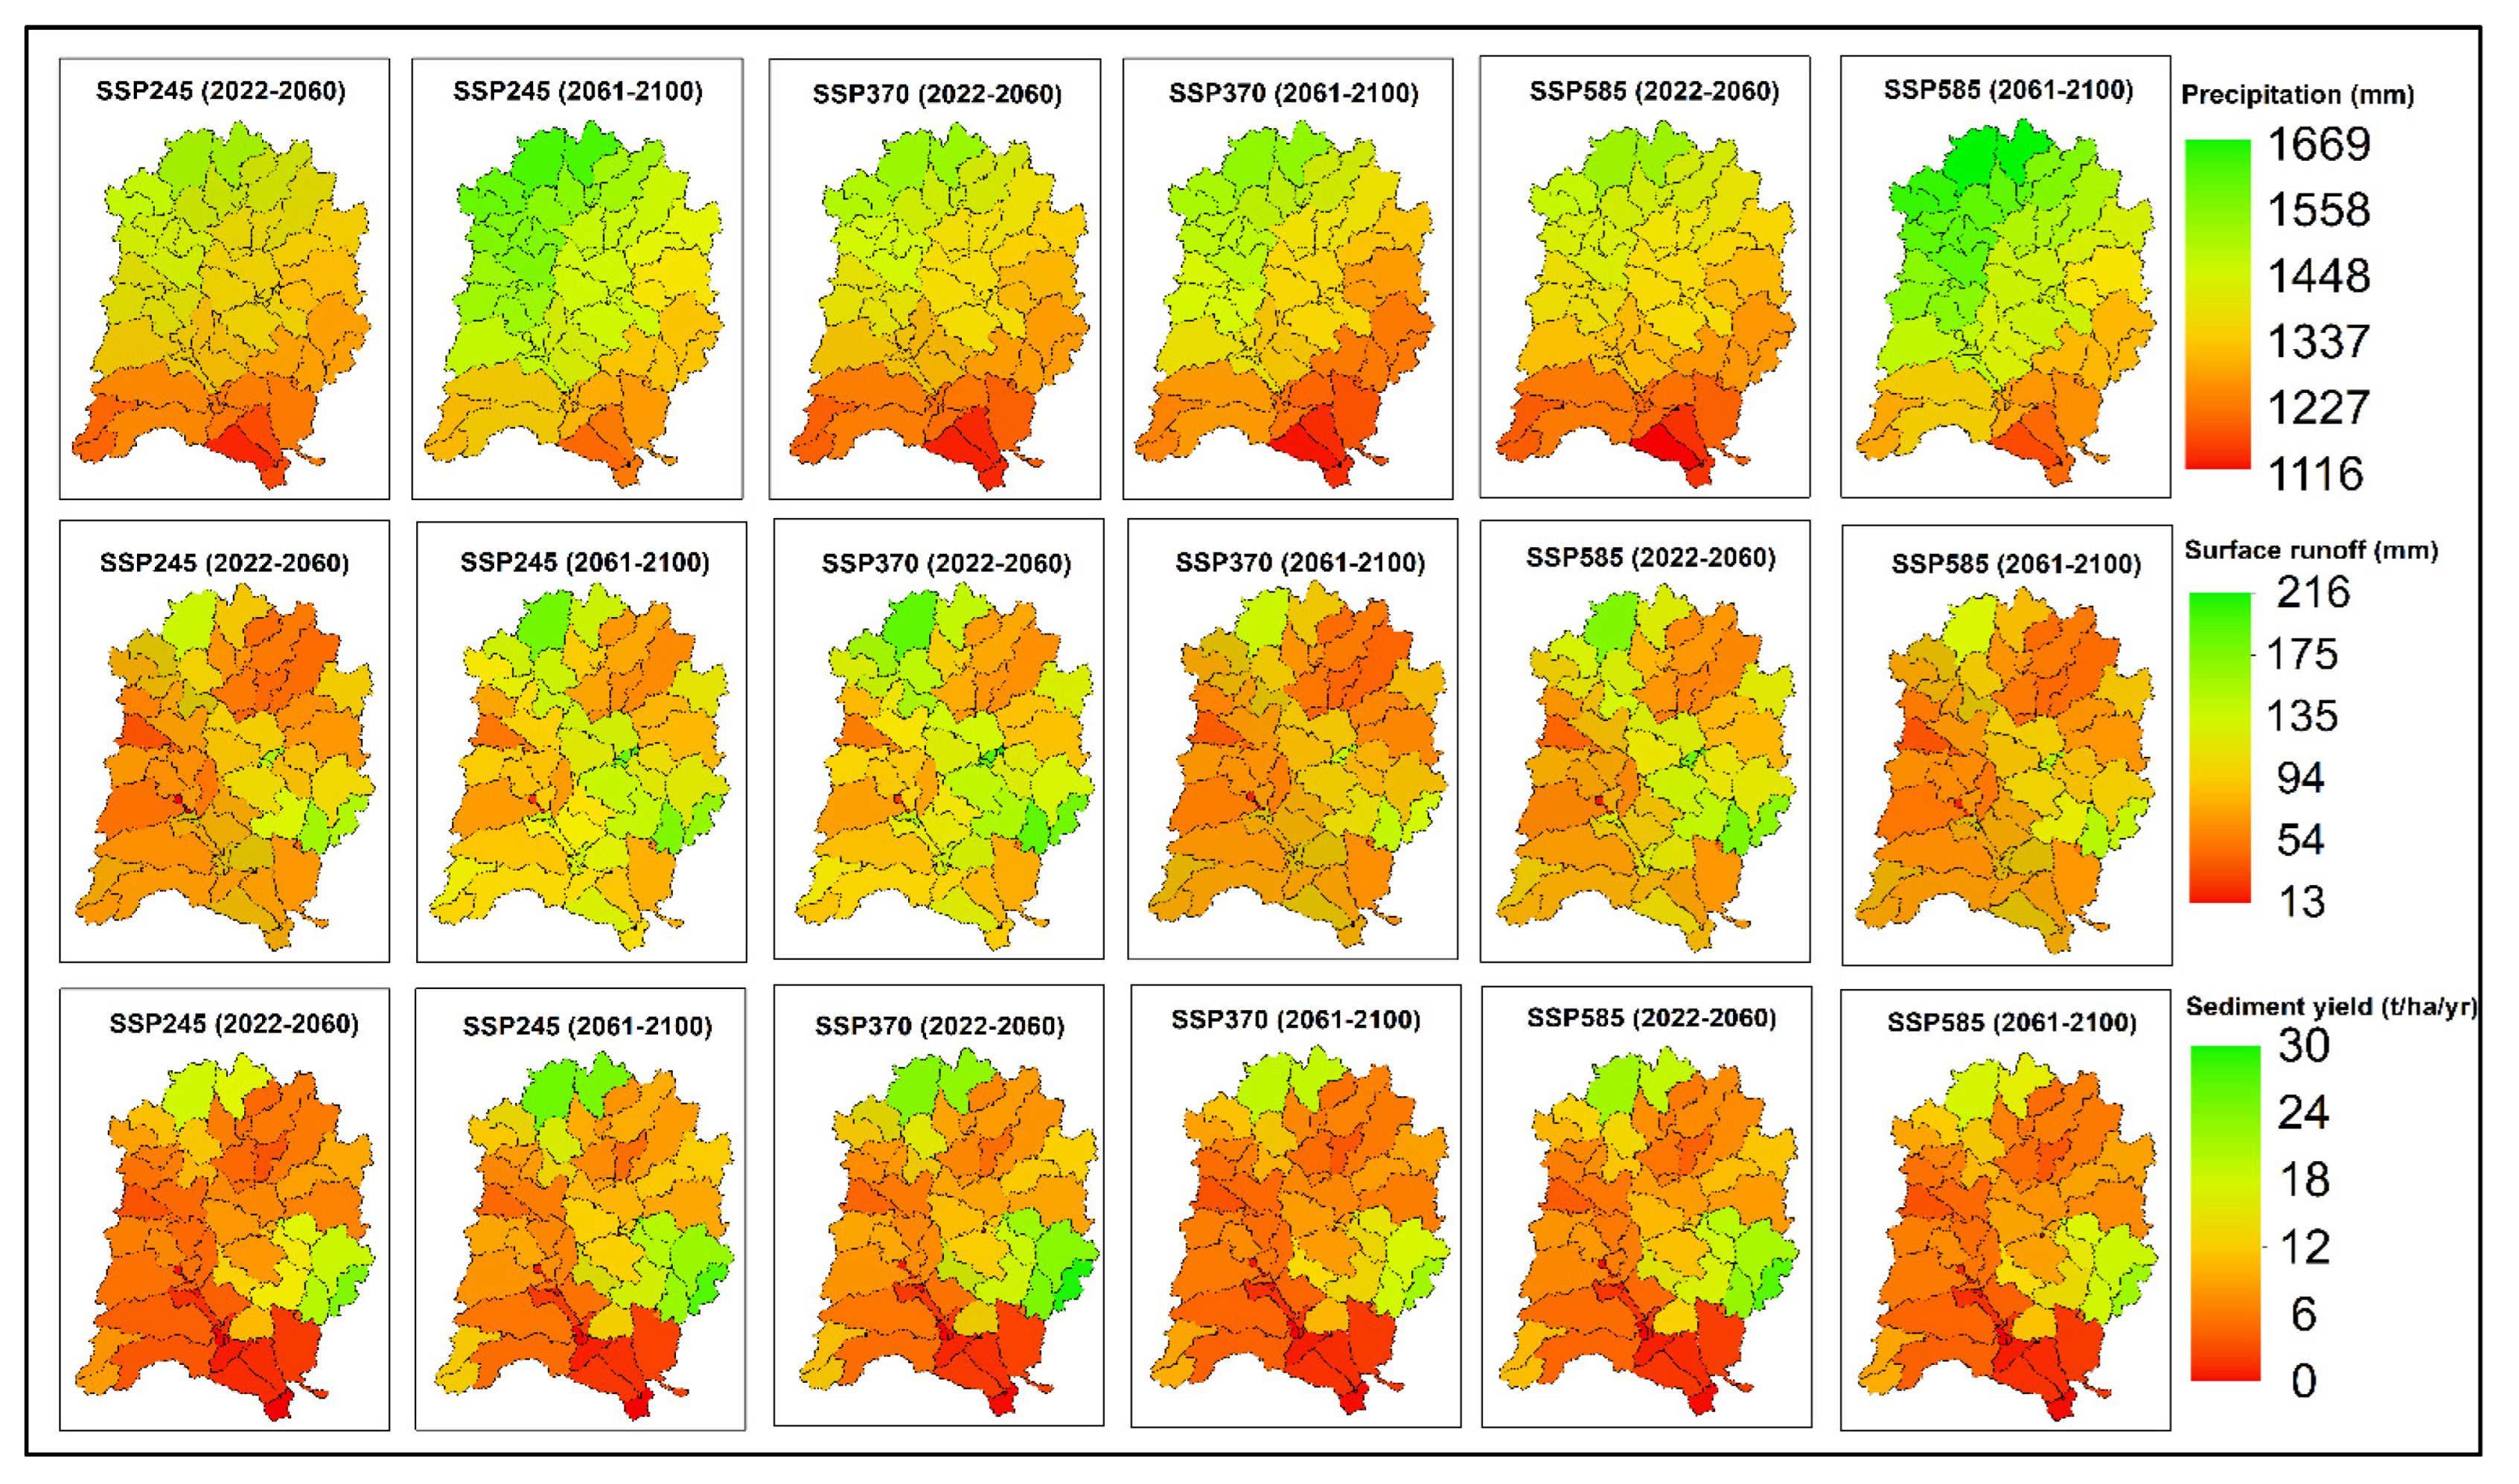
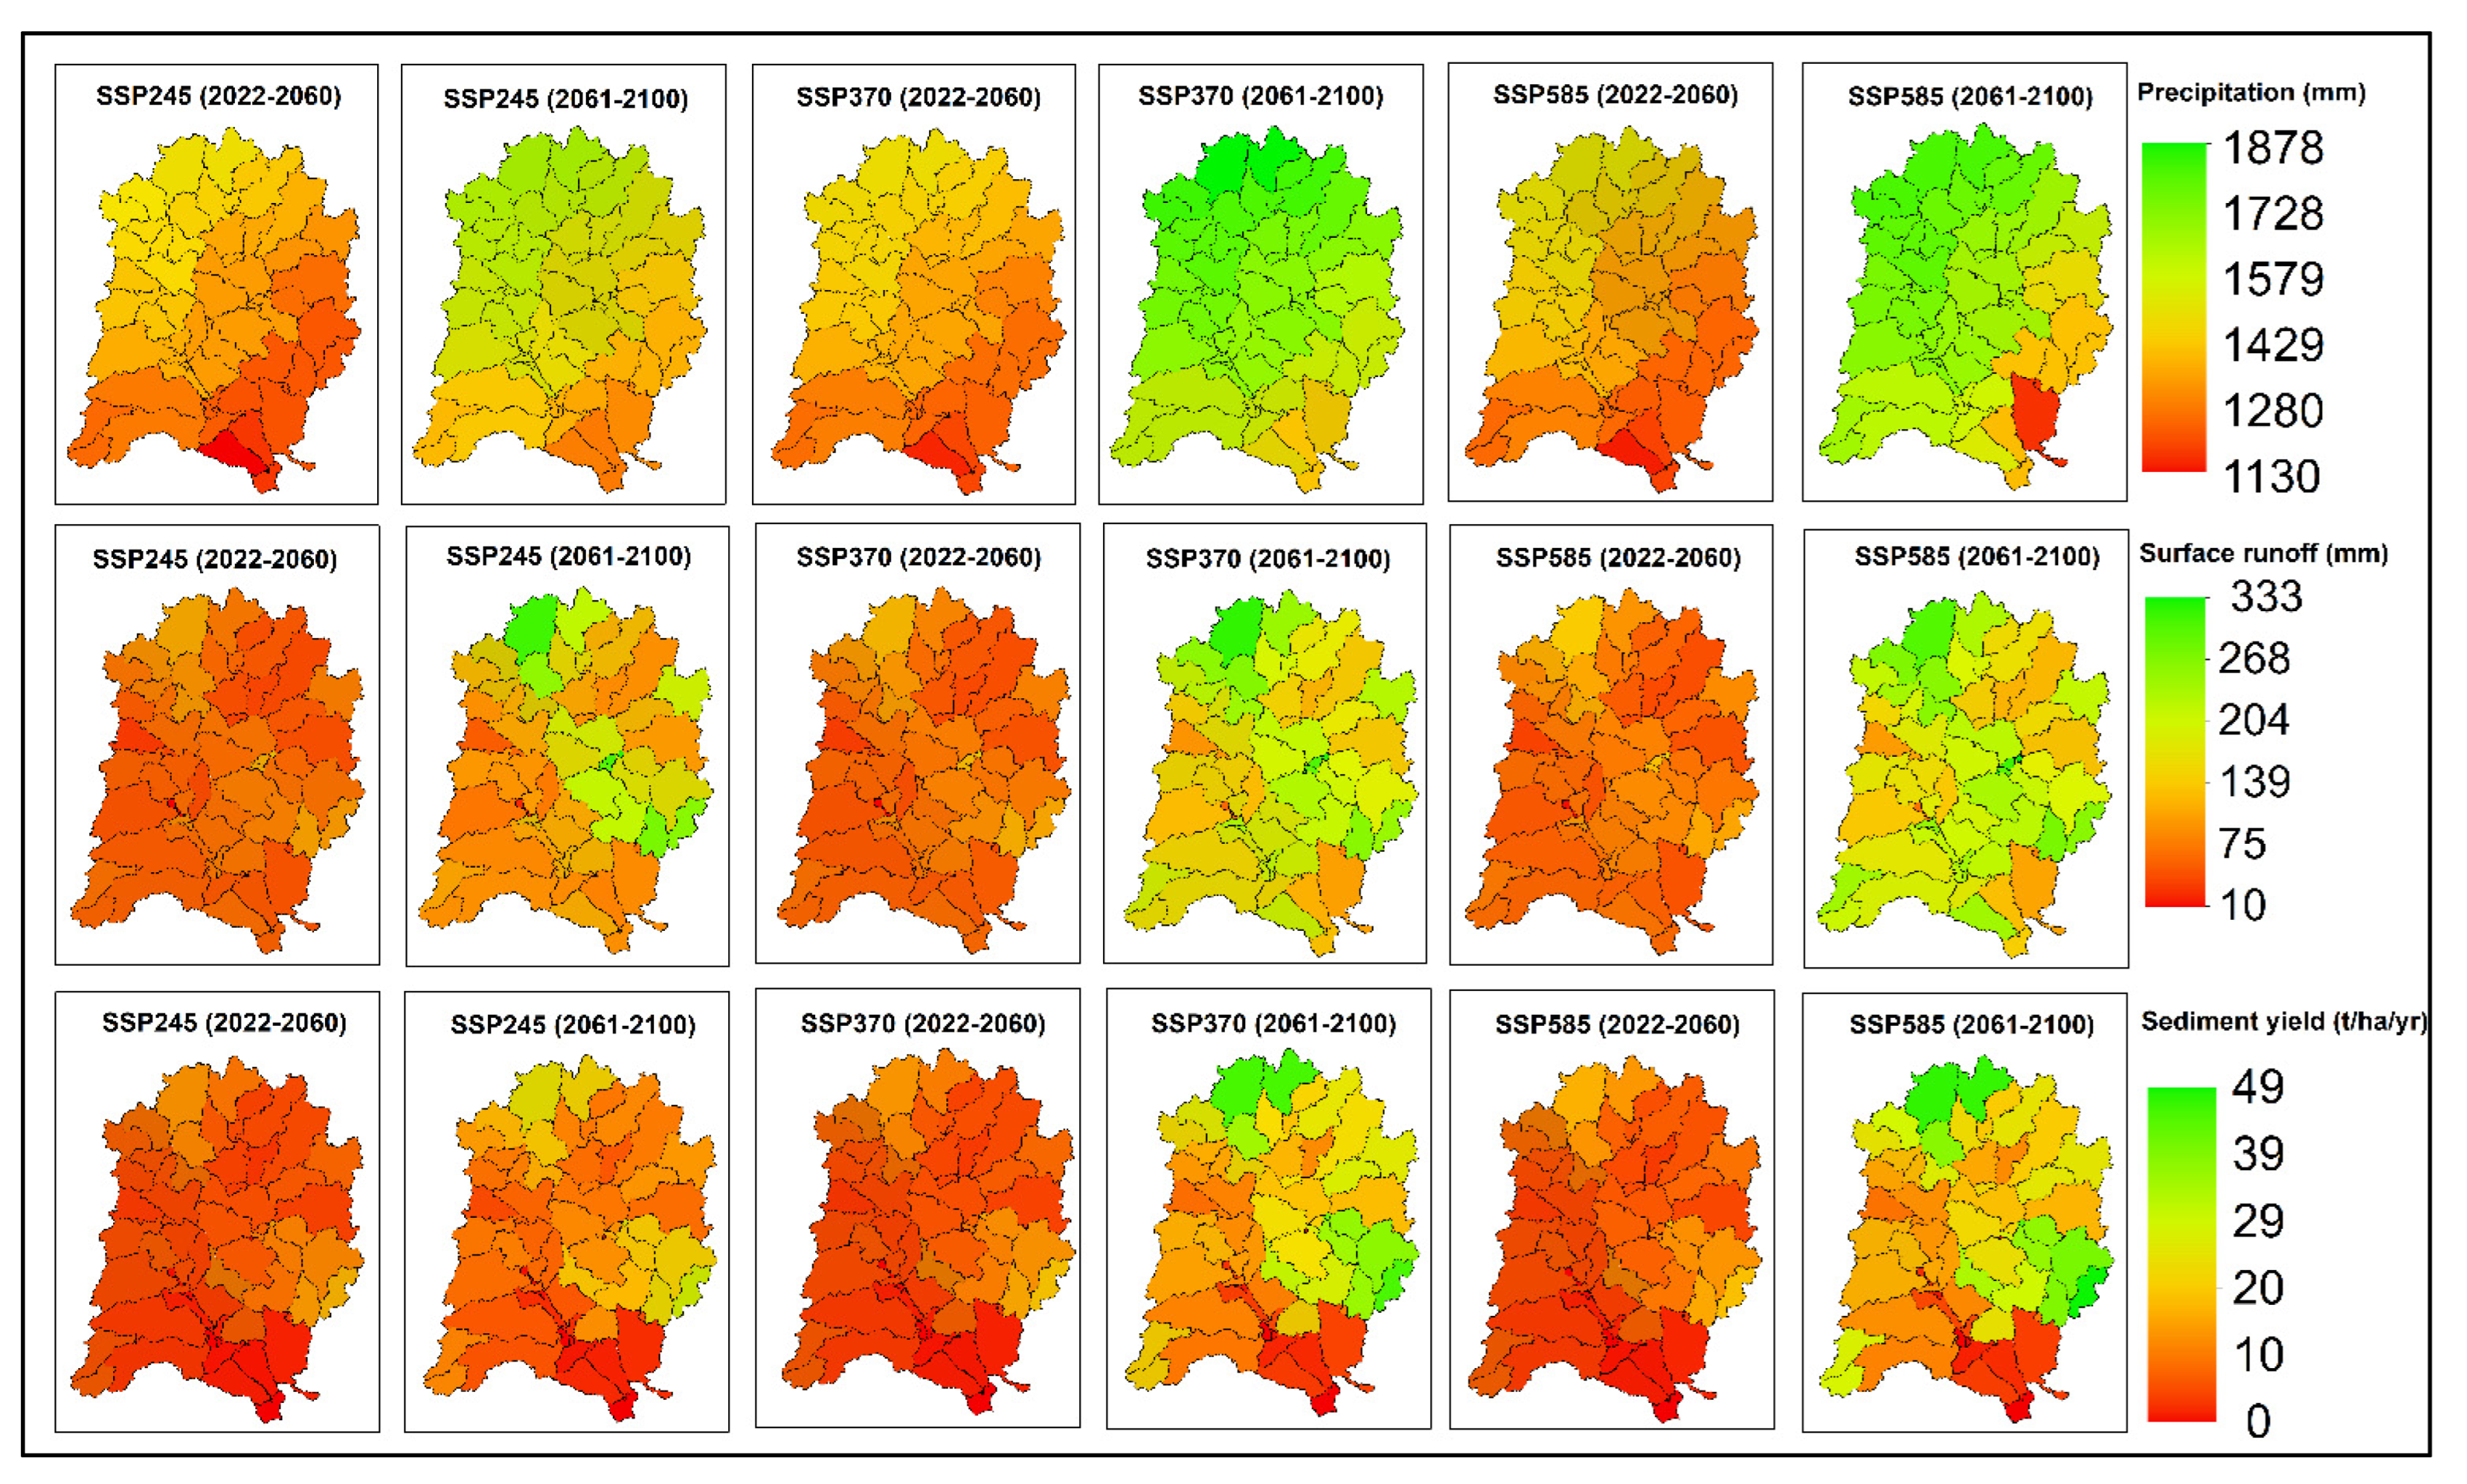
The bias corrected rainfall, maximum and minimum temperature data were used as inputs in the calibrated SWAT model to investigate the future consequences of the Dry-Warm and Cold-Wet models on streamflow and sediment yield in the Nagavali and Vamsadhara watersheds. According to Figure 8, historical precipitation, surface runoff, and sediment yield in these watersheds ranged from 1054 to 1473 mm, 7 to 182 mm, and 0 to 25 t/ha/yr. The upper sub-watersheds received the most precipitation while the lower sub-watersheds received the least. The catchment areas of the Nagavali and Vamsadhara watersheds are 9200 and 10,450 sq.km, respectively, with 2438 and 5120 sq.km of watershed areas subjected to high soil erosion. In the Nagavali watershed, out of 2438 sq.km, 635 and 645 sq.km of area belong to agricultural and barren land, respectively. In Vamsadhara watershed, out of 5120 sq.km, 1476 and 1066 sq.km of area belong to agricultural and barren land, respectively. Nagireddy et al. (2022) [47] found that sub-watersheds with the highest sediment yield, representing 26.5% and 49% of the total watershed area, were wastelands, followed by fallow land, agricultural land, and degraded and deciduous forest land with steep slopes in both watersheds. The near-level slope (0–2%) represents 19.21% and 14.32% of the watershed area in Nagavali and Vamsadhara watersheds, respectively. The medium slope (2–8%) represents 23.26% and 19% of the watershed area, while the steep slope (>8%) represents 57.33% and 66.68% of the watershed area in the Nagavali and Vamsadhara watersheds, respectively. These figures suggest that Vamsadhara watershed has more undulated areas than Nagavali watershed. Figure 9 shows the projected annual average precipitation, surface runoff, and sediment yield under the Dry-Warm model. The range for these variables under Dry-Warm and SSP245, SSP370, and SSP585 is 1116 to 1669 mm, 13 to 216 mm, and 0 to 30 t/ha/yr, respectively. These values are higher than the historical period. Figure 10 shows the same variables under the Cold-Wet model. The range under Cold-Wet and SSP245, SSP370, and SSP585 is 1130 to 1878 mm, 10 to 333 mm, and 0 to 49 t/ha/yr, respectively. Under Cold-Wet, the SSP585 scenario showed 7468 and 9426 sq.km of watershed area subjected to high soil erosion over Nagavali and Vamsadhara watersheds, respectively, in far future. Therefore, based on the results of the Dry-Warm and Cold-Wet scenarios, it is important to implement soil water conservation measures in the observed critical sediment source areas in the Nagavali and Vamsadhara watersheds to mitigate the potential impact of climate change.

4. Conclusions

From future projections, the increases in mean annual precipitation (ΔP) and mean temperature (ΔT) were expected to vary across different scenarios. These projections indicate the potential increase in both precipitation and temperature in the future, with the magnitude varying depending on the scenario considered. The climate models provide divergent future scenarios for the Nagavali and Vamsadhara watersheds. The ACCESS-CM2 model predicts a Warm-Dry future, indicating higher temperatures and decreased precipitation, while the Ecearth3 model predicts a Cold-Wet future, suggesting lower temperatures and increased precipitation. During the baseline period of 1975–2014, the Nagavali and Vamsadhara watersheds received 1259 mm and 1314 mm of annual rainfall, respectively. The percentage bias between the Indian Meteorological Department’s precipitation data and the climate model’s historical precipitation data for these watersheds ranged from −4.73 to 3.71%, showing that the climate model’s precipitation data is fairly well correlated with the IMD’s data, with some slight under- and overestimations. In the near and far future, the percentage change in precipitation for these watersheds under the Cold-Wet and Dry-Warm models will range from 5.35 to 35.1% and −1.57 to 8.48%, respectively, indicating that there will be an increase in precipitation leading to an increase in streamflow and sediment yield for these watersheds. The climate models used in the study exhibit different trends in predicting precipitation, streamflow, and sediment yield. The Cold-Dry model consistently underestimates the precipitation, streamflow, and sediment yield, while the Warm-Wet and Cold-Wet model shows the maximum overestimation under all scenarios in the near future. In the far future, Warm-Wet and Cold-Wet models show the maximum overestimation of precipitation, streamflow, and sediment yield under all scenarios. Overall, the far future period shows a greater percentage change in precipitation, streamflow, and sediment yield compared to the near future in all climate models and scenarios. These findings emphasize the importance of considering multiple climate models and scenarios to understand the range of possible outcomes and plan effective measures for managing water resources in the studied watersheds.
The analysis of IMD observed data and simulated results from different climate models reveals discrepancies in the timing of peak precipitation, streamflow, and sediment yield. While the observed peak of precipitation occurred in August, the simulated peak of streamflow and sediment yield occurred in September. However, the INMCM4 and MPI-ESM1-2HR models showed that both historical and future peaks for all variables occurred in July. The ACCESS-CM2 model indicated that historical and future peaks occurred in August, while the Ecearth3 model showed a peak in August for precipitation but a peak in September for streamflow and sediment yield. The CanESM5 model displayed a peak in September for precipitation, but peaks in October for streamflow and sediment yield. Furthermore, the projected annual average precipitation, surface runoff, and sediment yield for the Dry-Warm and Cold-Wet models indicate a higher intensity compared to the historical period. This increase in sediment yield has negatively impacted the soil properties of agricultural lands, reservoir capacity, and drinking water quality in the Nagavali and Vamsadhara watersheds. These findings emphasize the necessity of implementing adaptive management strategies and watershed management structures to mitigate the adverse impacts of increased sediment yield and ensure the sustainable management of water resources in the Nagavali and Vamsadhara watersheds.
The availability of data for model calibration and validation gives rise to a few limitations in most of the modelling studies. In this study, we had observed data of daily streamflow and sediment concentration at two outlet points, one for each river basin, specifically at Srikakulam over the Nagavali watershed and at Kashinagar over the Vamsadhara watershed, where we performed calibration and validation [47]. However, multisite calibration and validation over the watersheds was not performed. The reservoir emergency and principal spillway volumes and surface area details which were imported into the model. The complete details such as reservoir inflow and outflows were not available, and uncertainties may occur in the model as a result. Additionally, the CMIP6 models’ precipitation and temperature data may have some bias as we considered individual model values. In the present study, during bias correction, we considered the ensemble of multiple models. However, it is advisable to perform bias correction of individual models before considering the models for ensemble. Moreover, the changes in land use and land cover in the future are assumed to remain unchanged. This assumption could have added some uncertainty in the model results. Furthermore, it is important to prioritize the management of critical sediment source areas in order to improve soil water conservation measures in these river basins. This research methodology can be extended to other parts of the world with similar river basin characteristics.

Author Contributions

Conceptualization, N.R.N. and V.R.K.; methodology, V.S., V.R.K. and N.R.N.; software, R.S. and V.R.K.; validation, R.S., V.S. and V.R.K.; formal analysis, N.R.N. and G.V.R.; investigation, N.R.N.; resources, V.R.K.; data curation, N.R.N.; writing—original draft preparation, N.R.N.; writing—review and editing, V.S. and V.R.K.; visualization, N.R.N.; supervision, V.R.K., V.S. and R.S.; project administration, V.R.K.; funding acquisition, V.R.K. All authors have read and agreed to the published version of the manuscript.

Funding

The research described in this paper is carried out with fund by Ministry of Human Resource Development (MHRD), Government of India under Scheme for Promotion of Academic and Research Collaboration (SPARC) through project number P270. The corresponding author’s effort was funded in part by the Virginia Agricultural Experiment Station (Blacksburg) and through the Hatch Program of the National Institute of Food and Agriculture at the United States Department of Agriculture (Washington, DC, USA) and as a FulbrightNehru senior scholar funded by the United States India Educational Foundation.

Institutional Review Board Statement

Not applicable.

Informed Consent Statement

The submitted work is original and it not published elsewhere in any form or language (partially or in full). It is not submitted to any other journal for simultaneous consideration. Results are presented clearly, honestly, and without fabrication, falsification or inappropriate data manipulation. Proper acknowledgements to other works are given wherever it is appropriate.

Data Availability Statement

Data available from the corresponding author upon request.

Conflicts of Interest

The authors declare that they have no known competing financial interests or personal relationships that could have appeared to influence the work reported in this paper.

References

  1. Sridhar, V.; Anderson, K.A. Human-induced modifications to boundary layer fluxes and their water management implications in a changing climate. Agric. For. Meteorol. 2017, 234, 66–79. [Google Scholar] [CrossRef] [Green Version]
  2. Seong, C.; Sridhar, V.; Billah, M.M. Implications of potential evapotranspiration methods for streamflow estimation in a changing climate. Int. J. Clim. 2018, 38, 896–914. [Google Scholar] [CrossRef]
  3. Ma, D.; Xu, Y.-P.; Xuan, W.; Gu, H.; Sun, Z.; Bai, Z. Do model parameters change under changing climate and land use in the upstream of the Lancang River Basin, China? Hydrol. Sci. J. 2020, 65, 1894–1908. [Google Scholar] [CrossRef]
  4. de Oliveira, V.A.; de Mello, C.R.; Viola, M.R.; Srinivasan, R. Assessment of climate change impacts on streamflow and hydropower potential in the headwater region of the Grande river basin, Southeastern Brazil. Int. J. Climatol. 2017, 37, 5005–5023. [Google Scholar] [CrossRef]
  5. Zhong, R.; Zhao, T.; He, Y.; Chen, X. Hydropower change of the water tower of Asia in 21st century: A case of the Lancang River hydropower base, upper Mekong. Energy 2019, 179, 685–696. [Google Scholar] [CrossRef]
  6. Ma, D.; Xu, Y.P.; Gu, H.; Zhu, Q.; Sun, Z.; Xuan, W. Role of satellite and reanalysis precipitation products in streamflow and sediment modeling over a typical alpine and gorge region in Southwest China. Sci. Total. Environ. 2019, 685, 934–950. [Google Scholar] [CrossRef]
  7. Intergovernmental Panel on Climate Change (IPCC). Climate Change 2014: Synthesis Report; IPCC: Geneva, Switzerland, 2014; pp. 1–15.
  8. Singh, L.; Saravanan, S. Impact of climate change on hydrology components using CORDEX South Asia climate model in Wunna, Bharathpuzha, and Mahanadi, India. Environ. Monit. Assess. 2020, 192, 1–21. [Google Scholar] [CrossRef]
  9. Kumar, K.S.; Rathnam, E.V.; Sridhar, V. Tracking seasonal fluctuations of drought indices with GRACE terrestrial water storage over major river basins in South India. Sci. Total. Environ. 2020, 763, 142994. [Google Scholar] [CrossRef]
  10. Aggarwal, R.; Kaushal, M.; Kaur, S.; Farmaha, B. Water resource management for sustainable agriculture in Punjab, India. Water Sci. Technol. 2009, 60, 2905–2911. [Google Scholar] [CrossRef]
  11. Nilawar, A.P.; Waikar, M.L. Impacts of climate change on streamflow and sediment concentration under RCP 4.5 and 8.5: A case study in Purna river basin, India. Sci. Total. Environ. 2019, 650, 2685–2696. [Google Scholar] [CrossRef]
  12. Sujatha, E.R.; Sridhar, V. Mapping Debris Flow Susceptibility using Analytical Network Process. J. Earth Syst. Sci. 2017, 126, 116. [Google Scholar] [CrossRef] [Green Version]
  13. Sujatha, E.R.; Sridhar, V. Landslide Susceptibility Analysis in the Era of Climate Change: A Logistic Regression Model Case Study in Coonoor, India. Hydrology 2021, 8, 41. [Google Scholar] [CrossRef]
  14. Ibrahim, K.S.M.H.; Huang, Y.F.; Ahmed, A.N.; Koo, C.H.; El-Shafie, A. A review of the hybrid artificial intelligence and optimization modelling of hydrological streamflow forecasting. Alex. Eng. J. 2022, 61, 279–303. [Google Scholar] [CrossRef]
  15. Latif, S.D.; Ahmed, A.N. A review of deep learning and machine learning techniques for hydrological inflow forecasting. Environ. Dev. Sustain. 2023, 2023, 1–28. [Google Scholar] [CrossRef]
  16. Hoekema, D.J.; Sridhar, V. A System Dynamics Model for Conjunctive Management of Water Resources in the Snake River Basin. J. Am. Water Resour. Assoc. 2013, 49, 1327–1350. [Google Scholar] [CrossRef]
  17. Reddy, N.N.; Reddy, K.V.; Vani, J.S.L.S.; Daggupati, P.; Srinivasan, R. Climate change impact analysis on watershed using QSWAT. Spat. Inf. Res. 2018, 26, 253–259. [Google Scholar] [CrossRef]
  18. Mohseni, U.; Agnihotri, P.G.; Pande, C.B.; Durin, B. Understanding the Climate Change and Land Use Impact on Streamflow in the Present and Future under CMIP6 Climate Scenarios for the Parvara Mula Basin, India. Water 2023, 15, 1753. [Google Scholar] [CrossRef]
  19. Maurya, S.; Srivastava, P.K.; Zhuo, L.; Yaduvanshi, A.; Mall, R.K. Future Climate Change Impact on the Streamflow of Mahi River Basin under Different General Circulation Model Scenarios. Water Resour. Manag. 2023, 37, 2675–2696. [Google Scholar] [CrossRef]
  20. Mahdian, M.; Hosseinzadeh, M.; Siadatmousavi, S.M.; Chalipa, Z.; Delavar, M.; Guo, M.; Abolfathi, S.; Noori, R. Modelling impacts of climate change and anthropogenic activities on inflows and sediment loads of wetlands: Case study of the Anzali wetland. Sci. Rep. 2023, 13, 5399. [Google Scholar] [CrossRef]
  21. Kang, H.; Sridhar, V.; Mainuddin, M.; Trung, L.D. Future rice farming threatened by drought in the Lower Mekong Basin. Nat. Sci. Rep. 2021, 11, 9383. [Google Scholar] [CrossRef]
  22. Sridhar, V.; Ali, S.A.; Sample, D.J. Systems Analysis of Coupled Natural and Human Processes in the Mekong River Basin. Hydrology 2021, 8, 140. [Google Scholar] [CrossRef]
  23. Seong, C.H.; Sridhar, V. Hydroclimatic variability and change in the Chesapeake Bay Watershed. J. Water Clim. Chang. 2016, 8, 254–273. [Google Scholar] [CrossRef] [Green Version]
  24. Tiwari, R.; Mishra, A.K.; Rai, S.; Pandey, L.K. Evaluation and projection of northeast monsoon precipitation over India under higher warming scenario: A multimodel assessment of CMIP6. Theor. Appl. Clim. 2023, 151, 859–870. [Google Scholar] [CrossRef]
  25. Shiru, M.S.; Chung, E.S. Performance evaluation of CMIP6 global climate models for selecting models for climate projection over Nigeria. Theor. Appl. Clim. 2021, 146, 599–615. [Google Scholar] [CrossRef]
  26. Kang, H.; Sridhar, V.; Ali, S.A. Climate change impacts on conventional and flash droughts in the Mekong River Basin. Sci. Total. Environ. 2022, 838 Pt 2, 155845. [Google Scholar] [CrossRef]
  27. Kang, H.; Sridhar, V. A novel approach combining simulated soil moisture and stochastic techniques to forecasting drought in the Mekong River basin. Int. J. Clim. 2020, 41, E2497–E2516. [Google Scholar] [CrossRef]
  28. Kang, H.; Sridhar, V.; Mills, B.; Hession, W.C.; Ogejo, J.A. Economy-Wide Climate Change Impacts on Green Water Droughts Based on the Hydrologic Simulations. Agric. Syst. 2019, 171, 76–88. [Google Scholar] [CrossRef]
  29. Setti, S.; Maheswaran, R.; Sridhar, V.; Barik, K.K.; Merz, B.; Agarwal, A. Inter-Comparison of Gauge-Based Gridded Data, Reanalysis and Satellite Precipitation Product with an Emphasis on Hydrological Modeling. Atmosphere 2020, 11, 1252. [Google Scholar] [CrossRef]
  30. Setti, S.; Maheswaran, R.; Radha, D.; Sridhar, V.; Barik, K.K.; Narasimham, M.L. Attribution of hydrologic changes in a tropical river basin to climate and land use change: A case study from India. ASCE J. Hydrol. Eng. 2020, 25, 05020015. [Google Scholar] [CrossRef]
  31. Ma, D.; Qian, B.; Gu, H.; Sun, Z.; Xu, Y.P. Assessing climate change impacts on streamflow and sediment load in the upstream of the Mekong River basin. Int. J. Clim. 2021, 41, 3391–3410. [Google Scholar] [CrossRef]
  32. Pandey, A.; Palmate, S.S. Assessing future water–sediment interaction and critical area prioritization at sub-watershed level for sustainable management. Paddy Water Environ. 2019, 17, 373–382. [Google Scholar] [CrossRef]
  33. Azari, M.; Moradi, H.R.; Saghafian, B.; Faramarzi, M. Climate change impacts on streamflow and sediment yield in the North of Iran. Hydrol. Sci. J. 2016, 61, 123–133. [Google Scholar] [CrossRef]
  34. Jin, L.; Whitehead, P.G.; Rodda, H.; Macadam, I.; Sarkar, S. Simulating climate change and socio-economic change impacts on flows and water quality in the Mahanadi River system, India. Sci. Total. Environ. 2018, 637, 907–917. [Google Scholar] [CrossRef]
  35. Rao, K.K.; Kulkarni, A.; Patwardhan, S.; Kumar, B.V.; Kumar, T.V.L. Future changes in precipitation extremes during northeast monsoon over south peninsular India. Theor. Appl. Clim. 2020, 142, 205–217. [Google Scholar] [CrossRef]
  36. Mishra, V.; Bhatia, U.; Tiwari, A.D. Bias-corrected climate projections for South Asia from Coupled Model Intercomparison Project-6. Sci. Data 2020, 7, 1–13. [Google Scholar] [CrossRef]
  37. Hengade, N.; Eldho, T.I.; Ghosh, S. Climate change impact assessment of a river basin using CMIP5 climate models and the VIC hydrological model. Hydrol. Sci. J. 2018, 63, 596–614. [Google Scholar] [CrossRef]
  38. Pandey, B.K.; Gosain, A.K.; Paul, G.; Khare, D. Climate change impact assessment on hydrology of a small watershed using semi-distributed model. Appl. Water Sci. 2017, 7, 2029–2041. [Google Scholar] [CrossRef] [Green Version]
  39. Swain, S. Impact of climate variability over Mahanadi river basin. Int. J. Eng. Res. Technol. 2014, 3, 938–943. [Google Scholar]
  40. CWC. Compendium on sedimentation of reservoirs in India. In Water Planning and Projects Wing, Environment Management Organisation, Watershed and Reservoir Sedimentation Directorate, Central Water Commission; Government of India: New Delhi, India, 2020. [Google Scholar]
  41. Eadara, A.; Kannam, H. Slope studies of Vamsadhara River basin: A Quantitative Approach. Int. J. Eng. Innov. Technol. 2013, 3, 184–188. [Google Scholar]
  42. Rao, G.V.; Reddy, K.V.; Srinivasan, R.; Sridhar, V.; Umamahesh, N.V.; Pratap, D. Spatio-temporal analysis of rainfall extremes in the flood-prone Nagavali and Vamsadhara Basins in eastern India. Weather. Clim. Extrem. 2020, 29, 100265. [Google Scholar] [CrossRef]
  43. Rao, G.V.; Reddy, K.V.; Sridhar, V. Sensitivity of Microphysical Schemes on the Simulation of Post-Monsoon Tropical Cyclones over the North Indian Ocean. Atmosphere 2020, 11, 1297. [Google Scholar] [CrossRef]
  44. Ge, F.; Zhu, S.; Luo, H.; Zhi, X.; Wang, H. Future changes in precipitation extremes over Southeast Asia: Insights from CMIP6 multi-model ensemble. Environ. Res. Lett. 2021, 16, 024013. [Google Scholar] [CrossRef]
  45. Mishra, V.; Bhatia, U.; Tiwari, A.D. Bias Corrected Climate Projections from CMIP6 Models for Indian Sub-Continental River Basins [Data set]. Zenodo. Available online: https://doi.org/10.5281/zenodo.3874046 (accessed on 24 June 2023).
  46. Kebede, A.S.; Nicholls, R.J.; Allan, A.; Arto, I.; Cazcarro, I.; Fernandes, J.A.; Hill, C.T.; Hutton, C.W.; Kay, S.; Lázár, A.N.; et al. Applying the global RCP–SSP–SPA scenario framework at sub-national scale: A multi-scale and participatory scenario approach. Sci. Total. Environ. 2018, 635, 659–672. [Google Scholar] [CrossRef]
  47. Nagireddy, N.R.; Keesara, V.R.; Sridhar, V.; Srinivasan, R. Streamflow and Sediment Yield Analysis of Two Medium-Sized East-Flowing River Basins of India. Water 2022, 14, 2960. [Google Scholar] [CrossRef]
  48. Neitsch, S.L.; Arnold, J.G.; Kiniry, J.R.; Williams, J.R. Soil and Water Assessment Tool Theoretical Documentation Version 2009; Texas Water Resources Institute: College Station, TX, USA, 2011. [Google Scholar]
  49. Arnold, J.G.; Moriasi, D.N.; Gassman, P.W.; Abbaspour, K.C.; White, M.J.; Srinivasan, R.; Santhi, C.; Harmel, R.D.; Van Griensven, A.; Van Liew, M.W.; et al. SWAT: Model use, calibration, and validation. Trans. ASABE 2012, 55, 1491–1508. [Google Scholar] [CrossRef]
  50. Gassman, P.W.; Reyes, M.R.; Green, C.H.; Arnold, J.G. The Soil and Water Assessment Tool: Historical Development, Applications, and Future Research Directions. Trans. ASABE 2007, 50, 1211–1250. [Google Scholar] [CrossRef] [Green Version]
  51. Douglas-Mankin, K.R.; Srinivasan, R.; Arnold, J.G. Soil and Water Assessment Tool (SWAT) Model: Current Developments and Applications. Trans. ASABE 2010, 53, 1423–1431. [Google Scholar] [CrossRef]
  52. Wilby, R.L.; Dawson, C.W.; Murphy, C.; O’connor, P.O.; Hawkins, E. The Statistical DownScaling Model-Decision Centric (SDSM-DC): Conceptual basis and applications. Clim. Res. 2014, 61, 259–276. [Google Scholar] [CrossRef] [Green Version]
  53. Khan, A.J.; Koch, M. Selecting and Downscaling a Set of Climate Models for Projecting Climatic Change for Impact Assessment in the Upper Indus Basin (UIB). Climate 2018, 6, 89. [Google Scholar] [CrossRef] [Green Version]
  54. Moriasi, D.N.; Arnold, J.G.; van Liew, M.W.; Bingner, R.L.; Harmel, R.D.; Veith, T.L. Model evaluation guidelines for systematic quantification of accuracy in watershed simulations. Trans. ASABE 2007, 50, 885–900. [Google Scholar] [CrossRef]
  55. Setti, S.; Rathinasamy, M.; Chandramouli, S. Assessment of water balance for a forest dominated coastal river basin in India using a semi distributed hydrological model. Model. Earth Syst. Environ. 2018, 4, 127–140. [Google Scholar] [CrossRef]
Figure 1. Location map of the study area.
Applsci 13 07554 g001
Figure 2. Methodology followed in the present study.
Applsci 13 07554 g002
Figure 3. Predicted changes in average temperature (ΔT) and annual precipitation (%ΔP) from 2022 to 2100 compared to 1975 to 2015 using data from 13 different models. The blue crosses represent the 10th, 50th, and 90th percentile values for %ΔP and ΔT.
Applsci 13 07554 g003
Figure 4. Mean monthly precipitation, streamflow, and sediment yield for the Nagavali watershed (a) and the Vamsadhara watershed (b) based on historical data from 1975 to 2014.
Applsci 13 07554 g004
Figure 5. Projected mean monthly precipitation in the Nagavali and Vamsadhara watersheds under three different scenarios (SSP245, SSP370, and SSP585). Panel (a) represents the Nagavali watershed and panel (b) represents the Vamsadhara watershed.
Applsci 13 07554 g005
Figure 6. Projected mean monthly streamflow for the Nagavali and Vamsadhara watersheds under three different scenarios: SSP245, SSP370, and SSP585. Panel (a) shows the Nagavali watershed and panel (b) shows the Vamsadhara watershed.
Applsci 13 07554 g006
Figure 7. Projected mean monthly sediment yield for the Nagavali and Vamsadhara watersheds under three different scenarios: SSP245, SSP370, and SSP585. Panel (a) displays the Nagavali watershed and panel (b) displays the Vamsadhara watershed.
Applsci 13 07554 g007
Figure 8. Spatial distribution of annual average precipitation, surface runoff, and sediment yield for the period of 1975–2014.
Applsci 13 07554 g008
Figure 9. Spatial distribution of annual average precipitation, surface runoff and sediment yield based on the Dry-Warm (ACCESS-CM2) model.
Applsci 13 07554 g009
Figure 10. Spatial distribution of annual average precipitation, surface runoff, and sediment yield based on the Cold-Wet (EC-Earth3) model.
Applsci 13 07554 g010
Table 1. Selection criteria of GCM models.
S.NoModel Representing Corners in the Full SpectrumSelection Criteria
1Cold-Dry 10th percentile of %(ΔP) as well as 10th percentile of ΔT
2Cold-Wet 90th percentile of %(ΔP) as well as 10th percentile of ΔT
3Warm-Wet 90th percentile of %(ΔP) as well as 90th percentile of ΔT
4Warm-Dry 10th percentile of %(ΔP) as well as 90th percentile of ΔT
5Average50th percentile of %(ΔP) as well as 50th percentile of ΔT
Table 2. RCM models and the corresponding scenarios they represent.
Model NameRepresenting Scenario
CanESM5Warm-Wet
Ecearth3Cold-Wet
INMCM4Average
MPI-ESM1-2HRCold-Dry
ACCESS-CM2Warm-Dry
Table 3. Percentage difference between the observed data from the Indian Meteorological Department (IMD) and the historical data simulated from the model.
Model Name% Bias in Precipitation
Nagavali River Basin Vamsadhara River Basin
Ecearth3+1.59+3.49
MPI-ESM1-2HR+0.63+2.36
CanESM5+0.69+3.32
ACCESS-CM2−4.73−2.86
INMCM4+1.29+3.71
Note: ‘+’ sign indicates climate model value is lower than observed IMD value, ‘−’ sign indicates climate model value higher than observed IMD value.
Table 4. Percentage change in precipitation compared to historical data.
SSP ScenarioPeriodRepresenting Scenario% Change in Precipitation
NRBVRB
SSP245Near future
(2022–2060)
Warm-Wet−4.51−2.06
Cold-Wet+7.51+5.35
Average+5.66+4.47
Cold-Dry−1.33−4.60
Warm-Dry−0.17+0.96
Far future
(2061–2100)
Warm-Wet+25.52+24.58
Cold-Wet+19.91+18.04
Average+13.27+11.74
Cold-Dry+10.29+7.80
Warm-Dry+7.89+6.49
SSP370Near future
(2022–2060)
Warm-Wet+17.79+19.30
Cold-Wet+8.30+7.06
Average+4.29+2.54
Cold-Dry−2.68−3.55
Warm-Dry−0.51+0.45
Far future
(2061–2100)
Warm-Wet+36.41+35.93
Cold-Wet+34.73+34.60
Average+19.45+13.53
Cold-Dry+7.57+4.34
Warm-Dry+1.65−0.24
SSP585Near future
(2022–2060)
Warm-Wet+23.88+22.87
Cold-Wet+9.27+7.69
Average+14.32+10.60
Cold-Dry−1.09−2.50
Warm-Dry−1.57+0.44
Far future
(2061–2100)
Warm-Wet+60.51+59.09
Cold-Wet+35.10+31.38
Average+22.11+16.35
Cold-Dry+25.52+19.46
Warm-Dry+8.48+7.51
Note: ‘+’ sign indicates increasing in future, ‘−’ sign indicates decreasing in future, NRB—Nagavali River Basin, VRB—Vamsadhara River Basin.
Table 5. Percentage change in streamflow and sediment yield compared to historical data.
SSP ScenarioPeriodRepresenting Scenario% Change in Streamflow% Change in Sediment Yield
NRBVRBNRBVRB
SSP245Near future
(2022–2060)
Warm-Wet−10.94−0.83−12.08+2.58
Cold-Wet+5.62+5.75+1.93+6.14
Average+1.96+7.32+4.63+3.11
Cold-Dry−6.08−11.24−8.96−8.91
Warm-Dry−7.85−4.61−15.59−3.72
Far future
(2061–2100)
Warm-Wet+41.19+40.39+37.23+44.38
Cold-Wet+27.91+26.98+44.91+43.45
Average+11.75+14.67+14.08+17.11
Cold-Dry+7.24+9.54+4.47+6.27
Warm-Dry+3.43+0.42+7.96+5.65
SSP370Near future
(2022–2060)
Warm-Wet+32.68+38.01+32.06+46.99
Cold-Wet+3.21+7.28+1.09+7.12
Average+1.62+0.24−6.71−3.02
Cold-Dry−21.53−9.78−28.62−12.82
Warm-Dry−6.47+3.56−1.08+16.65
Far future
(2061–2100)
Warm-Wet+77.71+70.03+121.86+94.21
Cold-Wet+69.31+60.88+129.78+107.62
Average+35.05+19.21+35.10+21.04
Cold-Dry+4.38+3.78+5.97+2.27
Warm-Dry−9.68−12.06−5.28−12.49
SSP585Near future
(2022–2060)
Warm-Wet+39.27+38.71+56.54+36.06
Cold-Wet+5.88+10.26+6.62+15.19
Average+21.51+16.72+30.92+18.02
Cold-Dry−15.78−6.77−20.99−3.57
Warm-Dry−2.38+1.45+2.48+4.13
Far future
(2061–2100)
Warm-Wet+134.41+110.60+166.49+148.67
Cold-Wet+68.89+53.04+123.34+95.03
Average+39.35+22.38+40.24+39.54
Cold-Dry+37.84+29.89+45.54+32.65
Warm-Dry−7.71−7.55−5.27−6.71
Note: ‘+’ sign indicates increasing in future, ‘−’sign indicates decreasing in future, NRB—Nagavali River Basin, VRB—Vamsadhara River Basin.
Disclaimer/Publisher’s Note: The statements, opinions and data contained in all publications are solely those of the individual author(s) and contributor(s) and not of MDPI and/or the editor(s). MDPI and/or the editor(s) disclaim responsibility for any injury to people or property resulting from any ideas, methods, instructions or products referred to in the content.