Article

A Logic-Tree Approach for Probabilistic Seismic Hazard Assessment in the Administrative Region of Attica (Greece)

1
Department of Geophysics and Geothermics, Faculty of Geology and Geoenvironment, National and Kapodistrian University of Athens (NKUA), Panepistimiopolis, Zografou, 15784 Athens, Greece
2
Geophysics Department, Faculty of Geology, Aristotle University of Thessaloniki (AUTH), 54124 Thessaloniki, Greece
3
Department of Dynamic Tectonic Applied Geology, Faculty of Geology and Geoenvironment, National and Kapodistrian University of Athens (NKUA), Panepistimiopolis, Zografou, 15784 Athens, Greece
*
Author to whom correspondence should be addressed.
Appl. Sci. 2023, 13(13), 7553; https://doi.org/10.3390/app13137553
Submission received: 28 March 2023 / Revised: 19 June 2023 / Accepted: 25 June 2023 / Published: 26 June 2023
(This article belongs to the Section Earth Sciences)

Abstract

:
Probabilistic Seismic Hazard Assessment (PSHA) was carried out for the administrative region of Attica (Greece). Peak Ground Acceleration (PGA) and Peak Ground Velocity (PGV) values were calculated for return periods of 475 and 950 years for five sub-areas covering the entire region. PGA hazard curves and Uniform Hazard Spectra (UHS) in terms of spectral acceleration (Sa) values were generated for Athens, Methana, and the capitals of each island of Attica (Salamina, Aegina, Poros, Hydra, Spetses, Kythira, and Antikythira). Area sources were adopted from the Euro-Mediterranean Seismic Hazard Model 2013 (ESHM13) and its update, ESHM20, taking into account both crustal and slab tectonic environments. Ground Motion Prediction Equations (GMPEs) proposed for the Greek territory were ranked for PGA and PGV. Each GMPE was reconstructed as a weighted model, accounting for normal and non-normal focal mechanisms for each area source. PGA, PGV, and Sa values were computed using a logic tree, integrating the seismotectonic models as major branches and sub-logic trees, comprised of multiple ranked GMPEs for each area source, as minor branches. The results showed higher seismic hazard values in sub-areas near the Gulf of Corinth and the slab interface, which could indicate a need to revise the active building code in Attica.

1. Introduction

Greece is the most seismically active area in Europe, hosting 2% of the global seismic energy being released on average every year [1]. The administrative region of Attica, despite not being one of the most seismically hazardous in Greece, is of great concern in terms of seismic risk, as it includes the capital of the country, Athens, which is the most densely populated area, with a population of over 3 million, and holding major financially, industrially, and socially important infrastructure. Well-established sources of information concerning historical seismicity in Greece (i.e., before 1900 CE) are the catalogs of Papazachos and Papazachou [2], which contain earthquakes that occurred since antiquity, and of the international European project SHARE [3], which features the former, among a plethora of other sources, but begins from the year 1000 CE. The catalog of historical earthquakes that have affected the administrative region of Attica includes 73 events between 550 BCE and 1898 CE, with magnitudes in the range of 4.6–7.2 (Figure 1). Seismicity during the instrumental era (since 1900) is available from the catalog of Makropoulos et al. [4], which includes earthquakes of magnitude Mw ≥ 4.1, with the completeness gradually improving towards more recent years, up to 2009. In order to include events after 2009, the catalog was homogenously extended up to 2019 (Figure 1). Regional and local monitoring has been remarkably improved since the establishment of the Hellenic Unified Seismic Network (HUSN; [5]) in 2008.
Some of the more notable historical earthquakes that affected Attica’s mainland include the 480 BCE, M = 6.3 Salamina earthquake; the 420 BCE, M = 6.0 earthquake, which impacted Athens and Corinth; the 1321 CE, M = 6.5 earthquake near Thiva, with an estimated macroseismic intensity of I = VIII; the June 1402, M = 6.8 earthquake at Xylokastro, with I = IX; the August 1417, M = 6.4 earthquake at Euboea; and the 17 September 1805, M < 6.0 event close to Athens, with I = VII [2]. Destructive earthquakes of estimated magnitudes of 6.6 and 7.0 [2] occurred on 20 and 27 April 1894, respectively, at Atalanti [7,8]. The most consequential earthquake that affected the mainland of Attica during the instrumental era was the Mw = 6.0 event that occurred on 7 September 1999, at 11:56:50 UTC at the southern flank of Parnitha Mt, about 20 km NW of Athens, causing extensive damage, collapses, and human casualties. Despite not being one of the strongest earthquakes in Greece, its proximity to the country’s capital and socioeconomic center had a detrimental effect. Numerous research groups have studied this mainshock and its rich aftershock sequence (e.g., [9,10,11]). Nearly 20 years later, on 19 July 2019, a Mw = 5.1 event struck the same area [8], at the western part of Parnitha Mt. Kapetanidis et al. [12] relocated both sequences, concluding that the latter event occurred on the same fault, whose up-dip extension towards the east is associated with the surface expression of the Fili fault on Parnitha Mt. Another significant earthquake sequence that affected Attica’s mainland was the one consisting of three major events that occurred on 24 and 25 February and 4 March 1981 at the Eastern Gulf of Corinth [13,14,15]. These earthquakes caused extensive collapses near the epicentral area, and damage was also reported in Attica. In total, 109 earthquakes with M ≥ 4.0 were recorded in 1981, whereas only 27 occurred in 1982. The area close to the Eastern Gulf of Corinth recently exhibited increased seismic activity during a swarm that evolved between March and September 2020 at the Perachora peninsula, with magnitudes M ≤ 3.7 [16,17,18]. A notable swarm occurred near Villia in June 2013, including six events of 3.0 ≤ ML ≤ 3.5, whereas an isolated M = 4.4 event also struck further west on 20 September 2013 but was not followed by significant aftershocks [19]. Just north of Attica, another area that is known to host significant earthquakes is Thiva. The recent seismicity in this region includes a Mw = 4.6 event on 2 December 2020 [20] and the major events (3.4 ≤ M ≤ 4.2) of a long-lasting swarm that began in July 2021 [21]. These events were also felt in Athens; however, due to their small magnitudes, they did not cause any damage. In the Marathon area, Eastern Attica, a small sequence with a maximum magnitude of M = 4.2 occurred in 2018 [22]. All of the above-mentioned earthquakes of the instrumental era involved mainly normal faulting in a roughly E-W direction, in accordance with the regional stress field, which indicates extension in an approximately N-S direction [23].
Concerning the islands of the Saronic and Argolic Gulfs, as well as the areas of Trizinia and Methana, the most significant historical earthquakes include the 480 BCE, M = 6.3 one that was mainly felt at Salamina Island; the 1457 CE, M = 6.3 one at Hydra, with estimated intensity of I = VII; the 20 March 1837 CE, M = 6.0 one at Trizinia with I = VII; and the 25 July 1873 CE, M = 5.9 one at Epidaurus, with I = VII [2]. The Saronic Gulf and Trizinia hosted several significant earthquakes during the instrumental era. In 2016, a series of earthquakes occurred east of Poros Island, which is considered a rare instance for that area [24]. The largest concentration of activity is located at the westernmost end of the Saronic Gulf. Within the latter, and towards the Aegean Sea, seismicity is less frequent and occurs at greater depths. In the immediate area of Hydra and Spetses Islands, no concentration of significant seismicity is apparent, which is consistent with the absence of major mapped tectonic structures. On the contrary, some earthquakes of significant magnitude in the broader area have occurred at intermediate depths, associated with the subducting slab, such as an Mw = 6.0 one in 1948 at a focal depth of 88 km with the epicenter near Dokos Island, and an Mw = 6.4 one in 1962 at a depth of 94 km below Corinth. More recently, on 6 January 2008, an Mw = 6.3 event occurred at a depth of 84 km in the epicentral area of Leonidio [25,26]. This event was also felt on Attica’s mainland.
Lastly, at the southernmost part of the Administrative Region of Attica, and quite remote from the mainland, the islands of Kythira and Antikythira have been mainly affected by earthquakes related to the Hellenic subduction. Some notable historical events include the 1717 CE, M = 7.0 one in Crete, with I = VIII, which had a significant impact on the islands of Kythira and Antikythira; the 7 June 1750, M = 7.2 one at Kythira, with I = IX, preceded by another strong earthquake on 12 May; and the 29 June 1798, M = 6.4 one at Kythira, with I = VIII [2]. Also of great importance for this area was the 21 July 365 CE earthquake of Crete, with an estimated magnitude of 8.3–8.5 [2,27], which caused a devastating tsunami [28,29]. In the instrumental era, an M = 7.6 event occurred on 11 August 1903 at 04:32:54 UTC, with the epicenter at the northern part of Kythira at a focal depth of 120 km, with I = IX [2]. The most recent significant earthquake in this area was the 8 January 2006, Mw = 6.5 event, which occurred at a focal depth of 58 km, about 10 km east of Kythira [4]. The earthquake was felt in Attica’s mainland and in neighboring countries (Italy, Turkey, Egypt, Cyprus, Israel, Syria, Jordan, and Lebanon) but did not cause significant damage due to its large depth [30]. These intermediate-depth earthquakes near Kythira are mainly associated with either (oblique-) reverse or strike-slip faulting.
The Attica region consists of continental and island areas belonging to different parts of the Hellenic Arc. More specifically, Kythira and Antikythira are located at the southwest Hellenic forearc, whereas Attica, with the Athens metropolitan region, belongs to the back-arc area. They present differences in their geological structure, including the participation of geotectonic units of the Internal Carbonate Platform in the geological structure of Attica, which are absent from the southern island part of the region, where the geotectonic units of the External Carbonate Platform and the Pindos Oceanic Basin predominate [31]. Their neotectonic structure, however, is characterized by the presence of active faults [32,33,34,35,36,37,38,39,40,41], which have the potential to produce earthquakes with magnitudes equal to or greater than Mw = 6.0 [42,43,44] with significant impact on elements of the natural and built environment.
Typical examples of such onshore active faults in the continental part of the Attica region have been mapped in the framework of multiparametric surveys [34,39,43,45,46]. In the insular part of the Attica region, onshore active structures are located on the islands of Salamina [35,36] and Aegina, located in the Saronic Gulf, and on Kythira and Antikythira Islands in the south [40,41,45]. The common characteristics of these active structures refer to their spatial distribution and kinematics. They are normal to oblique–normal faults, as in some of them the contribution of the horizontal component in the movement of the fault zones is significant. They have formed mostly along the margins of neotectonic macrostructures (horsts and grabens) and delineate Neogene and Quaternary deposits that have filled the post-alpine basins. They are clearly observed either as impressive best-preserved mirror-like fault surfaces or through well-preserved morphological discontinuities of tectonic origin. They have greatly controlled the formation and evolution of secondary tectonic landforms, such as the drainage networks showing steep bends under the influence of active faults, selective flow paths under the synergy of active tectonics and lithology, asymmetries in development with respect to the main branch due to tilting of fault blocks, and intense incision along branches developing transversely to active faults due to tectonic uplift. As has been deduced from studies on the type and distribution of earthquake environmental effects and building damage, marginal fault zones have controlled the distribution of these phenomena [9,32,39,46].
Seismic hazard is primarily related to the ground movement that is caused by earthquake occurrences. The goal of a seismic hazard assessment is to quantify the level of seismic hazard by computing ground motions and accounting for the associated epistemic uncertainties [47]. Ground motions can be expressed in terms of seismic intensity measures, such as Peak Ground Acceleration (PGA), Peak Ground Velocity (PGV), and spectral acceleration (Sa) values for each case study. PGA and PGV represent the maximum absolute acceleration and velocity that a Single Degree of Freedom (SDOF) system can experience while having infinite stiffness, which denotes a natural period of vibration equal to zero. On the other hand, a response spectrum displays the maximum Sa values of numerous SDOF systems with various natural vibration periods exposed to the same seismic input. Probabilistic Seismic Hazard Assessment (PSHA) is a reliable method for the computation of the aforementioned parameters, as it accounts for uncertainty through variability that is associated with seismic sources, ground motion prediction equations (GMPEs), and local site conditions [47,48,49,50,51]. PSHA uses an approach that incorporates a range of possible earthquake occurrences and their associated probabilities, providing a more comprehensive and realistic estimation of the seismic hazard [47,48,49,50,51]. There have been various seismic hazard assessment studies for the Greek territory [52,53,54,55,56,57,58,59]. In this paper, we assess seismic hazard by computing PGA, PGV, and Sa values for the administrative region of Attica, including its islands, which is critical, as it composes 27% of the total population of the country [60].

2. Materials and Methods

We followed the approach proposed by Cornell [61] and McGuire [62] to estimate the spatial distribution of PGA and PGV and to compute the Sa values. The study area was divided into five sub-areas in order to maintain a dense grid and to reduce computational time. The first sub-area pertains to the mainland of Attica, the second encompasses Salamina and Aegina, the third Methana and Poros, the fourth Hydra and Spetses, and the fifth Kythira and Antikythira (Figure 1).

2.1. Earthquake Catalog

The utilization of an earthquake catalog that is as complete and accurate as possible constitutes a fundamental element in PSHA. However, this task could be challenging, mainly due to the heterogeneous history of earthquake reporting and magnitude estimates. The instrumental earthquake catalog of Makropoulos et al. [4] was employed to reliably calculate the seismicity parameters necessary for PSHA. In order to expand the original timespan of the catalog, which covers the period from 1900 to 2009, and to include more recent earthquakes with Mw ≥ 4.1, the catalog was uniformly extended to 2019, resulting in the inclusion of 6918 additional earthquakes that were used for the present seismic hazard assessment. The decision to exclude earthquakes that occurred after 2019 was based on the use of the reviewed events from the International Seismology Centre (ISC) catalog, as documented in Makropoulos et al. [4]. It should be noted that since the probabilistic approach is time independent, the earthquakes included in the catalog should lack any spatiotemporal correlation. Consequently, a declustering procedure could be conducted to exclude aftershocks and foreshocks and retain only the “parent” earthquakes. However, it is important to acknowledge that ground motion exceedances may occur randomly during any event and the application of a declustering procedure may result in the omission of a significant amount of data. This could potentially impact the results, as annual exceedance rates for the magnitude of completeness would be lower, leading to the underestimation of the maximum expected ground motion parameters [58,63,64]. Therefore, the use of a non-declustered earthquake catalog following a Poissonian process was preferred, given that ground motion at a given site may surpass a certain level due to either foreshocks, mainshocks, or aftershocks [58,63,64].

2.2. Seismogenic Source Zones and Seismic Parameters

Another critical aspect of any PSHA is the identification and characterization of seismic source zones. On this account, two seismotectonic models were used to assess seismic hazard, i.e., the Euro-Mediterranean Seismic Hazard Model 2013 (ESHM13) and its update (ESHM20), proposed by Woessner et al. [65] and Danciu et al. [66], respectively. The mapping of source geometries included in these models was based on multiple criteria, exploiting all available seismological, geotectonic, and geophysical data. The zones of both models are defined on a pan-European scale; however, they are also suitable on a regional scale, including separate area sources for crustal and slab earthquakes. The selected area sources (Figure S1) are partially within 100 km from the extreme points of each sub-area’s shoreline. We preferred to not follow a fault-type seismotectonic model, as a significant portion of the seismicity is attributed to offshore faults, whose exact location and dynamic characteristics are either uncertain or unknown.
The Modified Gutenberg–Richter (MG–R) earthquake occurrence model was employed to represent the seismic potential of each area source [67]. The seismicity parameters of the MG–R model are the b-value of the Gutenberg–Richter law [68], the magnitude of completeness (Mc), the annual rate of exceedance above the Mc (λ(Mc)), and the maximum expected magnitude (Mu). The Mc was estimated through the Maximum Curvature (MAXC) method, suggested by Wiemer and Wyss [69], and the b-value was determined via maximum likelihood estimation [70]. Catalog analysis was performed with the ZMAP 7.1 software [71]. The MAXC technique has been proven to be robust even in cases in which a limited number of earthquakes is available within each zone [58,59,72]. The λ(Mc) parameter was obtained following the procedure proposed by Kijko and Sellevoll [73], whereas the maximum expected magnitude was calculated by adding a positive correction factor equivalent to 0.5 magnitude units to the maximum observed magnitude [74,75]. The seismicity parameters estimated for each area source for the two models (crustal and slab) are presented in Table S1 in the Supplementary Material.

2.3. Ground Motion Prediction Equations (GMPEs)

Ground motion modelling is one of the most vital factors in seismic hazard assessment. Therefore, the selection of empirically derived GMPEs as a means of estimating ground motion measures is a critical task. For the present study, the maximum expected ground motion, expressed in terms of PGA, PGV, and Sa, was computed using GMPEs developed for the Greek territory. It should be noted that different GMPEs were utilized for crustal and slab area source models. Specifically for PGA, the GMPEs proposed by Margaris et al. [76] (MARG2002), Skarlatoudis et al. [77] (SKAR2003), Danciu and Tselentis [78] (DANTS2007), Sakkas [79] (SAKK2016), and Chousianitis et al. [80] (CHOU2018) were considered for both the ESHM13 and ESHM20 crustal seismotectonic models. Sakkas [79] does not provide a GMPE formulation for PGV. In addition, the model from SKAR2003 was replaced with its updated version for PGV [77] (SKAR2007). Concerning the slab source models, the GMPEs of Skarlatoudis et al. [81] (SKAR2013) were employed for PGA and PGV. Given that area source zones were adopted in this study, only epicentral or hypocentral distances were considered. Thus, more recent GMPEs (e.g., [82]) that use different distance metrics were not taken into account. In addition to PGA and PGV, Sa values for various periods (T) were calculated for Athens, Methana, and the capitals of the islands of Salamina, Aegina, Poros, Hydra, Spetses, Kythira, and Antikythira using DANTS2007, which was optimized from data of crustal earthquakes. All GMPEs (except for MARG2002) include a term related to the type of focal mechanism. Given that most seismic zones include various focal mechanism types, their respective participation rates were calculated for each zone belonging to each adopted model, resulting in weighted GMPEs. The focal mechanism catalog that was utilized was proposed by Kapetanidis and Kassaras [23].

2.4. Evaluation of the Predictive Perfomance of GMPEs—GMPE Ranking

GMPEs capture the ground motion variability concerning distance, earthquake magnitude, source type, and site properties. However, they are formulated using limited knowledge concerning the complex earthquake source and wave propagation characteristics. As a result, they provide an approximation of the “true” ground motion values. For this reason, the appropriate selection of GMPEs and the determination of their predictive performance against real strong motion data is a challenging, albeit necessary, task that tends to become common practice in PSHA studies (e.g., [83,84]).
A comprehensive effort of GMPE ranking for Greece was not performed until very recently, when Sotiriadis and Margaris [85] used the most up-to-date Greek strong motion dataset and evaluated a number of GMPEs using three different approaches. The most widely used goodness-of-fit measures to evaluate the performance of GMPEs (also employed by Sotiriadis and Margaris [85]) are the Log-Likelihood (LLH) method, proposed by Scherbaum et al. [86], and the Euclidean Distance-Based Ranking (EDR) scheme, suggested by Kale and Akkar [87]. Every approach has its strengths and inherent deficiencies; hence, the results should be used as an advisory tool for experts, rather than a black-box routine. In the present study, the LLH method was used to evaluate the predictive performance of the selected GMPEs and assign the proper weights in a logic tree approach, which is described below (Section 2.5). The LLH method is a metric, based on information theory, that uses the log-likelihood fit to estimate the misfit between two probability functions. In this case, the divergence between the log-normal distribution of the predicted ground motion values from the selected GMPEs, g(x), and the recorded data, f(x), is expressed by the average LLH values derived by Equation (1):
L L H ( g , x ) = 1 N i = 1 N log 2 ( g ( x i ) )
where N is the total number of observations xi. Lower LLH values indicate that a model is closer to the real values, whereas larger LLH values correspond to one that is more unlikely to reproduce the observed data.
Next, Equation (2), provided by Scherbaum et al. [88], was used in order to assign the appropriate weights for each GMPE based on the computed LLH values:
w j = 2 l o g 2 L L H j j = 1 k 2 log 2 L L H j
The first prerequisite to evaluate the suitability of GMPEs in our study area is the compilation of a reliable database of records. This data set should incorporate information on earthquake parameters, station characteristics, and record information. For this purpose, strong-motion records and all relevant information were acquired from the Engineering Strong-Motion (ESM) database [89]. In theory, the LLH method can be implemented regardless of the size of the data; however, Beauval et al. [90] indicated through synthetic tests that ~40 records are required to achieve a rather stable assessment. Given the relatively limited extent of the study area and the scarcity of strong-motion data, we also included records from neighboring regions that have been proven to considerably affect the seismic hazard in the area (e.g., the 1981 eastern Gulf of Corinth earthquake sequence). The final dataset was composed of 158 three-component accelerograms from 68 earthquakes, covering the time period from 1981 to 2022, in which 53 records were available from 14 instruments installed in the Attica prefecture. It should be mentioned that the database was selected to be compatible with the validity range of candidate GMPEs (in terms of earthquake magnitude and distance ranges). The functional form of the adopted GMPEs, along with the results of their ranking, expressed by their corresponding weights, are shown in Table 1. The results indicate that the GMPE of SAKK2016 performed best in capturing the ground motion variability in the study area compared to the other candidate GMPEs. Nevertheless, the other GMPEs followed closely, apart from MARG2002, which had a lower weight based on the LLH method. Additional adjustment of the weights was needed for the GMPEs used for the PGV calculations, given that SAKK2016 does not account for PGV. For this case, the GMPE that was ranked first was CHOU2018, with MARG2002 being ranked last again.

2.5. Logic Tree Approach/Structure and PSHA Calculations

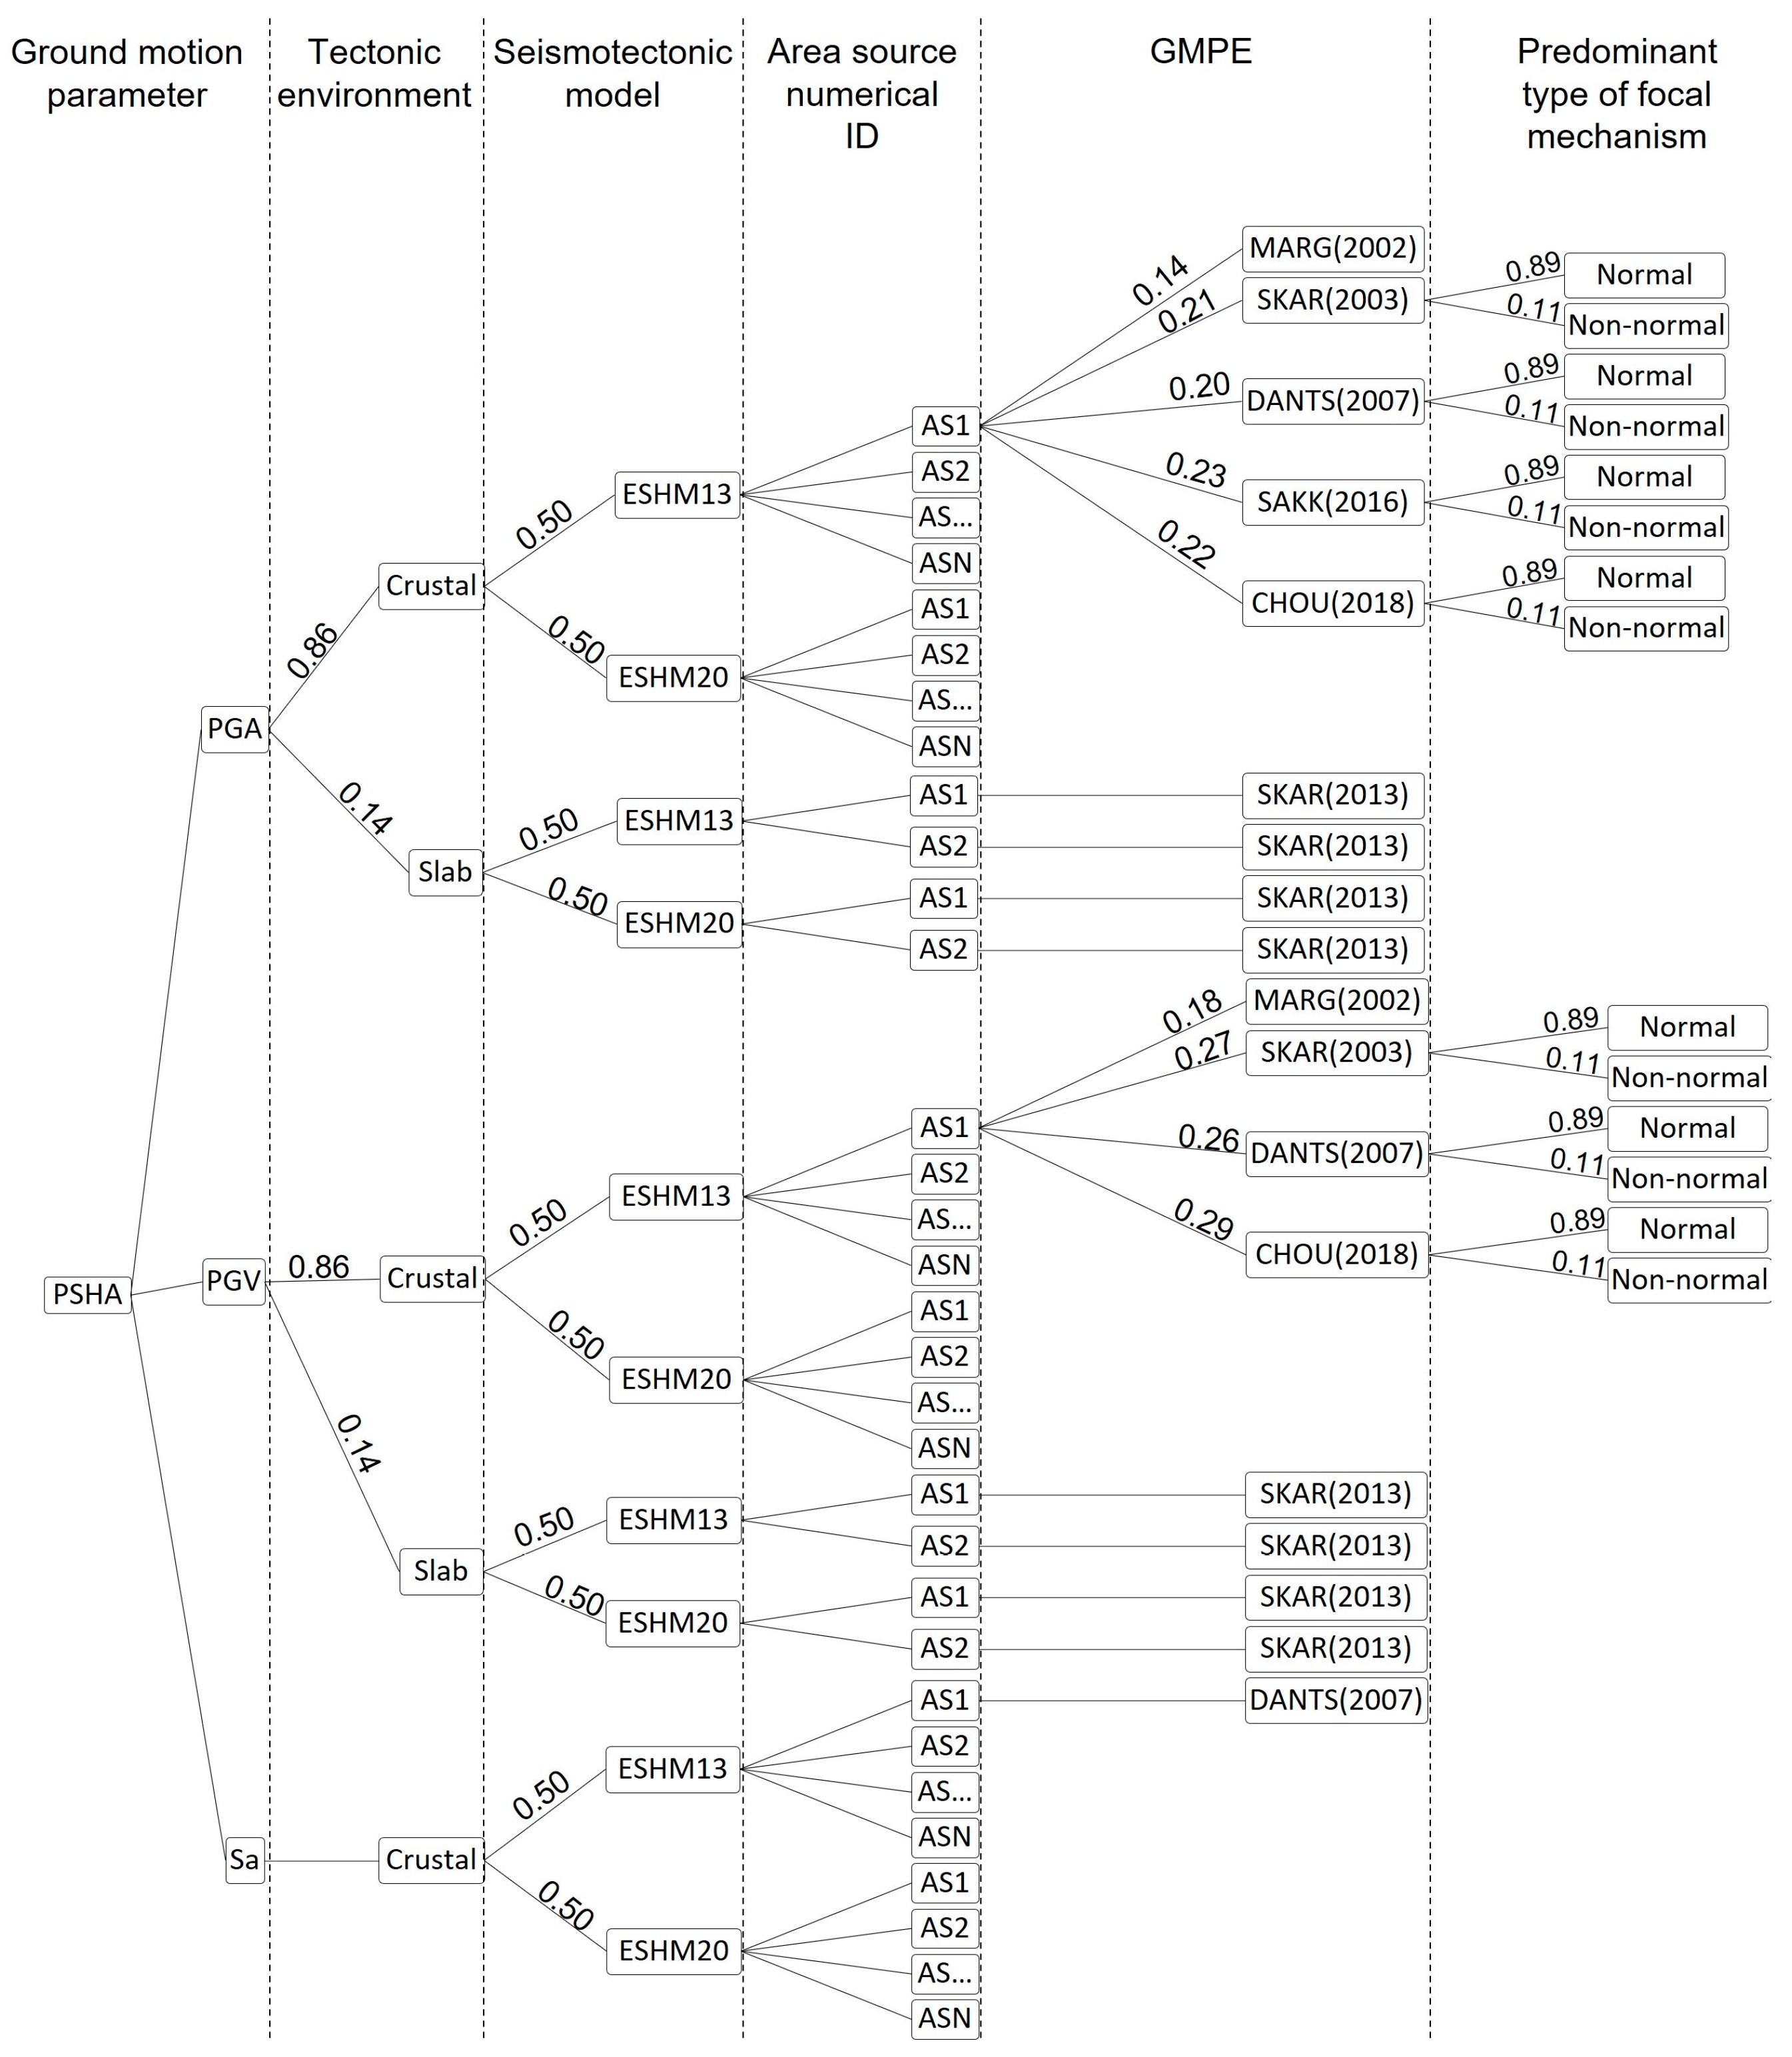
Seismic hazard was evaluated by computing PGA and PGV values for a return period of 475 and 950 years for all groups considering rock conditions (Vs30 > 760 m/s). Moreover, Sa values were calculated in order to construct Uniform Hazard Spectra for a return period of 475 for Athens, Methana, and the capital of each island, taking into account local soil conditions. In the absence of Vs30 profiles that could be used for the accurate representation of each site, we used topographic slope data from digital elevation models (DEMs) [91]. Vs30 derived from topographic data may not have the accuracy of in situ measurements; however, it can be used as a first-order proxy for site classification purposes at a regional scale [92]. The sampling interval was set to 10 km in sub-area 1 (Attica peninsula) and 1 km in the remaining sub-areas. Due to the inherent complexities characterizing earthquakes and wave propagation, a wide range of uncertainties may be associated with PSHA calculations. As a result, it was essential to properly treat uncertainties in our approach in an effort to reduce them as much as possible. The most commonly used method to deal with uncertainties is the designation of a logic tree formulation to include alternative models in the analysis [93,94,95]. Logic tree approaches have become a crucial framework in modern PSHA studies in an effort to account for the aleatory variability as well as the epistemic uncertainties in the analysis. It provides a structured approach to combine different seismological models, GMPEs, and input parameters, allowing for a comprehensive exploration of the range of possible outcomes. It starts with a main branch representing the seismotectonic model, and it typically incorporates multiple alternative models or approaches, each representing a different interpretation or assumption. Secondary branches emerge to account for additional uncertainties, as they consider different GMPEs to capture the range of possible PGA, PGV, and Sa estimates. Each branch of the logic tree is assigned a weight based on expert judgment or statistical analysis, reflecting the confidence of each alternative. The final results were obtained using a non-equal logic tree, where each minor branch represented a weighted GMPE (except for MARG2002 [76]), whereas each primary branch corresponded to a different seismotectonic model (Figure 2). By assigning multiple weighted GMPEs per area source, we managed to create a sophisticated logic tree that contained minor logic trees for each area source. Consequently, by creating a large number of logic tree paths, the epistemic uncertainties were qualitatively reduced. The weight factors of 0.86 and 0.14 were determined for major crustal and slab branches, respectively, based on the number of earthquakes within the crustal and slab environments from the catalog that was used. The reason for assigning equal weights to the crustal primary branches was that neither of the two area source models was deemed superior. The zones of ESHM13 cover smaller areas, indicating that dissimilar seismotectonic characteristics, such as focal mechanisms, are less likely to be grouped. On the other hand, the ESHM20 model employs larger seismotectonic zones, which may reflect potential seismotectonic uncertainties but benefits from a greater number of earthquakes within each source. The latter implies that b-values are computed with a smaller Root Mean Squared Error (RMSE) and that the difference between the Mu and Mc, which is proportional to the accuracy of the b-value estimations, is likely to be increased. The hazard assessment was performed through the latest version of the R-CRISIS software (V20.0) [67].

3. Results

3.1. Spatial Distribution of PGA and PGV

The spatial distribution of PGA values calculated for each sub-area separately using the logic tree approach (Figure 2) for rock conditions is presented in Figure 3. Beginning with the non-island part of the administrative region of Attica (Figure 3a), the highest values were identified in the western part of the region, whereas the lower ones were computed in the southeastern part. The highest PGA value of the first sub-area for a return period of 475 years was ~290 cm/s2, and the lowest was ~60 cm/s2 (Figure 3a). Moreover, the value calculated in the city of Athens was ~150 cm/s2. Continuing with the second sub-area (Salamina and Aegina, Figure 3b), the largest PGA values were identified to the west and northwest part of the group’s shoreline, and the minimum ones at the eastern region. More precisely, the highest PGA value was ~250 cm/s2, and the lowest one was 170 cm/s2. For the capitals of Salamina and Aegina, the corresponding values were ~220 cm/s2 and 225 cm/s2, respectively. A similar PGA distribution was observed in the Methana and Poros sub-area (Figure 3c). However, the overall values were lower, with a local maximum of 175 cm/s2 NW of Methana and a minimum of ~120 cm/s2 at the southeastern edge of the shoreline. The estimated PGA at Methana was ~165 cm/s2 and at the capital of Poros 155 cm/s2. The fourth sub-area (Hydra, Spetses) featured the lowest PGA values in the whole region. PGA ranged between ~140 cm/s2 at the eastern part of this area and ~170 cm/s2 at the northern edge (Figure 3d). Specifically, the value at the capital of Hydra was ~160 cm/s2 and ~150 cm/s2 at Spetses. In the last sub-area (Kythira and Antikythira; Figure 3e), the highest PGA was 220 cm/s2 in Antikythira, and the lowest one (~200 cm/s2) was observed at the northern part of Kythira (with 215 cm/s2 estimated within the capital of the island).
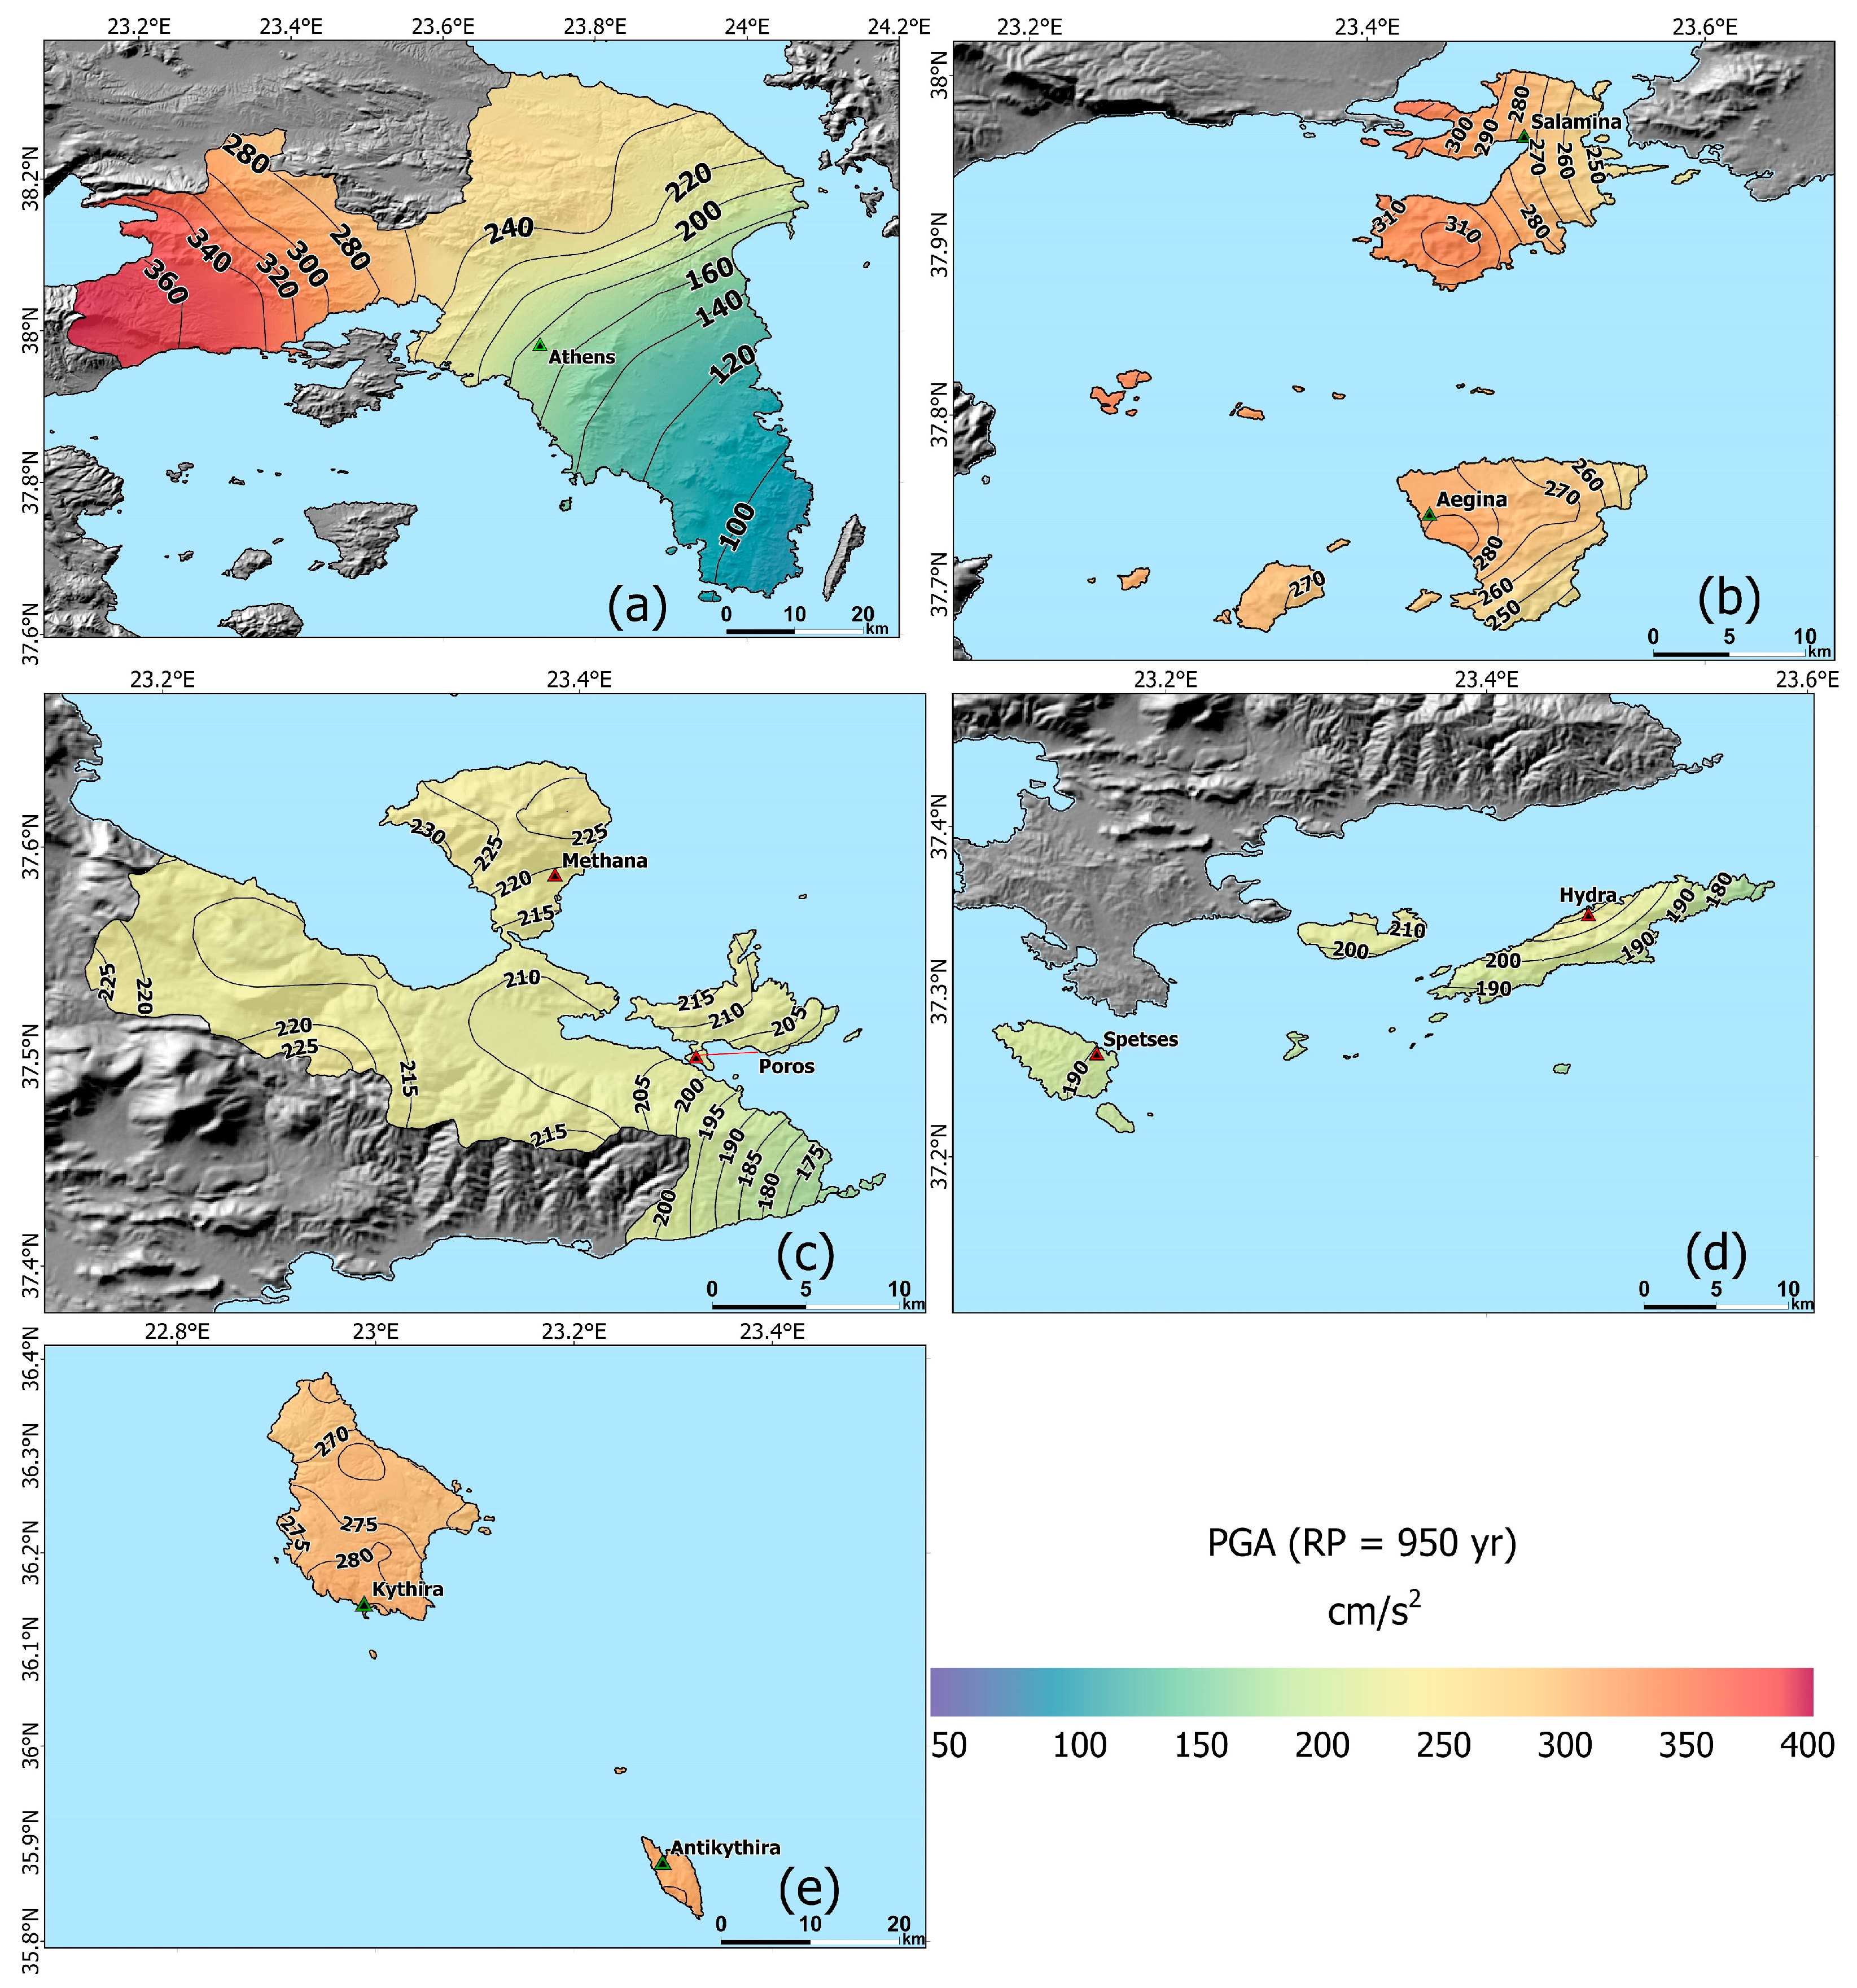
The spatial distribution of the PGA values for a return period of 950 years was similar to the previous return period for all groups (Figure 4). In sub-area 1, the highest PGA value was ~370 cm/s2 and the lowest was ~80 cm/s2 (Figure 4a). The estimated value in Athens was ~165 cm/s2, indicating that there was no significant increase for a longer return period. Around Salamina and Aegina (Figure 4b), PGA ranged between ~270 cm/s2 and ~320 cm/s2. For the capitals of Salamina and Aegina, the PGA levels were ~270 cm/s2 and 290 cm/s2, respectively. The Methana and Poros sub-area (Figure 4c) featured lower values in the range of ~160 cm/s2 and ~230 cm/s2. This decrease followed a similar pattern to the comparatively low accelerations observed for the 475-year return period. PGA at Methana was ~220 cm/s2, and at the capital of Poros it was ~205 cm/s2. Regarding sub-area 4 (Hydra, Spetses, Figure 4d), the highest PGA value was ~220 cm/s2 and the lowest ~170 cm/s2. The value at the capital of Hydra was ~220 cm/s2, and at the capital of Spetses it was ~190 cm/s2. For Kythira and Antikythira (Figure 4e), the highest PGA value was 290 cm/s2, which was again identified at Antikythira, and the lowest one was ~260 cm/s2, at the northwestern part of the Kythira Island. The value calculated at the capital of Kythira was ~280 cm/s2.
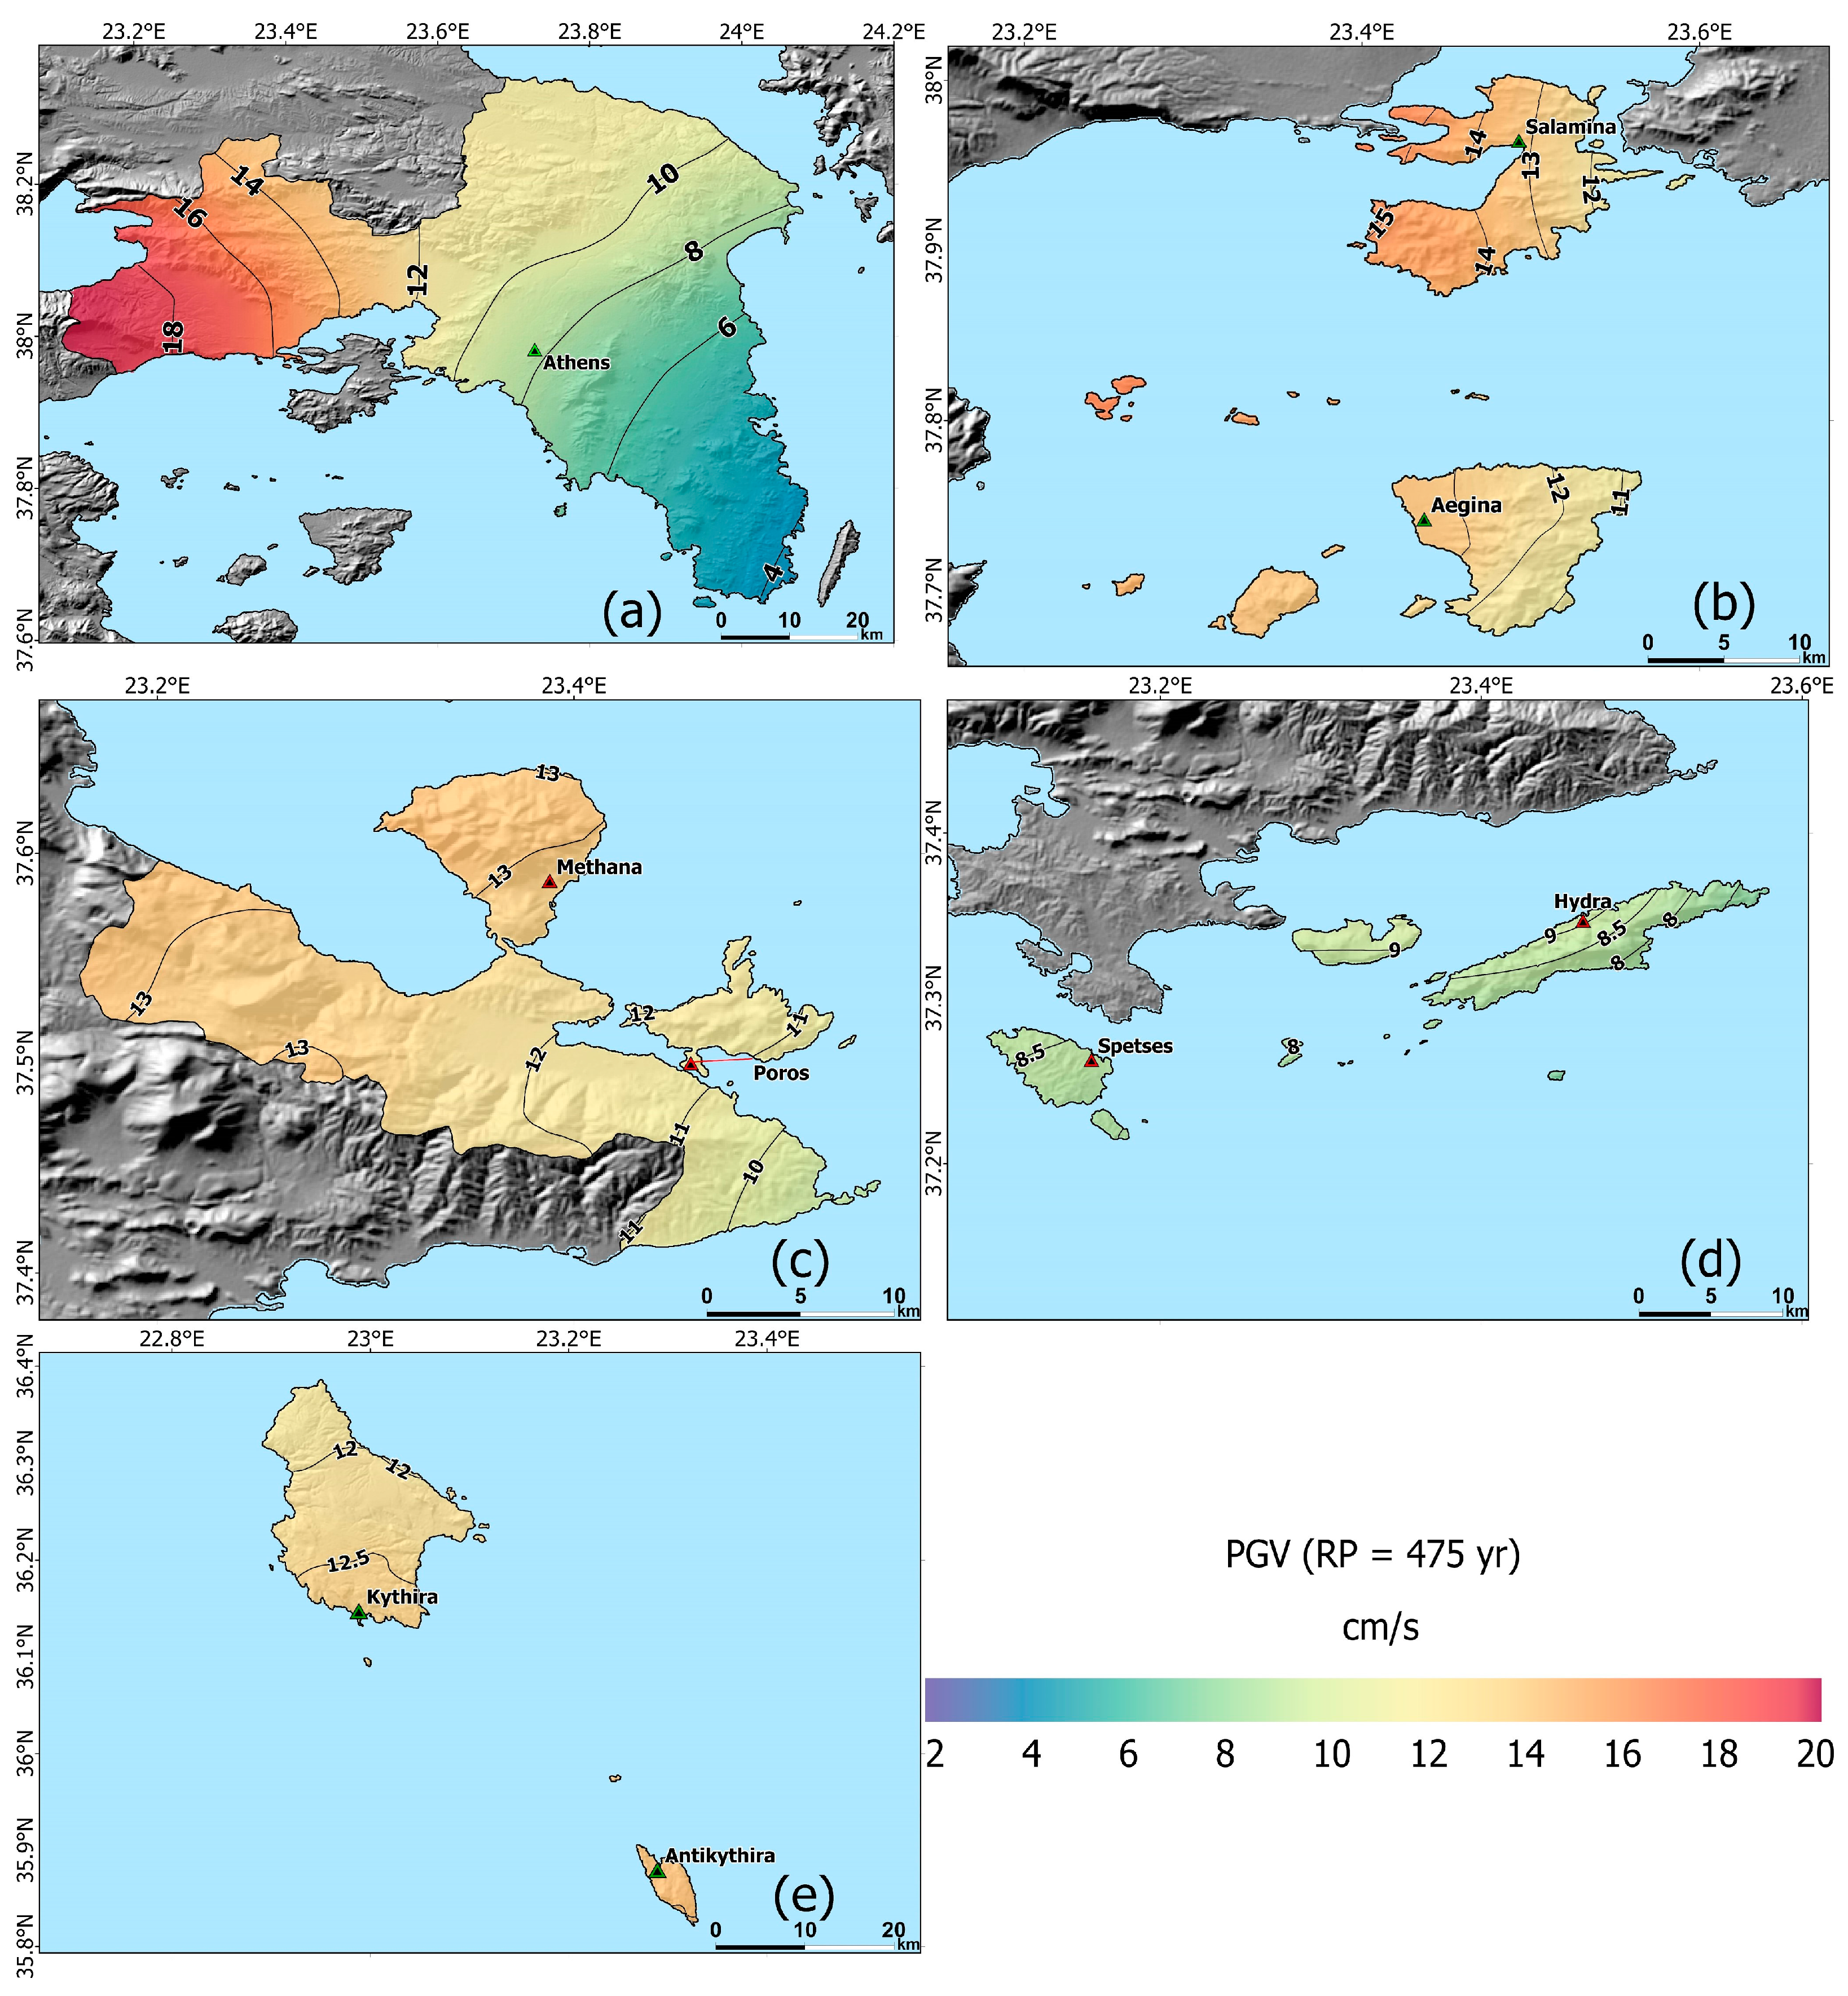
PGV levels were also computed for the five sub-areas for return periods of 475 and 950 years (Figure 5 and Figure 6, respectively). Given that the seismicity parameters were kept the same, the spatial distribution of the values remained similar to that of PGA for both return periods. Starting with the first sub-area, the highest PGV value was estimated at ~19.0 cm/s at the western part of Attica’s shoreline, whereas the lowest one was ~4.0 cm/s at the southeastern edge of Attica. PGV in Athens was 9.0 cm/s. As for the second sub-area, the largest PGV value was ~15.5 cm/s at the western edge of the group’s shoreline, similar to the previous sub-area’s case. The minimum value was ~10 cm/s. The calculated value at the capitals of Salamina and Aegina was 13.2 cm/s for both sites. The greatest PGV level computed in the sub-area of Methana and Poros was 13.5 cm/s and the lowest was 9.0 cm/s. At Methana town, the estimated PGV value was 12.8 cm/s and at the capital of Poros it was 11.2 cm/s. In the fourth sub-area (Hydra and Spetses), the highest PGV value was ~9.5 cm/s, and the lowest one was 7.0 cm/s. At the capital of Hydra, the value was 9.0 cm/s, and at the capital of Spetses it was 8.4 cm/s. Regarding the last group, the greatest PGV value was ~13.0 cm/s, in proximity to Antikythira, and the lowest value was 11.5 cm/s at the northernmost edge of Kythira’s shoreline. The PGV value computed at the capital of the latter was ~13 cm/s.
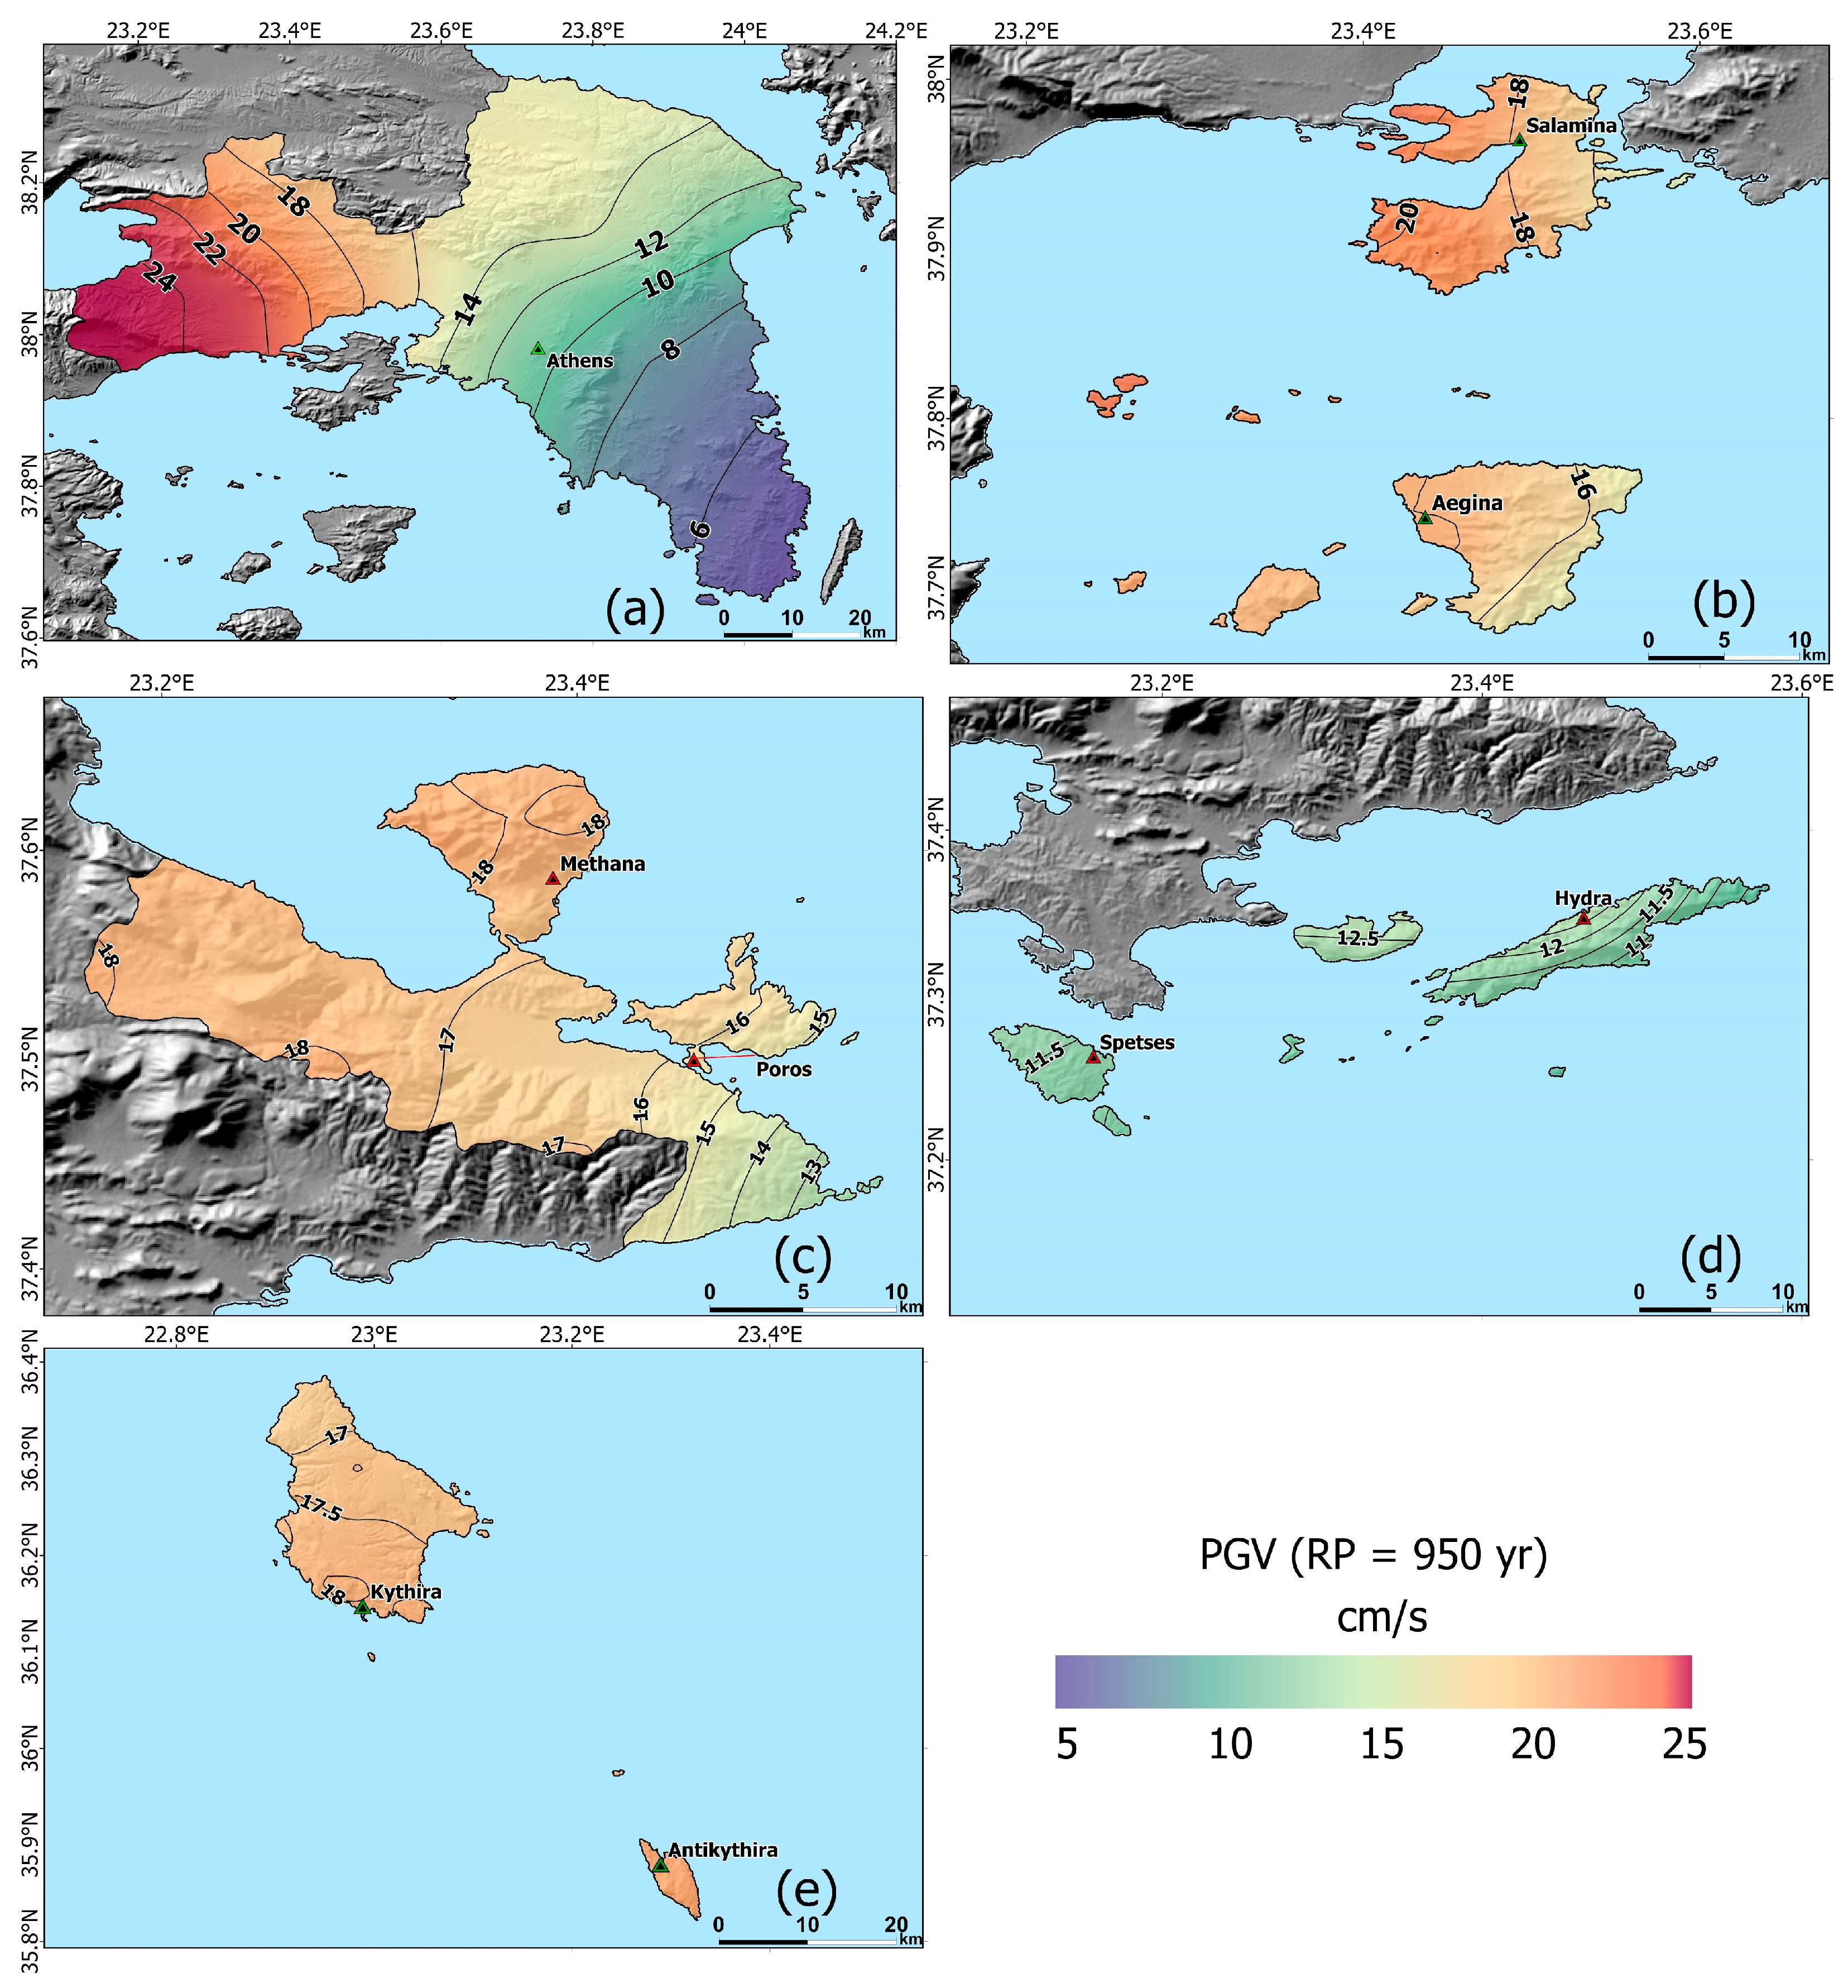
Concerning the return period of 950 years in the first sub-area, the highest PGV value was estimated at ~25.0 cm/s, whereas the lowest value was ~5.0 cm/s. PGV in the city center of Athens was computed at 11.0 cm/s. Regarding the second sub-area, the highest PGV value was ~20.0 cm/s, whereas the lowest was ~15 cm/s. The calculated value for the capitals of both Salamina and Aegina was ~18.0 cm/s. The highest PGV value in the sub-area of Methana and Poros was 18.5 cm/s and the lowest was 12.0 cm/s. At Methana town the estimated PGV value was 17.5 cm/s, and at the capital of Poros it was 16.0 cm/s. Concerning the fourth group (Hydra and Spetses), the highest PGV value was ~13.0 cm/s, and the lowest was 10.0 cm/s. At the capital of Hydra, the value was 12.5 cm/s, and at the capital of Spetses it was 11.4 cm/s. Regarding the last group, the largest PGV value was ~19.0 cm/s at Antikythira Island, and the lowest was 16.5 cm/s at the northernmost edge of Kythira’s shoreline. The PGV value in the capital of Kythira was ~16.5 cm/s.

3.2. Hazard Curves and Uniform Hazard Spectra (UHS)

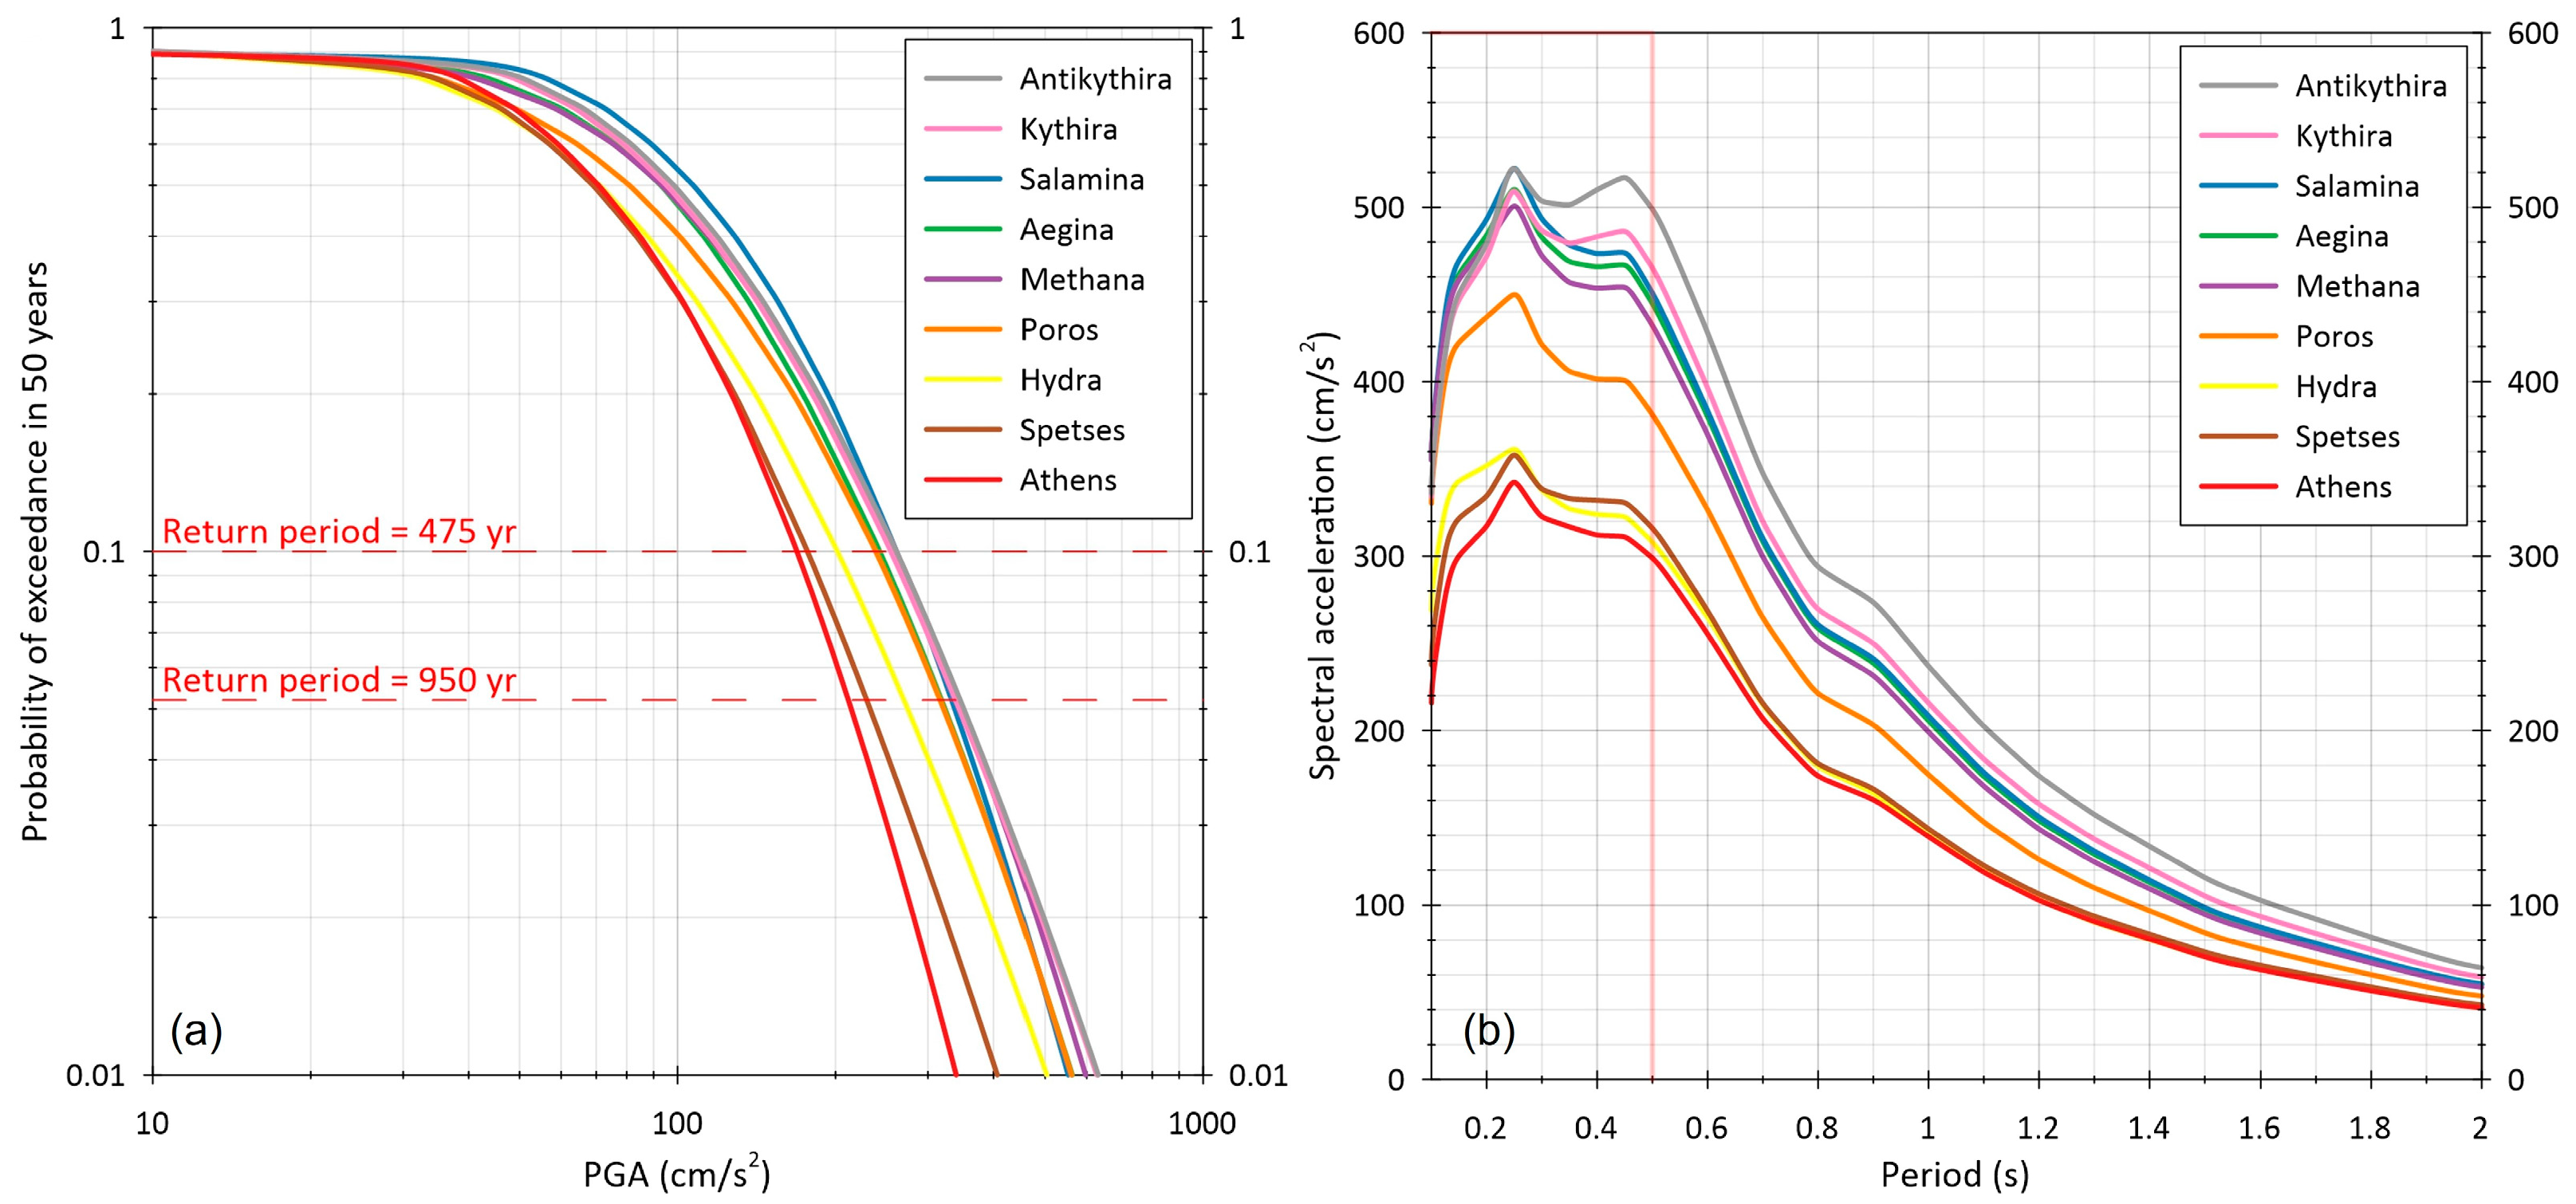
Hazard curves, i.e., PGA values computed for various probabilities of exceedance for 50 years, were constructed for Athens and the other main towns of each group (Figure 7a). It is important to highlight that soil classification was taken into account for each site in the computational scheme, implying that PGA values increased in the specific PSHA output. The three sites with the lowest seismic hazard levels were Athens, Spetses, and Hydra, whereas the top two were Kythira and Antikythira. The curves of the remaining sites were in close proximity, indicating that similar peak ground motions were expected for Salamina, Aegina, Methana, and Poros. The capital of Salamina Island, however, was ranked third among the sites with greater seismic hazard levels, as it is geographically close to the western coast of Attica, where high PGA levels were determined. It is important to note that ground motions in the order of 1000 cm/s2 did not occur for any of the depicted probabilities of exceedance, indicating that such extreme values are not likely to occur for the range of [0.010, 0.999] probabilities of exceedance for a 50-year time span. In addition to PGA hazard curves, the uniform hazard spectrum (UHS) in terms of spectral acceleration was also constructed for the aforementioned sites for the period range of [0.1, 2.0] s, as the GMPE utilized by Danciu and Tselentis [78] proposed. Given that there is no Sa–GMPE for the slab tectonic environment, all UHS were created by taking into account the branches of the logic tree referring to crustal seismicity only. Similar to the PGA hazard curves, Antikythira, Kythira, and Salamina possessed the highest Sa–spectra, whereas the lowest Sa values were observed at Athens, Spetses, and Hydra.

4. Discussion

During the process of PSHA, two types of uncertainties must be considered, i.e., the aleatory and the epistemic uncertainty [94]. The former accounts for the stochastic variations in PGA, PGV, and Sa values arising from the implementation of a GMPE, whereas the latter pertains to the accuracy of these values [94]. To address epistemic uncertainties, a logic tree approach is commonly utilized, which involves the incorporation of multiple GMPEs to account for the variability in predictions [93,94,95]. In the present work, a non-equal logic tree was constructed to account for both crustal and slab tectonic settings. Two seismotectonic models, namely, ESHM13 and ESHM20, were integrated into the logic tree as area sources to introduce variability. Additionally, multiple GMPEs were utilized to estimate ground motions in terms of PGA and PGV in each area source of the major crustal branch of the logic tree. Taking into account the different focal mechanism types through the implementation of weighted GMPEs, we could establish multiple logic tree paths per area source, resulting in a multi-branch logic tree.
The suitability of the pre-selected regional GMPEs, based on the LLH approach, was assessed with the use of a compiled strong motion dataset contained in the study area. The goal of this procedure was to minimize expert judgement and avoid assigning equal weights to all GMPEs, given that differences among them can be found from a simple residual analysis. The relative ranking between the GMPEs was expressed through a weighting equation, taking into account their respective LLH scores. From this analysis, slight differences were found among the candidate GMPEs. Focusing on PGA, SAKK2016 and CHOU2018 performed better than the others in predicting the observations, whereas MARG2002 was assigned the lowest relative weight. The same applies to PGV predictions but with the absence of SAKK2016, which does not have a functional form for PGV, and with the remaining GMPEs apart from MARG2002 being assigned almost equal weights. An overarching comment could be that most recent GMPEs seem to be more effective in forecasting strong ground motion regarding the administrative region of Attica. This is well reasoned given that as we move further back in time, the strong motion data available for that time decrease.
The PGA distribution for a return period of 475 years was directly compared to the PGA reference values set by the current Greek Building Code [96]. EAK2003 partitions Greece into three distinct PGA zones and prescribes a reference value of peak acceleration for a return period of 475 years. The study area is classified into zones I and II of EAK2003, with reference values of 0.16 g (~160 cm/s2) and 0.24 g (~240 cm/s2), respectively. Specifically, sub-areas 1, 2, 3, and 5 belong to zone II, whereas sub-area 4 (Hydra and Spetses) is part of zone I. Seismic hazard analysis of sub-area 1 (Attica peninsula) revealed that the PGA contour of 240 cm/s2 is situated in the western part of the group’s mainland, near the Gulf of Corinth, highlighting the substantial impact of the Gulf’s past strong events on the peak ground motions at western Attica. The maximum PGA value observed in sub-area 1 was approximately 300 cm/s2, located at the westernmost part of the study area, which is 60 cm/s2 higher than the EAK2003 regulations. Notably, the Attica peninsula displayed the highest and lowest PGA values among all groups. This contradiction can be attributed to the extent of Attica and the characteristics of seismicity in neighboring areas. As mentioned above, its western part is largely affected by the active Gulf of Corinth, which has hosted high-magnitude events. On the contrary, the southeastern part of Attica is bounded by generally aseismic areas (in terms of crustal seismicity). Sub-area 2 (Salamina and Aegina) exhibited a slight deviation from the reference value of 240 cm/s2, with PGA being mostly close to it. Again, the effect of the Gulf of Corinth was seen in the west–northwestern part of sub-area 2, where PGA was slightly higher. In sub-area 3, the estimated PGA failed to reach the levels of EAK2003, being ~50 cm/s2 lower. The PGA reference value for sub-area 4 (Hydra and Spetses) was ~160 cm/s2, similar to the ones predicted by the active building code. The northern part of the area slightly surpassed 160 cm/s2. The maximum PGA value in sub-area 5 (Kythira and Antikythira) did not exceed the value provided by EAK2003 (240 cm/s2).
In the work of Tselentis et al. [97], computations of PGA and PGV values were performed for the entire Greek region. Although they provided similar ground motion distribution values to those found in the present study, it should be noted that in their work the slab tectonic environment was not taken into account. Consequently, their computational scheme generated higher PGA and PGV values than the methodology presented in this study. Another study, by Banitsiotou et al. [53], also evaluated the seismic hazard of Greece by assessing PGA and PGV values at 45 sites within the country, with Athens being among them. Their study estimated a PGA and PGV of 140 cm/s2 and 5–15 cm/s, respectively, for a return period of 475 years for the capital of Greece, which is consistent with the values computed in the present study.
PGA hazard curves were generated for various locations, including Athens center, Methana, and the capitals of Salamina, Aegina, Poros, Hydra, Spetses, Kythira, and Antikythira Islands by taking local soil conditions into consideration. The incorporation of soil conditions was deemed necessary due to the considerable increase in PGA values compared to those calculated based on rock conditions (Table 2). The findings of this study indicate that all sites, except for the capital of Hydra, exhibited PGA values that are consistent with the reference value of EAK2003. Notably, the capital of Antikythira possessed the highest level of seismic hazard, whereas the city center of Athens presented the lowest. It is important to note that strong ground motions in the order of 1000 cm/s2 did not occur for any probability, indicating that such extreme values are not likely for probabilities of exceedance in the range of [0.010, 0.999] for a 50-year time span.
The ultimate product of PSHA was the determination of spectral acceleration values for the period range of [0.1, 2.0] s in order to construct the Uniform Hazard Spectra for the same sites mentioned in the PGA hazard curve section. During this stage, the computational approach was modified to incorporate the estimation of Sa based on the GMPE developed by Danciu and Tselentis [78] for crustal earthquakes only, thereby excluding the major slab branch, as there is no available GMPE for the latter. Nevertheless, the adopted model was parameterized to account for all types of focal mechanisms for each area source. As also observed in the PGA hazard curve analysis, the capital of Antikythira Island had the highest spectral acceleration value, whereas Athens city center had the lowest.
This study presents an up-to-date seismic hazard assessment in the administrative region of Attica by incorporating both crustal and slab tectonic environments. Most previous work on seismic hazard for the Greek territory typically considered only crustal area sources. By also incorporating the slab, we managed to compute distinct threshold magnitude annual exceedance rates for the deep area sources, leading to a more accurate characterization of seismic hazard. Furthermore, slab ground motion prediction equations (GMPEs) account for hypocentral distance, indicating that the probability density functions of distances are influenced by the depth of the slab area source. Consequently, this results in lower peak ground acceleration (PGA) and peak ground velocity (PGV) values than those computed using crustal models. Therefore, when considering both crustal and slab area sources, the PGA and PGV values are reduced, providing a more realistic representation of seismic hazard.
Future research could involve the disaggregation of PSHA outcomes to identify the parameter pair of magnitude and epicentral distance that contributes most to the seismic hazard. This could facilitate the generation of seismic scenarios and enable the adoption of stochastic modeling of seismic hazard. Modern artificial intelligence (AI) techniques could also offer a promising alternative to earthquake prediction (in terms of future earthquake probabilities) using reliable seismological and geophysical indicators as an input [98,99]. Additionally, a comprehensive investigation of the Peak Ground Rotational Acceleration (PGRA) and Velocity (PGRV) values could be conducted, given their potential utility for engineering purposes [58]. Finally, the results of the present seismic hazard study could be leveraged in the future to evaluate seismic risk after the integration of vulnerability data. The evaluation of seismic vulnerability is of critical importance for Athens, the most populated city in Greece, as it hosts a plethora of different structural typologies.

5. Conclusions

A Probabilistic Seismic Hazard Assessment was undertaken for the Administrative Region of Attica, including its islands, following the classic approach of Cornell [61] and McGuire [62]. To this end, the earthquake catalog of Makropoulos et al. [4] was employed, which contains earthquakes of Mw ≥ 4.1 that have an impact on seismic hazard. The catalog was updated to include events up to 2019. In order to deal with epistemic uncertainties, we incorporated four seismotectonic models in the form of area sources, namely, ESHM13 crustal, ESHM20 crustal, ESHM13 slab, and ESHM20 slab. A logic tree approach, where each major branch represented a seismotectonic model and each minor branch a modified GMPE, was created. We implemented five GMPEs for PGA and four for PGV for the crustal region, with each GMPE being divided into two sub-GMPEs, one for the normal type and one for the thrust or strike-slip type of focal mechanisms. For each crustal area source, all possible combinations of GMPEs were applied, with their corresponding weights given by the percentage of different types of focal mechanisms and the adopted GMPE ranking criterion. The resulting complex logic tree incorporated sub-logic trees, resulting in multiple logic tree paths, and thus the epistemic uncertainties were qualitatively reduced. PGA values were then computed for Athens city, Methana, and the capitals of the islands for various exceedance probabilities over a 50-year period. The final output of the PSHA was the generation of spectral acceleration values for the period range of [0.1, 2.0] s to construct the Uniform Hazard Spectra for the same sites as mentioned in the case of the hazard curves. The findings of this study underscore the importance of updating seismic hazard studies through a probabilistic approach that considers the evaluation of ground parameters in terms of probabilities of occurrence within a specified time frame.

Supplementary Materials

The following supporting information can be downloaded at: https://www.mdpi.com/article/10.3390/app13137553/s1, Figure S1. The four area source models that were implemented for the administrative region of Attica: (a) the ESHM13 crustal model, (b) the ESHM20 crustal model, (c) the ESHM13 slab model, and (d) the ESHM20 slab model; Table S1: The seismicity data that were calculated for every area source. The two slab models were classified into two sub-areas based on their respective focal-depth ranges as indicated by the SKAR2013 GMPE. The absence of a focal mechanism coefficient in the latter GMPE resulted in the corresponding columns being empty.

Author Contributions

Conceptualization, G.K.; methodology G.K., A.Z. and P.B.; software, A.Z., P.B. and I.S., validation, G.K., A.Z. and S.M.; formal analysis, G.K., A.Z., P.B. and I.S.; investigation, G.K., A.Z., P.B., V.K. and S.M.; resources, G.K., E.K., E.L., and N.V.; data curation, G.K., A.Z., P.B. and I.S.; writing—original draft preparation, G.K., A.Z., P.B., V.K., I.S., S.M. and E.K.; writing—review and editing, G.K., V.K., I.S., S.M., E.K., E.L. and N.V.; visualization, A.Z. and V.K.; supervision, G.K., E.L. and N.V.; project administration, E.L. and N.V. All authors have read and agreed to the published version of the manuscript.

Funding

The research is partially funded by the “Assessment of Seismic, Fire and Flood hazard in Attica Region” project, signed by the administrative region of Attica, the National Observatory of Athens (NOA), and the National and Kapodistrian University of Athens (NKUA; Athens, Greece) (Special Account for Research Grants of NKUA, project code: 17531).

Institutional Review Board Statement

Not applicable.

Informed Consent Statement

Not applicable.

Data Availability Statement

Publicly available datasets were analyzed in this study. The ESHM13 and ESHM20 area sources can be found here: http://hazard.efehr.org/en/home/, accessed on 27 March 2023. In accordance with the earthquake catalogue, the earthquakes for the period of 1900–2009 were adopted from Makropoulos et al. [4]. For the temporal expansion (2010–2019) of the catalogue, the reviewed events from International Seismological Centre (http://www.isc.ac.uk/iscbulletin/search/bulletin/, accessed on 27 March 2023) were used. Data utilized for the GMPE ranking were retrieved from the European Strong Motion database (https://esm-db.eu/#/home, accessed on 27 March 2023).

Acknowledgments

We express our gratitude to the three anonymous reviewers for their constructive comments that helped improve the manuscript, as well as to the editor and the guest editors for providing us with the opportunity to publish this study. The authors would like to thank the personnel of the Hellenic Unified Seismological Network (http://eida.gein.noa.gr/, accessed on 27 March 2023) for the installation and operation of the seismological stations used in the GMPE ranking system. Figure 1 was drawn using the Generic Mapping Tools (GMT) 4 software [100]. Grapher version 15 (http://www.GoldenSoftware.com, accessed on 27 March 2023) was used for some of the figures. Figure 3, Figure 4, Figure 5 and Figure 6 were created using the ArcGIS Pro version 3.1.0 [101].

Conflicts of Interest

The authors declare no conflict of interest.

References

  1. Båth, M. The Seismology of Greece. Tectonophysics 1983, 98, 165–208. [Google Scholar] [CrossRef]
  2. Papazachos, B.C.; Papazachou, C. The Earthquakes of Greece; Ziti Publ. Co.: Thessaloniki, Greece, 2003. [Google Scholar]
  3. Stucchi, M.; Rovida, A.; Gomez Capera, A.A.; Alexandre, P.; Camelbeeck, T.; Demircioglu, M.B.; Gasperini, P.; Kouskouna, V.; Musson, R.M.W.; Radulian, M.; et al. The SHARE European Earthquake Catalogue (SHEEC) 1000–1899. J. Seismol. 2013, 17, 523–544. [Google Scholar] [CrossRef] [Green Version]
  4. Makropoulos, K.; Kaviris, G.; Kouskouna, V. An Updated and Extended Earthquake Catalogue for Greece and Adjacent Areas since 1900. Nat. Hazards Earth Syst. Sci. 2012, 12, 1425–1430. [Google Scholar] [CrossRef] [Green Version]
  5. Evangelidis, C.P.; Triantafyllis, N.; Samios, M.; Boukouras, K.; Kontakos, K.; Ktenidou, O.; Fountoulakis, I.; Kalogeras, I.; Melis, N.S.; Galanis, O.; et al. Seismic Waveform Data from Greece and Cyprus: Integration, Archival, and Open Access. Seismol. Res. Lett. 2021, 92, 1672–1684. [Google Scholar] [CrossRef]
  6. Ganas, A.; Oikonomou, A.; Tsimi, C. NOAfaults: A Digital Database for Active Faults in Greece. Bull. Geol. Soc. Greece 2017, 47, 518. [Google Scholar] [CrossRef] [Green Version]
  7. Albini, P.; Pantosti, D. The 20 and 27 April 1894 (Locris, Central Greece) Earthquake Sources through Coeval Records on Macroseismic Effects. Bull. Seismol. Soc. Am. 2004, 94, 1305–1326. [Google Scholar] [CrossRef]
  8. Kouskouna, V.; Ganas, A.; Kleanthi, M.; Kassaras, I.; Sakellariou, N.; Sakkas, G.; Valkaniotis, S.; Manousou, E.; Bozionelos, G.; Tsironi, V.; et al. Evaluation of Macroseismic Intensity, Strong Ground Motion Pattern and Fault Model of the 19 July 2019 Mw5.1 Earthquake West of Athens. J. Seismol. 2021, 25, 747–769. [Google Scholar] [CrossRef]
  9. Lekkas, E. The Athens Earthquake (7 September 1999): Intensity Distribution and Controlling Factors. Eng. Geol. 2001, 59, 297–311. [Google Scholar] [CrossRef]
  10. Papadimitriou, P.; Voulgaris, N.; Kassaras, I.; Kaviris, G.; Delibasis, N.; Makropoulos, K. The Mw = 6.0, 7 September 1999 Athens Earthquake. Nat. Hazards 2002, 27, 15–33. [Google Scholar] [CrossRef]
  11. Papadopoulos, G.A.; Drakatos, G.; Papanastassiou, D.; Kalogeras, I.; Stavrakakis, G. Preliminary Results about the Catastrophic Earthquake of 7 September 1999 in Athens, Greece. Seismol. Res. Lett. 2000, 71, 318–329. [Google Scholar] [CrossRef]
  12. Kapetanidis, V.; Karakonstantis, A.; Papadimitriou, P.; Pavlou, K.; Spingos, I.; Kaviris, G.; Voulgaris, N. The 19 July 2019 Earthquake in Athens, Greece: A Delayed Major Aftershock of the 1999 Mw = 6.0 Event, or the Activation of a Different Structure? J. Geodyn. 2020, 139, 101766. [Google Scholar] [CrossRef]
  13. Jackson, J.A.; Gagnepain, J.; Houseman, G.; King, G.C.P.; Papadimitriou, P.; Soufleris, C.; Virieux, J. Seismicity, Normal Faulting, and the Geomorphological Development of the Gulf of Corinth (Greece): The Corinth Earthquakes of February and March 1981. Earth Planet. Sci. Lett. 1982, 57, 377–397. [Google Scholar] [CrossRef]
  14. Papazachos, B.C.; Comninakis, P.E.; Papadimitriou, E.; Scordilis, E. Properties of the February-March 1981 Seismic Sequence in the Alkyonides Gulf in Central Greece. Ann. Geophys. 1984, 2, 537–544. [Google Scholar]
  15. King, G.C.P.; Ouyang, Z.X.; Papadimitriou, P.; Deschamps, A.; Gagnepain, J.; Houseman, G.; Jackson, J.A.; Soufleris, C.; Virieux, J. The Evolution of the Gulf of Corinth (Greece): An Aftershock Study of the 1981 Earthquakes. Geophys. J. Int. 1985, 80, 677–693. [Google Scholar] [CrossRef] [Green Version]
  16. Michas, G.; Kapetanidis, V.; Spingos, I.; Kaviris, G.; Vallianatos, F. The 2020 Perachora Peninsula Earthquake Sequence (Εast Corinth Rift, Greece): Spatiotemporal Evolution and Implications for the Triggering Mechanism. Acta Geophys. 2022, 70, 2581–2601. [Google Scholar] [CrossRef]
  17. Spingos, I.; Kapetanidis, V.; Michas, G.; Kaviris, G.; Vallianatos, F. Shear-Wave Splitting Patterns in Perachora (Eastern Gulf of Corinth, Greece). Ann. Geophys. Accept. 2023, 66, 1–6. [Google Scholar] [CrossRef]
  18. Papadimitriou, E.; Bonatis, P.; Bountzis, P.; Kostoglou, A.; Kourouklas, C.; Karakostas, V. The Intense 2020–2021 Earthquake Swarm in Corinth Gulf: Cluster Analysis and Seismotectonic Implications from High Resolution Microseismicity. Pure Appl. Geophys. 2022, 179, 3121–3155. [Google Scholar] [CrossRef]
  19. Kaviris, G.; Kapetanidis, V.; Kravvariti, P.; Karakonstantis, A.; Bozionelos, G.; Papadimitriou, P.; Voulgaris, N.; Makropoulos, K. Anisotropy Study in Villia (E. Corinth Gulf, Greece). In Proceedings of the 2nd European Conference on Earthquake Engineering and Seismology, Istanbul, Türkiye, 25–29 August 2014. [Google Scholar]
  20. Elias, P.; Spingos, I.; Kaviris, G.; Karavias, A.; Gatsios, T.; Sakkas, V.; Parcharidis, I. Combined Geodetic and Seismological Study of the December 2020 Mw = 4.6 Thiva (Central Greece) Shallow Earthquake. Appl. Sci. 2021, 11, 5947. [Google Scholar] [CrossRef]
  21. Kaviris, G.; Kapetanidis, V.; Spingos, I.; Sakellariou, N.; Karakonstantis, A.; Kouskouna, V.; Elias, P.; Karavias, A.; Sakkas, V.; Gatsios, T.; et al. Investigation of the Thiva 2020–2021 Earthquake Sequence Using Seismological Data and Space Techniques. Appl. Sci. 2022, 12, 2630. [Google Scholar] [CrossRef]
  22. Kaviris, G.; Spingos, I.; Millas, C.; Kapetanidis, V.; Fountoulakis, I.; Papadimitriou, P.; Voulgaris, N.; Drakatos, G. Effects of the January 2018 Seismic Sequence on Shear-Wave Splitting in the Upper Crust of Marathon (NE Attica, Greece). Phys. Earth Planet. Inter. 2018, 285, 45–58. [Google Scholar] [CrossRef]
  23. Kapetanidis, V.; Kassaras, I. Contemporary Crustal Stress of the Greek Region Deduced from Earthquake Focal Mechanisms. J. Geodyn. 2019, 123, 55–82. [Google Scholar] [CrossRef]
  24. Karakonstantis, A.; Papadimitriou, P.; Millas, C.; Spingos, I.; Fountoulakis, I.; Kaviris, G. Tomographic Imaging of the NW Edge of the Hellenic Volcanic Arc. J. Seismol. 2019, 23, 995–1016. [Google Scholar] [CrossRef]
  25. Kiratzi, A.; Benetatos, C. The 6 January 2008 (Mw 6.2) Leonidio (Southern Greece) Intermediate Depth Earthquake: Teleseismic Body Wave Modeling; Technical Report; EMSC (European Mediterranean Seismological Centre): Bruyères-le-Châtel, France, 2008; p. 6. [Google Scholar]
  26. Zahradnik, J.; Gallovic, F.; Sokos, E.; Serpetsidaki, A.; Tselentis, A. Quick Fault-Plane Identification by a Geometrical Method: Application to the MW 6.2 Leonidio Earthquake, 6 January 2008, Greece. Seismol. Res. Lett. 2008, 79, 653–662. [Google Scholar] [CrossRef] [Green Version]
  27. Papadimitriou, E.E.; Karakostas, V.G. Rupture Model of the Great AD 365 Crete Earthquake in the Southwestern Part of the Hellenic Arc. Acta Geophys. 2008, 56, 293–312. [Google Scholar] [CrossRef]
  28. Ambraseys, N. Earthquakes in the Mediterranean and Middle East: A Multidisciplinary Study of Seismicity up to 1900; Cambridge University Press: Cambridge, UK, 2009; ISBN 978-0-521-87292-8. [Google Scholar]
  29. Papadopoulos, G.A. A Seismic History of Crete: Earthquakes and Tsunamis, 2000 B.C.–A.D. 2010; Ocelotos Publishing: Ocelotons, Athens, 2011; Volume 415. [Google Scholar]
  30. Konstantinou, K.I.; Kalogeras, I.S.; Melis, N.S.; Kourouzidis, M.C.; Stavrakakis, G.N. The 8 January 2006 Earthquake (Mw 6.7) Offshore Kythira Island, Southern Greece: Seismological, Strong-Motion, and Macroseismic Observations of an Intermediate-Depth Event. Seismol. Res. Lett. 2006, 77, 544–553. [Google Scholar] [CrossRef]
  31. Papanikolaou, D. The Geology of Greece; Springer: Berlin/Heidelberg, Germany, 2021; Volume 345. [Google Scholar]
  32. Mariolakos, I.; Papanikolaou, D.; Symeonidis, N.; Lekkas, S.; Karotsieris, Z.; Sideris, C. The Deformation of the Area around the Eastern Korinthian Gulf, Affected by the Earthquakes of February–March 1981. In Proceedings of the International Symposium on the Hellenic Arc and Trench (HEAT), Athens, Greece, 8–10 April 1982; Volume 1, pp. 400–420. [Google Scholar]
  33. Papanikolaou, D.; Mariolakos, I.; Lekkas, E.; Lozios, S. Morphotectonic Observations on the Asopos Basin and the Coastal Zone of Oropos. Contribution on the Neotectonics of Northern Attica. Bull. Geol. Soc. Greece 1988, 20, 252–267. [Google Scholar]
  34. Mariolakos, I.; Fountoulis, I.; Sideris, C.; Chatoupis, T. Morphoneotectonic Structure of the Parnis Mt. (Athens, Greece). Bull. Geol. Soc. Greece 2001, 34, 183–190. [Google Scholar] [CrossRef] [Green Version]
  35. Mariolakos, I.; Fountoulis, I.; Theocharis, D. The Neotectonic Structure and Evolution of the Salamis Island (Athens, Greece). Bull. Geol. Soc. Greece 2001, 34, 165–173. [Google Scholar] [CrossRef]
  36. Theocharis, D.; Fountoulis, I. Morphometric Indices and Tectonically Active Structures: The Case of Salamis Island. In Proceedings of the 6th Panhellenic Geographical Congress, Thessalon, Greece, 3–6 October 2002; Volume 1, pp. 97–106. [Google Scholar]
  37. Chatoupis, T.; Fountoulis, I. The Neotectonic Deformation of N. Parnis Mt. (Attica, Greece). Bull. Geol. Soc. Greece 2004, 36, 1588–1597. [Google Scholar]
  38. Papanikolaou, I.; Papanikolaou, D.; Lekkas, E. Low Slip-Rate Faults around Big Cities: A Challenging Threat. The Afindai Fault as a Case Study for the City of Athens. In Proceedings of the 14th World Conference on Earthquake Engineering, Beijing, China, 12–17 October 2008. [Google Scholar]
  39. Lekkas, E.; Papanikolaou, I.; Papanikolaou, D.; Danamos, G. Correlating the Damage Pattern and the Geological Structure. Local Site Effects from the 2006 Mw = 6.7 Kythira Island Intermediate Depth Event, SW Greece. In Proceedings of the 14th World Conference on Earthquake Engineering, Beijing, China, 12–17 October 2008. [Google Scholar]
  40. de Gelder, G.; Fernández-Blanco, D.; Öğretmen, N.; Liakopoulos, S.; Papanastassiou, D.; Faranda, C.; Armijo, R.; Lacassin, R. Quaternary E-W Extension Uplifts Kythira Island and Segments the Hellenic Arc. Tectonics 2022, 41, e2022TC007231. [Google Scholar] [CrossRef] [PubMed]
  41. Veliz-Borel, V.; Mouslopoulou, V.; Nicol, A.; Begg, J.; Oncken, O. Normal Faulting Along the Kythira-Antikythira Strait, Southwest Hellenic Forearc, Greece. Front. Earth Sci. 2022, 9, 1325. [Google Scholar] [CrossRef]
  42. Deligiannakis, G.; Papanikolaou, I.D.; Roberts, G. Fault Specific GIS Based Seismic Hazard Maps for the Attica Region, Greece. Geomorphology 2018, 306, 264–282. [Google Scholar] [CrossRef] [Green Version]
  43. Konstantinou, K.I.; Mouslopoulou, V.; Saltogianni, V. Seismicity and Active Faulting around the Metropolitan Area of Athens, Greece. Bull. Seismol. Soc. Am. 2020, 110, 1924–1941. [Google Scholar] [CrossRef]
  44. Iezzi, F.; Roberts, G.; Faure Walker, J.; Papanikolaou, I.; Ganas, A.; Deligiannakis, G.; Beck, J.; Wolfers, S.; Gheorghiu, D. Temporal and Spatial Earthquake Clustering Revealed through Comparison of Millennial Strain-Rates from 36Cl Cosmogenic Exposure Dating and Decadal GPS Strain-Rate. Sci. Rep. 2021, 11, 23320. [Google Scholar] [CrossRef] [PubMed]
  45. Danamos, G. Contribution to the Geology and Hydrogeology of the Island of Kythira. Ph.D. Thesis, University of Athens, Athens, Greece, 1992. [Google Scholar]
  46. Mariolakos, I.; Fountoulis, I. The Athens Earthquake September 7, 1999: The Neotectonic Regime of the Affected Area. Ann. Géologiques Pays Hell. 2000, 38, 165–174. [Google Scholar]
  47. Wang, Z. Seismic Hazard Assessment: Issues and Alternatives. Pure Appl. Geophys. 2011, 168, 11–25. [Google Scholar] [CrossRef]
  48. Wang, Z. A Clear Definition of Seismic Hazard and Risk: A Basis for Hazard and Risk Assessment, Communication, and Management. In AGU Fall Meeting Abstracts, 2005; AGU: Washington, DC, USA, 2005; p. S53B-1110. [Google Scholar]
  49. Wang, Z. Understanding Seismic Hazard and Risk Assessments: An Example in The New Madrid Seismic Zone of The Central United States. In Proceedings of the 8th National Conference on Earthquake Engineering, San Francisco, CA, USA, 18–22 April 2006; Volume 416. [Google Scholar]
  50. Musson, R.M.W. PSHA Validated by Quasi Observational Means. Seismol. Res. Lett. 2012, 83, 130–134. [Google Scholar] [CrossRef]
  51. Mulargia, F.; Stark, P.B.; Geller, R.J. Why Is Probabilistic Seismic Hazard Analysis (PSHA) Still Used? Phys. Earth Planet. Inter. 2017, 264, 63–75. [Google Scholar] [CrossRef]
  52. Makropoulos, K.C.; Burton, P.W. Seismic Hazard in Greece. II. Ground Acceleration. Tectonophysics 1985, 117, 259–294. [Google Scholar] [CrossRef]
  53. Banitsiotou, I.D.; Tsapanos, T.M.; Margaris, V.N.; Hatzidimitriou, P.M. Estimation of the Seismic Hazard Parameters for Various Sites in Greece Using a Probabilistic Approach. Nat. Hazards Earth Syst. Sci. 2004, 4, 399–405. [Google Scholar] [CrossRef] [Green Version]
  54. Tselentis, G.-A.; Danciu, L. Probabilistic Seismic Hazard Assessment in Greece—Part 1: Engineering Ground Motion Parameters. Nat. Hazards Earth Syst. Sci. 2010, 10, 25–39. [Google Scholar] [CrossRef] [Green Version]
  55. Bonatis, P. Strong Ground Motion Simulation in the Central Ionian Islands Using a Hybrid (Deterministic and Stochastic) Approach. Master’s Thesis, Aristotle University of Thessaloniki, Thessaloniki, Greece, 2020. [Google Scholar]
  56. Bonatis, P.; Akinci, A.; Karakostas, V.; Papadimitriou, E.; Kaviris, G. Near-Fault Broadband Ground Motion Simulation Applications at the Central Ionian Islands, Greece. Pure Appl. Geophys. 2021, 178, 3505–3527. [Google Scholar] [CrossRef]
  57. Pavlou, K.; Κaviris, G.; Kouskouna, V.; Sakkas, G.; Zymvragakis, A.; Sakkas, V.; Drakatos, G. Minor Seismic Hazard Changes in the Broader Area of Pournari Artificial Lake after the First Filling (W. Greece). Results Geophys. Sci. 2021, 7, 100025. [Google Scholar] [CrossRef]
  58. Kaviris, G.; Zymvragakis, A.; Bonatis, P.; Sakkas, G.; Kouskouna, V.; Voulgaris, N. Probabilistic Seismic Hazard Assessment for the Broader Messinia (SW Greece) Region. Pure Appl. Geophys. 2022, 179, 551–567. [Google Scholar] [CrossRef]
  59. Kaviris, G.; Zymvragakis, A.; Bonatis, P.; Kapetanidis, V.; Voulgaris, N. Probabilistic and Scenario-Based Seismic Hazard Assessment on the Western Gulf of Corinth (Central Greece). Appl. Sci. 2022, 12, 11152. [Google Scholar] [CrossRef]
  60. Anonymous. ELSTAT Census Results of Population and Housing 2021; Hellenic Statistical Authority: Piraeus, Greece, 2021; p. 64. [Google Scholar]
  61. Cornell, C. Engineering Seismic Risk Analysis. Bull. Seismol. Soc. Am. 1968, 58, 1583–1606. [Google Scholar] [CrossRef]
  62. McGuire, R.K. FORTRAN Computer Program for Seismic Risk Analysis; Open-File Report; US Geological Survey: Washington, DC, USA, 1976.
  63. Marzocchi, W.; Taroni, M. Some Thoughts on Declustering in Probabilistic Seismic-Hazard Analysis. Bull. Seismol. Soc. Am. 2014, 104, 1838–1845. [Google Scholar] [CrossRef]
  64. Taroni, M.; Akinci, A. A New Smoothed Seismicity Approach to Include Aftershocks and Foreshocks in Spatial Earthquake Forecasting: Application to the Global Mw ≥ 5.5 Seismicity. Appl. Sci. 2021, 11, 10899. [Google Scholar] [CrossRef]
  65. Woessner, J.; Laurentiu, D.; Giardini, D.; Crowley, H.; Cotton, F.; Grünthal, G.; Valensise, G.; Arvidsson, R.; Basili, R.; Demircioglu, M.B.; et al. The 2013 European Seismic Hazard Model: Key Components and Results. Bull. Earthq. Eng. 2015, 13, 3553–3596. [Google Scholar] [CrossRef] [Green Version]
  66. Danciu, L.; Nandan, S.; Reyes, C.; Basili, R.; Weatherill, G.; Beauval, C.; Rovida, A.; Vilanova, S.; Sesetyan, K.; Bard, P.-Y.; et al. ESHM20—EFEHR Technical Report the 2020 Update of the European Seismic Hazard Model—ESHM20: Model Overview; EFEHR European Facilities of Earthquake Hazard and Risk; ETH Library: Zurich, Switzerland, 2021. [Google Scholar]
  67. Ordaz, M.; Salgado-Gálvez, M.A.; Giraldo, S. R-CRISIS: 35 Years of Continuous Developments and Improvements for Probabilistic Seismic Hazard Analysis. Bull. Earthq. Eng. 2021, 19, 2797–2816. [Google Scholar] [CrossRef]
  68. Gutenberg, B.; Richter, C.F. Frequency of Earthquakes in California. Bull. Seismol. Soc. Am. 1944, 34, 185–188. [Google Scholar] [CrossRef]
  69. Wiemer, S.; Wyss, M. Minimum Magnitude of Completeness in Earthquake Catalogs: Examples from Alaska, the Western United States, and Japan. Bull. Seismol. Soc. Am. 2000, 90, 859–869. [Google Scholar] [CrossRef]
  70. Aki, K. Maximum Likelihood Estimate of b in the Formula LogN a − BM and Its Confidence Limits. Earthq. Res. Inst. Univ. Tokyo 1965, 43, 237–239. [Google Scholar]
  71. Wiemer, S. A Software Package to Analyze Seismicity: ZMAP. Seismol. Res. Lett. 2001, 72, 373–382. [Google Scholar] [CrossRef]
  72. Zhou, Y.; Zhou, S.; Zhuang, J. A Test on Methods for MC Estimation Based on Earthquake Catalog. Earth Planet. Phys. 2018, 2, 150–162. [Google Scholar] [CrossRef]
  73. Kijko, A.; Sellevoll, M.A. Estimation of Earthquake Hazard Parameters for Incomplete and Uncertain Data Files. Nat. Hazards 1990, 3, 1–13. [Google Scholar] [CrossRef]
  74. Wheeler, R. Methods of Mmax Estimation East of the Rocky Mountains; US Department of the Interior, Geological Survey: Washington, DC, USA, 2009; Volume 1018, p. 44.
  75. Kijko, A.; Singh, M. Statistical Tools for Maximum Possible Earthquake Magnitude Estimation. Acta Geophys. 2011, 59, 674–700. [Google Scholar] [CrossRef] [Green Version]
  76. Margaris, B.; Papazachos, C.; Papaioannou, C.; Theodulidis, N.; Kalogeras, I.; Skarlatoudis, A. Empirical Attenuation Relations for the Horizontal Strong Ground Motion Parameters of Shallow Earthquakes in Greece. In Proceedings of the Twelfth European Conference on Earthquake Engineering, London, UK, 9–13 September 2002; p. 11. [Google Scholar]
  77. Skarlatoudis, A.A.; Papazachos, C.B.; Margaris, B.N.; Theodulidis, N.; Papaioannou, C.; Kalogeras, I.; Scordilis, E.M.; Karakostas, V. Empirical Peak Ground-Motion Predictive Relations for Shallow Earthquakes in Greece. Bull. Seismol. Soc. Am. 2003, 93, 2591–2603, Erratum in Bull. Seismol. Soc. Am. 2007, 97, 2219–2221. [Google Scholar] [CrossRef] [Green Version]
  78. Danciu, L.; Tselentis, G.-A. Engineering Ground-Motion Parameters Attenuation Relationships for Greece. Bull. Seismol. Soc. Am. 2007, 97, 162–183. [Google Scholar] [CrossRef]
  79. Sakkas, G. Calculation and Analysis of the Seismic Motion Rotational Components in Greece. Ph.D. Thesis, Department of Geophysics and Geothermics, National and Kapodistrian University of Athens, Athens, Greece, 2016. [Google Scholar] [CrossRef]
  80. Chousianitis, K.; Del Gaudio, V.; Pierri, P.; Tselentis, G.-A. Regional Ground-Motion Prediction Equations for Amplitude-, Frequency Response-, and Duration-Based Parameters for Greece. Earthq. Eng. Struct. Dyn. 2018, 47, 2252–2274. [Google Scholar] [CrossRef]
  81. Skarlatoudis, A.A.; Papazachos, C.B.; Margaris, B.N.; Ventouzi, C.; Kalogeras, I.; the EGELADOS Group. Ground-Motion Prediction Equations of Intermediate-Depth Earthquakes in the Hellenic Arc, Southern Aegean Subduction Area. Bull. Seismol. Soc. Am. 2013, 103, 1952–1968. [Google Scholar] [CrossRef] [Green Version]
  82. Boore, D.M.; Stewart, J.P.; Skarlatoudis, A.A.; Seyhan, E.; Margaris, B.; Theodoulidis, N.; Scordilis, E.; Kalogeras, I.; Klimis, N.; Melis, N.S. A Ground-Motion Prediction Model for Shallow Crustal Earthquakes in Greece. Bull. Seismol. Soc. Am. 2020, 111, 857–874. [Google Scholar] [CrossRef]
  83. Mosca, I.; Sargeant, S.; Baptie, B.; Musson, R.M.W.; Pharaoh, T.C. The 2020 National Seismic Hazard Model for the United Kingdom. Bull. Earthq. Eng. 2022, 20, 633–675. [Google Scholar] [CrossRef]
  84. Scaria, A.; Gupta, I.D.; Gupta, V.K. An Improved Probabilistic Seismic Hazard Mapping of Peninsular Shield Region of India. Soil Dyn. Earthq. Eng. 2021, 141, 106417. [Google Scholar] [CrossRef]
  85. Sotiriadis, D.; Margaris, B. Evaluation of the Predictive Performance of Regional and Global Ground Motion Predictive Equations against Greek Strong Motion Data. Soil Dyn. Earthq. Eng. 2023, 165, 107656. [Google Scholar] [CrossRef]
  86. Scherbaum, F.; Cotton, F.; Smit, P. On the Use of Response Spectral-Reference Data for the Selection and Ranking of Ground-Motion Models for Seismic-Hazard Analysis in Regions of Moderate Seismicity: The Case of Rock Motion. Bull. Seismol. Soc. Am. 2004, 94, 2164–2185. [Google Scholar] [CrossRef] [Green Version]
  87. Kale, Ö.; Akkar, S. A New Procedure for Selecting and Ranking Ground-Motion Prediction Equations (GMPEs): The Euclidean Distance-Based Ranking (EDR) Method. Bull. Seismol. Soc. Am. 2013, 103, 1069–1084. [Google Scholar] [CrossRef]
  88. Scherbaum, F.; Delavaud, E.; Riggelsen, C. Model Selection in Seismic Hazard Analysis: An Information-Theoretic Perspective. Bull. Seismol. Soc. Am. 2009, 99, 3234–3247. [Google Scholar] [CrossRef]
  89. Luzi, L.; Puglia, R.; Russo, E.; D’Amico, M.; Felicetta, C.; Pacor, F.; Lanzano, G.; Çeken, U.; Clinton, J.; Costa, G.; et al. The Engineering Strong-Motion Database: A Platform to Access Pan-European Accelerometric Data. Seismol. Res. Lett. 2016, 87, 987–997. [Google Scholar] [CrossRef] [Green Version]
  90. Beauval, C.; Tasan, H.; Laurendeau, A.; Delavaud, E.; Cotton, F.; Guéguen, P.; Kuehn, N. On the Testing of Ground-Motion Prediction Equations against Small-Magnitude Data. Bull. Seismol. Soc. Am. 2012, 102, 1994–2007. [Google Scholar] [CrossRef] [Green Version]
  91. Wald, D.J.; Allen, T.I. Topographic Slope as a Proxy for Seismic Site Conditions and Amplification. Bull. Seismol. Soc. Am. 2007, 97, 1379–1395. [Google Scholar] [CrossRef] [Green Version]
  92. Lemoine, A.; Douglas, J.; Cotton, F. Testing the Applicability of Correlations between Topographic Slope and VS30 for Europe. Bull. Seismol. Soc. Am. 2012, 102, 2585–2599. [Google Scholar] [CrossRef] [Green Version]
  93. Bommer, J.J.; Scherbaum, F. The Use and Misuse of Logic Trees in Probabilistic Seismic Hazard Analysis. Earthq. Spectra 2008, 24, 997–1009. [Google Scholar] [CrossRef]
  94. Atkinson, G.M.; Bommer, J.J.; Abrahamson, N.A. Alternative Approaches to Modeling Epistemic Uncertainty in Ground Motions in Probabilistic Seismic-Hazard Analysis. Seismol. Res. Lett. 2014, 85, 1141–1144. [Google Scholar] [CrossRef]
  95. Marzocchi, W.; Taroni, M.; Selva, J. Accounting for Epistemic Uncertainty in PSHA: Logic Tree and Ensemble Modeling. Bull. Seismol. Soc. Am. 2015, 105, 2151–2159. [Google Scholar] [CrossRef]
  96. National Building Code. EAK Greek Seismic Code; Earthquake Planning and Protection Organization: Athens, Greece, 2003.
  97. Tselentis, G.-A.; Danciu, L.; Sokos, E. Probabilistic Seismic Hazard Assessment in Greece—Part 2: Acceleration Response Spectra and Elastic Input Energy Spectra. Nat. Hazards Earth Syst. Sci. 2010, 10, 41–49. [Google Scholar] [CrossRef]
  98. Panakkat, A.; Adeli, H. Neural Network Models for Earthquake Magnitude Prediction Using Multiple Seismicity Indicators. Int. J. Neural Syst. 2007, 17, 13–33. [Google Scholar] [CrossRef]
  99. Chattopadhyay, G.; Chattopadhyay, S. Dealing with the Complexity of Earthquake Using Neurocomputing Techniques and Estimating Its Magnitudes with Some Low Correlated Predictors. Arab. J. Geosci. 2009, 2, 247–255. [Google Scholar] [CrossRef]
  100. Wessel, P.; Smith, W.H.F. New, Improved Version of Generic Mapping Tools Released. Eos Trans. Am. Geophys. Union 1998, 79, 579. [Google Scholar] [CrossRef]
  101. Esri ArcGIS Pro, version 3.1.0; Esri: Redlands, CA, USA, 2023.
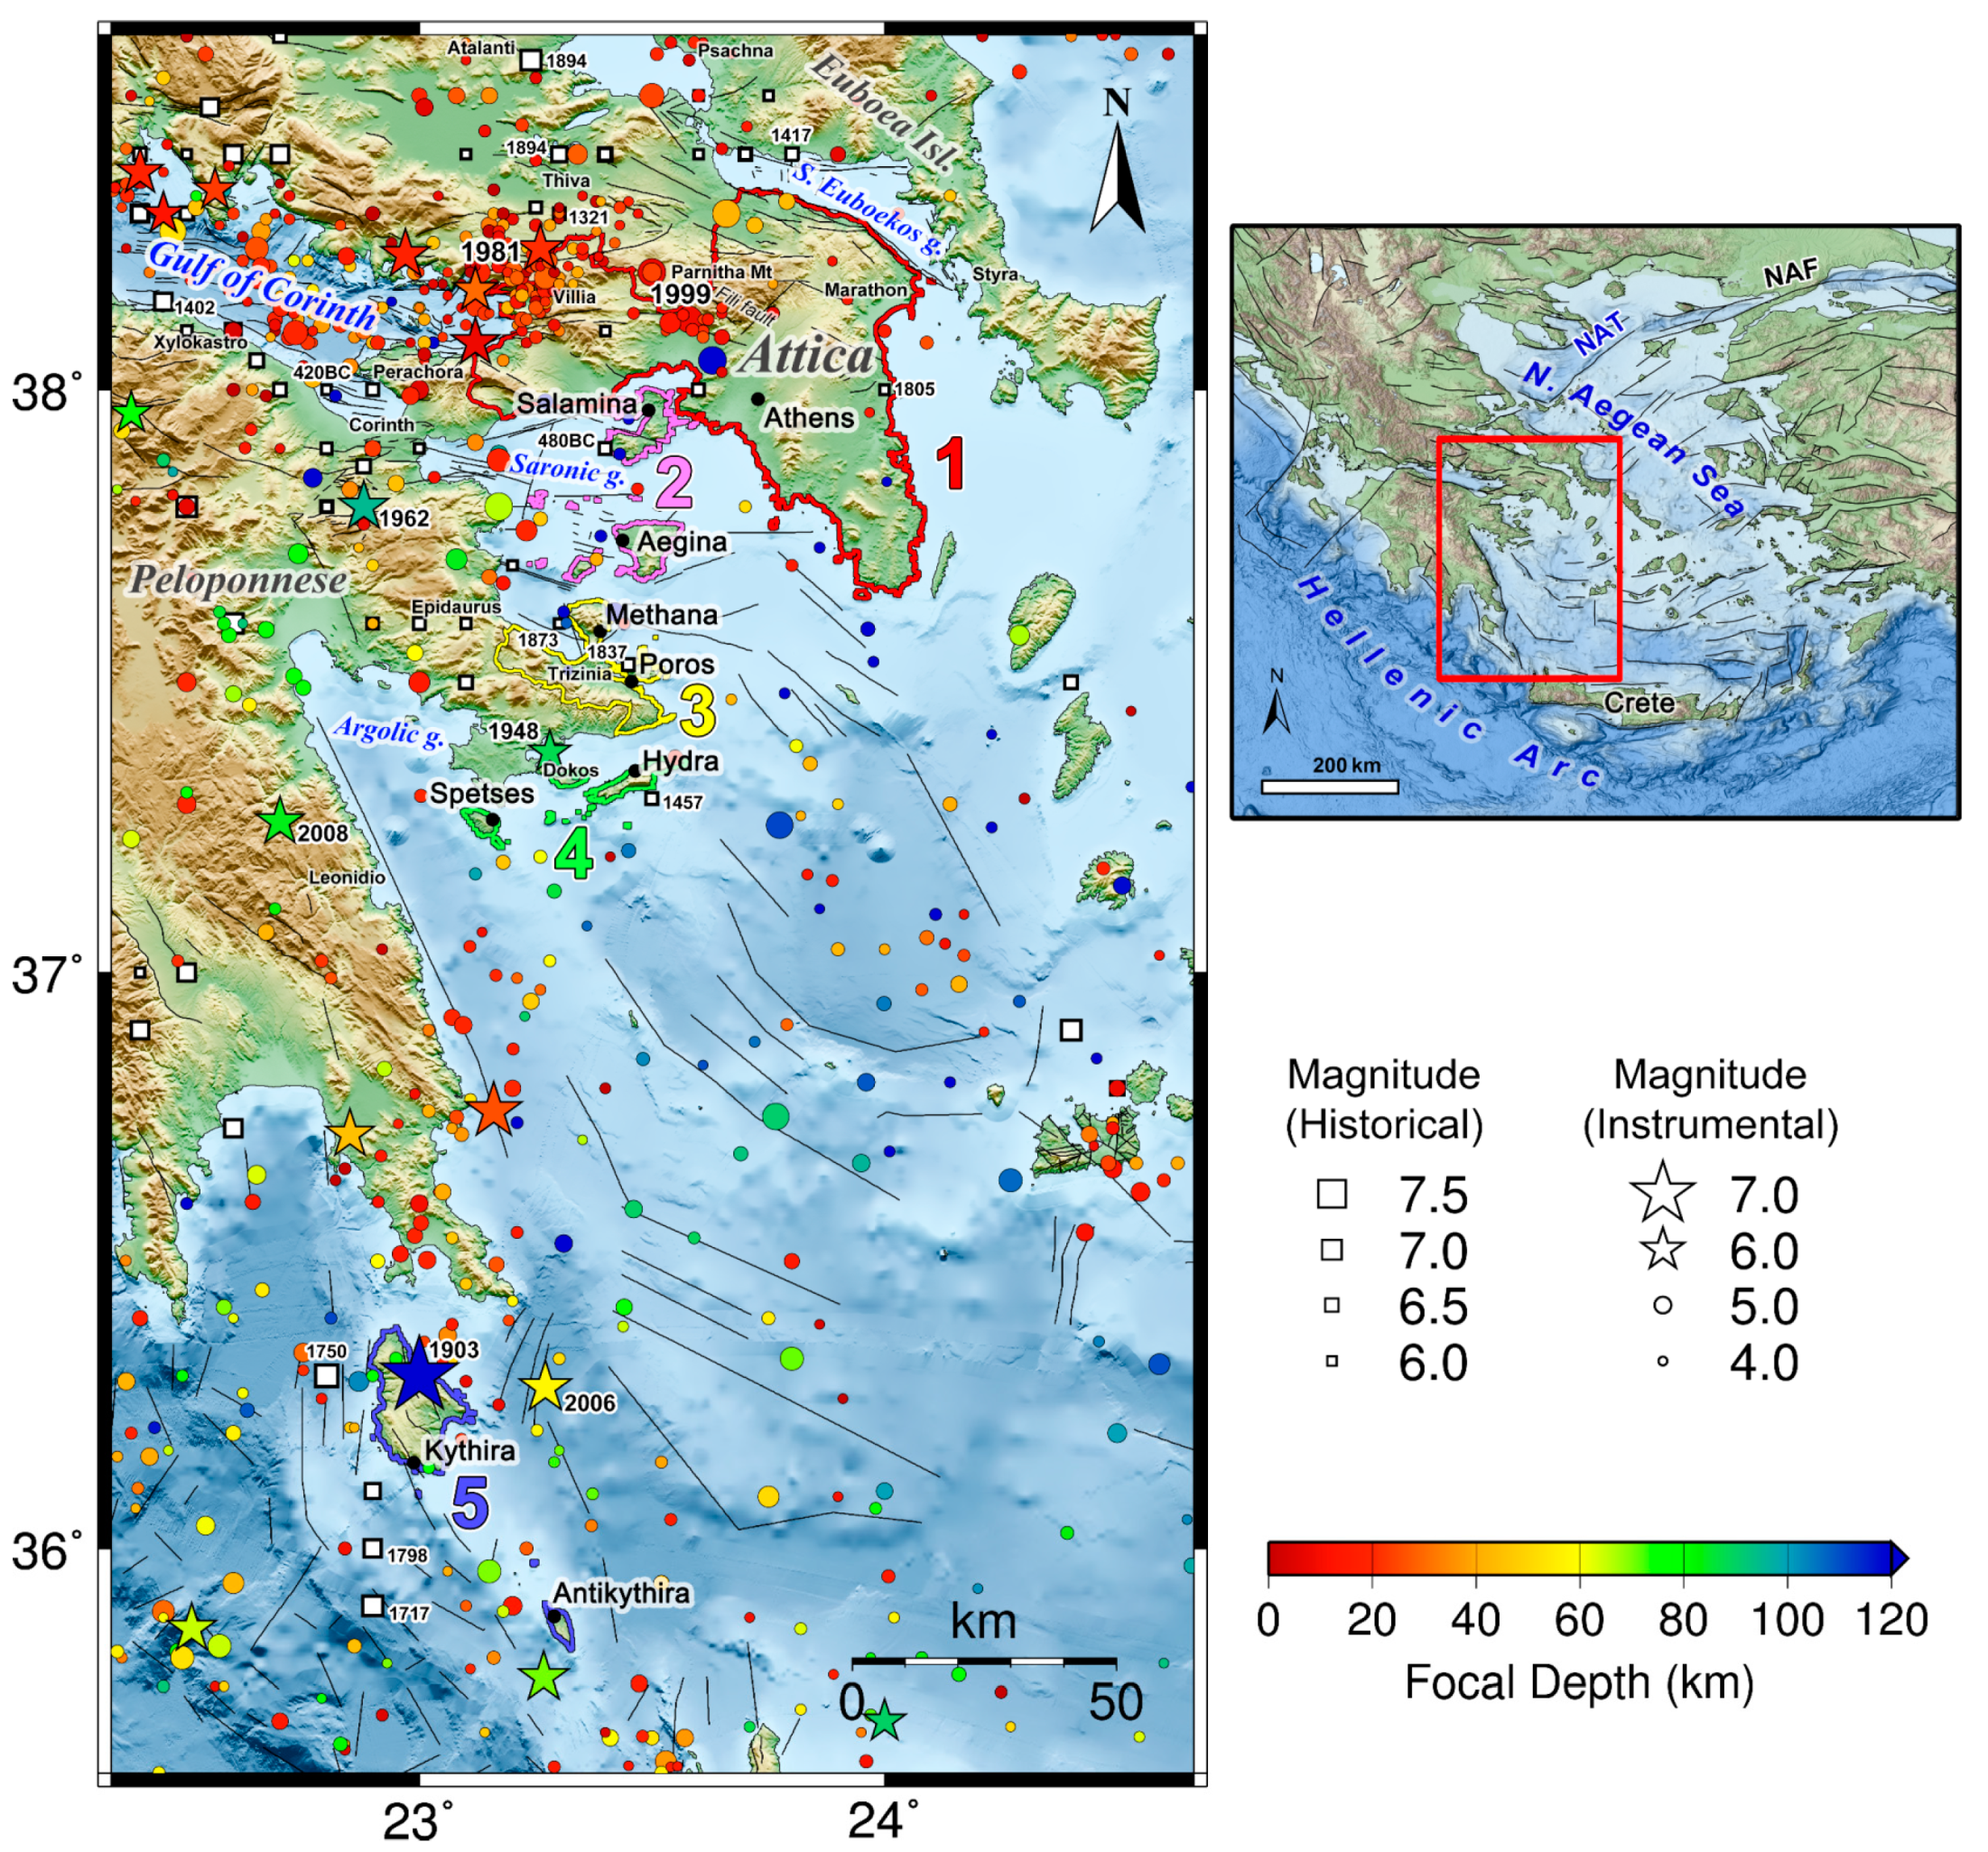
Figure 1. Historical (white squares; after Papazachos and Papazachou [2]) and instrumental (1900–2019) seismicity (circles and stars, color-coded according to their focal depth; after Makropoulos et al. [4], extended up to 2019) in the broader area of the administrative region of Attica. The selected area is marked with a red rectangle in the inset map (NAT: North Aegean Trough; NAF: North Anatolian Fault). The onshore borders and coastlines of the five sub-areas analyzed in the current study are drawn with colored outlines and labeled with the numbers 1–5. Fault lines on the main map are from the NOAfaults v4.0 database [6]. Years of occurrence of significant earthquakes of the historical and instrumental era, mentioned in the text, are marked with labels next to their corresponding epicenter.
Applsci 13 07553 g001
Figure 2. The logic tree decision diagram, implemented in the final step of the computational scheme. The term ASj denotes the area source j (j = 1, 2, …, N), with all area sources presented in Figure S1 in the Supplementary Material. The weights in the last column indicate the percentage of normal and non-normal focal mechanisms; these weights for all area sources are provided in Table S1. In order to ensure clarity, the minor logic trees of the GMPE and the predominant type of focal mechanism sections are displayed only for the first area source.
Applsci 13 07553 g002
Figure 3. The spatial distribution of PGA values for a return period of 475 years for each of the five sub-areas, i.e., (a) Attica peninsula, (b) Salamina and Aegina, (c) Methana and Poros, (d) Hydra and Spetses, and (e) Kythira and Antikythira. Triangles indicate the main urban site at each sub-area.
Applsci 13 07553 g003
Figure 4. The spatial distribution of PGA values for a return period of 950 years for each of the five sub-areas. (ae) explanations as in Figure 3.
Applsci 13 07553 g004
Figure 5. The spatial distribution of PGV values for a return period of 475 years for each of the five sub-areas. (ae) explanations as in Figure 3.
Applsci 13 07553 g005
Figure 6. The spatial distribution of PGV values for a return period of 950 years for each of the five sub-areas. (ae) explanations as in Figure 3.
Applsci 13 07553 g006
Figure 7. (a) PGA hazard curves for Athens, Methana, and the capitals of Salamina, Aegina, Poros, Hydra, Spetses, Kythira, and Antikythira Islands. (b) UHS for the aforementioned sites. The red rectangle signifies the range of eigenperiods of most buildings in the study area. Both hazard curves and UHS were constructed considering the soil conditions of each site.
Applsci 13 07553 g007
Table 1. List of the selected GMPEs and their corresponding weights based on the LLH method for the study area. R is the epicentral distance (in km), S is the soil-type parameter, and F is the parameter related to the faulting style of the earthquake.
ReferenceFunctional FormPGA WeightPGV Weight
[76] l n P G A = 4.16 + 0.69 M 1.24 ln R + 6 + 0.12 S ± 0.70
l n P G V = 1.51 + 1.11 M 1.20 ln R + 5 + 0.29 S ± 0.80
0.140.18
[77] l o g P G A = 1.07 + 0.45 M 1.35 log R + 6 + 0.09 F + 0.06 S ± 0.286
l o g P G V = 1.46 + 0.64 M 1.29 log R + 6 + 0.02 F + 0.14 S ± 0.32
0.210.27
[78] l o g P G A = 0.883 + 0.458 M 1.278 log R 2 + 11.515 2 + 0.038 S + 0.116 F ± 0.27
l o g P G V = 1.436 + 0.625 M 1.152 log R 2 + 10.586 2 + 0.026 S + 0.086 F ± 0.283
0.200.26
[79] l o g P G A = 0.814 + 0.472 M 1.319 log R 2 + 11.056 2 + 0.047 S + 0.097 F ± 0.298 0.23-
[80] l o g P G A = 0.787 + 0.478 M 1.092 l o g ( R 2 + 10.688 2 0.0044 R 2 + 10.688 2 + 0.096 S + 0.146 F ± 0.285 )
l o g P G V = 1.082 + 0.692 M 1.614 l o g R 2 + 12.641 2 + 0.137 S + 0.31 S + 0.068 F ± 0.306
0.220.29
Table 2. PGA values considering rock (PGAr) and local site (PGAs) conditions.
SitePGAr (cm/s2) PGAs (cm/s2)
Athens141169
Salamina218261
Aegina225243
Methana167240
Poros155239
Hydra168202
Spetses148178
Kythira212254
Antikythira219263
Disclaimer/Publisher’s Note: The statements, opinions and data contained in all publications are solely those of the individual author(s) and contributor(s) and not of MDPI and/or the editor(s). MDPI and/or the editor(s) disclaim responsibility for any injury to people or property resulting from any ideas, methods, instructions or products referred to in the content.