Article

A Detecting Method for “Weak” Friction-Induced Vibration Based on Cross-Correlation Analysis between Vibration and Sound Signals

1
Marine Engineering College, Dalian Maritime University, Dalian 116026, China
2
College of Mechanical and Electronic Engineering, Dalian Minzu University, Dalian 116600, China
*
Authors to whom correspondence should be addressed.
Appl. Sci. 2023, 13(13), 7468; https://doi.org/10.3390/app13137468
Submission received: 30 April 2023 / Revised: 22 June 2023 / Accepted: 23 June 2023 / Published: 24 June 2023
(This article belongs to the Special Issue Fault Diagnosis and Condition Monitoring of Transmission Systems)

Abstract

:
The “weak” friction-induced vibration can help to monitor the change in friction and wear state of friction pairs and detect the failure of surface damage. However, they are typically submerged in complex interference components during friction. Therefore, detecting accurate “weak” friction-induced vibration is key to using it entirely. A method based on the correlation between friction-induced vibration and sound signals was proposed to achieve this goal. The ball–disk wear experiments were conducted under oil lubrication using a wear tester. Vibration and sound pressure signals generated during the experiments were recorded. By the spectrum analysis of the cross-correlation function calculated from the two types of signals, the “weak” FIV components submerged in the original signals were detected. The experimental results showed that the root mean square change of the “weak” friction-induced vibration detected in the vibration and sound pressure signals was highly consistent with the friction coefficient change. It could effectively characterize the transition of the wear stage from running-in to stable wear of the friction pairs. Therefore, the cross-correlation analysis of vibration and sound signals could be a reliable tool for detecting the “weak” friction-induced vibration.

1. Introduction

Many types of mechanical equipment are designed to transfer power or brakes using friction. Wear is an inevitable result of friction and can cause continuous damage to the surface material. Worldwide, the total damage caused by wear is significant. According to statistics, approximately 80% of mechanical part failures are caused by wear and more than 50% of severe accidents involving mechanical equipment are caused by catastrophic wear [1]. Moreover, approximately 3% of the world’s total energy is estimated to be consumed by wear and wear-related failures to remanufacture worn parts [2]. Therefore, monitoring the wear state of friction pairs is important to avoid undesirable consequences, increase the service performance of mechanical equipment, and effectively save energy.
Friction-induced vibration (FIV) is a common phenomenon in daily life and engineering applications, such as squeaks of hinges, wheel–rail squeal [3], creep of water-lubricated bearings [4], disc brake noise [5], and chatter in machine tool systems [6]. Based on the distinct time-frequency features, FIV can be divided into two main types: “strong” FIV in high amplitude with a narrow spectrum lumped on the system’s natural frequency (or its harmonics) and “weak” FIV of low-amplitude magnitude with a broadband spectrum related to the natural frequency of each asperity on the sliding surfaces [7]. The “strong” FIV, such as friction squeal, is typically undesirable because it is related to the system’s dynamic instabilities and is accompanied by a high vibration and an annoying sound; moreover, it can reduce machine accuracy and increase the wear of friction pairs [8]. Therefore, in the last few decades, scholars have studied the mechanism and influencing factors by combining theoretical and experimental methods to provide basic information for controlling and predicting the “strong” FIV [9]. The “weak” FIV is highly dependent on the impacts of the asperities between the friction surfaces; one is known as surface or roughness sound [10]. As a result, some scholars believe that the “weak” FIV can help monitor the change in friction and wear state of friction pairs [11] and detect the failure of surface damage [12]. Therefore, studying the correspondence between “weak” FIV and the wear behaviors of friction pairs can be used to monitor the wear state of friction pairs online.
Nevertheless, due to the coupling effect of system dynamics, background noise, and wear behavior, the accurate “weak” FIV is often submerged in complex interference components in the friction process. Moreover, studies show that the “weak” FIV that reflects the wear state distributes in a wide frequency range [13]. Therefore, analyzing and monitoring the wear state using the “weak” FIV requires eliminating interference components and determining the frequency distribution ranges of the “weak” FIV. It is for this reason that scholars have conducted considerable research into the detection method of “weak” FIV methods. For example, Sun et al. [14] decomposed the vibration signals of a pin–disk wear test into several frequency bands by harmonic wavelet packet transform (HWPT). The “weak” FIV was reconstructed from the frequency band whose root mean square (RMS) of the corresponding waveform followed the same trend as the friction coefficient. Ding et al. [15,16] filtered the original sound pressure signal to obtain friction-induced sound (FIS) by empirical mode decomposition (EMD). By decomposing the original signals into 11 intrinsic mode functions (IMFs), they were able to reconstruct the FIS using IMF5 to IMF11 without frequency peaks. Researchers [17,18] decomposed the original vibration signals of piston rings and dry gas seal rings in a wear process using ensemble empirical mode decomposition (EEMD) and both extracted the first two IMFs with high-frequency to reconstruct the “weak” FIV (whose RMS changing trend was consistent with that of the friction coefficient) from the original vibration signals. By controlling the operation of the three main moving components one at a time, Xu et al. [19] analyzed the time-frequency characteristics of vibration signals recorded by a roller ring test rig operating at different rotating speeds. They found that vibration energy in the frequency range of 6000–7000 Hz was significant when the ring roller was working. As a result, they considered the above frequency band to be induced by the friction between tribo-pair surfaces and it was extracted and reconstructed as the “weak” FIV by using HWPT. It can be seen that determining the frequency distribution of the “weak” FIV should be carried out with the help of friction coefficient and wear experiments, which is a challenging work in practical applications. Moreover, many repeated tentative calculations are required to determine extracted frequency and the number of IMFs, leading to inefficiency. Therefore, it is necessary to propose a more operable and efficient method for detecting the frequency range of the “weak” FIV.
According to the driving mechanism of the “weak” FIV, when the elastically deformed asperities return to the stable position and the damaged asperities break off suddenly in the friction process, the waves originate at the contact interface, vibration is excited, and part of the energy is radiated in the form of sound energy, that is, FIV and FIS occur [20]. Thus, the “weak” FIV components in vibration and sound are correlated, which makes it possible to identify “weak” FIV by cross-correlation analysis (CCA) without the help of the friction coefficient. Of course, the discussion of detecting “weak” FIV signals by CCA is in no sense new, for example, see [21,22]. However, most of the present work focused on the CCA of the vibration signals in the tangential and normal directions rather than the vibration and sound signals. In addition, most studies used the cross-correlation coefficient to finish the goal, which required the assumption of the frequency distribution of “weak” FIV based on experience and then confirming the hypothetical results according to the cross-correlation coefficient, still requiring many repeated tentative calculations. Therefore, the present work strove to implement a more efficient method of using the CCA of vibration and sound signals to detect the “weak” FIV.
This study conducted a varying wear state experiment with a standard commercial friction-wear tester under oil-lubricated conditions to confirm no “strong” FIV emissions, such as squeal and squeak. First, the vibration-sound signals were collected simultaneously. Then, the mathematical principle of CCA and HWPT was briefly elaborated. Then, a detecting method for “weak” FIV based on the mean value of the frequency amplitude of the CCA function between vibration and sound signals was proposed. It was possible to determine the frequency range of a “weak” FIV directly through this method without assuming many possibilities, thereby avoiding repeated tentative calculations. Finally, the conclusions were presented.

2. Experiment

2.1. Apparatus

Reciprocating sliding-wear experiments were conducted using a wear test rig (Zhongkekaihua, Lanzhou, China). Figure 1a shows a schematic of the tester. A disk specimen was attached to a movable bench driven by a motor using a crank mechanism. The ball specimen was fixed to the upper holder and remained stationary during the test. A normal load was applied to the upper holder through a load device to tightly press the ball specimen. A two-dimensional force sensor was used to measure the friction and normal forces. The two-dimensional force data were processed by the data acquisition system of the test rig and automatically recorded in the form of a friction coefficient. An acceleration sensor (PCB Piezotronics China Co., Ltd., Beijing, China) was mounted on the lower surface of the cylindrical specimen to measure the vibration signals during the wear test. The sound pressure signals were measured using a microphone (G.R.A.S. Sound&Vibration China Co., Ltd., Shanghai, China) fixed 30 mm from the center of the friction pairs. The friction coefficient data, vibration, and sound pressure signals were stored on a personal computer for analysis. The surface roughness of the friction pairs was analyzed using a confocal laser scanning microscope (Olympus China Co., Ltd., Beijing, China). The original images of the experimental setup are displayed in Appendix A Figure A1. The specifications of the accelerometer and microphone are described in Appendix B Table A1 and Table A2.

2.2. Friction Pairs

Figure 1b shows the friction pairs used in the experiment; Table 1 shows the details of the friction pairs used in reciprocating sliding wear tests. A ball specimen (GCr15 steel) with a diameter of 6 mm was fixed using a special fixture. A disk specimen (C45 steel), 30 mm in diameter and 8 mm in height, was driven by an eccentric mechanism. The surface roughness Ra of the ball specimen was 0.13 μm; that of the disk specimen was 0.73 μm.

2.3. Wear Test

Table 2 shows the details of the wear experiment settings. Wear tests were conducted with a normal load of 20 N under oil lubrication (CD40 lubricating oil). The relative humidity, reciprocating stroke speed, relative sliding velocity, and test duration were 58%, 5 mm, 0.067 m/s, and 60 min, respectively. In addition, the acceleration signals, sound signals, and friction coefficients were collected after the completion of the loading process of the CFT-I tribometer in the experiments. A data acquisition system (China Orient Institute of Noise & Vibration, Beijing, China) collected four groups of acceleration and sound pressure signals per half-minute with a sampling frequency of 20,480 Hz and 10,240 sampling points. It was sampled in 240 groups for each type of vibration signal and sound pressure signal.

3. Implementation Method

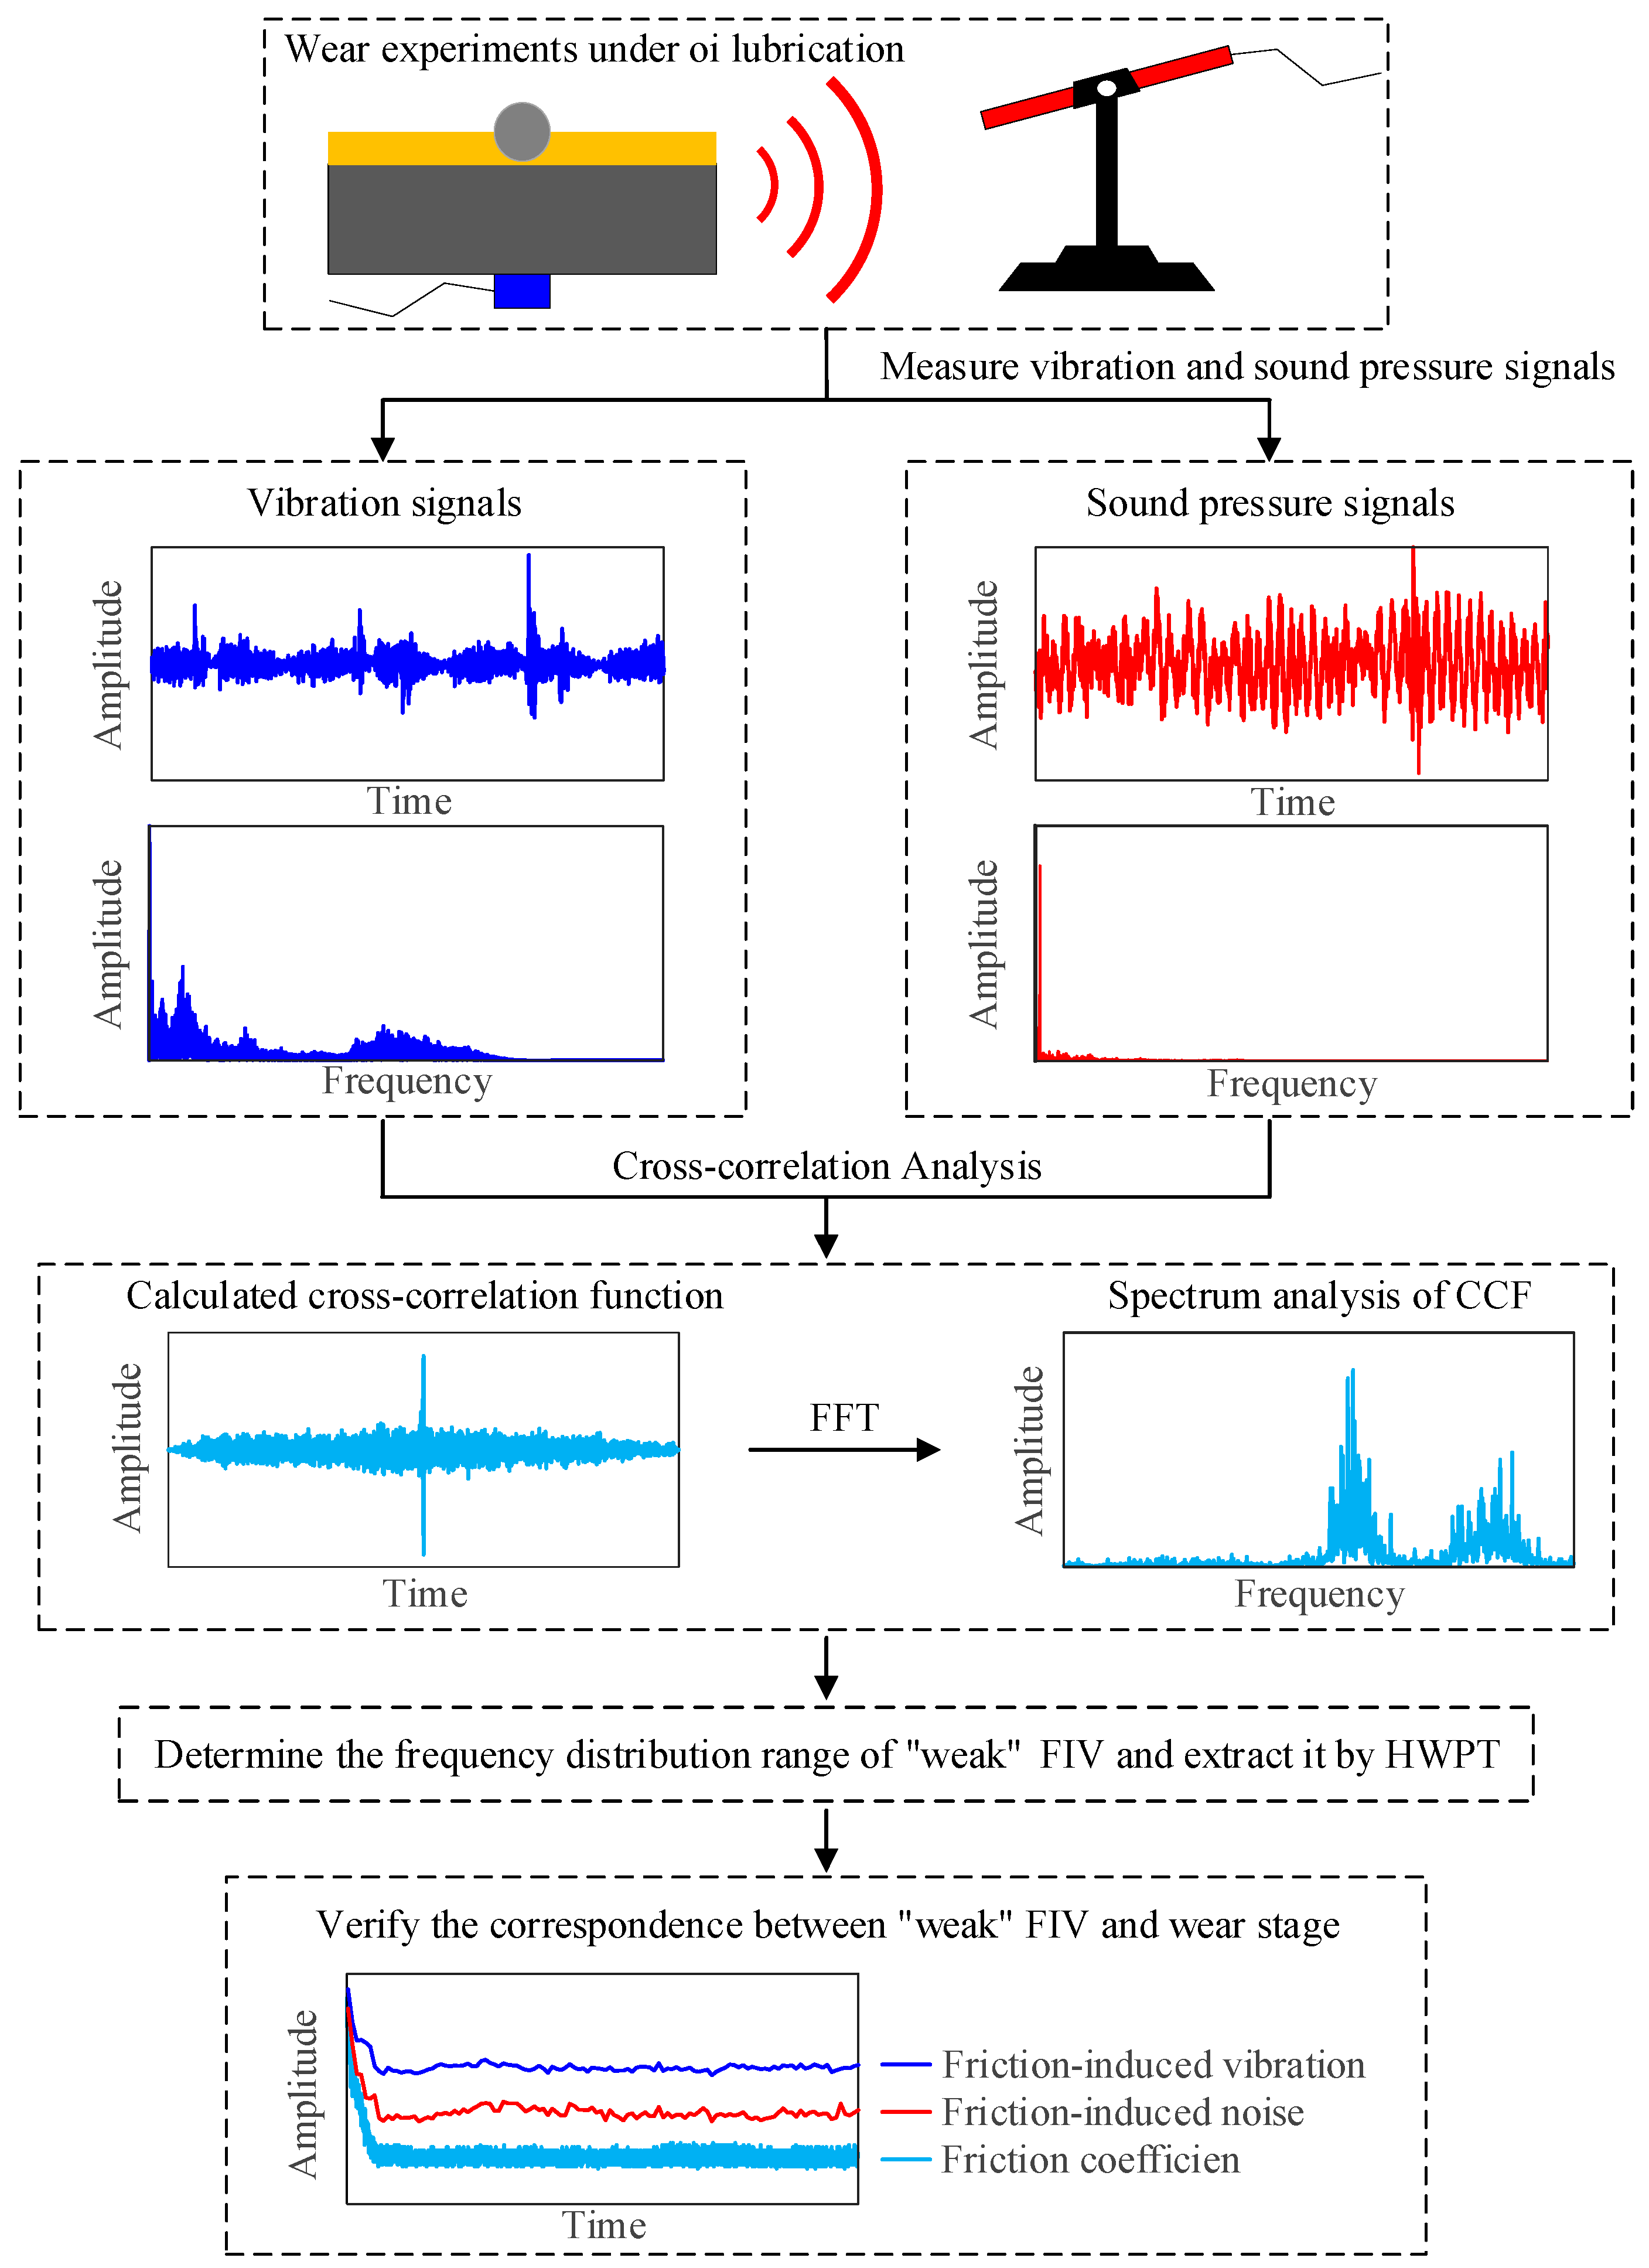
Figure 2 shows the workflow of the proposed method. It involved three steps: cross-correlation analysis (CCA) of the vibration and sound signals, frequency range identification of “weak” FIV, and extraction by HWPT.

3.1. Cross-Correlation Analysis

3.1.1. Cross-Correlation Function

CCA is the most commonly used time-domain detection method in signal processing science and depends on the typical features of the target signals and noise signals in correlation characteristics. It can suppress noise signals and improve the detection sensitivity of the target signals by calculating the cross-correlation function between the target and noise signals. Considering two time series, x(t) and y(t), the cross correlation function (CCF) of the two signals is defined as:
R x y τ = lim T 1 2 T T T y t x t τ d t
where the integration time is infinite and cannot be realized in practical applications. Therefore, when the integration time is finite, Equation (1) can be rewritten as Equation (2).
R ^ x y τ = 1 T 0 T y t x t τ d t
where R ^ x y τ is the estimation value of the R x y τ . Because the integration time is finite, there is always a deviation between the estimated and real values. However, the deviation can be controlled within an allowable range as long as the integration time is sufficiently large. To facilitate computer realization, Equation (2) in the discretization is defined as:
R ^ x y m = 1 N n = 0 N 1 y n x n m , m = 0 , 1 , 2 , N 1
where R ^ x y m is the CCF values of the time series x(n) and y(n); x(n) and y(n) are the time series of the signals x(t) and y(t); t is the integration time; T is the sampling period, t = nT; N is the sampling point in the limited integration time; m is the sequence number of the delay time; τ = mT is the time delay.

3.1.2. Denoise Principle of CCA

The correlation between FIV—especially in the vertical direction—and FIS was excellent [23,24]. Both were poorly correlated with random noise signals. The CCA between the FIV and FIS could attenuate random noise and highlight target signals. The denoising principle of CCA is as follows:
x t = f v t + n t
y t = f n t + v t
where x(t) is the measured vibration signals; fv(t) is the FIV components with periodic noise; n(t) is the random noise; y(t) is the measured sound pressure signals; fn(t) is the FIS components with periodic noise; v(t) is the random noise; t is the signal recording time.
Considering that both v(t) and n(t) were not correlated to fn(t) or fv(t) and v(t) was not correlated to n(t) (which was consistent with most of the actual measurements), the CCF of x(t) and y(t) can be defined as:
R x y τ = E y t x t τ = E [ f n t + v t ] [ f v t τ + n t τ ] = R f n f v τ + R f n n τ + R v f v τ + R v n τ
where R f n f v τ is the CCF of FIV and FIS components with periodic noise; R f n n τ is the CCF of the FIS components with periodic noise fn(t) and random noise n(t); R v f v τ is the CCF of the random noise v(t) and the FIV components with periodic noise fv(t); R v n τ is the CCF of the random noise v(t) and n(t).
Because of the independence and non-correlation between FIV signals, FIS signals, and random noise, the last three terms on the right of Equation (6) should be zero, that is:
R f n n τ = R v f v τ = R v n τ = 0
Thus, the CCF of x(t) and y(t) can be simplified as:
R x y τ = R f n f v τ
Therefore, the CCF of measured vibration and sound pressure signals were obtained, the random noise was denoised, and the target signals were highlighted.

3.2. Determining the Frequency Range of “Weak” FIV

CCA can eliminate the disturbance of random noise. However, owing to the coupling effect of the system dynamics, periodic noise with the same frequency in the vibration and sound pressure signals cannot be denoised, such as the dynamic response of the mechanical parts. Thus, further denoising of the CCF was required to determine the frequency of the FIV. First, the frequency distribution of the CCF was determined by spectrum analysis. Based on the results [25,26], the frequency of “weak” FIV was up to thousands of hertz. Thus, high-frequency components were extracted by HWPT to eliminate the interference of low-frequency noise. Then, the mean value of the frequency amplitude was set as a threshold to determine the frequency range of “weak” FIV, i.e., the frequency whose amplitude exceeded the threshold was considered as the potential “weak” FIV and its distribution characteristics were determined based on the statistical results. Finally, according to the statistical results, the frequency range of “weak” FIV was determined.

3.3. Extraction

HWPT can decompose a signal into an infinite number of signals with different refined frequencies and extract the signal of interest from these signals. Consequently, the FIV and FIS components were extracted from the measured vibration and sound pressure signals by HWPT. Following is a description of the main steps involved in the extraction process.
Firstly, the layer number j of HWPT was determined based on the frequency band detected by the spectrum analysis of CCF between vibration and sound signals. In terms of frequency bandwidth B and layer number j, the correspondence can be expressed as follows:
B = 2 j f h j = 0 , 1 , 2 , 3
where fh represents the highest analysis frequency. The upper and lower limits m and n of the frequency band are defined as follows [27]:
m = s B s = 0 , 1 , 2 2 j 1 n = ( s + 1 ) B
where s is the index of the sub-band.
Further, after determining the frequency range (m, n) of the “weak” FIV, the frequency-domain expression for the harmonic wavelet ψ ^ m , n can be obtained [28]:
ψ ^ m , n [ ( n m ) ω ] = 1 / [ ( n m ) 2 π ]     2 π m ω < 2 π n    0           other
Then, Fourier transform was conducted on the measured signal f(t) to obtain its discrete value in the frequency f ^ ( ω ) . The discrete HWT can be expressed in frequency-domain as follows:
W ^ ( m , n , ω ) = f ^ ( ω ) ψ ¯ ^ m , n [ ( n m ) ω ]
where ψ ¯ ^ m , n [ ( n m ) ω ] is the conjugate of ψ ^ m , n [ ( n m ) ω ] .
By taking the inverse Fourier transform of Equation (12), an equivalent expression of the HWT in the time domain can be expressed as [19]:
W ( m , n , k ) = ( n m ) f ( t ) ψ ¯ m , n t k n m dt
where k is the translation parameter, k/(nm) is the translation step of the harmonic wavelet, ψ m , n is the general expression of harmonic wavelet in the time domain, and ψ ¯ m , n is the conjugate of the ψ m , n .
Finally, the time-domain waveform W(m, n, k) of the “weak” FIV in the detected frequency band (m, n) was obtained by HWPT.

4. Results and Discussion

4.1. Extraction of “Weak” FIV

4.1.1. Spectrum Analysis for CCF of Original Vibration and Sound Pressure Signals

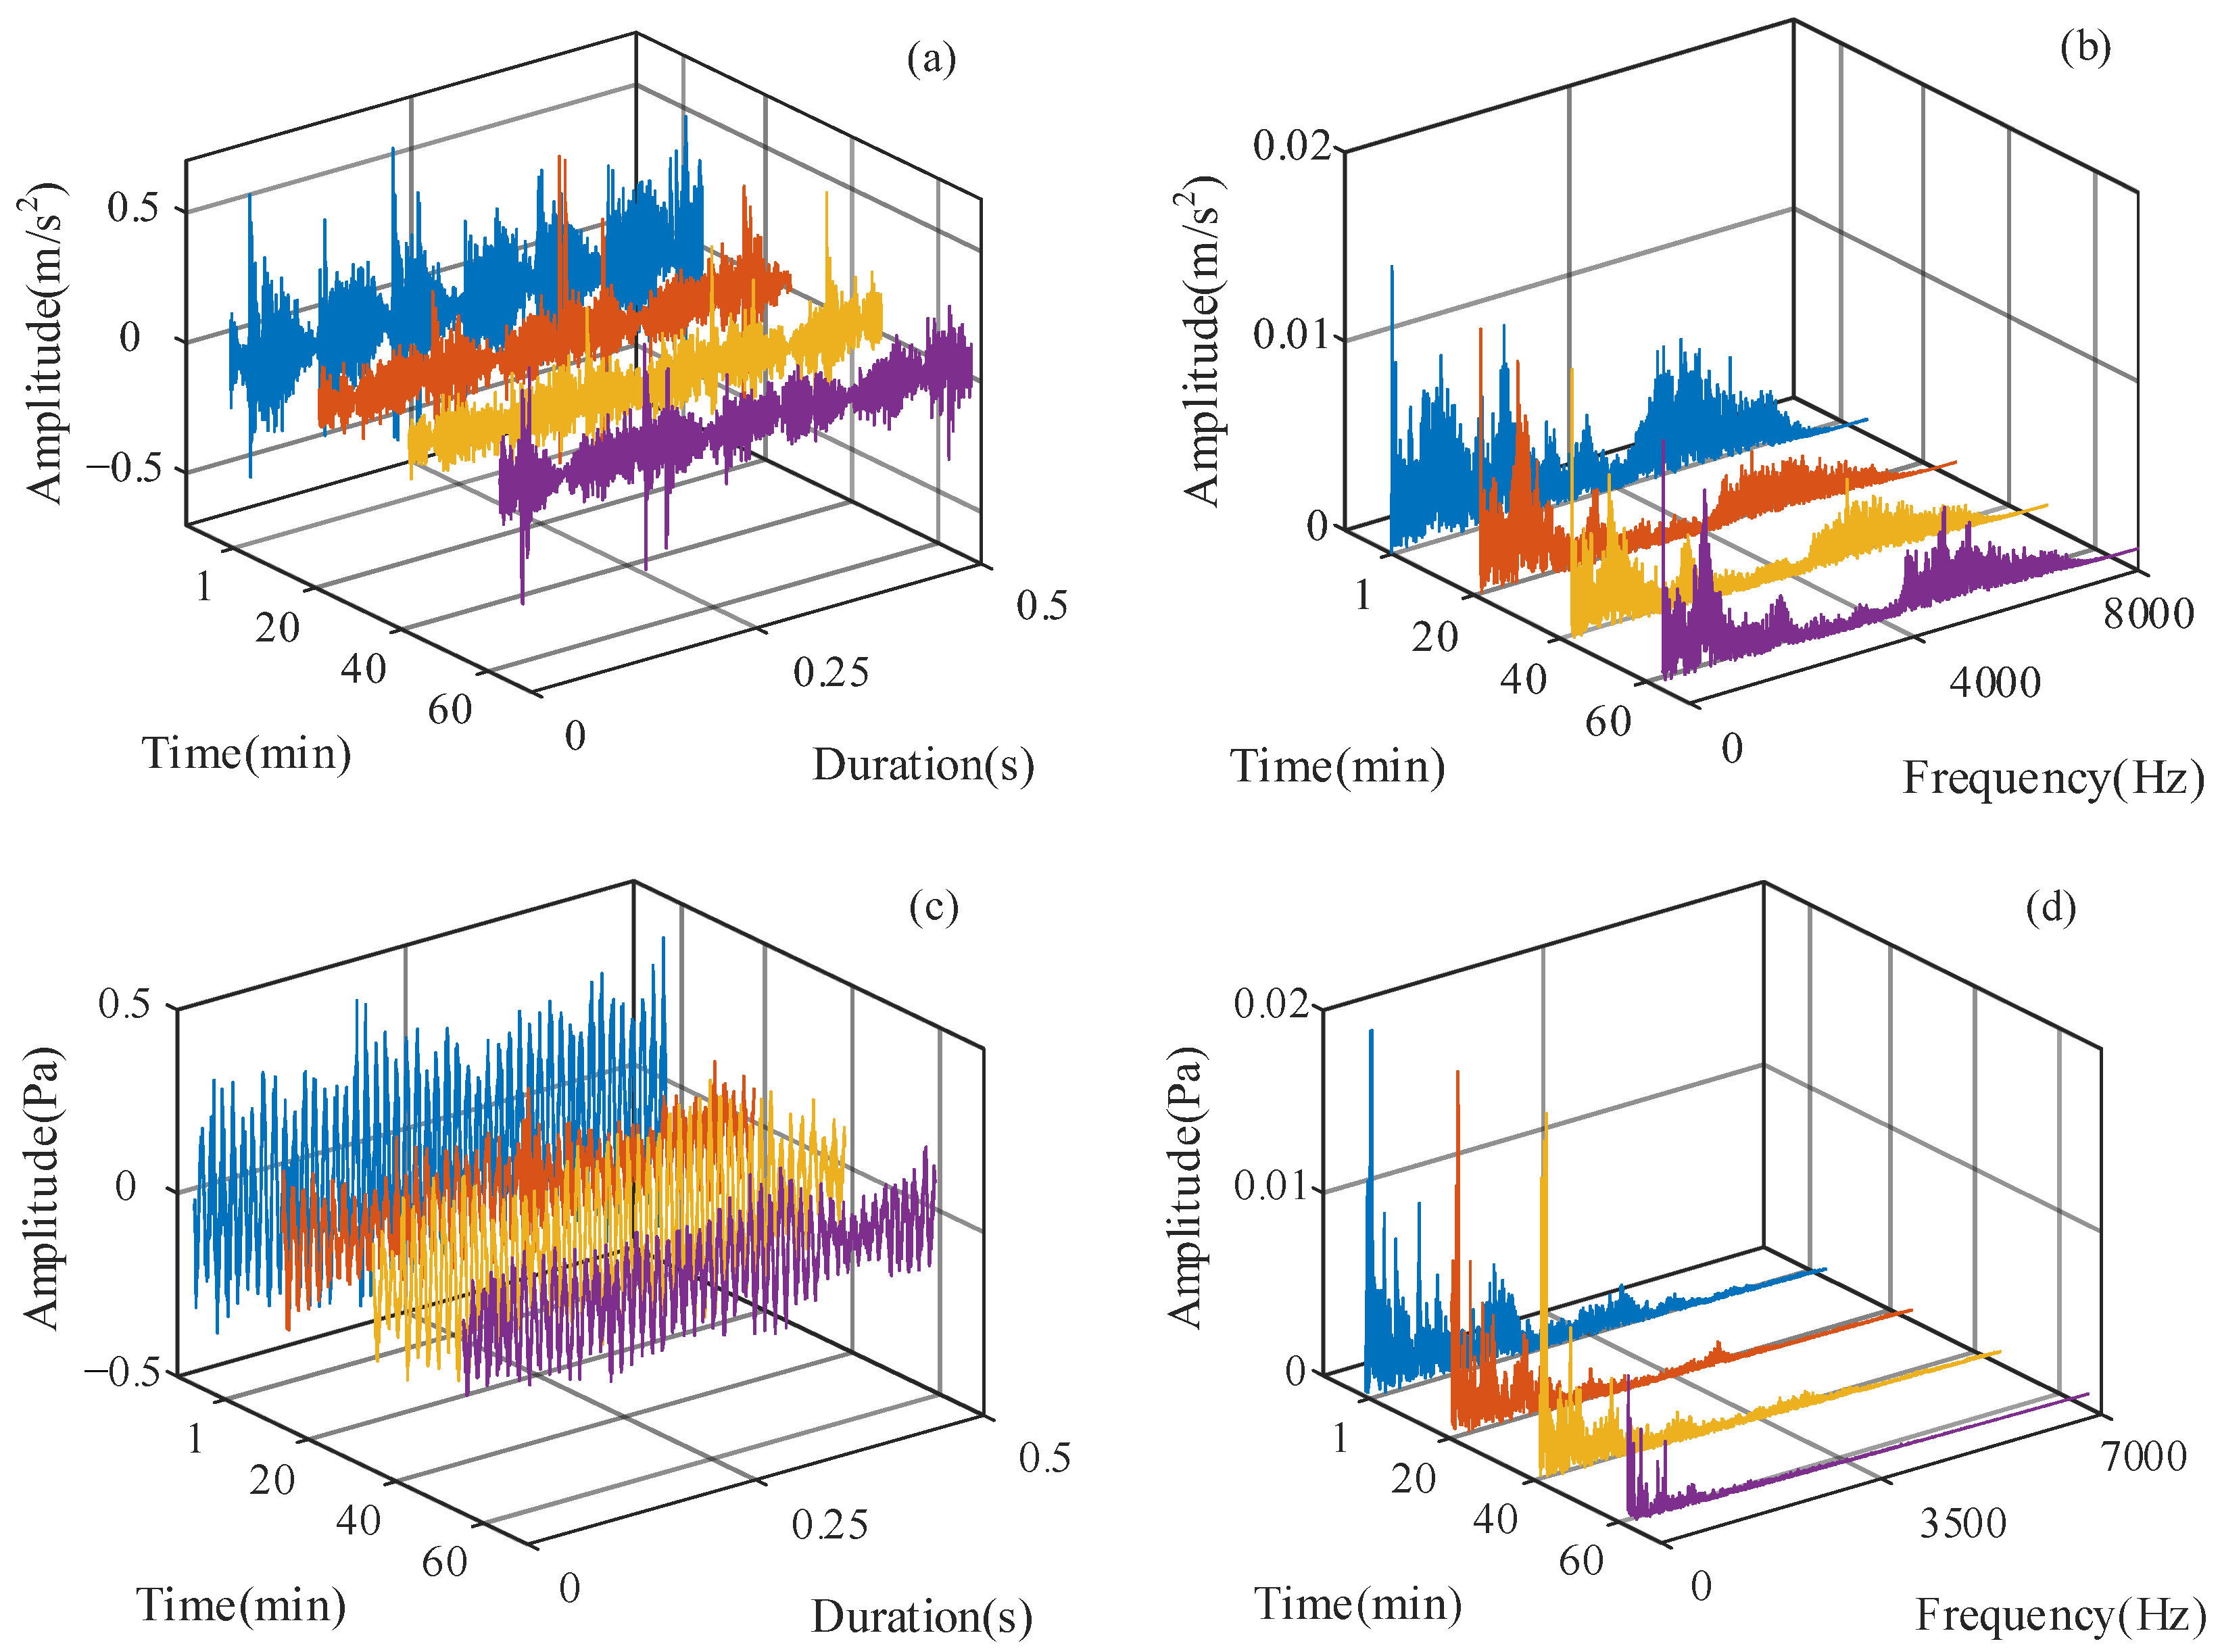
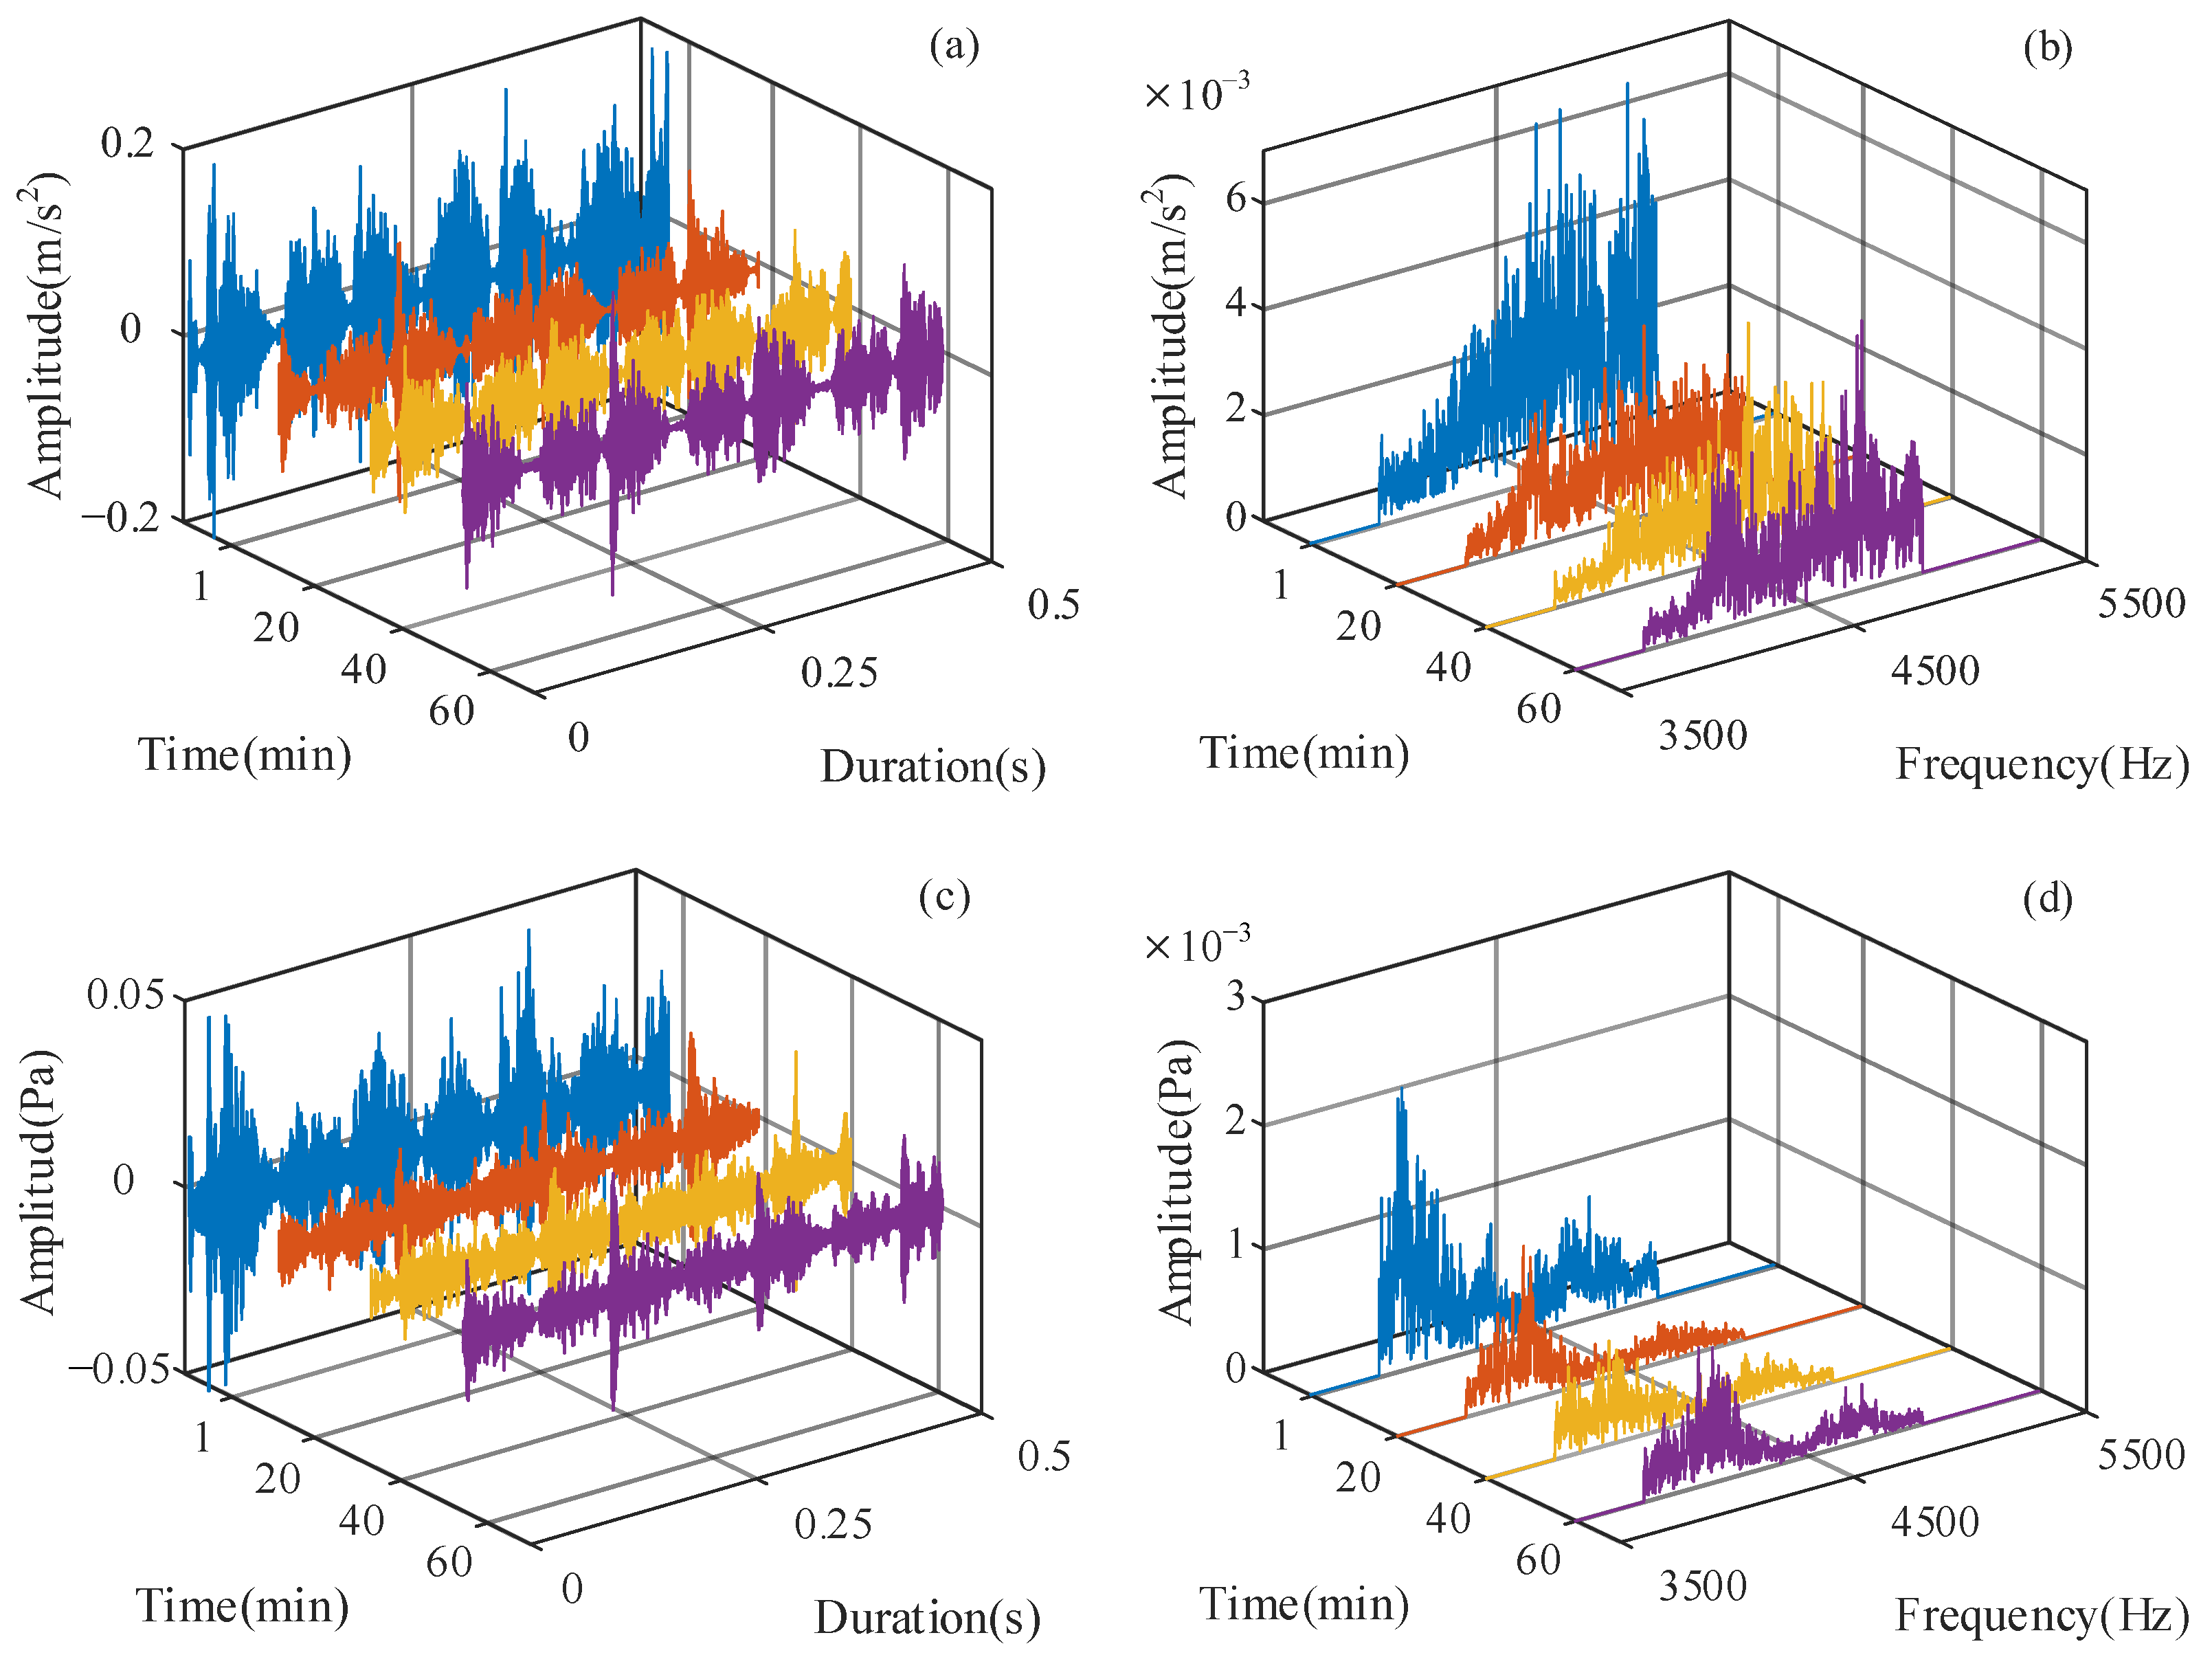
Figure 3 shows the waveform and spectrum of the original vibration and sound pressure signals measured at 1, 20, 40, and 60 min in the wear experiments. It can be observed from Figure 3a,b that the waveform of the original vibration signals was uneven and the energy of the high-frequency part was mainly distributed in the range of 4000–7000 Hz. Unlike the vibration signals, the low-frequency band dominated the spectrum of the sound pressure signals and caused a periodic variation in the waveform, as shown in Figure 3c,d. Meanwhile, the Pearson correlation coefficient was used to describe the correlation between two kinds of signals [21,22]. The Pearson coefficients were −0.03, −0.06, −0.05 and −0.07, respectively, which demonstrated that the original vibration and sound pressure signals were less correlated at each time. Moreover, a negative coefficient indicated a negative correlation, which was inconsistent with the fact that the FIS was strong when the FIV was violent. As a result, the original signals could not represent the FIV and FIS. Therefore, it was necessary to denoise the original vibration and sound pressure signals to identify the correlated components between the two to further detect the “weak” FIV.

4.1.2. Frequency Range Identification

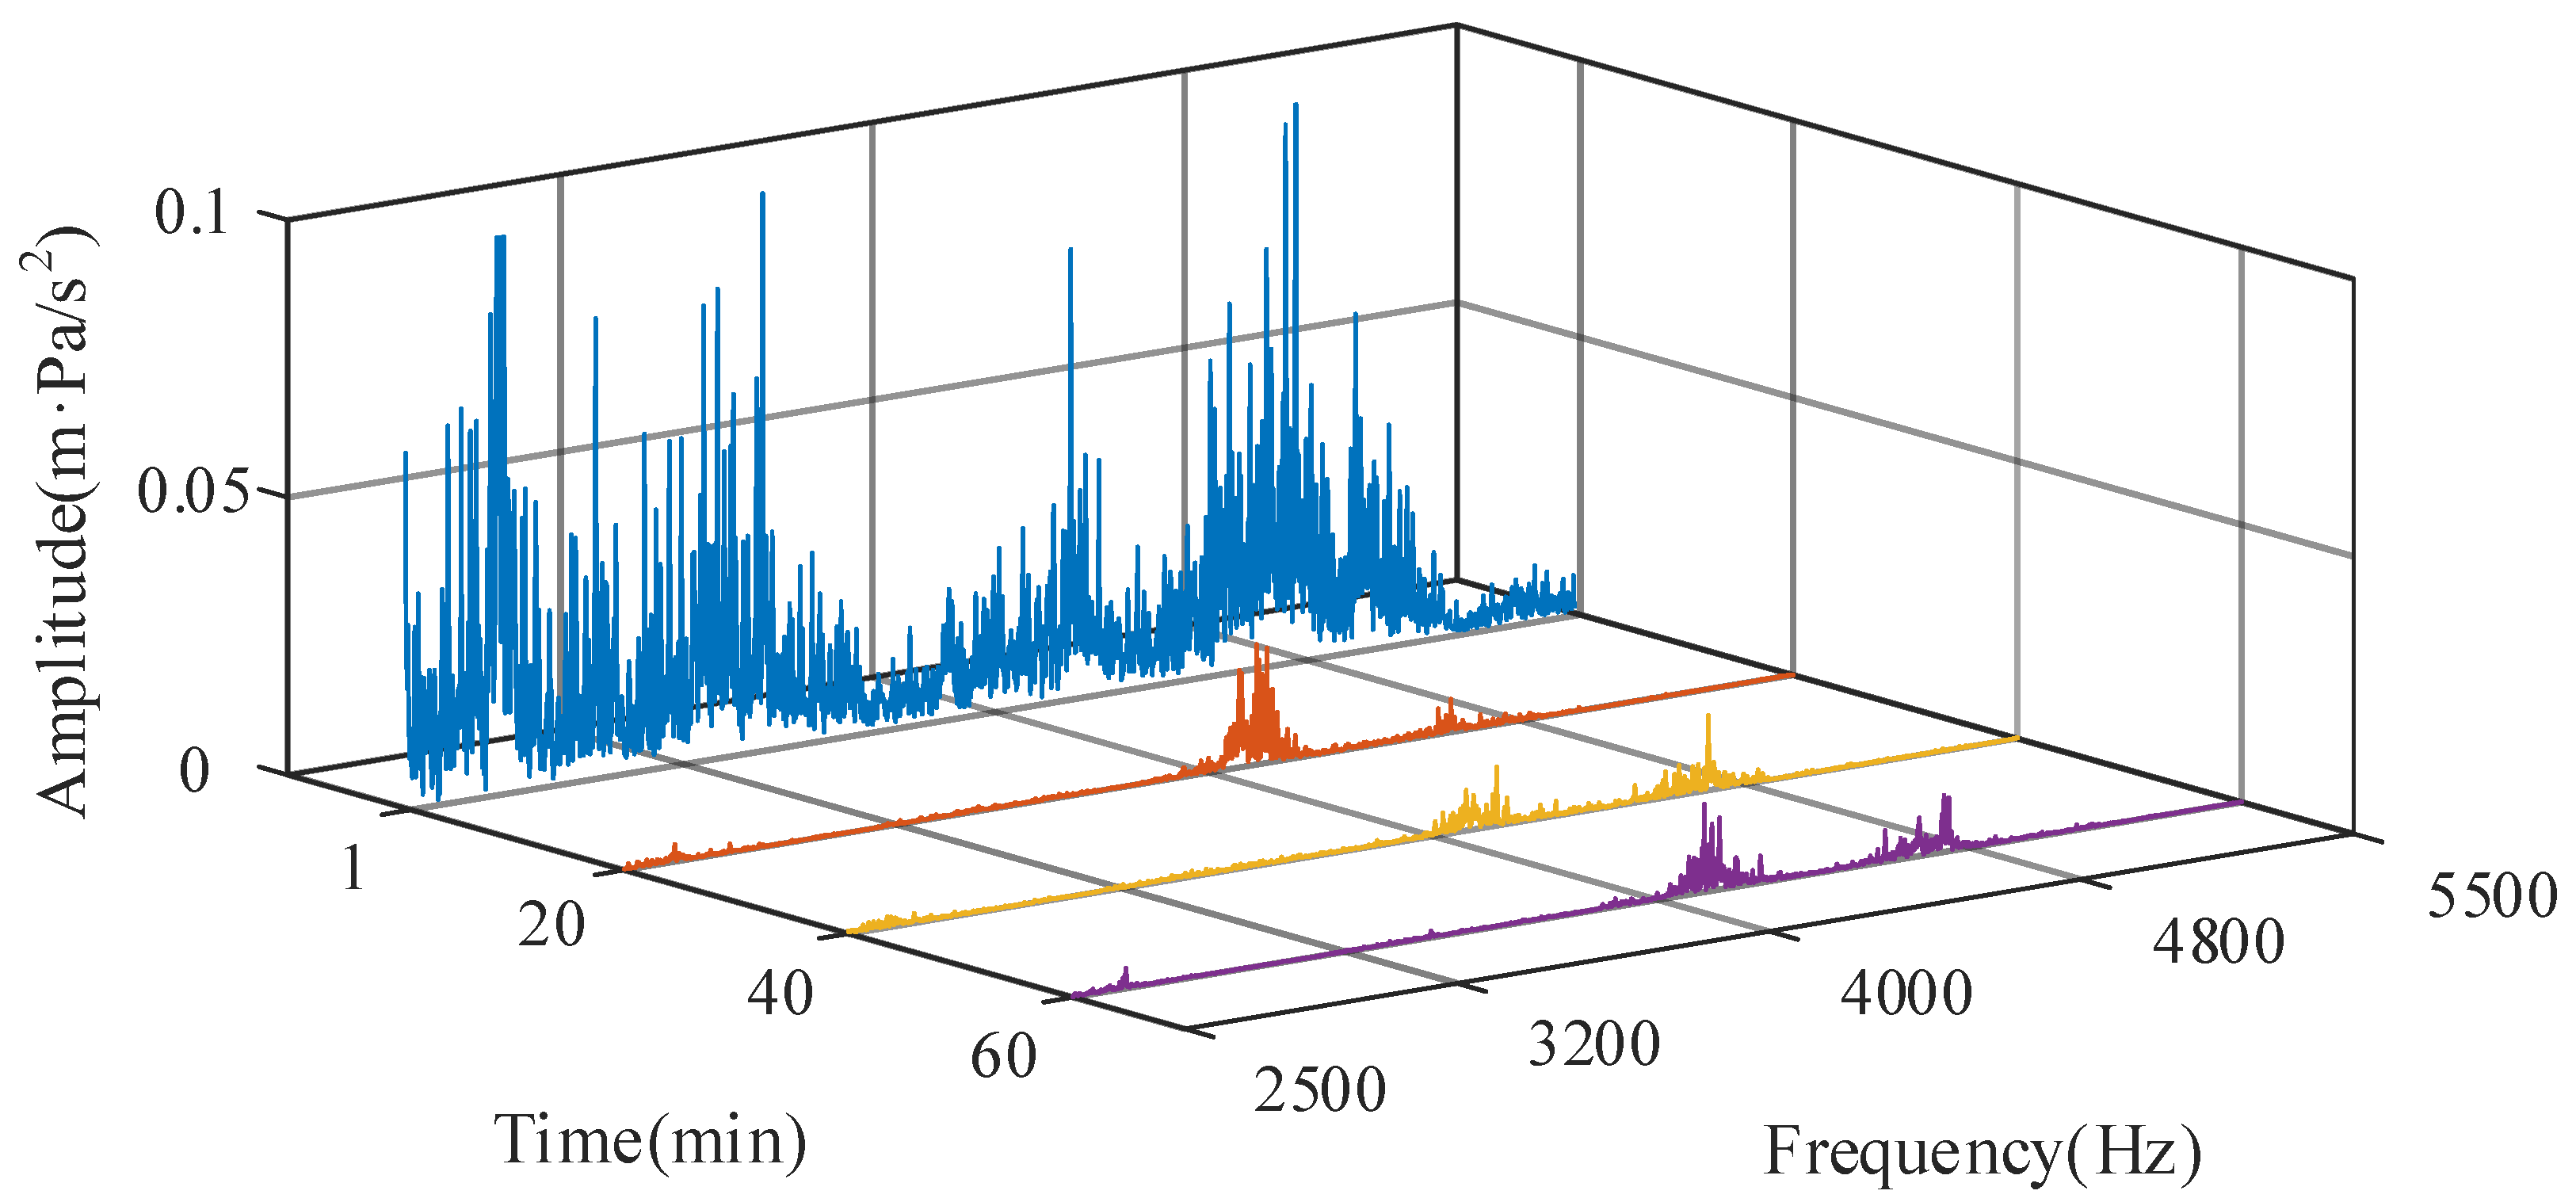
CCA of the vibration and sound pressure signals was conducted to detect the correlated components. Figure 4 shows the spectrum of the CCF calculated from the two types of signals. Considering that the frequency of “weak” FIV was usually up to thousands of hertz, the frequency above 2000 Hz was displayed in the spectrum. As shown in Figure 4, the correlated frequency components of the vibration and sound pressure signals were distributed within 5500 Hz. In addition, owing to the influence of the high-value spectral line lumped at approximately 2000 Hz, its sideband frequency also had a large amplitude. Thus, the frequency band of 2500–6000 Hz was set as the preliminary target and extracted by HWPT.
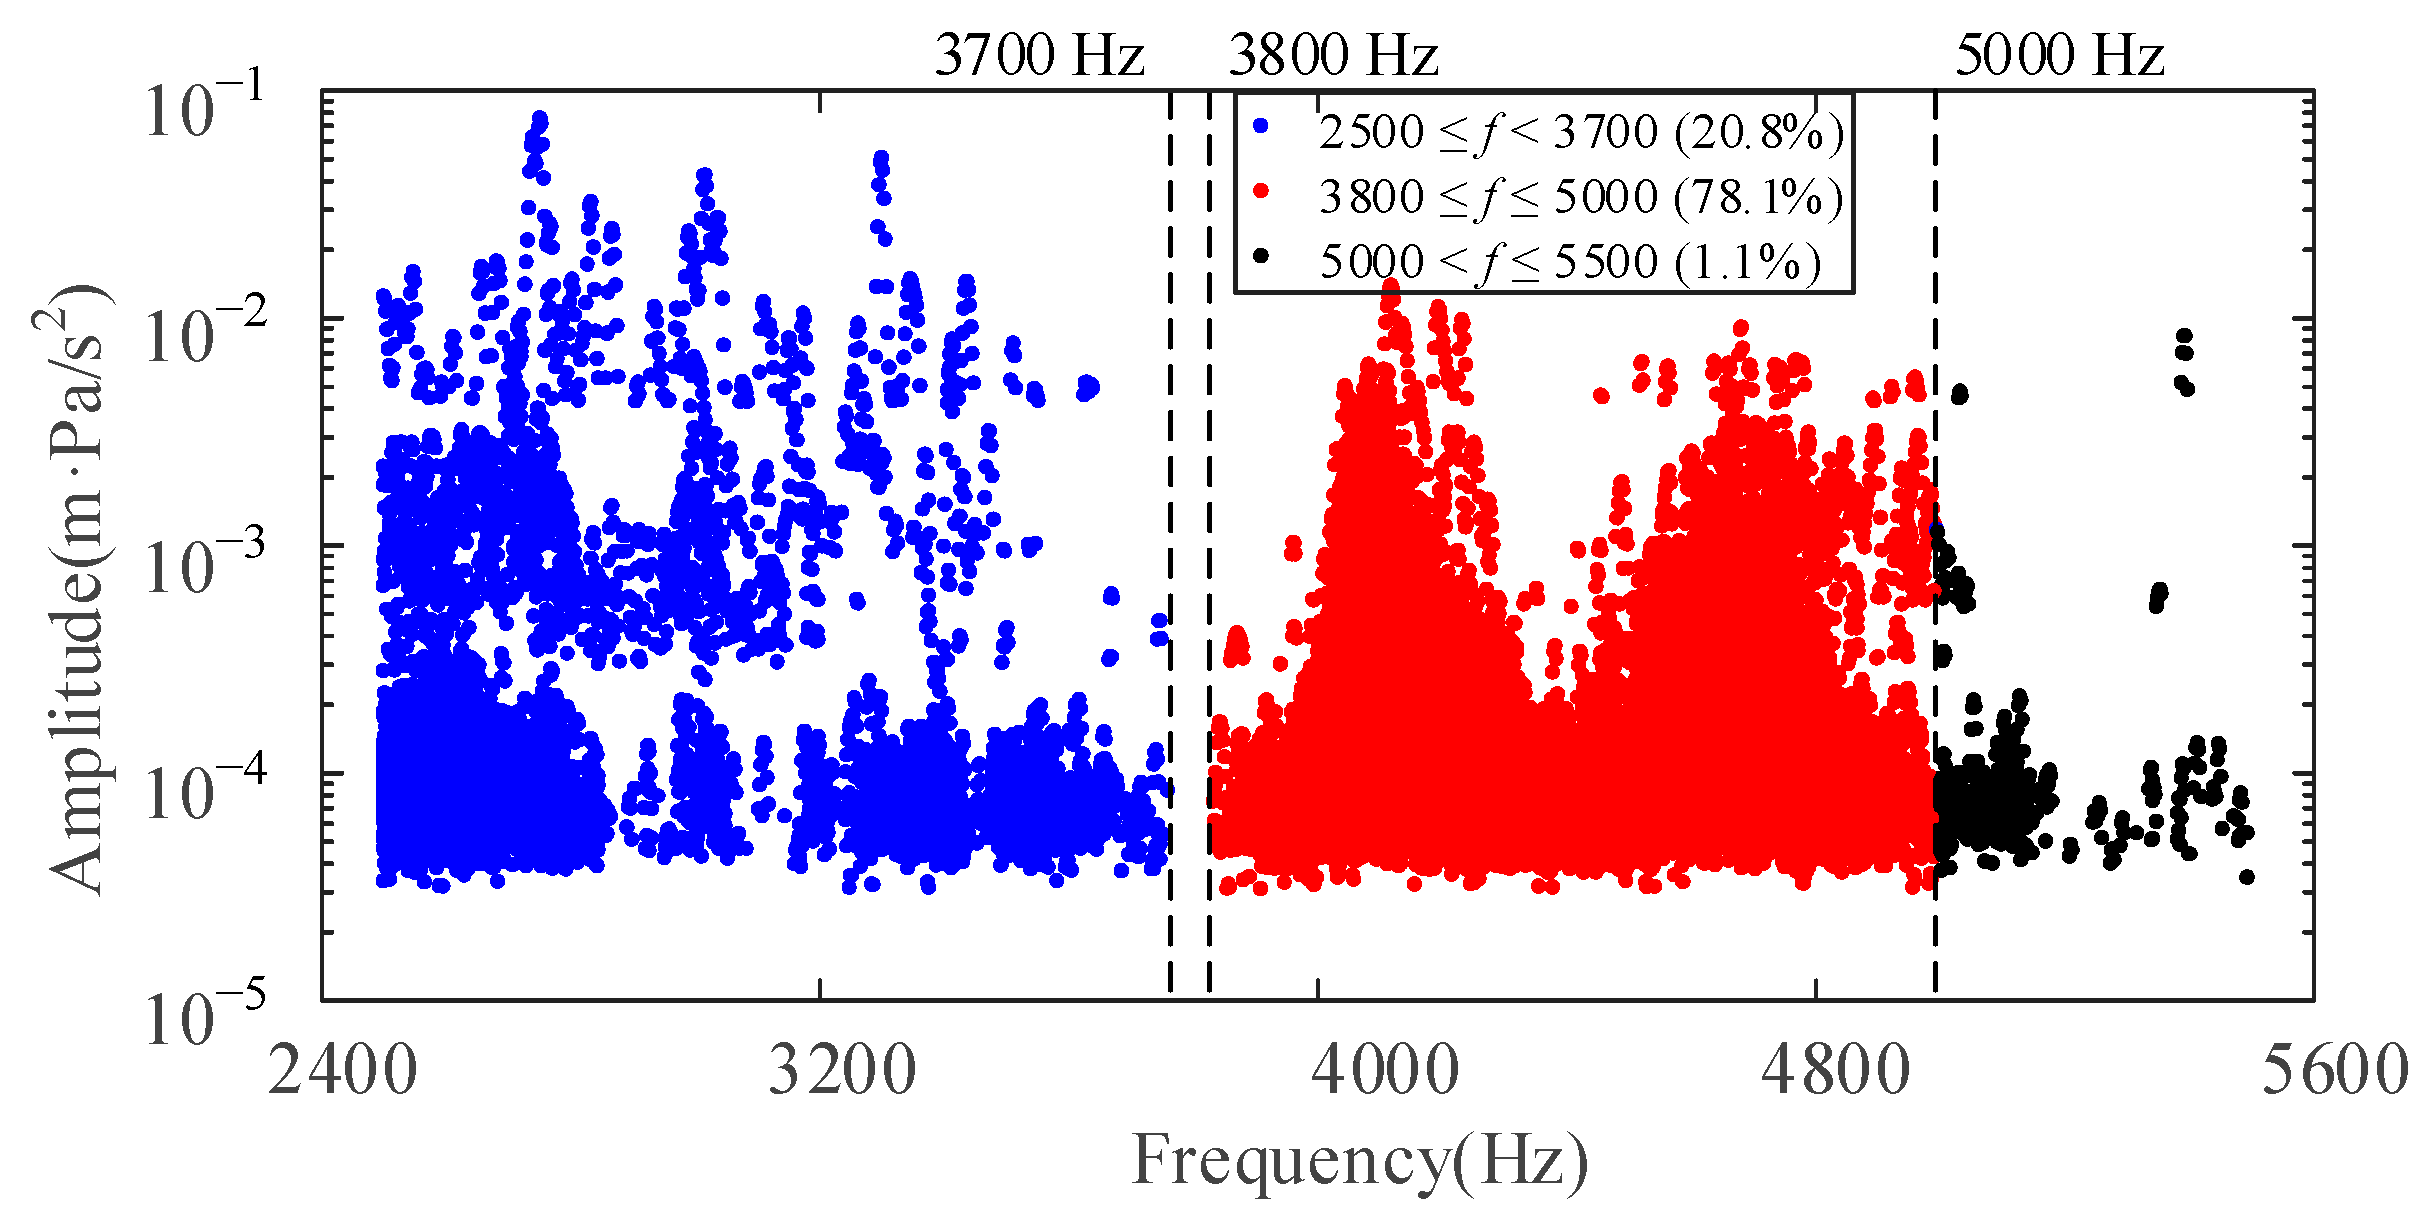
The mean value of the frequency amplitude from 2500 to 6000 Hz was set as a threshold to determine the frequency distribution of “weak” FIV, i.e., the frequency whose amplitude exceeded the threshold was considered the potential “weak” FIV. Figure 5 shows the statistical results. It was evident that the frequency whose amplitude was higher than the threshold was mainly distributed in two prominent frequency bands: 2500–3700 Hz and 3800–5000 Hz. The proportion of the points in the above frequency band to the entire measured data was calculated to further judge the frequency range of the “weak” FIV. Because the ratio was as high as 78.1% (far larger than the others), the frequency band of 3800–5000 Hz was considered the dominant component of the “weak” FIV in the experiment. The frequency domain of the original signals was decomposed into 256 adjacent bands using an eight-layer HWPT. Continuous bands numbered 96–125 were selected to reconstruct the target frequency components.
The time-domain waveforms and spectra of the extracted signals are shown in Figure 6. It can be seen that the extracted signals had uneven amplitudes and continuous spectra, which was consistent with the characteristics of the “weak” FIV [10]. Meanwhile, the Pearson cross-correlation coefficients were 0.60, 0.47, 0.46, and 0.46, respectively, which demonstrated that the extracted vibration and sound pressure signals had a high correlation at each time. Moreover, a positive coefficient indicated that the extracted vibration and sound pressure signals had a positive correlation. Consequently, the high-correlated frequency components submerged in original vibration and sound pressure signals could be detected and extracted by using CCA and HWPT.

4.2. Variation of the “Weak” FIV Signals

The FIV signals provided information that reflected the variation in the wear state of tribological pairs. As a result, the detected FIV signals could be explained by the change in the wear state of the tribological pairs. By analyzing the friction coefficient, the variation of the wear state of tribological pairs was investigated. Accordingly, the variation of detected FIV signals were examined under different wear states of tribological pairs.

4.2.1. Wear State Change Analysis

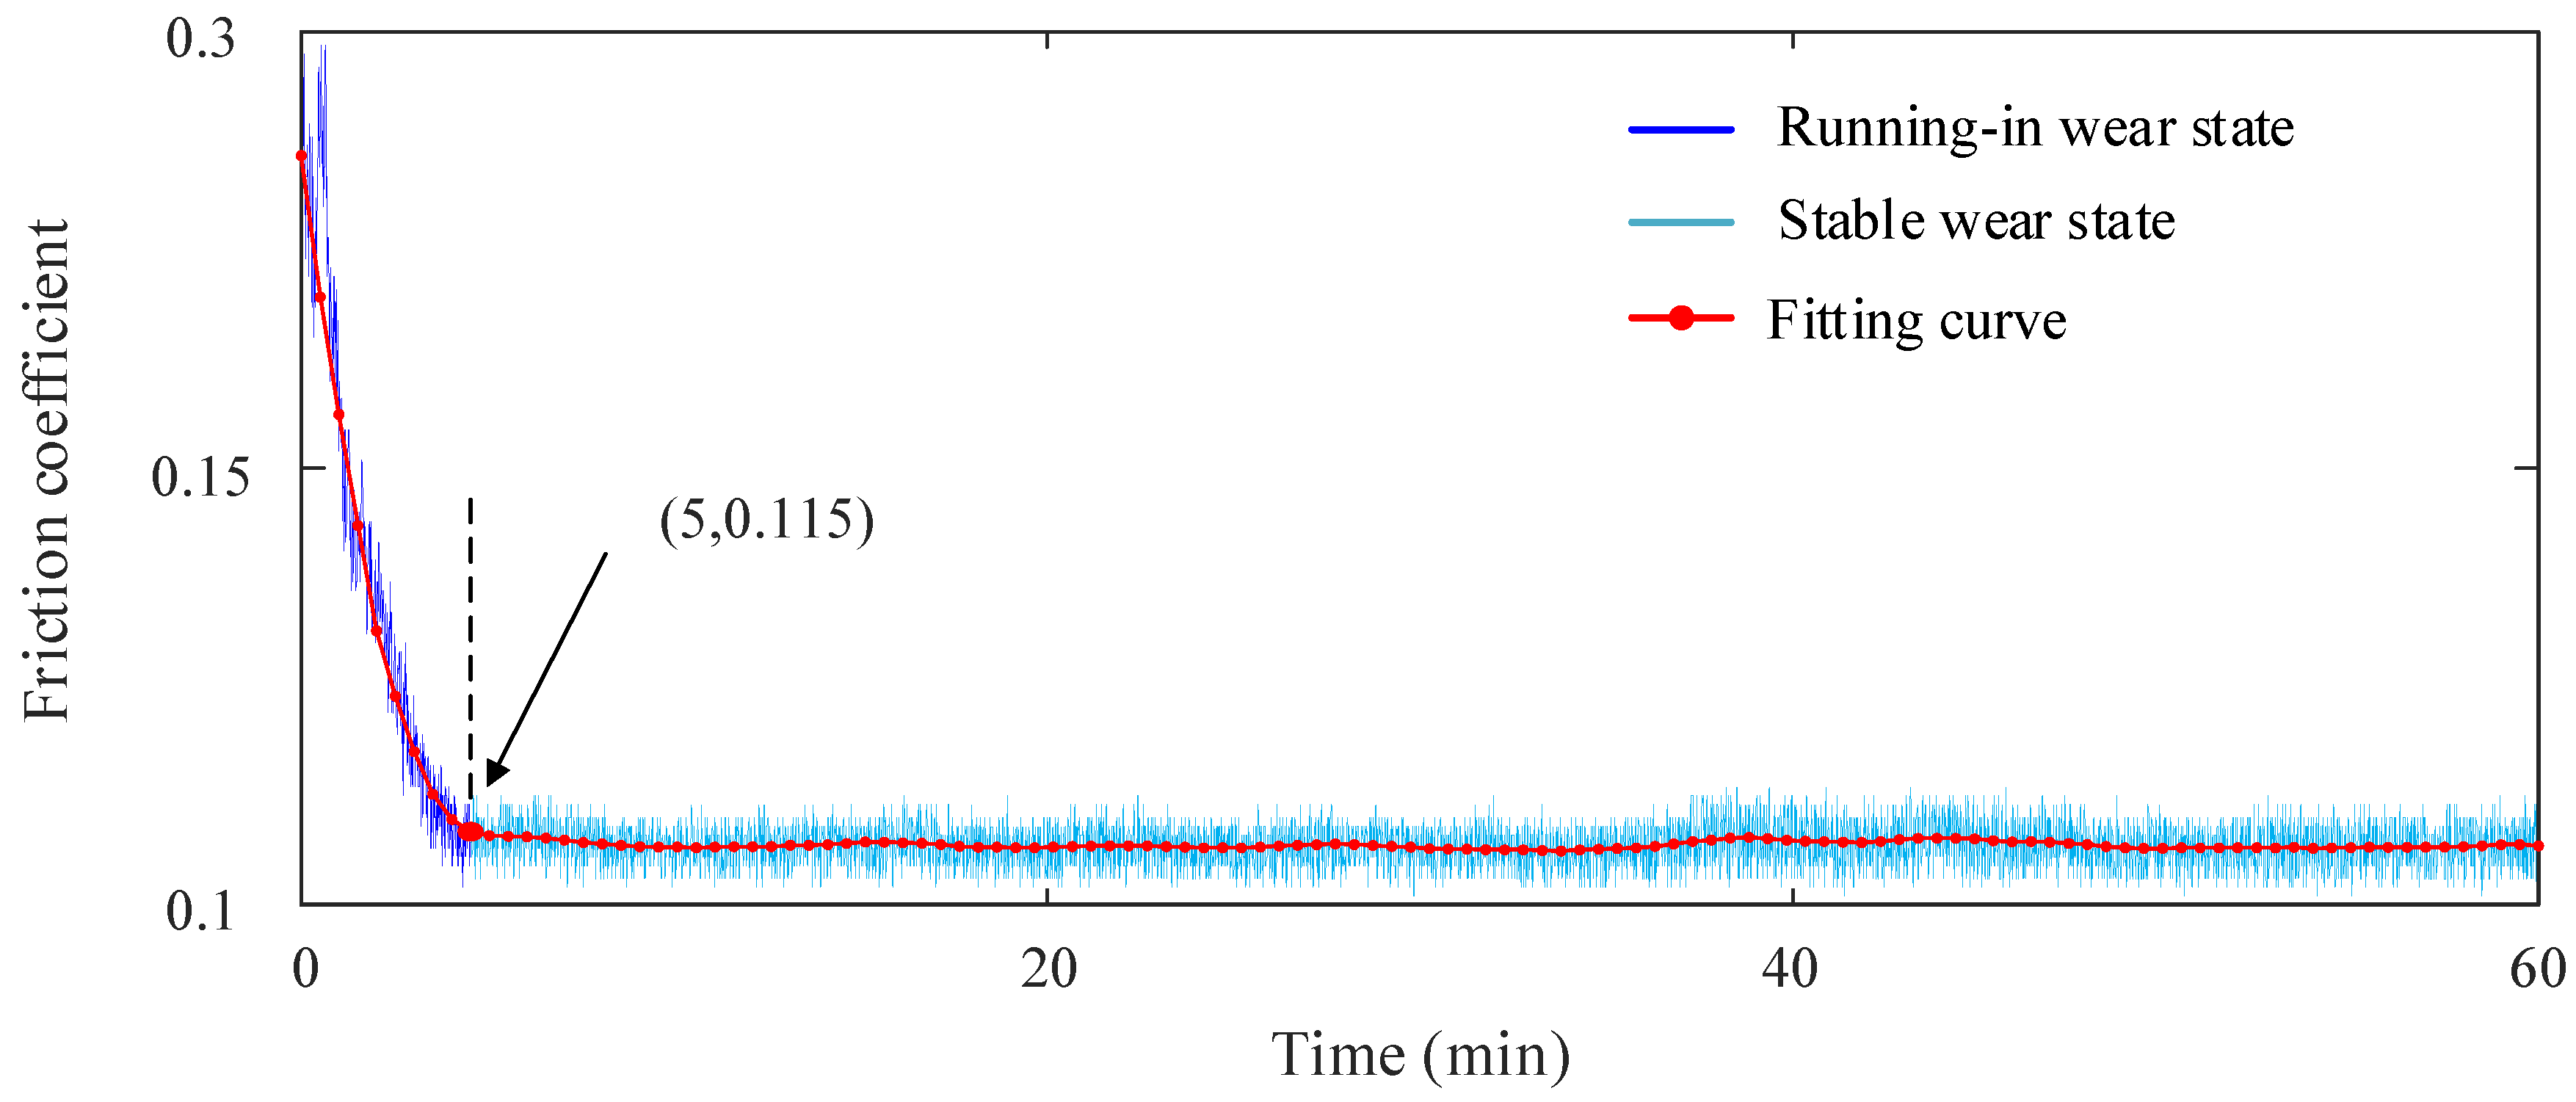
Figure 7 depicts the change in the friction coefficient during the wear test. The average value of the friction coefficient was calculated every half minute and taken as the representative of the corresponding time to obtain the fitting curve. The fit curve showed that the friction coefficient was approximately 0.272 initially, decreased to 0.115 rapidly in five minutes, and then fluctuated smoothly during the remainder of the test.
According to references [29,30,31], the friction coefficient commonly varied with the wear process and was related to the wear stages and the initial wear process with an upward or downward trend of the friction coefficient could be regarded as the running-in wear stage. While the friction coefficient became stable, the friction pair entered a stable wear stage. When the friction coefficient increased suddenly and sharply, severe wear was indicated. Therefore, the wear process in this study can be divided into two distinct stages: the running-in stage and the stable wear stage, as shown in Figure 7.

4.2.2. Change of the Extracted “Weak” FIV

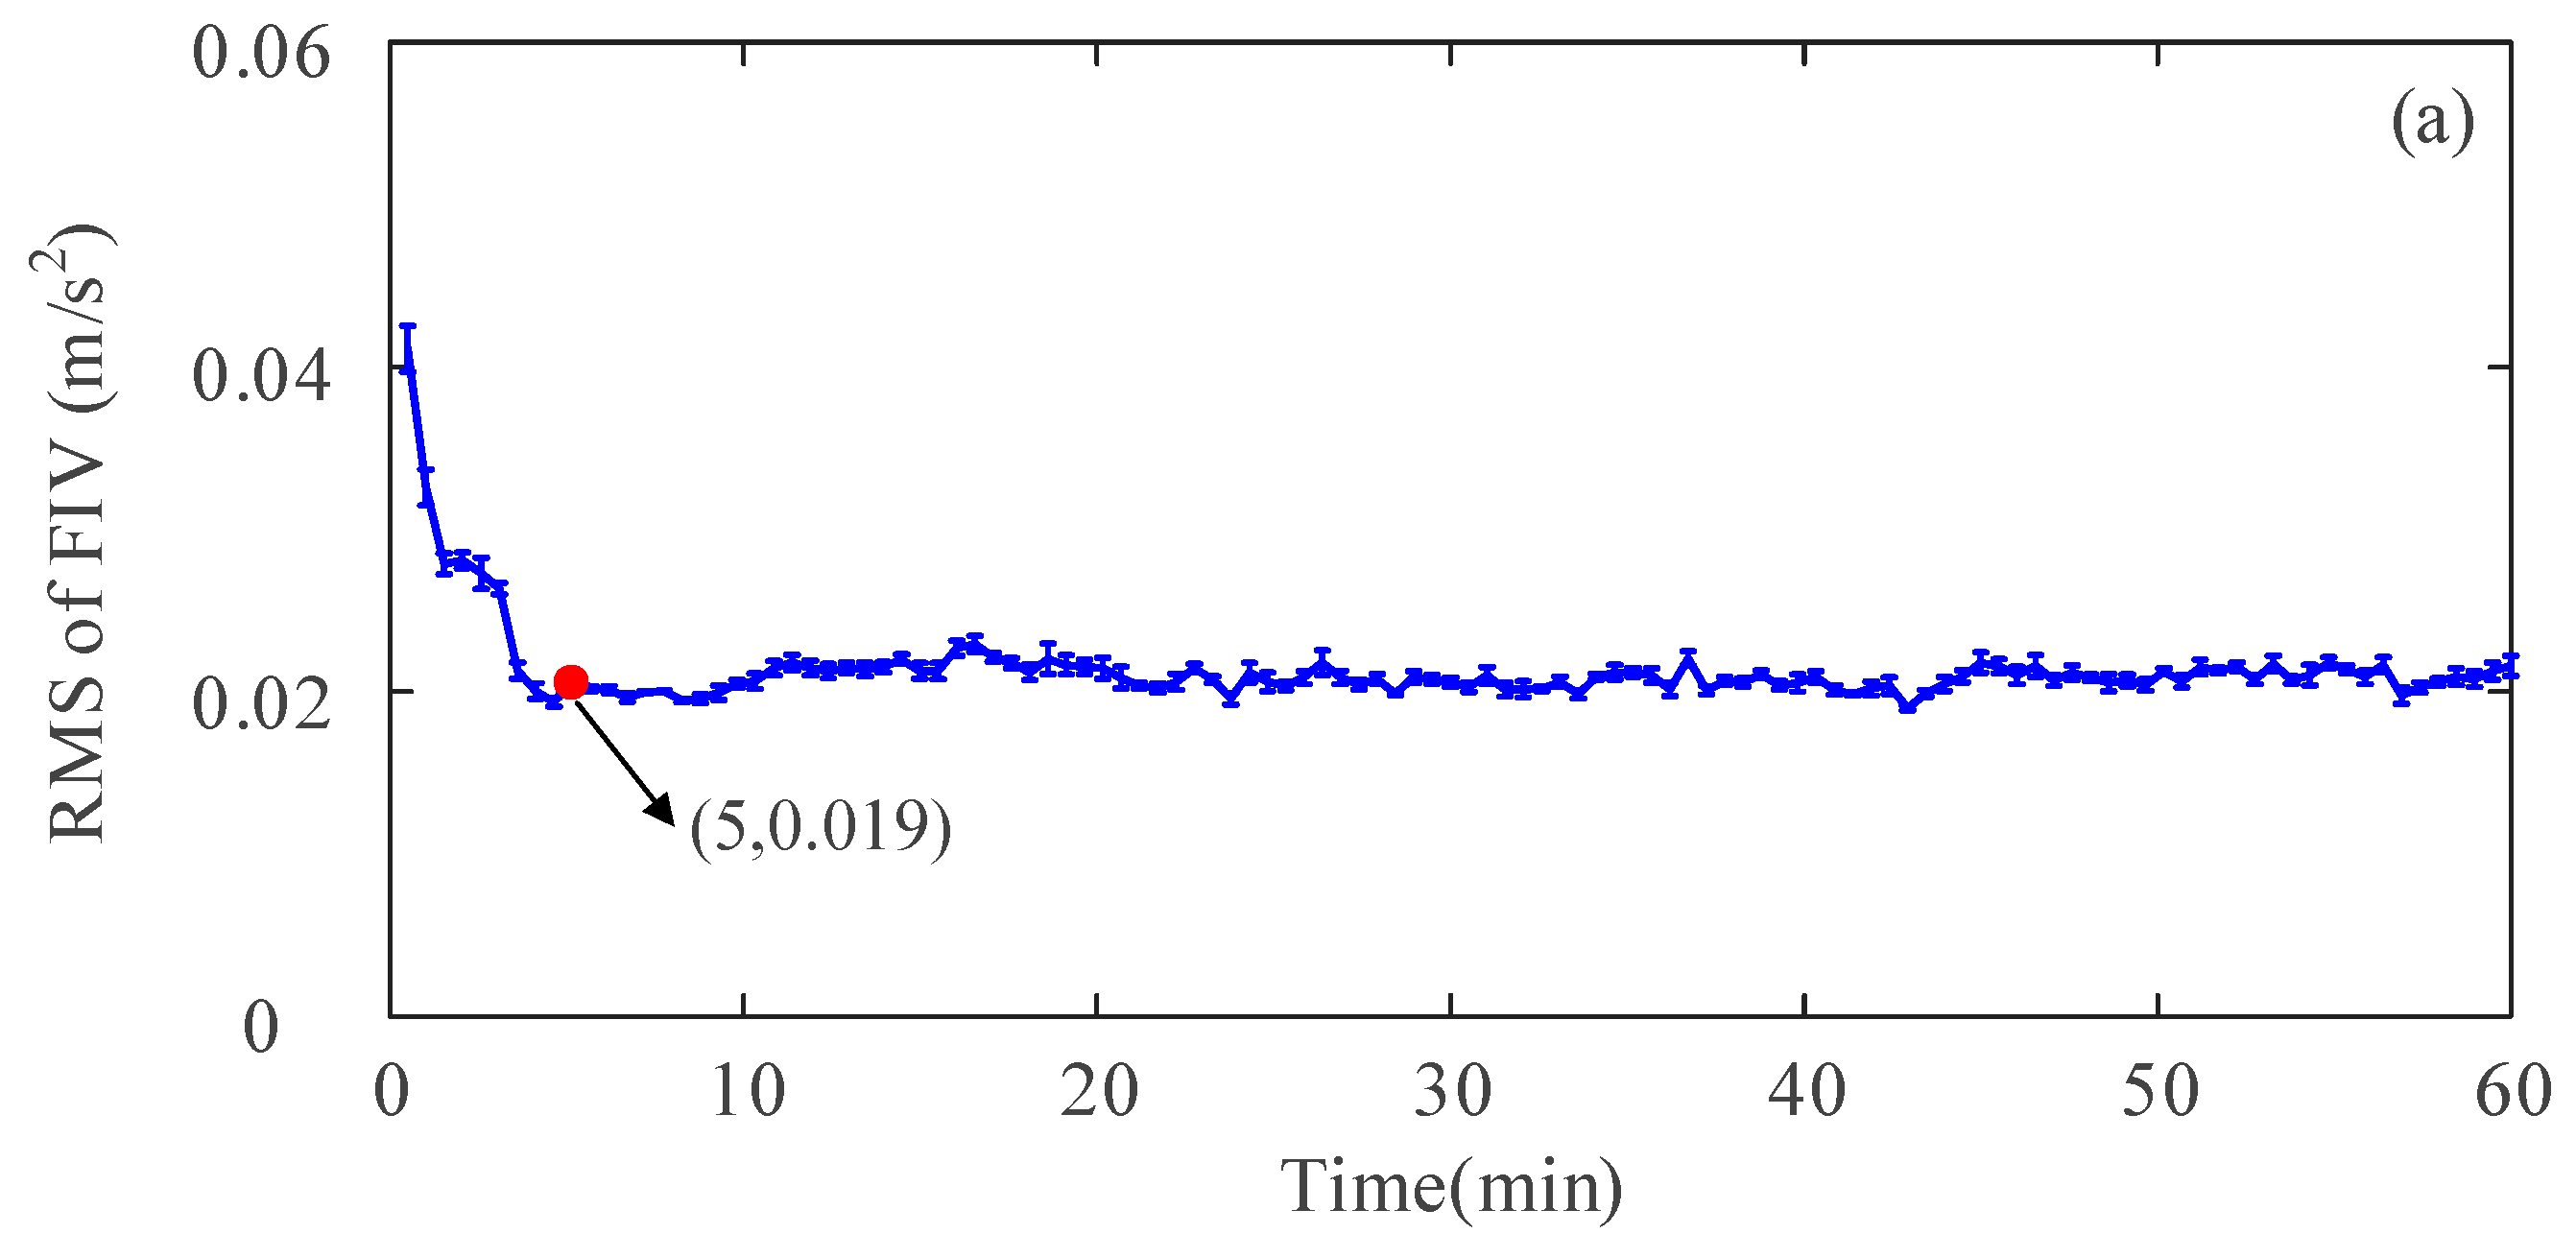
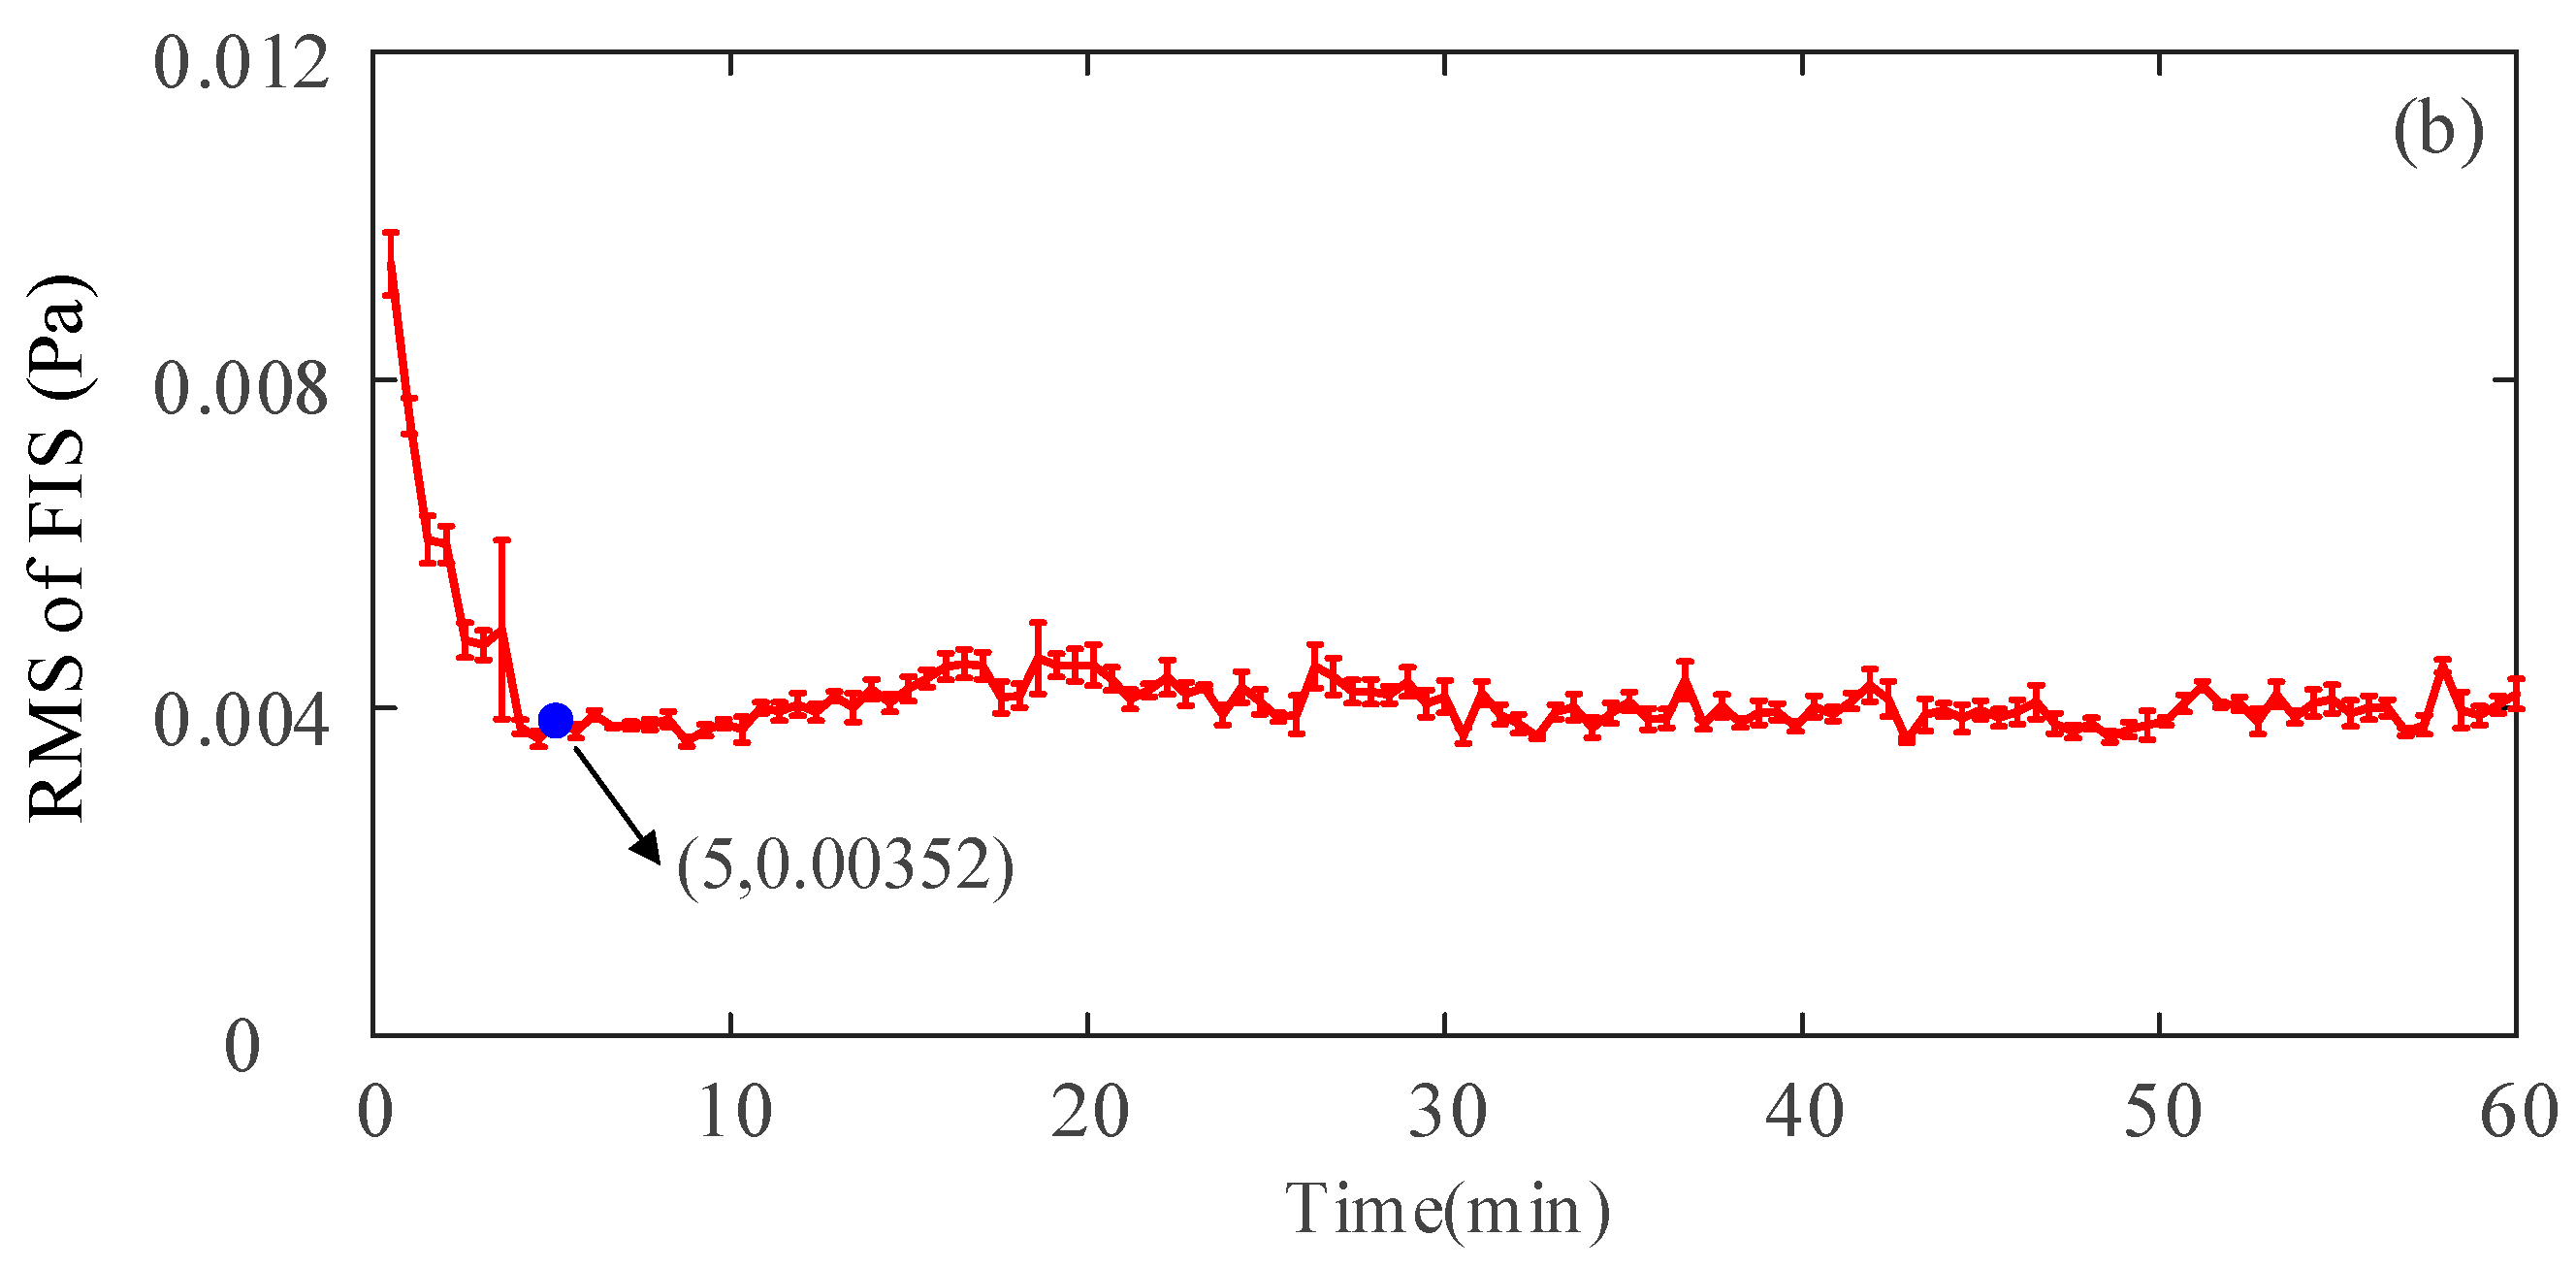
The characteristics of the FIV components in the vibration and sound pressure signals were studied using the RMS. Figure 8 shows the RMS change in the extracted “weak” FIV. The RMS change of the “weak” FIV signals had two distinct stages in the complete wear process, consistent with that of the friction coefficient. The first five minutes could be considered as the first stage, when the RMS of the extracted “weak” FIV signals evolved from high to low. With the reduction of the “weak” FIV, the energy radiated in the form of sound energy. Consequently, the RMS of the extracted “weak” FIS signals displayed the same trend in the first stage. A powerful “weak” FIV usually indicated severe wear; a feeble one indicated mild wear [16,17,18,19]. Therefore, the RMS changes in the FIV and FIS signals both indicated that the wear behavior between the friction pair gradually shifted from severe to mild in the first stage, which was consistent with the results of the friction coefficient analysis. Approximately 5 min later, the friction pair entered the stable wear stage and the RMS of the extracted “weak” FIV and FIS developed in the second stage. One feature was that the two RMS values fluctuated smoothly around 0.019 m/s2 and 0.00352 Pa, respectively, which were obviously less than their initial values, implying that the “weak” FIV and FIS became feeble and steady. Therefore, the friction pairs developed into a stable wear stage and their wear behavior was mild and stable in the second stage.
The RMS variation of the extracted “weak” FIV signals was consistent with the friction coefficient change and could characterize the wear stage transition of the friction pairs. Therefore, the “weak” FIV components submerged in the original signals could be detected by the CCA between the vibration and sound pressure signals. Moreover, compared with the traditional method, which was based on the change in the friction coefficient and cross-correlation coefficient, the present implementation was efficient without presumptions and repeated tentative calculations.

5. Conclusions

The ball–disk wear experiments were performed under oil lubrication using a wear tester. The vibration and sound pressure signals were measured during the experiments. By the spectrum analysis of CCF calculated from the two types of signals, the “weak” FIV components submerged in the original signals were detected. Then, the “weak” FIV components were extracted using HWPT. The following conclusions were drawn:
(1) The “weak” FIV components submerged in the original vibration and sound pressure signals could be identified by spectrum analysis of the CCF calculated from the two types of original signals.
(2) The RMS change of the “weak” FIV components extracted from the vibration and sound pressure signals was highly consistent with the friction coefficient change. It could effectively characterize the transition of the wear stage from running-in to stable wear of the friction pairs.
By analyzing the CCF of measured vibrations and sound pressure signals in spectral form, the method proposed here directly identified the frequency distribution of “weak” FIV, thereby eliminating the need for extensive iterative calculations, unlike methods based on cross-correlation coefficients, friction coefficients, etc.
In the future, real friction pairs will be used in bench-scale experiments in order to validate the efficacy of the proposed methodology in this study, such as cylinder liner–piston rings, sliding bearings, rolling bearings, etc. Additionally, the FIV propagated both tangentially and normally. Despite this, this study focused solely on the normal vibrations, disregarding tangential vibrations or stick–slip motions. Further research is needed to better understand the correlation between FIV signals and friction-induced sound pressure signals during wear.

Author Contributions

Conceptualization, G.L., T.L. and H.Z.; data curation, Y.Z.; formal analysis, P.X., Y.Z. and Y.S.; funding acquisition, G.L., P.X. and T.L.; investigation, T.L., H.G. and H.Z.; methodology, G.L.; software, Y.Z., P.X., H.G. and Y.S.; supervision, G.L.; visualization, P.X.; writing—original draft, P.X. and Y.Z.; writing—review and editing, G.L. and P.X. All authors have read and agreed to the published version of the manuscript.

Funding

This research was funded by the Fundamental Research Funds for the Central Universities grant number 3132022222, the National Natural Science Foundation of China grant number 51879020, and the high-level talent innovation support program youth science and technology star project grant number 2021RQ133.

Institutional Review Board Statement

Not applicable.

Informed Consent Statement

Not applicable.

Data Availability Statement

The data presented in this study are available on request from the corresponding author.

Acknowledgments

We appreciate each of the anonymous reviewers for their valuable comments and suggestions for improving the quality of this paper.

Conflicts of Interest

The authors have no relevant financial or non-financial interests to disclose.

Appendix A. The Original Images of the Experimental Setup

Figure A1 shows the original images of the experimental setup. It depicts that an acceleration sensor is mounted on the lower surface of the cylindrical specimen to measure the vibration signals during the wear test. The sound pressure signals are measured using a microphone fixed 30 mm from the center of the friction pairs.
Figure A1. The original images of the experimental setup.
Applsci 13 07468 g0a1

Appendix B. The Basic Parameters of the Accelerometer and Microphone

Table A1 shows the basic parameters of the ICP tri-axial accelerometer type PCB-356A24.
Table A1. Basic parameters of the tri-axial accelerometer.
NameParameters
Sensitivity10.0 mv/g
Frequency response±0.5~12,000.0 Hz
Measuring range±500 g pk
Resolution0.002 g rms
Temperature range−54~+121 °C
Weight3.1 g
Table A2 shows the basic parameters of the microphone type GRAS.40PP.
Table A2. Basic parameters of the microphone.
NameParameters
Frequency range10.0~20.0 kHz
Setting sensitivity@250 Hz9.0 Pa
Output resistance<50 Ω
Temperature range, operation−10~50 °C
Temperature range, storage14~122 °C
Weight5.5 g

References

  1. Wen, S.Z.; Huang, P. Principles of Tribology; Tsinghua University Press: Beijing, China, 2008. [Google Scholar]
  2. Holmberg, K.; Kivikytö-Reponen, P.; Härkisaari, P.; Valtonen, K.; Erdemir, A. Global energy consumption due to friction and wear in the mining industry. Tribol. Int. 2017, 115, 116–139. [Google Scholar] [CrossRef]
  3. Luo, Y.-K.; Zhou, L.; Ni, Y.-Q. Towards the understanding of wheel-rail flange squeal: In-situ experiment and genuine 3D profile-enhanced transient modelling. Mech. Syst. Signal Process. 2022, 180, 109455. [Google Scholar] [CrossRef]
  4. Qin, H.; Yang, C.; Zhu, H.; Li, X.; Li, Z.; Xu, X. Experimental analysis on friction-induced vibration of water-lubricated bearings in a submarine propulsion system. Ocean. Eng. 2020, 203, 107239. [Google Scholar]
  5. Stender, M.; Oberst, S.; Tiedemann, M.; Hoffmann, N. Complex machine dynamics: Systematic recurrence quantification analysis of disk brake vibration data. Nonlinear Dyn. 2019, 97, 2483–2497. [Google Scholar] [CrossRef]
  6. Li, D.; Cao, H.; Chen, X. Active control of milling chatter considering the coupling effect of spindle-tool and workpiece systems. Mech. Syst. Signal Process. 2022, 169, 108769. [Google Scholar] [CrossRef]
  7. Adnan, A. Acoustics of friction. J. Acoust. Soc. Am. 2002, 111, 1525–1548. [Google Scholar]
  8. Na, T.T.; Haur, H.J.; Lin, H.Y. Correlation between tribological and vibration behaviors in sliding lubricated contacts. J. Tribol. 2022, 144, 111603. [Google Scholar]
  9. Stender, M.; Tiedemann, M.; Hoffmann, L.; Hoffmann, N. Determining growth rates of instabilities from time-series vibration data: Methods and applications for brake squeal. Mech. Syst. Signal Process. 2019, 129, 250–264. [Google Scholar] [CrossRef]
  10. Abdelounis, H.B.; Bot, A.L.; Liaudet, J.P.; Zahouani, H. An experimental study on roughness noise of dry rough flat surfaces. Wear 2009, 268, 335–345. [Google Scholar] [CrossRef]
  11. Seong, Y.; Lee, D.; Yeom, J.; Park, J. The Feature Extraction through Wavelet Coefficients of Metal Friction Noise for Adhesive and Abrasive Wear Monitoring. Appl. Sci. 2021, 11, 3755. [Google Scholar] [CrossRef]
  12. Xu, C.; Wu, T.; Yang, H.; Wu, H.; Kwok, N. Study on vibration mechanism induced by skidding in pure rolling contact. Tribol. Int. 2021, 154, 106669. [Google Scholar] [CrossRef]
  13. Lacerra, G.; Di Bartolomeo, M.; Milana, S.; Baillet, L.; Chatelet, E.; Massi, F. Validation of a new frictional law for simulating friction-induced vibrations of rough surfaces. Tribol. Int. 2018, 121, 468–480. [Google Scholar] [CrossRef]
  14. Sun, D.; Li, G.; Wei, H.; Liao, H. Experimental study on the chaotic attractor evolvement of the friction vibration in a running-in process. Tribol. Int. 2015, 88, 290–297. [Google Scholar] [CrossRef]
  15. Ding, C.; Zhu, H.; Sun, G.; Zhou, Y.; Zuo, X. Chaotic characteristics and attractor evolution of friction noise during friction process. Friction 2017, 6, 47–61. [Google Scholar] [CrossRef] [Green Version]
  16. Ding, C.; Zhu, H.; Jiang, Y.; Sun, G.; Wei, C. Recursive Characteristics of a Running-in Attractor in a Ring-on-Disk Tribosystem. J. Tribol. 2019, 141, 011604. [Google Scholar] [CrossRef]
  17. Li, J.; Wei, H.; Fan, L.; Wei, L. Multifractal Detrended Fluctuation Analysis of Frictional Vibration Signals in the Running-in Wear Process. Tribol. Lett. 2017, 65, 50. [Google Scholar] [CrossRef]
  18. Chen, J.; Tang, L.; Ding, X.; Si, J.; Chen, D.; Sun, B. Frictional Vibration Performances of Dry Gas Seal Rings with DLC Film Textured Surface via Chaos Theory. Tribol. Trans. 2021, 64, 667–678. [Google Scholar] [CrossRef]
  19. Xu, C.; Li, B.; Wu, T. Wear characterization under sliding-rolling contact using friction-induced vibration features. Proc. Inst. Mech. Eng. Part J J. Eng. Tribol. 2022, 236, 634–647. [Google Scholar] [CrossRef]
  20. Di Bartolomeo, M.; Lacerra, G.; Baillet, L.; Chatelet, E.; Massi, F. Parametrical experimental and numerical analysis on friction-induced vibrations by a simple frictional system. Tribol. Int. 2017, 112, 47–57. [Google Scholar] [CrossRef]
  21. Liu, T.; Li, G.; Wei, H.; Sun, D. Experimental observation of cross correlation between tangential friction vibration and normal friction vibration in a running-in process. Tribol. Int. 2016, 97, 77–88. [Google Scholar] [CrossRef]
  22. Yu, H.; Wei, H.; Zhou, D.; Li, J.; Liu, H. Reconstruction and information entropy analysis of frictional vibration signals in running-in progress. Ind. Lubr. Tribol. 2021, 73, 937–944. [Google Scholar] [CrossRef]
  23. Mai, Y.; Liu, Z.; Wang, S.; Dong, B. Experimental Investigation into Friction-induced Squeal of Rotating-sliding Friction. China Mech. Eng. 2017, 28, 2198–2203, 2208. [Google Scholar]
  24. Mo, J.; Wang, Z.; Chen, G.; Shao, T.; Zhu, M.; Zhou, Z. The effect of groove-textured surface on friction and wear and friction-induced vibration and noise. Wear 2013, 301, 671–681. [Google Scholar] [CrossRef]
  25. Wernitz, B.; Hoffmann, N. Recurrence analysis and phase space reconstruction of irregular vibration in friction brakes: Signatures of chaos in steady sliding. J. Sound Vib. 2012, 331, 3887–3896. [Google Scholar] [CrossRef]
  26. Dong, C.; Mo, J.; Yuan, C.; Bai, X.; Tian, Y. Vibration and Noise Behaviors during Stick–Slip Friction. Tribol. Lett. 2019, 67, 103. [Google Scholar] [CrossRef]
  27. Sun, X.-Y.; Wang, Z.-Y.; Kang, F.-N.; Li, W.-F. Method of rock bolts parameters detection based on harmonic wavelet packet transform. In Proceedings of the International Conference on Machine Learning and Cybernetics (ICMLC), Guangzhou, China, 12–15 July 2015; Volume 2. [Google Scholar]
  28. Huang, H.; Xue, W.; Pang, Q. Separation method of rolling bearing compound fault characteristics based on Improved harmonic wavelet packet decomposition and fast ICA. J. Mech. Sci. Technol. 2022, 36, 3263–3276. [Google Scholar] [CrossRef]
  29. Liu, T.; Li, G.; Wei, H.; Xing, P. Stability analysis of tribosystem based on the energy feature of friction vibration. J. Tribol. 2017, 139, 051604. [Google Scholar] [CrossRef]
  30. Sun, G.; Zhu, H. Characteristic parameter extraction of running-in attractors based on phase trajectory and grey relation analysis. Nonlinear Dyn. 2019, 95, 3115–3126. [Google Scholar] [CrossRef]
  31. Peng, M.; Zhou, Y.; Zuo, X. Application of recurrence dynamic analysis to running-in state recognition. Ind. Lubr. Tribol. 2021, 73, 756–764. [Google Scholar] [CrossRef]
Figure 1. Schematic diagram of the apparatus and friction pair: (a) wear tester rig and (b) friction pair.
Applsci 13 07468 g001
Figure 2. Workflow of the proposed method.
Applsci 13 07468 g002
Figure 3. Time-frequency characteristics of the original signals: (a) waveform of the vibration signals, (b) spectrum of the vibration signals, (c) waveform of the sound pressure signals, and (d) spectrum of the sound pressure signals.
Applsci 13 07468 g003
Figure 4. Spectrum of the CCF of the vibration and sound pressure signals.
Applsci 13 07468 g004
Figure 5. Frequency components with amplitude greater than threshold and their distribution.
Applsci 13 07468 g005
Figure 6. Time-frequency characteristics of the extracted signals: (a) waveform of the vibration signals (b), spectrum of the vibration signals, (c) waveform of the sound pressure signals, and (d) spectrum of the sound pressure signals.
Applsci 13 07468 g006
Figure 7. The change of friction coefficient in the wear experiment.
Applsci 13 07468 g007
Figure 8. The RMS change of the extracted components: (a) FIV signal and (b) FIS signal.
Applsci 13 07468 g008aApplsci 13 07468 g008b
Table 1. Details of the friction pairs.
Friction PairsProperties
Ball specimen (fixed and upper specimen)GCr15 steel, Ra 0.13 μm
Disk specimen (driven and lower specimen)C45 steel, Ra 0.73 μm
Table 2. Wear experiment settings.
Experiment SettingsValues
Normal load20 N
LubricantCD40 lubricating oil
Relative humidity58%
Temperature294 K
Reciprocating stroke5 mm
Relative sliding velocity0.067 m/s
Test duration60 min
Vibration signals sampling interval0.049 ms (10,240 data points)
Disclaimer/Publisher’s Note: The statements, opinions and data contained in all publications are solely those of the individual author(s) and contributor(s) and not of MDPI and/or the editor(s). MDPI and/or the editor(s) disclaim responsibility for any injury to people or property resulting from any ideas, methods, instructions or products referred to in the content.