
A New Windage Loss Model for S-CO2 Turbomachinery Design
Department of Nuclear and Quantum Engineering, Korea Advanced Institute of Science and Technology (KAIST), 373-1 Guseong-dong, Yuseong-gu, Daejeon 305-701, Republic of Korea
*
Author to whom correspondence should be addressed.
Appl. Sci. 2023, 13(13), 7463; https://doi.org/10.3390/app13137463
Submission received: 18 May 2023
/
Revised: 22 June 2023
/
Accepted: 23 June 2023
/
Published: 24 June 2023
(This article belongs to the Collection Modeling, Design and Control of Electric Machines: Volume II)
Abstract
:A supercritical CO2 (S-CO2) Brayton cycle is a compact and simple power conversion system with competitive efficiency. However, the strong real gas effects of S-CO2 pose challenges to the design of a cycle and its components. In particular, designing turbomachinery for expansion and compression processes has to accurately reflect real gas effects. Windage loss is one of the major losses that affects the motor load and heat generation in turbomachinery. The windage loss has a substantial impact on the overall turbomachinery efficiency especially in an S-CO2 power cycle since the windage loss is reported to be the dominant loss mechanism due to high fluid density and high rotational speed. Therefore, an accurate windage loss model reflecting the real gas effect of S-CO2 is essential to obtaining an optimal design of turbomachinery as well as maximizing the performance of an S-CO2 power cycle. In this study, existing windage loss models are first compared to the recently obtained data from S-CO2 windage loss experiments conducted by the KAIST research team under S-CO2 conditions in order to understand the turbomachinery performance uncertainty caused by the windage loss models. This is followed by proposing a new windage model which explains data better.
1. Introduction
Supercritical CO2 (S-CO2) power cycle technology has received interest from a wide range of energy industries because of its identified advantages. One of the advantages is that the S-CO2 Brayton cycle can achieve competitive efficiency (~50%) even with moderate temperature heat sources (450~750 °C) [1]. High efficiency can be achieved by compressing CO2 near the critical point (30.98 °C, 7377 kPa) because the high density of CO2 near the critical point makes compression work small and maximizes heat recuperation [2]. The system also has compact components and a simple configuration due to the high average density and having no phase change processes in the cycle. These advantages make the S-CO2 power cycle suitable for distributed power generation [3].
In order to successfully commercialize the S-CO2 power conversion system, the design of components involves optimization. However, the strong real gas effects of S-CO2 near the critical point make the design of an S-CO2 cycle component challenging. Turbomachinery is the key component for expansion and compression processes. It has a significant impact on the efficiency of an S-CO2 power system. Therefore, turbomachinery design should be able to predict the performance of a real component with small uncertainty to have minimal impact on the design of an S-CO2 power cycle. Generally, utilizing appropriate loss models increases the prediction capability of turbomachinery design since losses in turbomachinery affect geometry, operation point, and the associated design of a motor or generator. Good loss models for the S-CO2 turbomachinery design should be able to predict the losses even under the strong real gas effects of S-CO2. For this reason, many studies have focused on developing loss models of S-CO2 turbomachinery [4,5,6].
The turbomachinery losses can be classified into two types: internal and external losses. The internal loss mainly affects the design of the primary flow path, while the external loss determines losses occurring in the secondary flow path, which typically translates to additional work loss in turbomachinery. Thus, auxiliary cooling systems for turbomachinery are mainly affected by external losses. To minimize the size of the auxiliary system, the external loss should first be estimated with good precision.
Windage loss is one of the most significant external losses in S-CO2 turbomachinery. It is by far the dominant loss for the S-CO2 conditions which contrasts with turbomachinery operating with air. This is due to S-CO2 having a higher density and S-CO2 turbomachinery having a higher rotational speed for the same capacity. To demonstrate how S-CO2 conditions increase windage loss in turbomachinery, the windage loss model proposed by Vrancik is used to compare the windage losses between the S-CO2 condition and air condition, which is shown in Figure 1.
The S-CO2 recompression test conducted by Sandia National Lab (SNL) [7] provides a useful illustration of how windage loss is handled in practice. A Turbo-Alternator-Compressor (TAC) used in this test features a single shaft that connects compressor and turbine impellers. SNL constructed a turbomachine with rotor cavity depressurization to reduce its windage loss by utilizing a scavenging pump. However, the minimization of an auxiliary system such as a scavenging pump or a cooling system is necessary to utilize S-CO2 for the distributed power generation because the auxiliary systems can overwhelm the advantage of an S-CO2 power system being compact. Therefore, accurately predicting windage loss not only reduces the prediction uncertainty of cycle performances, but also impacts the economy of the system by reducing uncertainty in the design of auxiliary systems. Thus, understanding the windage loss mechanism in an S-CO2 turbomachinery and developing a good model for the windage loss prediction are important.
Most of the existing empirical models for windage loss are based on data obtained from air, water, and glycerin–water mixture tests. These models must first be validated regarding whether they can reflect the real gas effects of S-CO2. Furthermore, the Taylor number or the Reynolds number range of the existing models are too narrow to apply to the typical S-CO2 power cycle conditions. Therefore, a new windage loss measurement performed under the S-CO2 condition is necessary to evaluate the validity of the existing empirical models.
In this paper, S-CO2 windage loss experiments conducted by a research team at Korea Advanced Institute of Science and Technology (KAIST) are first presented. The existing empirical windage loss models are then compared to the data obtained from experiments performed under S-CO2 conditions. A method is proposed to improve the existing models by reflecting the real gas effects better. Finally, a new windage loss model which explains the data better is proposed and compared.
2. Description of S-CO2 Windage Loss Experiment
2.1. Experimental Design of S-CO2 Windage Loss Measurement
An S-CO2 rotating machinery test section is used for measuring windage loss as shown in Figure 2 [8]. The schematic diagram of the test section is shown in Figure 3. The radius of the shaft is 32 mm, and the shaft length is 348 mm as shown in Figure 3. The clearance between the shaft and the stationary wall (i.e., gap width) is 1.5 mm. The test section rotor is supported by Active Magnetic Bearing (AMB). The experimental test rig has no impeller by referring to Cho, S.K.’s paper [2] to make the internal loss negligible; thus, windage loss can be measured. Since the AMB has a gap ratio greater than other bearing types and the impeller is removed from the rotor, the test section is appropriate to test the shaft rotor dynamics and interaction between shaft and working fluid. The test section is designed to operate under 12 MPa and 100 °C conditions and can achieve a 35,000 RPM rotational speed.
The external loss can be obtained from the power measurement. The motor output power is measured by a power analyzer. In general, the motor power will be converted to mechanical work to overcome the external loss, enthalpy rise of S-CO2 from inlet to outlet, and heat losses via cooling in motor winding and heat transfer to ambient air from the test section external wall. Therefore, by measuring motor power and other converted quantities, the windage loss can be generally obtained using Equation (1) [9]. is external loss. is motor power input and is CO2’s enthalpy change for major flow. is the heat transferred from the test rig to the cooling water, and is the heat removed by leaking of the working fluid.
However, only the minor flow exists in the test section used in this study since the test rotor has no impeller attached and the major flow is blocked from the main loop while the test is conducted as shown in Figure 2. Moreover, the test section has no cooling water jacket for the motor winding and the leakage test is performed for the test rig. Therefore, all heat losses can be ignored. Consequently, the measured motor output can be regarded as the external loss.
The obtained external loss consists of different losses as shown in Equation (2) [9]. It is first noted that the test conducted under S-CO2 conditions has shown the motor power is measured in the order of a few kW. Thus, losses smaller than a few tens of Watts can be neglected. Other external losses are predicted based on the previous research. If the Daily and Nece model as shown in Equations (3) and (4) is used to estimate the disk loss, it is estimated to be only 0.5 W [10]. Thus, the disk loss can be neglected. The small value is due to the test rotor configuration with no impeller and only the shaft end surface will contribute to the disk loss. The bearing loss can also be negligible because the AMB has a greater gap ratio than other types of bearing. Previous research [9] used the Schlichting model to calculate it as shown in Equation (5), and the maximum value is estimated to be 10 W. Therefore, the measured motor power is the external loss of the test section rotor, and the measured external loss can be viewed as equivalent to the windage loss.
Since the relation between and can be described with Equation (6) for real gas, the heat capacity ratio can be used to consider the dramatic property changes of S-CO2 from viscous heating due to windage loss. is defined in Equation (7). Therefore, the test range is determined to cover the heat capacity ratio of S-CO2 compressor conditions shown in Ref. [11].
The compressor outlet conditions in the reference are a pressure of 20 MPa, temperature of 142 °C and of 1.83. While satisfying the reference of value, the test conditions are limited so as not to exceed the maximum pressure of 100 bar due to the limitation of the facility. As a result, the inlet density range is determined from 100 to 250 kg/m3, and the inlet S-CO2 temperature was kept under 55 °C to maintain similitude in the specific heat ratio. It is noted that the test range includes supercritical and gas phases so that the windage loss model can be used in various conditions. For instance, even though the reference design condition is at a supercritical state, the gas phase can occur during the operation since depressurization of a cavity using a scavenging pump can change the characteristics. Since existing empirical models handle only single phase, the test data are classified with the phase in which the data are measured.
2.2. Uncertainty of Measured Windage Loss
Since the temperature sensor, pressure sensor, and power analyzer all have measurement uncertainties and the geometric tolerance of the test section also contributes to measurement uncertainties, the measured windage loss and the skin friction coefficient will have uncertainties too. The measurement uncertainties and the geometric tolerance are summarized in Table 1. The skin friction, , is obtained with Equation (8). Since the uncertainty sources in Equation (8) are , , , and , the relative uncertainty of can be described with Equation (9). is measured from the power analyzer, and is obtained from a property database with the measured temperature and pressure. Therefore, each term in Equation (9) can be expanded to Equations (10)–(14).
Based on Equations (9)–(14), the uncertainty of is calculated and the maximum relative uncertainty of is 1.43%. Thus, the measurement uncertainty of the skin friction due to windage loss is very low.
3. Comparison of Data to Existing Windage Loss Models
The obtained windage loss data are compared to the existing empirical windage loss models summarized in Table 2 [12,13,14]. The measured windage loss is compared with the windage loss value obtained from the models by using inlet conditions measured during experiments. The results are shown in Figure 4, Figure 5, Figure 6 and Figure 7. The plotted points in these figures show the windage loss measured by a power analyzer at the S-CO2 rotor test rig as the y value. The x value of the points is the windage loss value calculated with each empirical model. The range of the points shows its uncertainty calculated at Section 2.2. The linear fitting via regression analysis is shown by a pink line. The blue line shows when the calculated windage loss and the measured windage loss are the same (i.e., y = x). If the empirical models explain the experiments well, the pink line is closer to the blue line. The two green lines represent a 20% error band. Thus, the top green line is y = 1.2x, and the bottom green line is y = 0.8x. How well the empirical model predicts the experimental results can be evaluated with the number of the plotted points inside the region between two green lines, which denotes how many data points can be predicted using the model with a 20% error. The R2 value of each model can also be compared to evaluate the fitness of the model. The R2 value, which is an indicator of the regression model performance for each model, is shown in Table 3. From the figures, it is concluded that empirical models based on liquid tests all underestimate the S-CO2 windage loss. Mack and Vrancik’s models, which are based on the air test, show smaller differences from the experimental measurement than other models, but they all overestimate the S-CO2 windage loss. It is clear that the Wendt, Yamada, Bilgen and Boulos, and Nakabayashi’s models are unsatisfactory for explaining the S-CO2 windage loss test results because the R2 value is negative. Mack and Vrancik’s models have positive R2 values. However, an R2 value close to unity cannot be found amongst the tested models, which implies that a new model development is necessary.

Table 2.
Existing empirical windage loss models.
| Author | Empirical Equation | Note | |
|---|---|---|---|
| Mack [12,13] | is obtained with assuming continuous change of at Air test | ||
| Vrancik [14] | Couette velocity profile in laminar and air test for in turbulence regime Air test for | ||
| Wendt [15,16] | Pure water, water-glycerin mixture Gap size: 0.95~4.7 cm | ||
| Yamada [15,17] | Spindle oil test | ||
| Bilgen and Boulos [15,18] | Pure water, water-glycerin mixture Gap size: 0.32~4.45 cm | ||
| Nakabayashi [15,19] | Freezer oil, pure water, water-glycerin mixture Roughness test | ||
One of the major reasons why the existing models fail to predict the data successfully is due to the negligence of property variations from inlet to outlet due to viscous heating. The viscous heating from windage loss changes the CO2 properties dramatically from inlet to outlet in the secondary pass of turbomachinery. However, it was originally suggested that the existing empirical models should only use inlet conditions, and therefore, this property change effect of CO2 cannot be reflected properly.
Figure 8 shows the work loss due to windage loss estimated with inlet conditions and outlet conditions, respectively, for each windage loss model to illustrate how strong this effect can be. The inlet condition is 80 bar and 36 °C, and the outlet condition is 79.5 bar and 53 °C, which are selected conditions from the actual tests conducted in the KAIST S-CO2 rotor test rig [8]. As the figure shows, the existing empirical models cannot predict the windage loss under S-CO2 conditions accurately by using only inlet conditions. The inlet-to-outlet density ratio is shown in Figure 9 to explain the reason for this. As shown in the figure, the density ratio is less than unity during the test. This is because the density is decreased substantially due to viscous heating, and this in turn significantly affects windage loss. It is noted that the variation of the density ratio over time is due to testing many conditions in a single test, and the test section reaches a steady state quite quickly when the test conditions are changed.
4. New S-CO2 Windage Loss Model Development
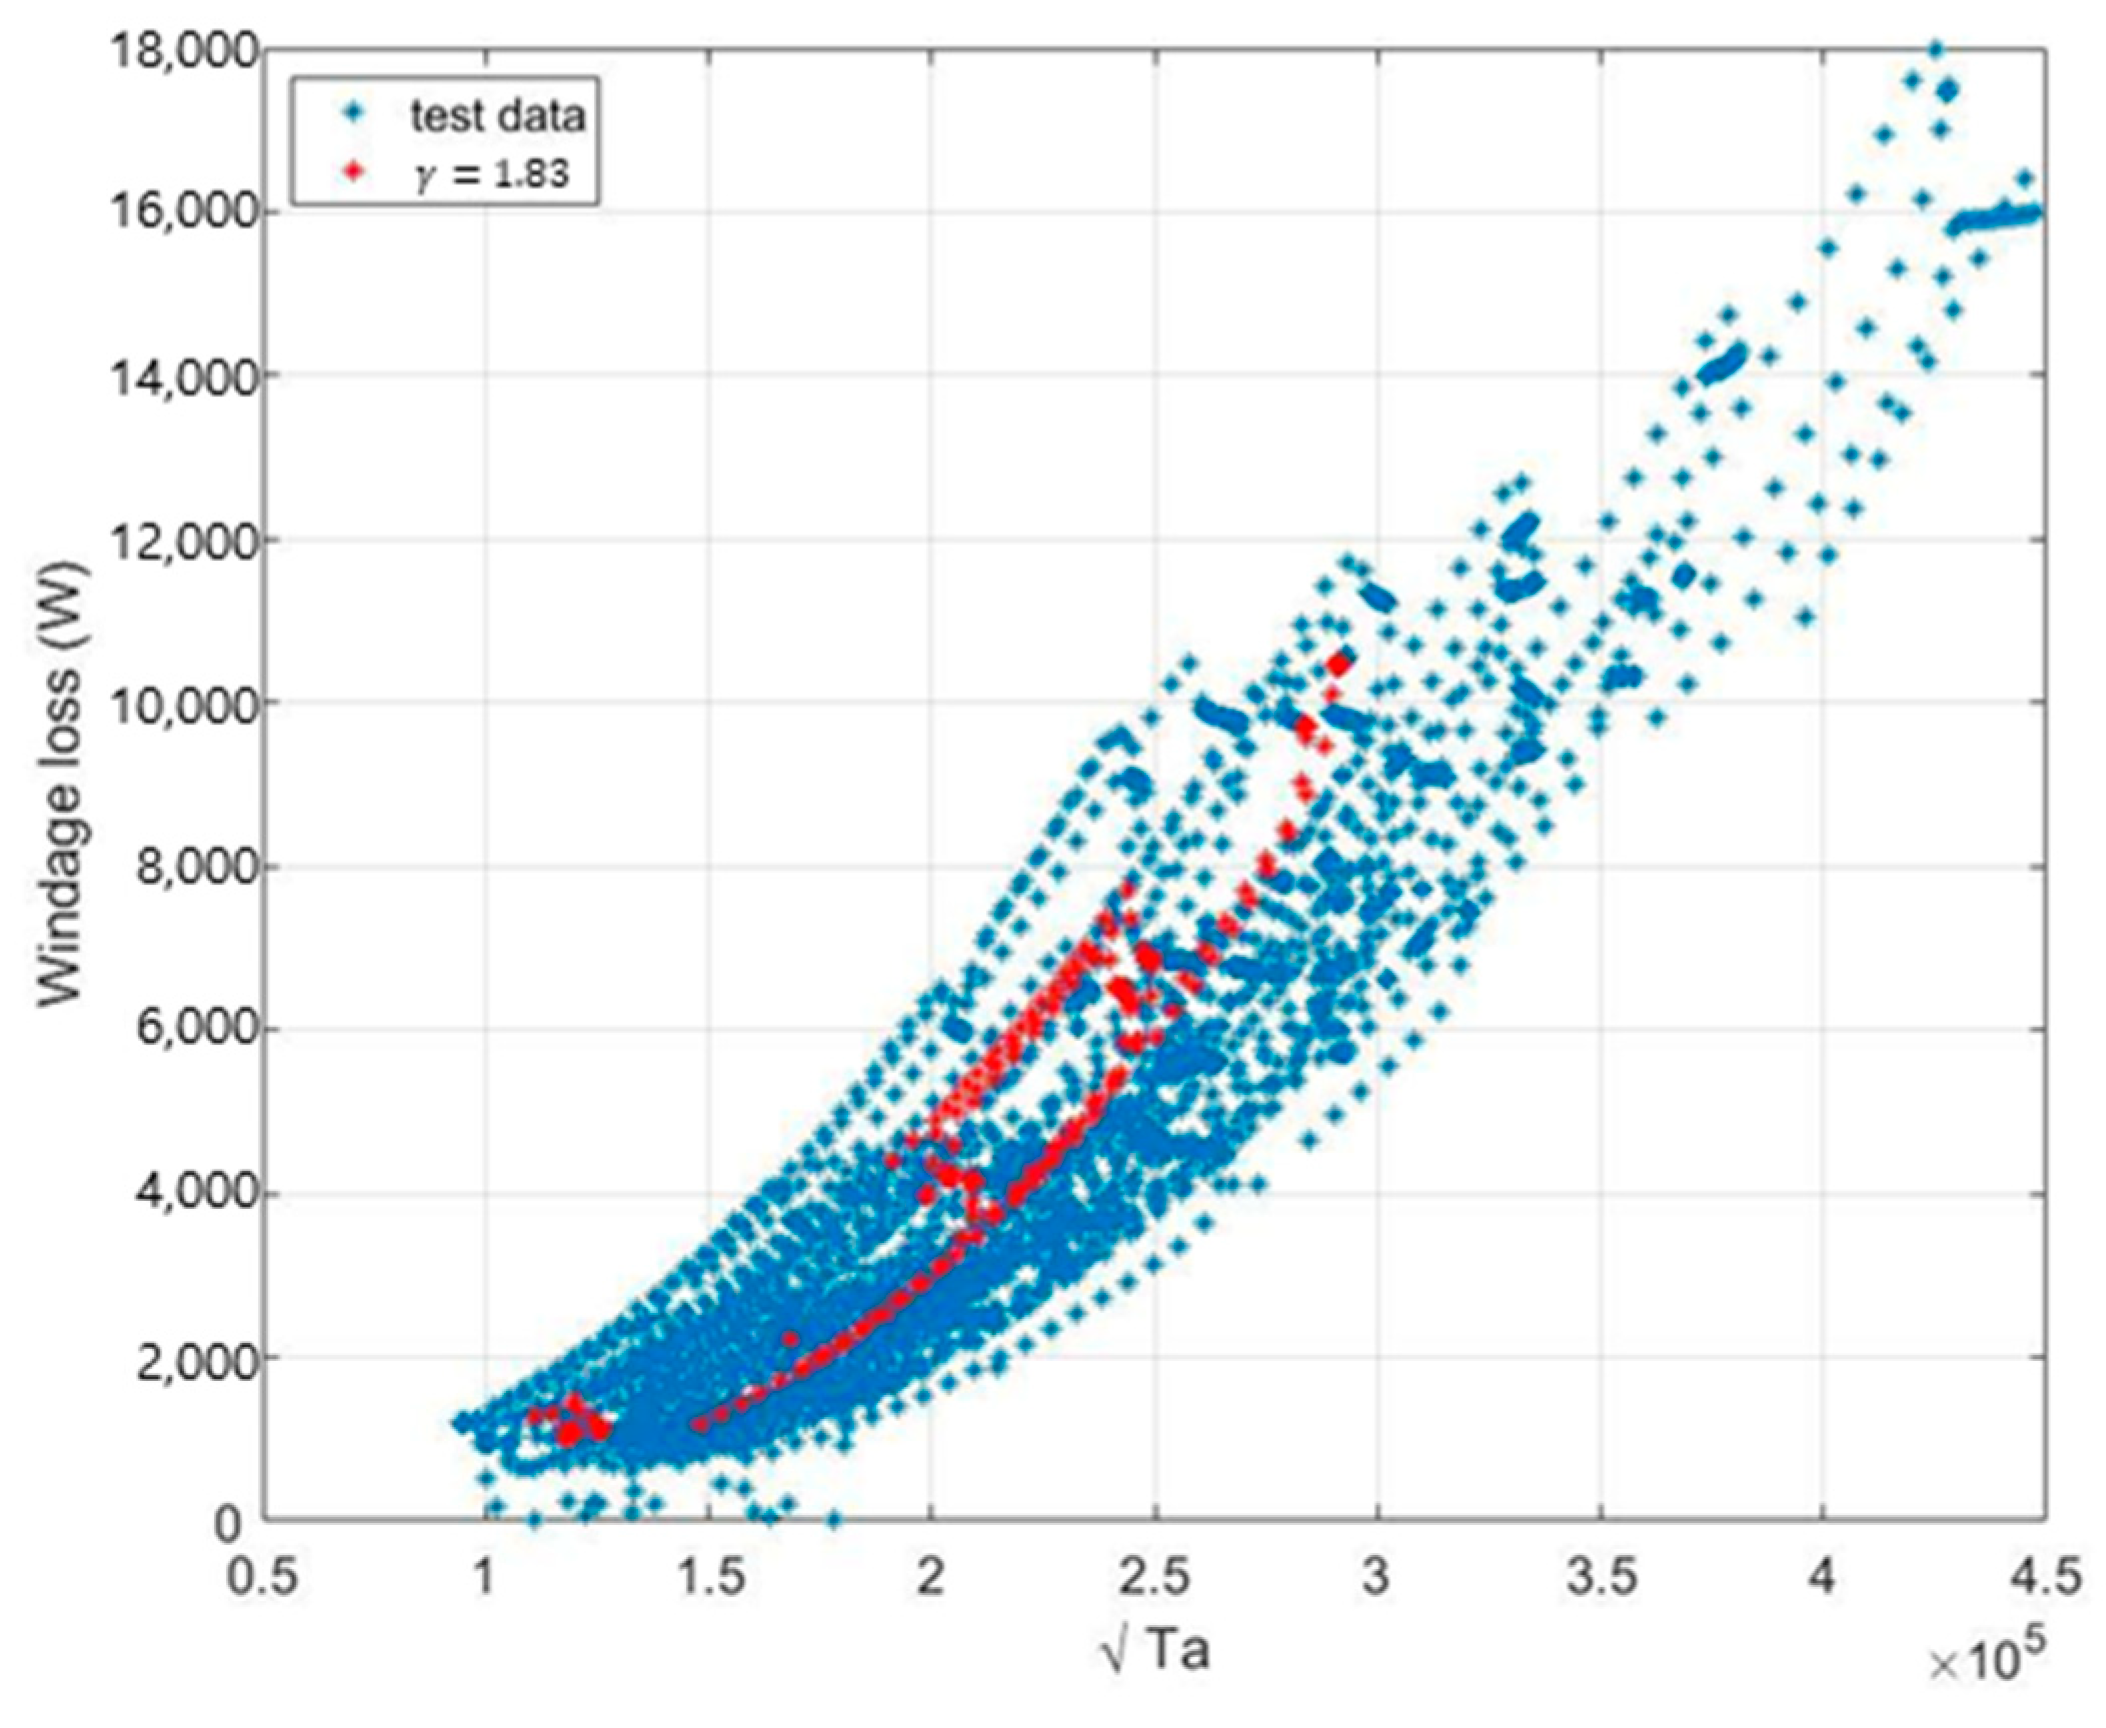
A new windage loss model is developed by modifying the existing model and the validity of the newly proposed model is presented in this section. The Taylor number is first examined to determine whether it alone is enough to describe the windage loss test data. The measured windage loss is plotted with respect to the Taylor number, as shown in Figure 10. Since the data have wide dispersion without a clear pattern with respect to the Taylor number, it is concluded that other variables are required to describe the windage loss data better. The heat capacity ratio is therefore considered to be used next in conjunction with the Taylor number to better explain S-CO2 windage loss test data. The measured windage loss data are now plotted with respect to and in Figure 11. By correlating the data with the Taylor number and , the data can now have one-to-one correspondence. Therefore, these two variables are used to correlate S-CO2 windage loss data.
Since Mack’s model has the best regression result as shown in Table 3, Mack’s model is selected to correct with and . The modified model should produce identical results with the original model when the value becomes equal to air, since Mack’s model is developed from data obtained from air tests. The assumed skin friction coefficient with this constraint can thus have the following relations shown in Equations (15) and (16). The least square method is used to find the value for exponent . The newly proposed model is shown in Equation (17) for the supercritical phase and in Equation (18) for the gas phase.
Even though the developed model is based on one S-CO2 test rig, it is expected that this model could be applied to the design of other turbomachinery. This is because the developed model is based on non-dimensional numbers, and as long as the similitude holds, the model can be applied to the design of other equipment operating under S-CO2 conditions. The newly developed model is a model modifying the base model (i.e., Mack’s model) by multiplying the term to reflect the change in properties of the working fluid due to viscous heating. Therefore, this model can reflect not only S-CO2 conditions but also other fluids with similar characteristics if the fluid is in a superheated gas or supercritical phase. Other conditions such as geometry or rotation speed are different in the designed machinery, the developed model will follow the trend of Mack’s model, which is based on a larger test data set. In summary, the newly suggested model is generally applicable.
The new models are compared with test data as shown in Figure 12 and Figure 13. The R2 values are 0.9772 and 0.9673 for supercritical and gas phases, respectively, which are near unity, so the new model is better than Mack’s model for predicting the windage loss under S-CO2 conditions.
However, Figure 12 and Figure 13 still show that the measured windage loss can be different, with the predicted windage loss being more than 20% in some cases. The newly suggested model is based on the existing empirical model, and to evaluate if there are any missing factors for the S-CO2 working fluid for the new model, the Pi theorem is used. Since the heated S-CO2 flows through the axial direction, the added factor is the axial flow velocity, .
There are two dimensionless variables ( and ) and six variables with dimensions (). The dimensions used in this equation are mass, length, and time. Based on the Pi theorem, two dimensionless variables are required because there are five variables and three dimensions (mass, length, and time).
Let , , and be repeating variables. Then, the dimensionless numbers are listed as below.
To make dimensionless, and are zero and is −1. Similarly, becomes dimensionless when , are −1 and is −2. It can be shown that is and , inverse of , is . However, becomes , which is not a frequently used term. For a familiar term, is modified as which is . Therefore, third dimensionless number becomes which is . The newly suggested form of is shown in Equation (23).
and are obtained with the least square method again. The results are shown for the supercritical condition in Equation (24) and the gas condition in Equation (25). They are compared with the test data as shown in Figure 14 and Figure 15. The R2 values are now 0.9800 and 0.9763 for the supercritical and gas phases, respectively, which are closer to unity. Based on the R2 value, the newly suggested model is better than the existing models to explain the S-CO2 test results. However, the exponent of the Reynolds number is quite low, which indicates that the Reynolds number does not play too important a role in the windage loss.
5. Summary Conclusions
The existing windage loss models found in the open literature are mostly based on air or liquid experiments and can have substantial errors for predicting the S-CO2 windage loss in turbomachinery. It is shown that the major source of error is due to the assumption of uniform properties and not considering the thermodynamic state change due to viscous heating. The viscous heating via windage loss should be correctly reflected to estimate windage loss, since the small temperature change due to viscous heating can result in substantial density change from inlet to outlet in S-CO2 turbomachinery. In order to reflect the physics correctly, the windage loss test under the CO2 condition is designed and performed in this research.
Experimental data are newly obtained from an S-CO2 windage loss test to evaluate the existing windage loss models under S-CO2 conditions. The newly obtained windage loss data are compared with the existing models. The comparison shows that the existing models do not perform satisfactorily to predict the windage loss under the S-CO2 conditions. Therefore, a new windage loss model is suggested by modifying the best pre-existing model with the inlet Taylor number and inlet specific heat ratio. These two added variables are selected since these variables correlate with the newly obtained data quite well. The new model shows a satisfactory performance, and therefore, it is recommended to be used for designing an S-CO2 turbomachine used in the S-CO2 power cycle in the future.
Author Contributions
Conceptualization, D.K. and J.I.L.; data curation, D.K.; formal analysis, D.K. and J.I.L.; investigation, D.K., Y.J., I.W.S. and J.I.L.; methodology, D.K. and J.I.L.; software, D.K.; validation, D.K. and J.I.L.; writing—original draft, D.K. and J.I.L.; writing—review and editing, D.K. and J.I.L. All authors have read and agreed to the published version of the manuscript.
Funding
This research was supported by the Challengeable Future Defense Technology Research and Development Program (912767601) of the Agency for Defense Development in 2023, grant number UC190029RD.
Institutional Review Board Statement
Not applicable.
Informed Consent Statement
Not applicable.
Data Availability Statement
Data sharing not applicable.
Conflicts of Interest
The authors declare no conflict of interest.
Nomenclature
| Symbol | |
| Shaft length | |
| Shaft radius | |
| Clearance | |
| Clearance ratio, c/r | |
| Shaft rotation speed | |
| Axial flow velocity | |
| Pressure | |
| Temperature | |
| Enthalpy | |
| Density | |
| Kinematic viscosity | |
| Skin friction coefficient | |
| External loss | |
| Motor power input from power analyzer | |
| Disk loss | |
| Bearing loss | |
| , Reynolds number with shaft end | |
| , Reynolds number with clearance | |
| , Reynolds number with axial direction | |
| Hydraulic diameter, 2 times of clearance | |
| Uncertainty | |
| Subscript | |
| i | The values with ith control volume |
| inlet | Inlet condition |
| axial | The difference through axial direction is considered |
| uniform | The condition through axial direction is uniform |
| ext | External |
| corr | Corrected model |
| T | Temperature transmitter |
| P | Pressure transmitter |
| s | Supercritical phase |
| g | Superheated gas phase |
References
- Dostal, V.; Driscoll, M.J.; Hejzlar, P. A Supercritical Carbon Dioxide Cycle for Next Generation Nuclear Reactors; Design MIT-ANP-TR-100, Advanced Nuclear Power Technology Program; MIT: Cambridge, MA, USA, 2004. [Google Scholar]
- Cho, S.K.; Bae, S.J.; Jeong, Y.; Lee, J.; Lee, J.I. Direction for high-performance supercritical CO2 centrifugal compressor design for dry cooled supercritical CO2 Brayton cycle. Appl. Sci. 2019, 9, 4057. [Google Scholar] [CrossRef] [Green Version]
- Moroz, L.; Burlaka, M.; Rudenko, O. Study of a supercritical CO2 power cycle application in a cogeneration power plant. In Proceedings of the 4th International Symposium-Supercritical CO2 Power Cycles, Pittsburgh, PA, USA, 9–10 September 2014. [Google Scholar]
- Uusitalo, A.; Turunen-Saaresti, T.; Grönman, A. Design and loss analysis of radial turbines for supercritical CO2 Brayton cycles. Energy 2021, 230, 120878. [Google Scholar] [CrossRef]
- Cho, J.; Choi, M.; Baik, Y.J.; Lee, G.; Ra, H.S.; Kim, B.; Kim, M. Development of the turbomachinery for the supercritical carbon dioxide power cycle. Int. J. Energy Res. 2016, 40, 587–599. [Google Scholar] [CrossRef]
- Persky, R.; Sauret, E. Loss models for on and off-design performance of radial inflow turbomachinery. Appl. Therm. Eng. 2019, 150, 1066–1077. [Google Scholar] [CrossRef]
- Pasch, J.J.; Conboy, T.M.; Fleming, D.D.; Rochau, G.E. Supercritical CO2 Recompression Brayton Cycle: Completed Assembly Description; No. SAND2012-9546; Sandia National Laboratories (SNL): Albuquerque, NM, USA; Livermore, CA, USA, 2012. [Google Scholar] [CrossRef] [Green Version]
- Kim, D.K. Study of Magnetic Bearing Instability for KAIST Micro Modular Reactor Application. Master’s Thesis, KAIST, Daejeon, Republic of Korea, 2019. Available online: https://koasas.kaist.ac.kr/handle/10203/266559 (accessed on 22 June 2023).
- Kim, S.G. A Design Study of a Supercritical S-CO2 Radial Compressor by Analyzing Three-Dimensional Flow Field. Ph. Dissertation, KAIST, Daejeon, Republic of Korea, 2018. Available online: https://koasas.kaist.ac.kr/handle/10203/265052 (accessed on 22 June 2023).
- Daily, J.W.; Nece, R.E. Chamber dimension effects on induced flow and frictional resistance of enclosed rotating disks. Trans. ASME J. Basic Eng. 1960, 82, 217–232. [Google Scholar] [CrossRef]
- Kim, S.G.; Yu, H.; Moon, J.; Baik, S.; Kim, Y.; Jeong, Y.H.; Lee, J.I. A concept design of supercritical CO2 cooled SMR operating at isolated microgrid region. Int. J. Energy Res. 2017, 41, 512–525. [Google Scholar] [CrossRef]
- Rosset, K.; Schiffmann, J. Extended windage loss models for gas bearing supported spindles operated in dense gases. J. Eng. Gas Turbines Power 2020, 142, 061010. [Google Scholar] [CrossRef]
- Mack, M. Luftreibungsverluste Bei Elektrischen Maschinen Kleiner Baugrösse. Ph.D. Thesis, Universität Stuttgart, Stuttgart, Germany, 1967. [Google Scholar]
- Vrancik, J.E. Prediction of Windage Power Loss in Alternators; NASA Technical Note TN D-4849; NASA: Washington, DC, USA, 1968. [Google Scholar]
- Nachouane, A.B.; Abdelli, A.; Friedrich, G.; Vivier, S. Estimation of windage losses inside very narrow air gaps of high speed electrical machines without an internal ventilation using CFD methods. In Proceedings of the 2016 XXII International Conference on Electrical Machines (ICEM), Lausanne, Switzerland, 4–7 September 2016; pp. 2704–2710. [Google Scholar] [CrossRef]
- Wendt, F. Turbulente Strmungen zwischen zwei rotierenden konaxialen Zylinderen. Ing. Arch. 1933, 9, 577–595. [Google Scholar] [CrossRef]
- Yamada, Y. Torque Resistance of a Flow between Rotating Co-Axial Cylinders Having Axial Flow. Jpn. Soc. Mech. Eng. 1962, 5, 634–642. [Google Scholar] [CrossRef] [Green Version]
- Bilgen, E.; Boulos, R. Functional dependence of torque coefficient of coaxial cylinders on gap width and Reynolds numbers. J. Fluid Eng. 1973, 95, 122–126. [Google Scholar] [CrossRef]
- Nakabayashi, K.; Yamada, Y.; Kishimoto, T. Viscous frictional torque in the flow between two concentric rotating rough cylinders. J. Fluid Mech. 1982, 119, 409–422. [Google Scholar] [CrossRef]
Figure 1.
Windage loss comparison of CO2 and air with Vrancik’s model (for test rig geometry, r = 0.032 m, c = 0.0015 m and l = 0.2 m).
Figure 1.
Windage loss comparison of CO2 and air with Vrancik’s model (for test rig geometry, r = 0.032 m, c = 0.0015 m and l = 0.2 m).
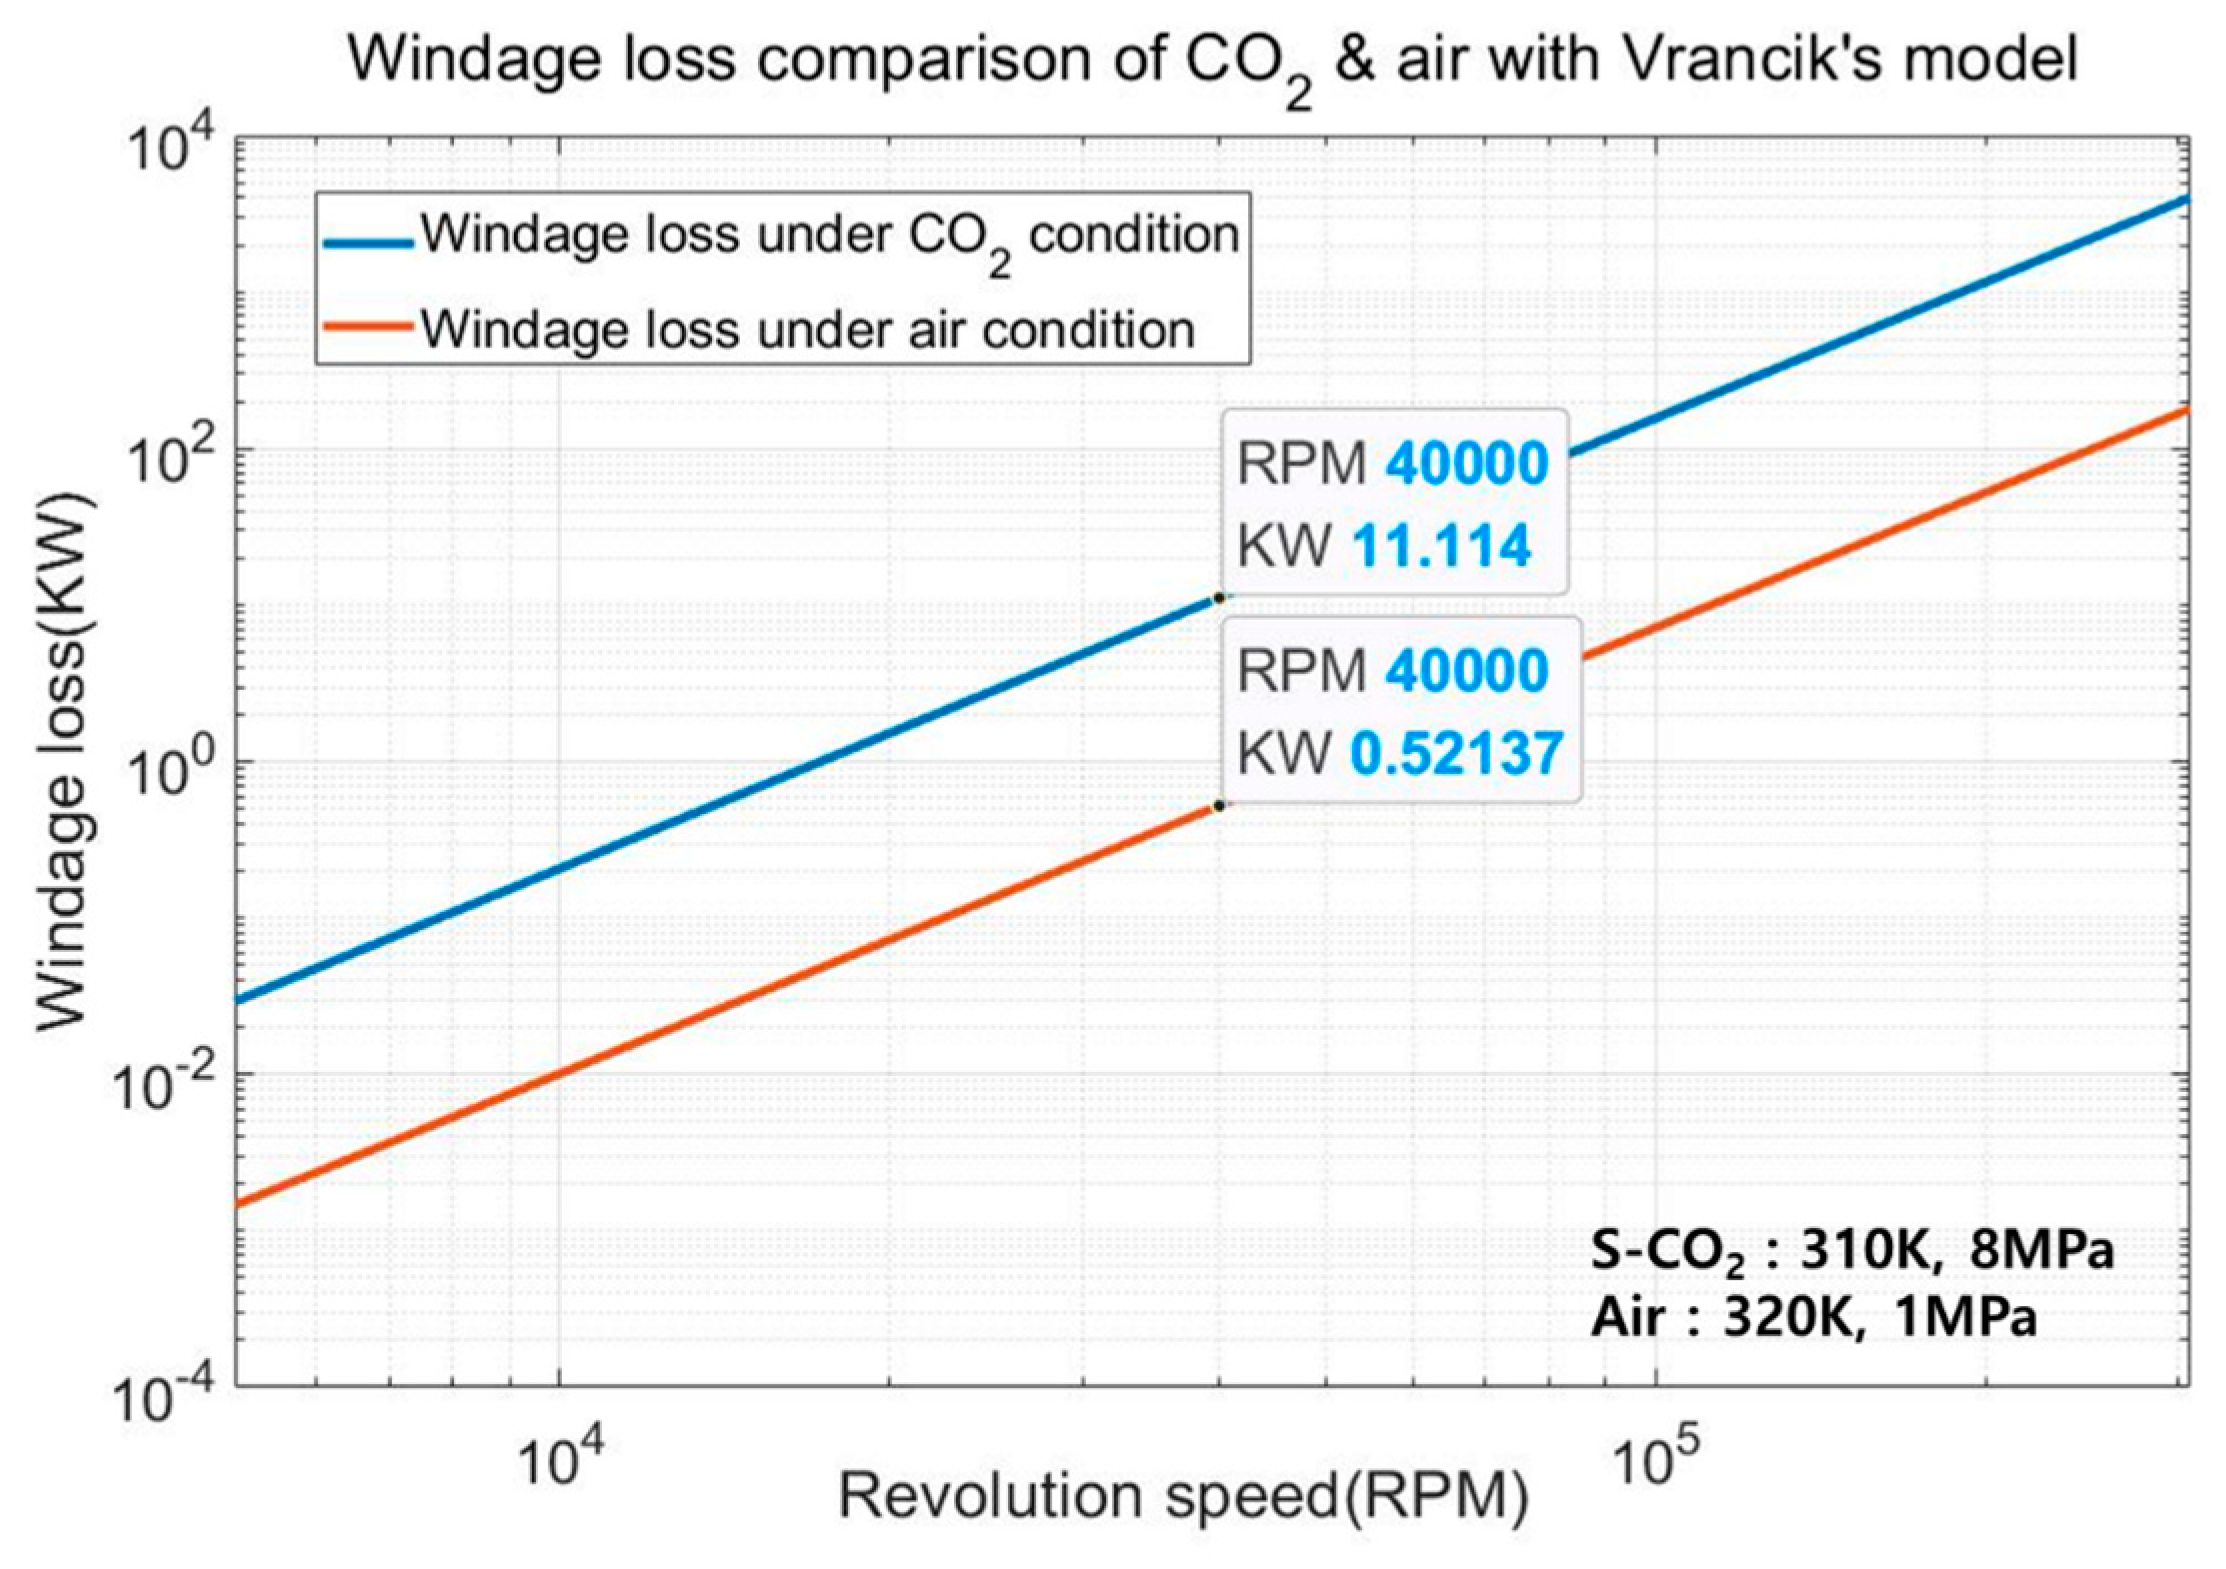
Figure 2.
KAIST magnetic bearing supported S-CO2 rotating machinery test section.
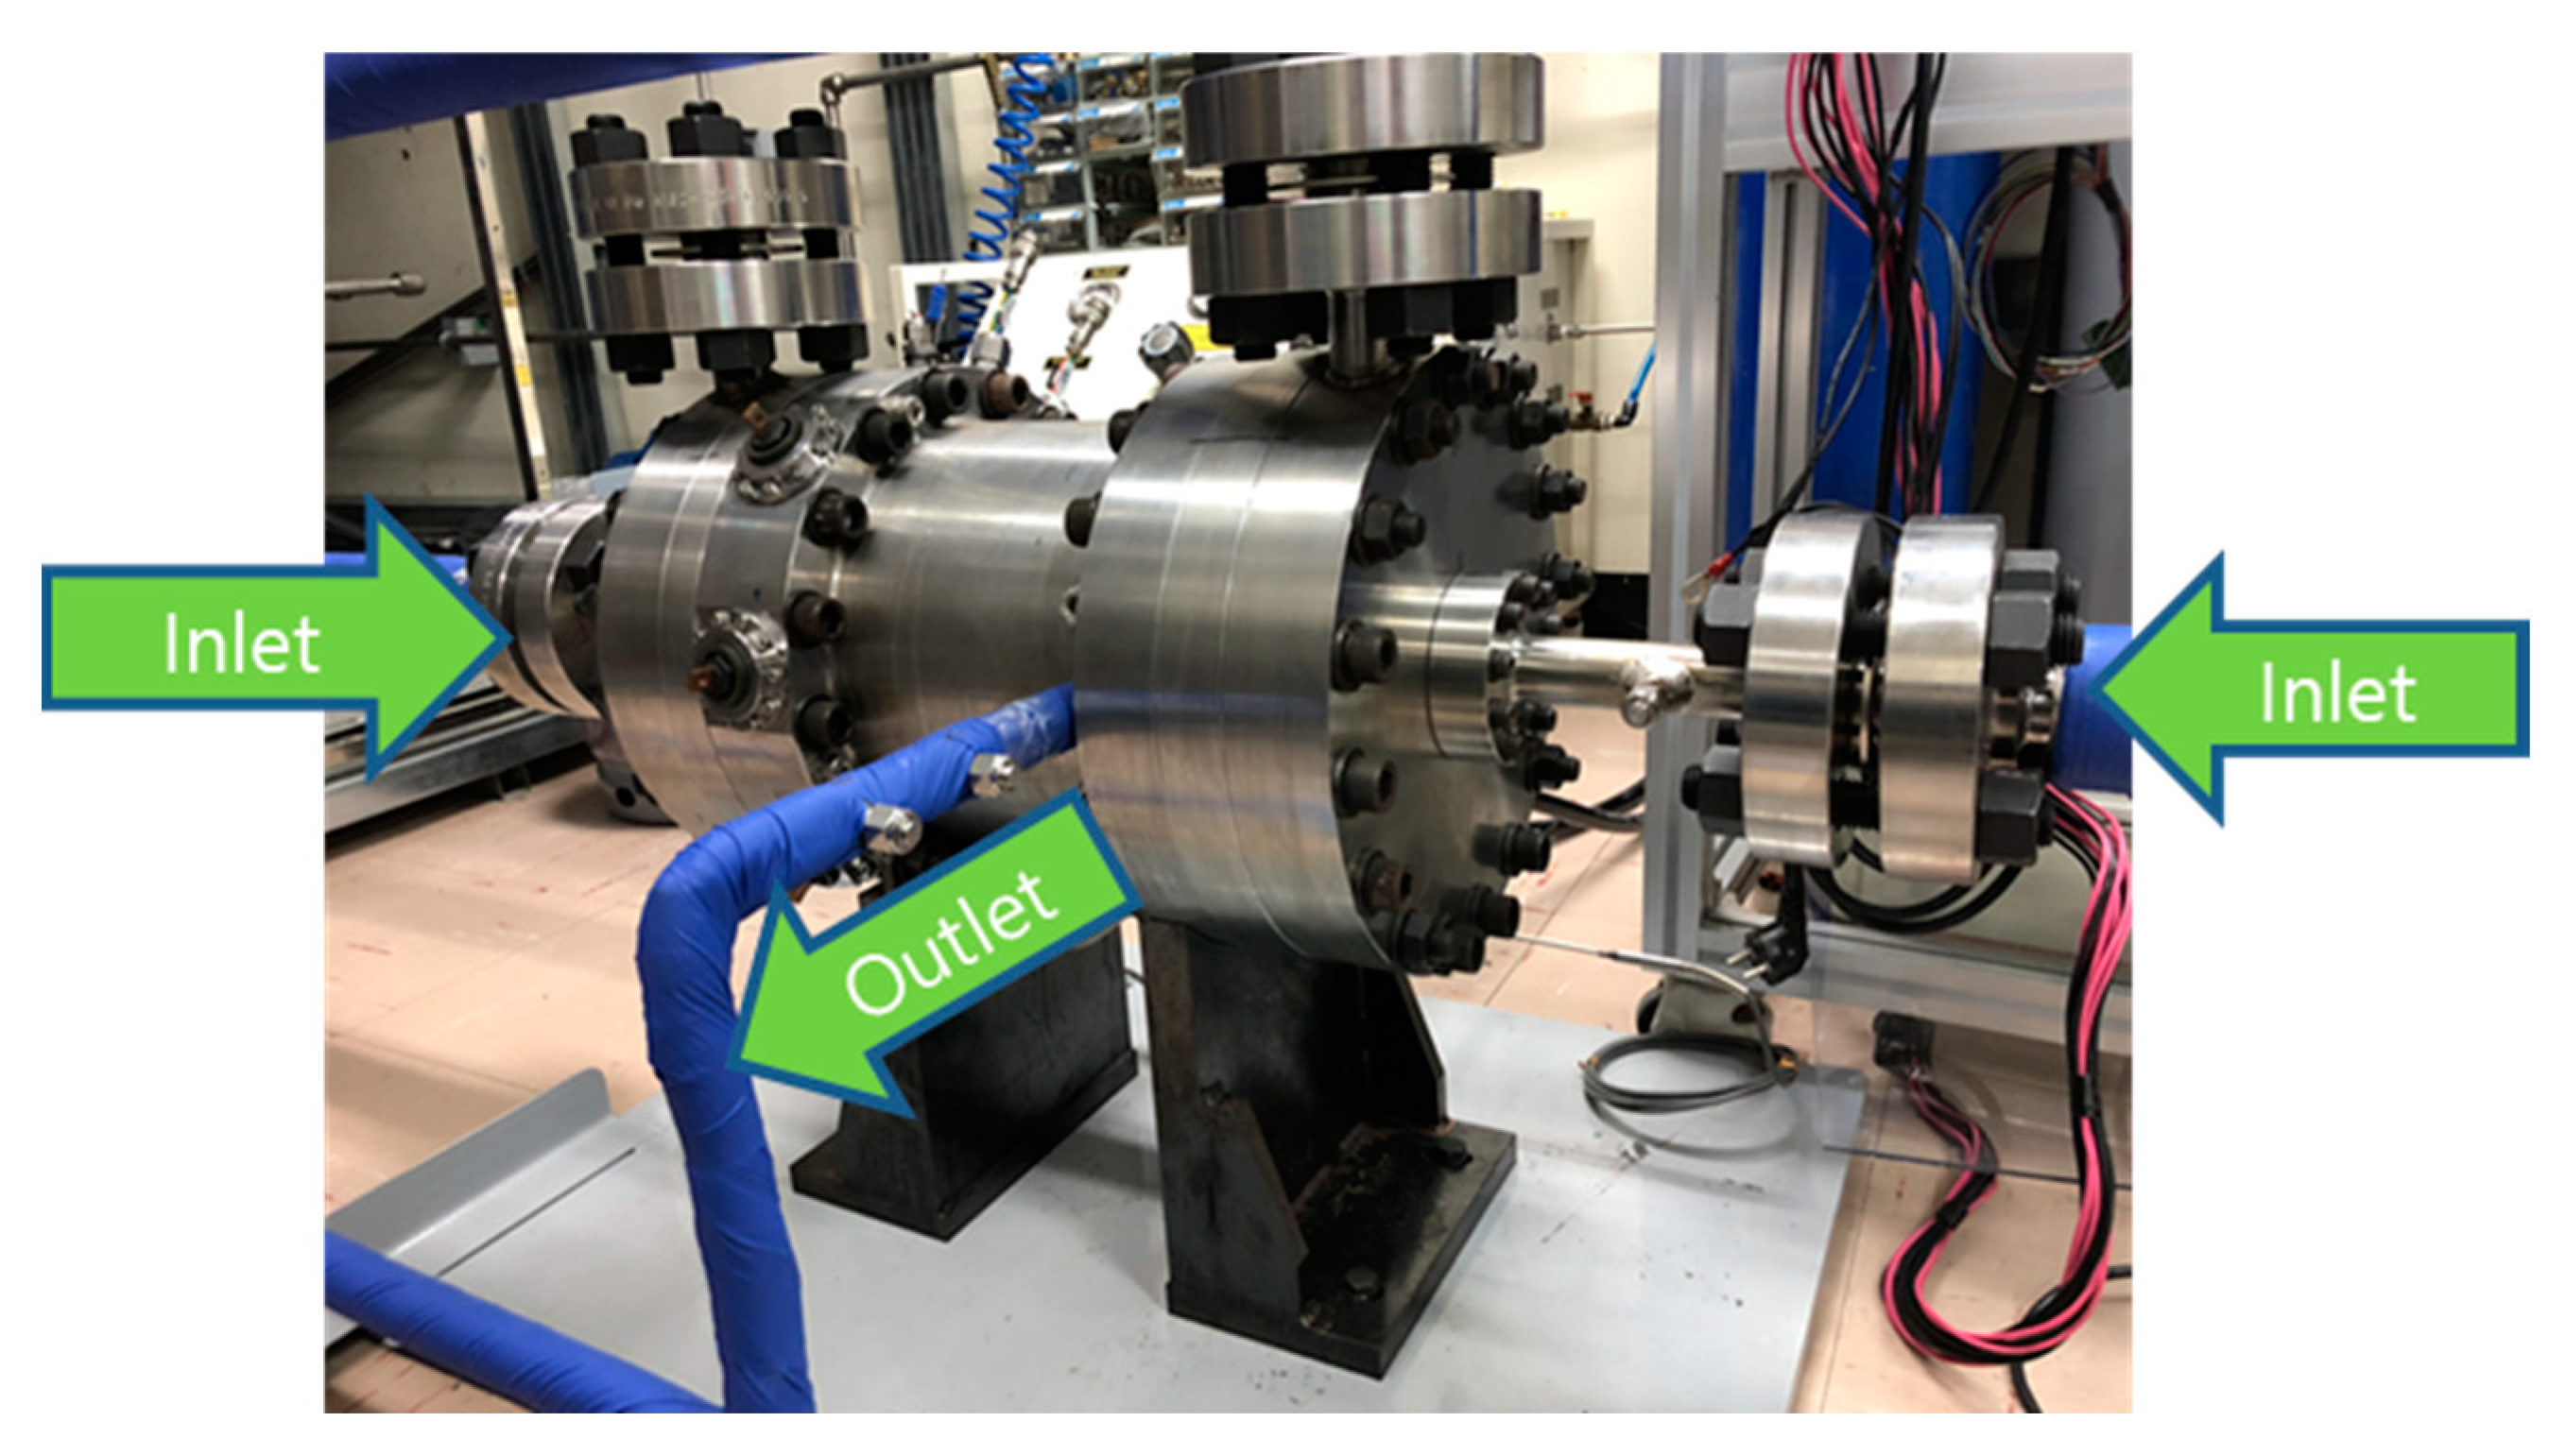
Figure 3.
Schematic diagram for S-CO2 rotor test rig.

Figure 4.
Measured windage loss vs. calculated windage loss from Mack’s model.

Figure 5.
Measured windage loss vs. calculated windage loss from Vrancik’s model.

Figure 6.
Measured windage loss vs. calculated windage loss from Bilgen and Boulos’ model.
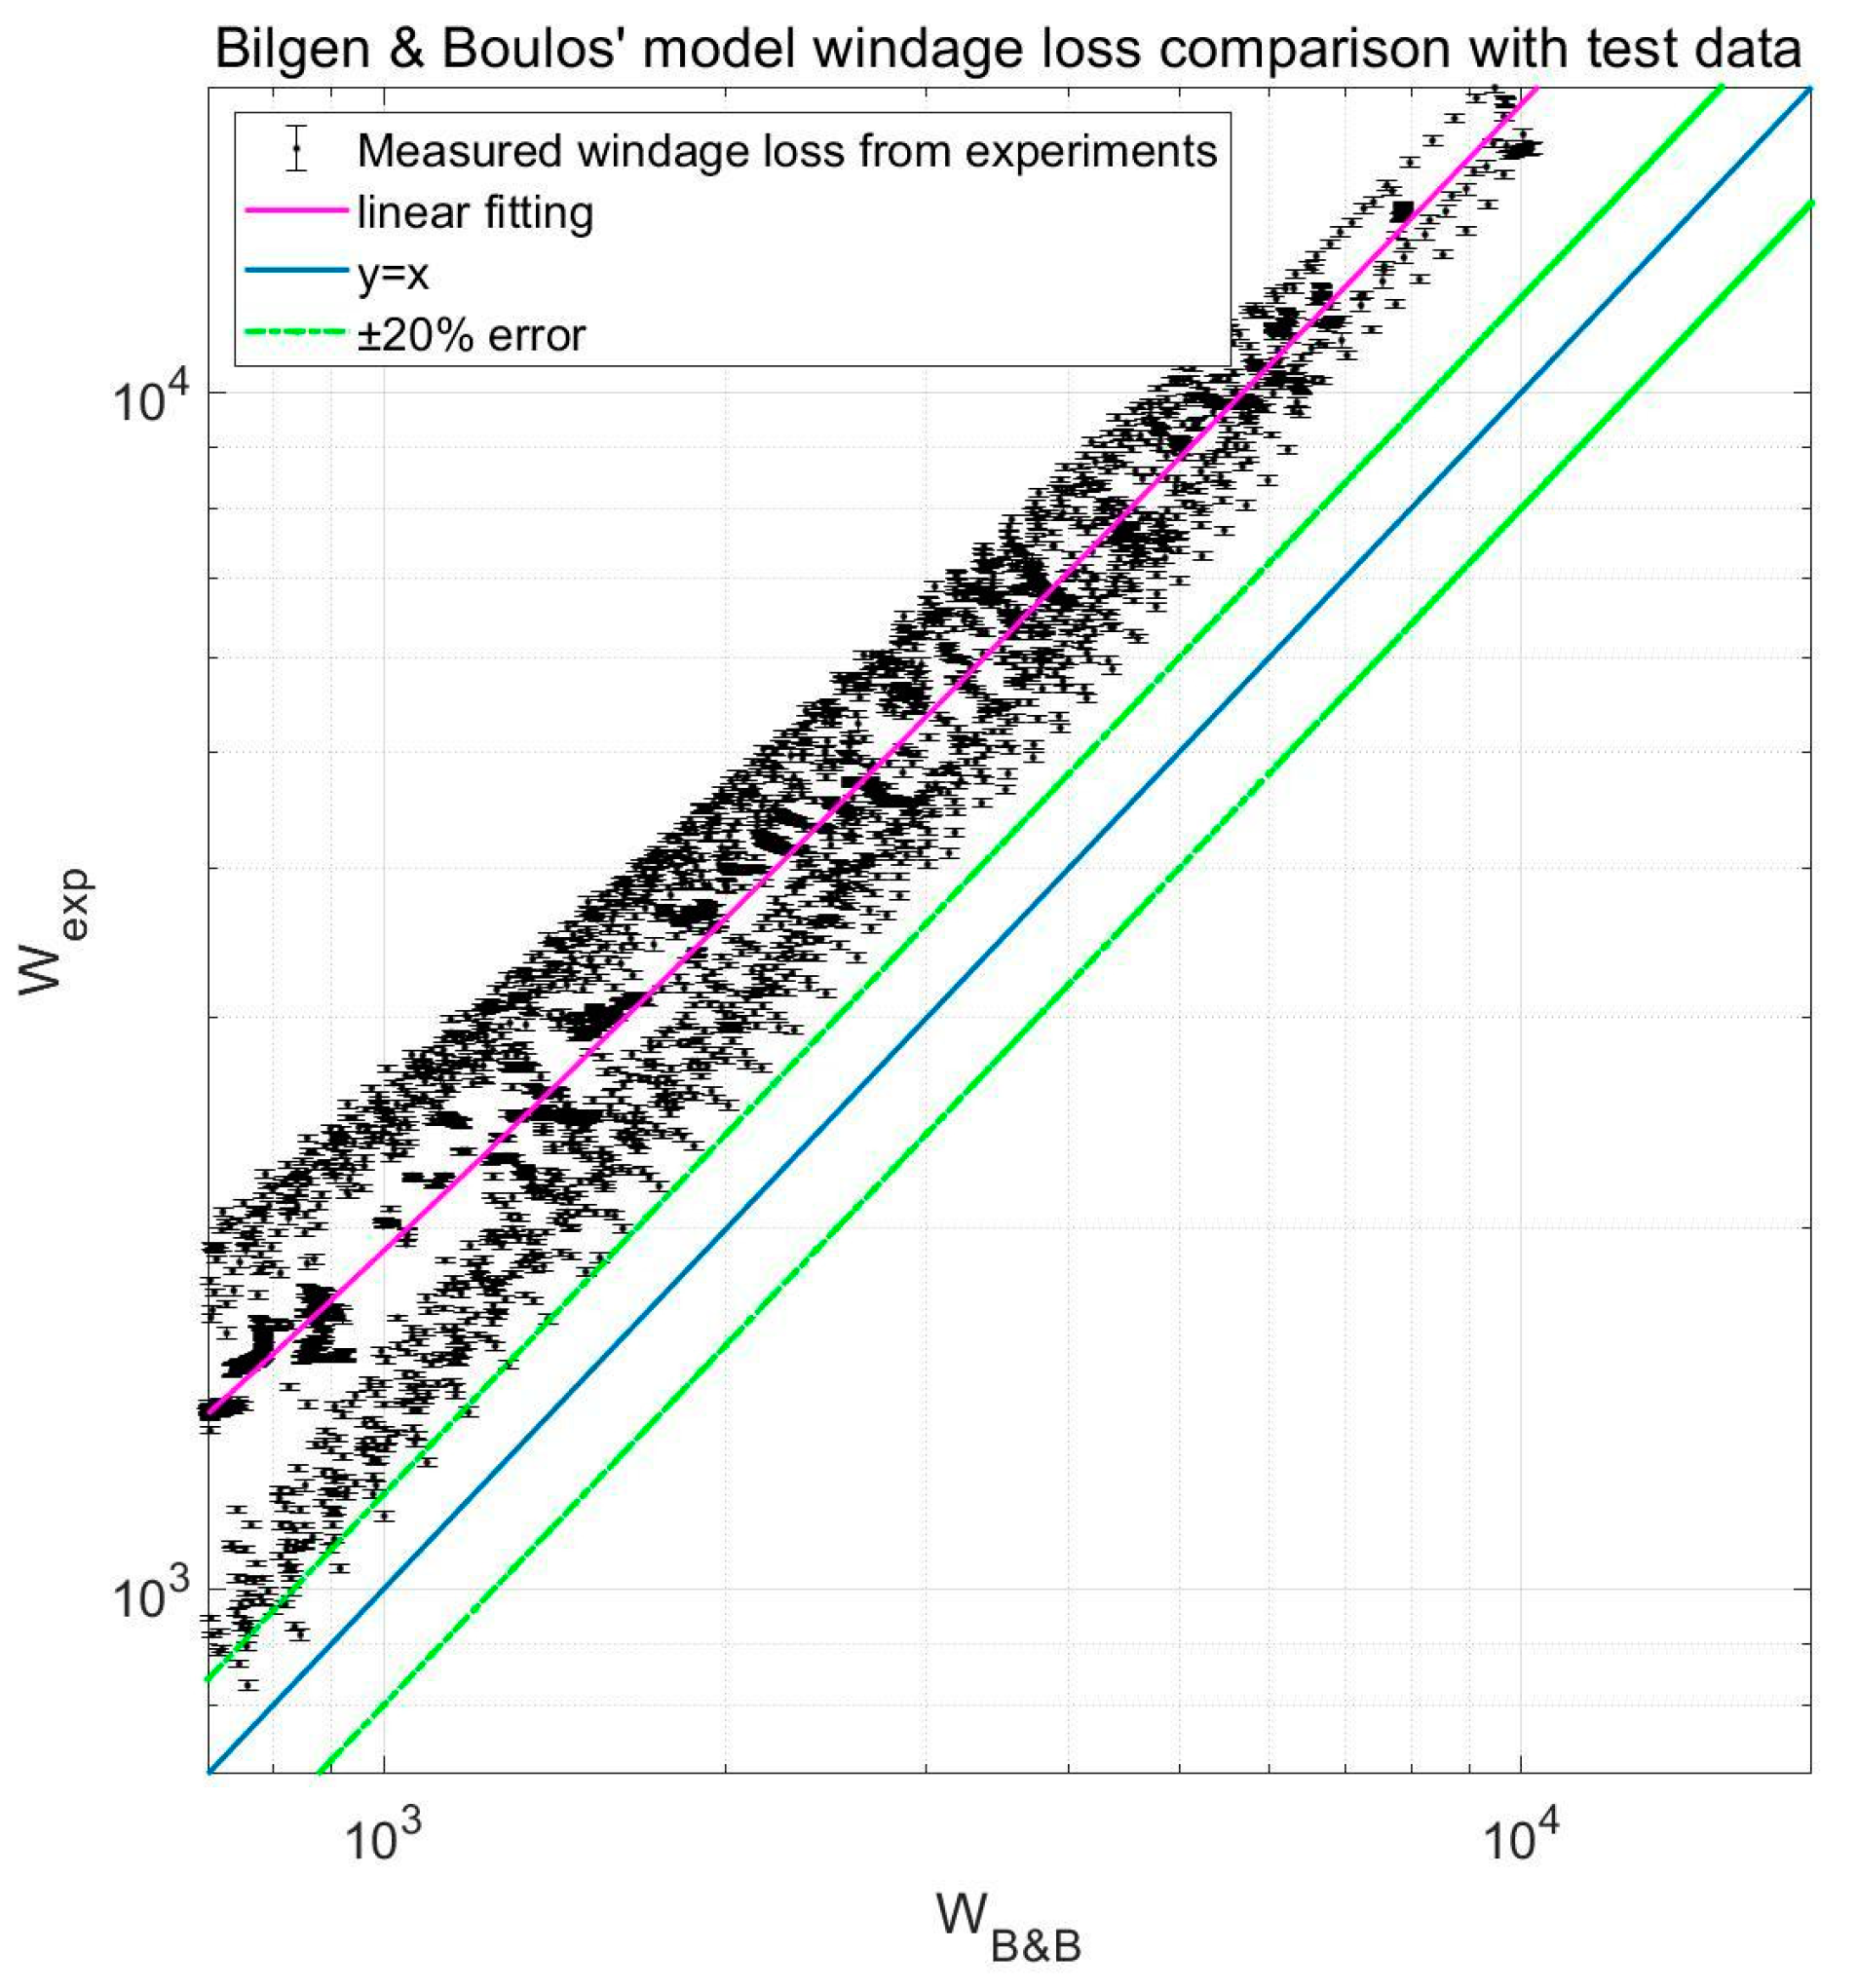
Figure 7.
Measured windage loss vs. calculated windage loss from Nakabayashi’s model.
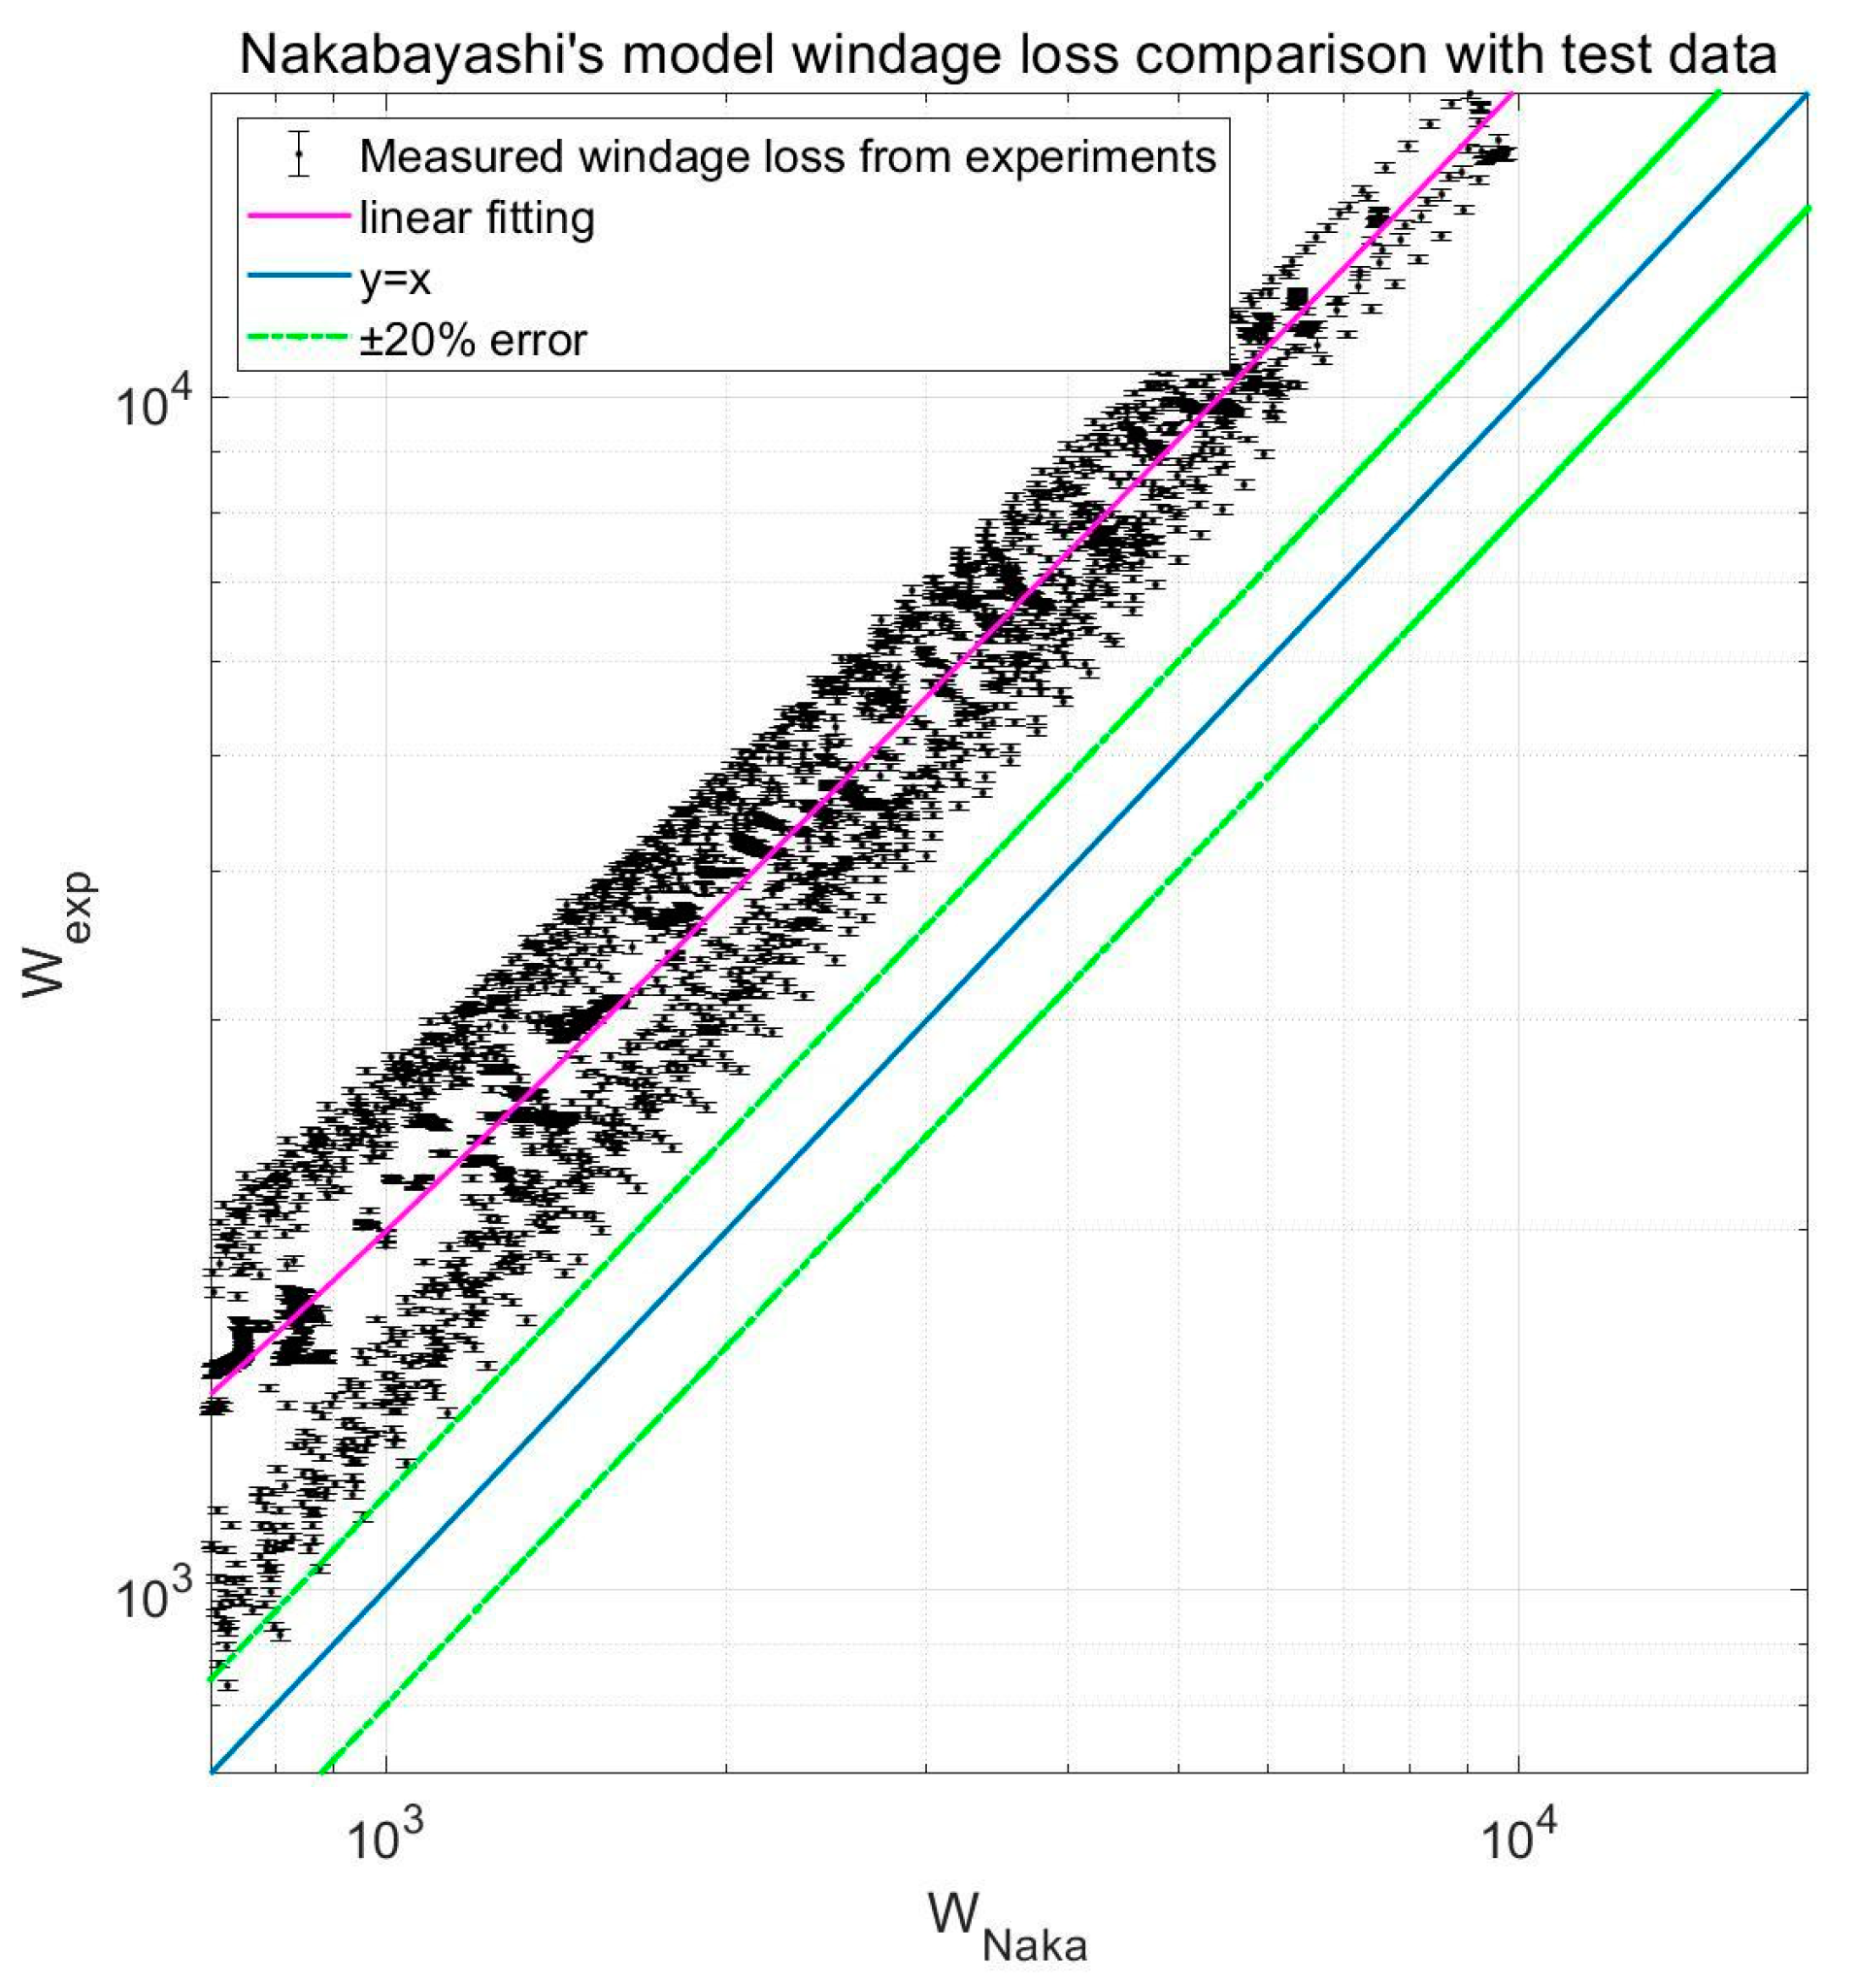
Figure 8.
Difference between and .
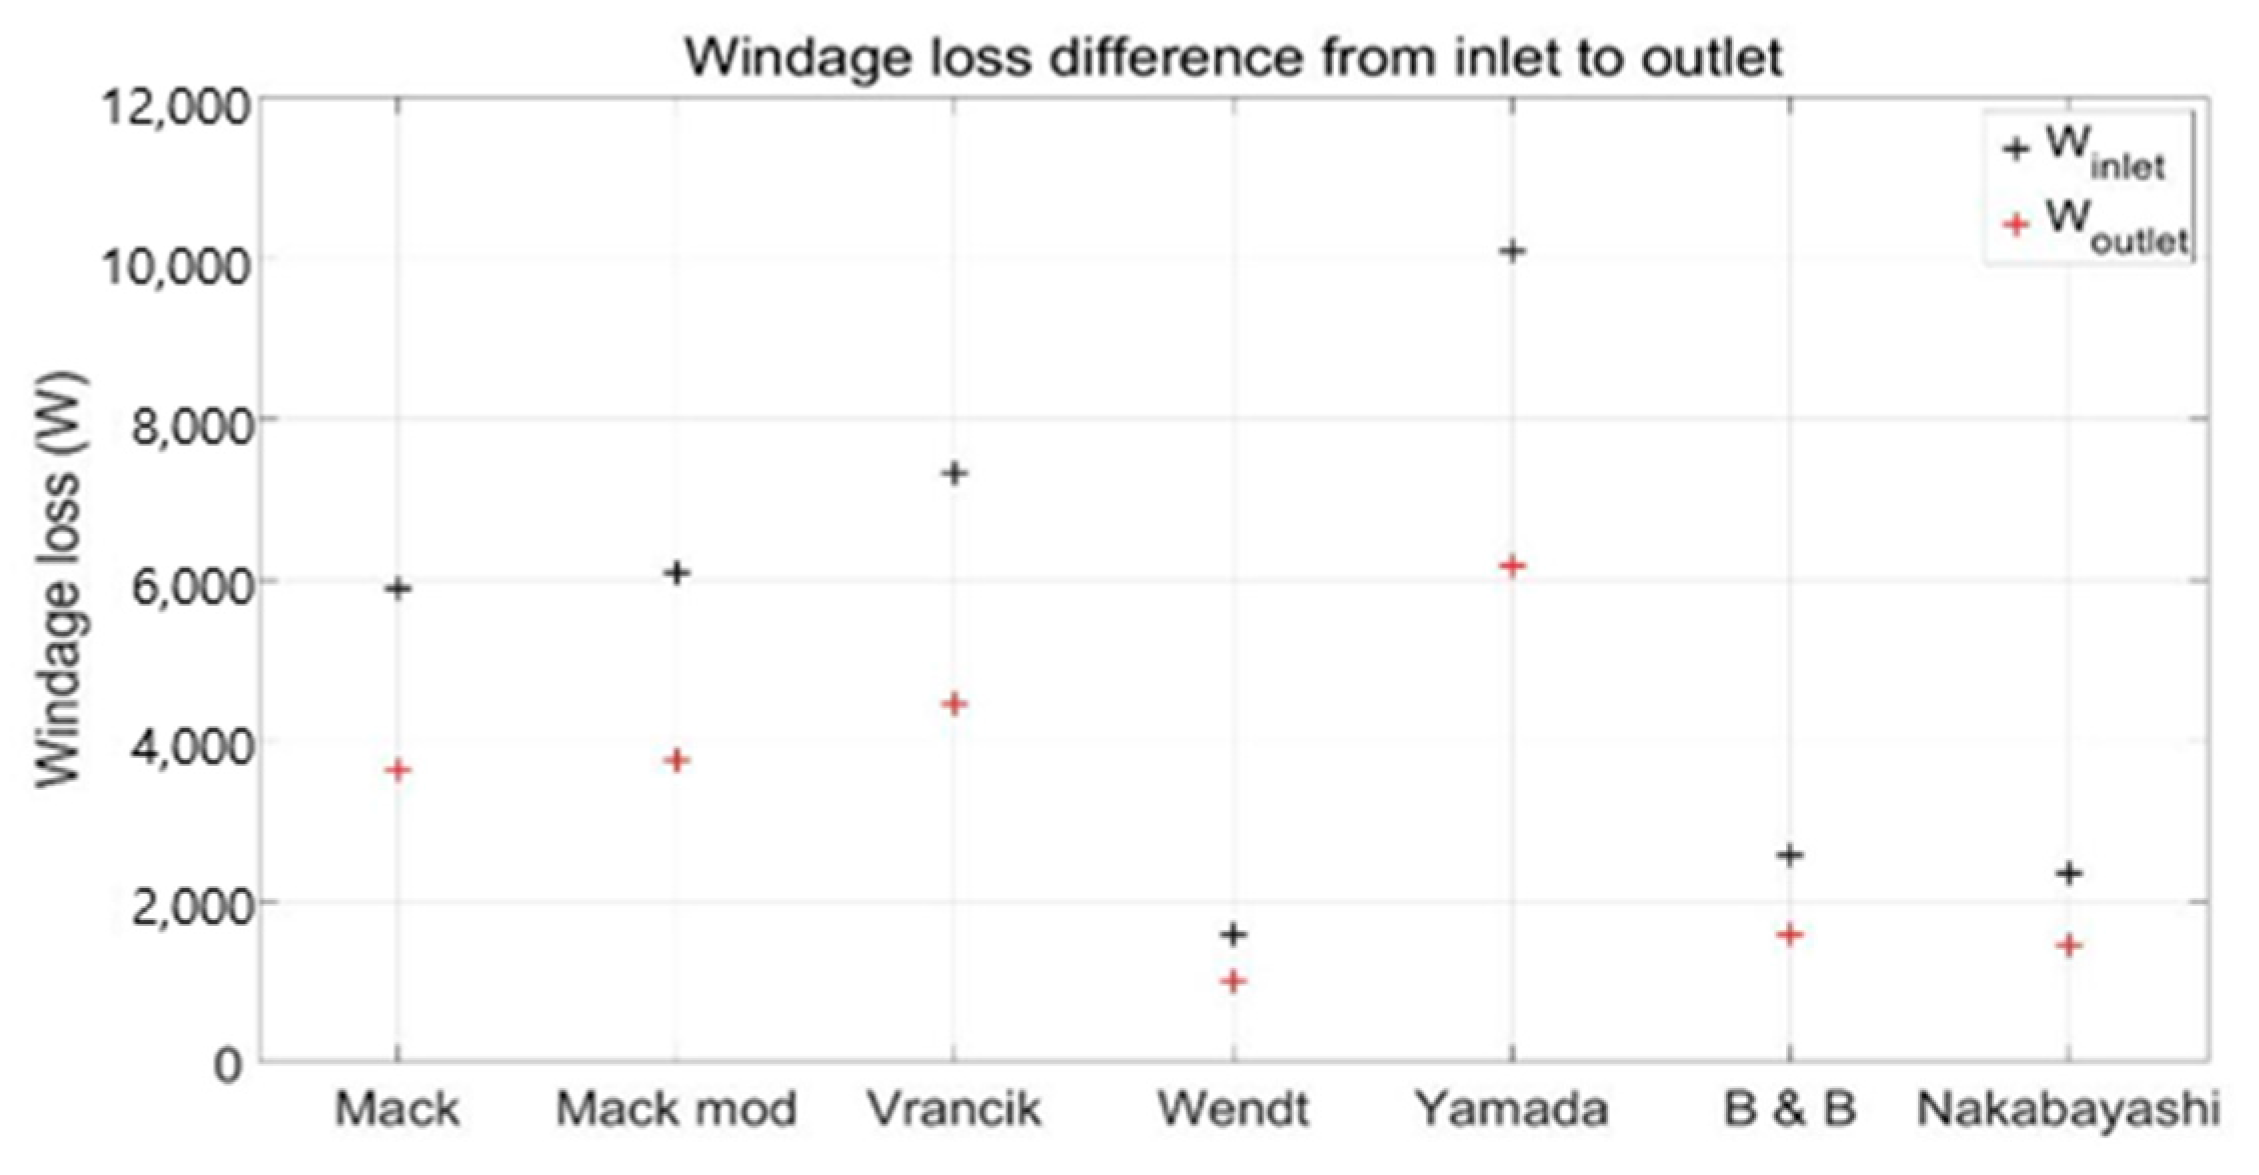
Figure 9.
Inlet-to-outlet density ratio of the S-CO2 windage loss test.

Figure 10.
Measured windage loss vs. Taylor number.

Figure 11.
Measured windage loss vs. Taylor number and .

Figure 12.
Measured windage loss vs. calculated windage loss from new model for supercritical phase.
Figure 12.
Measured windage loss vs. calculated windage loss from new model for supercritical phase.
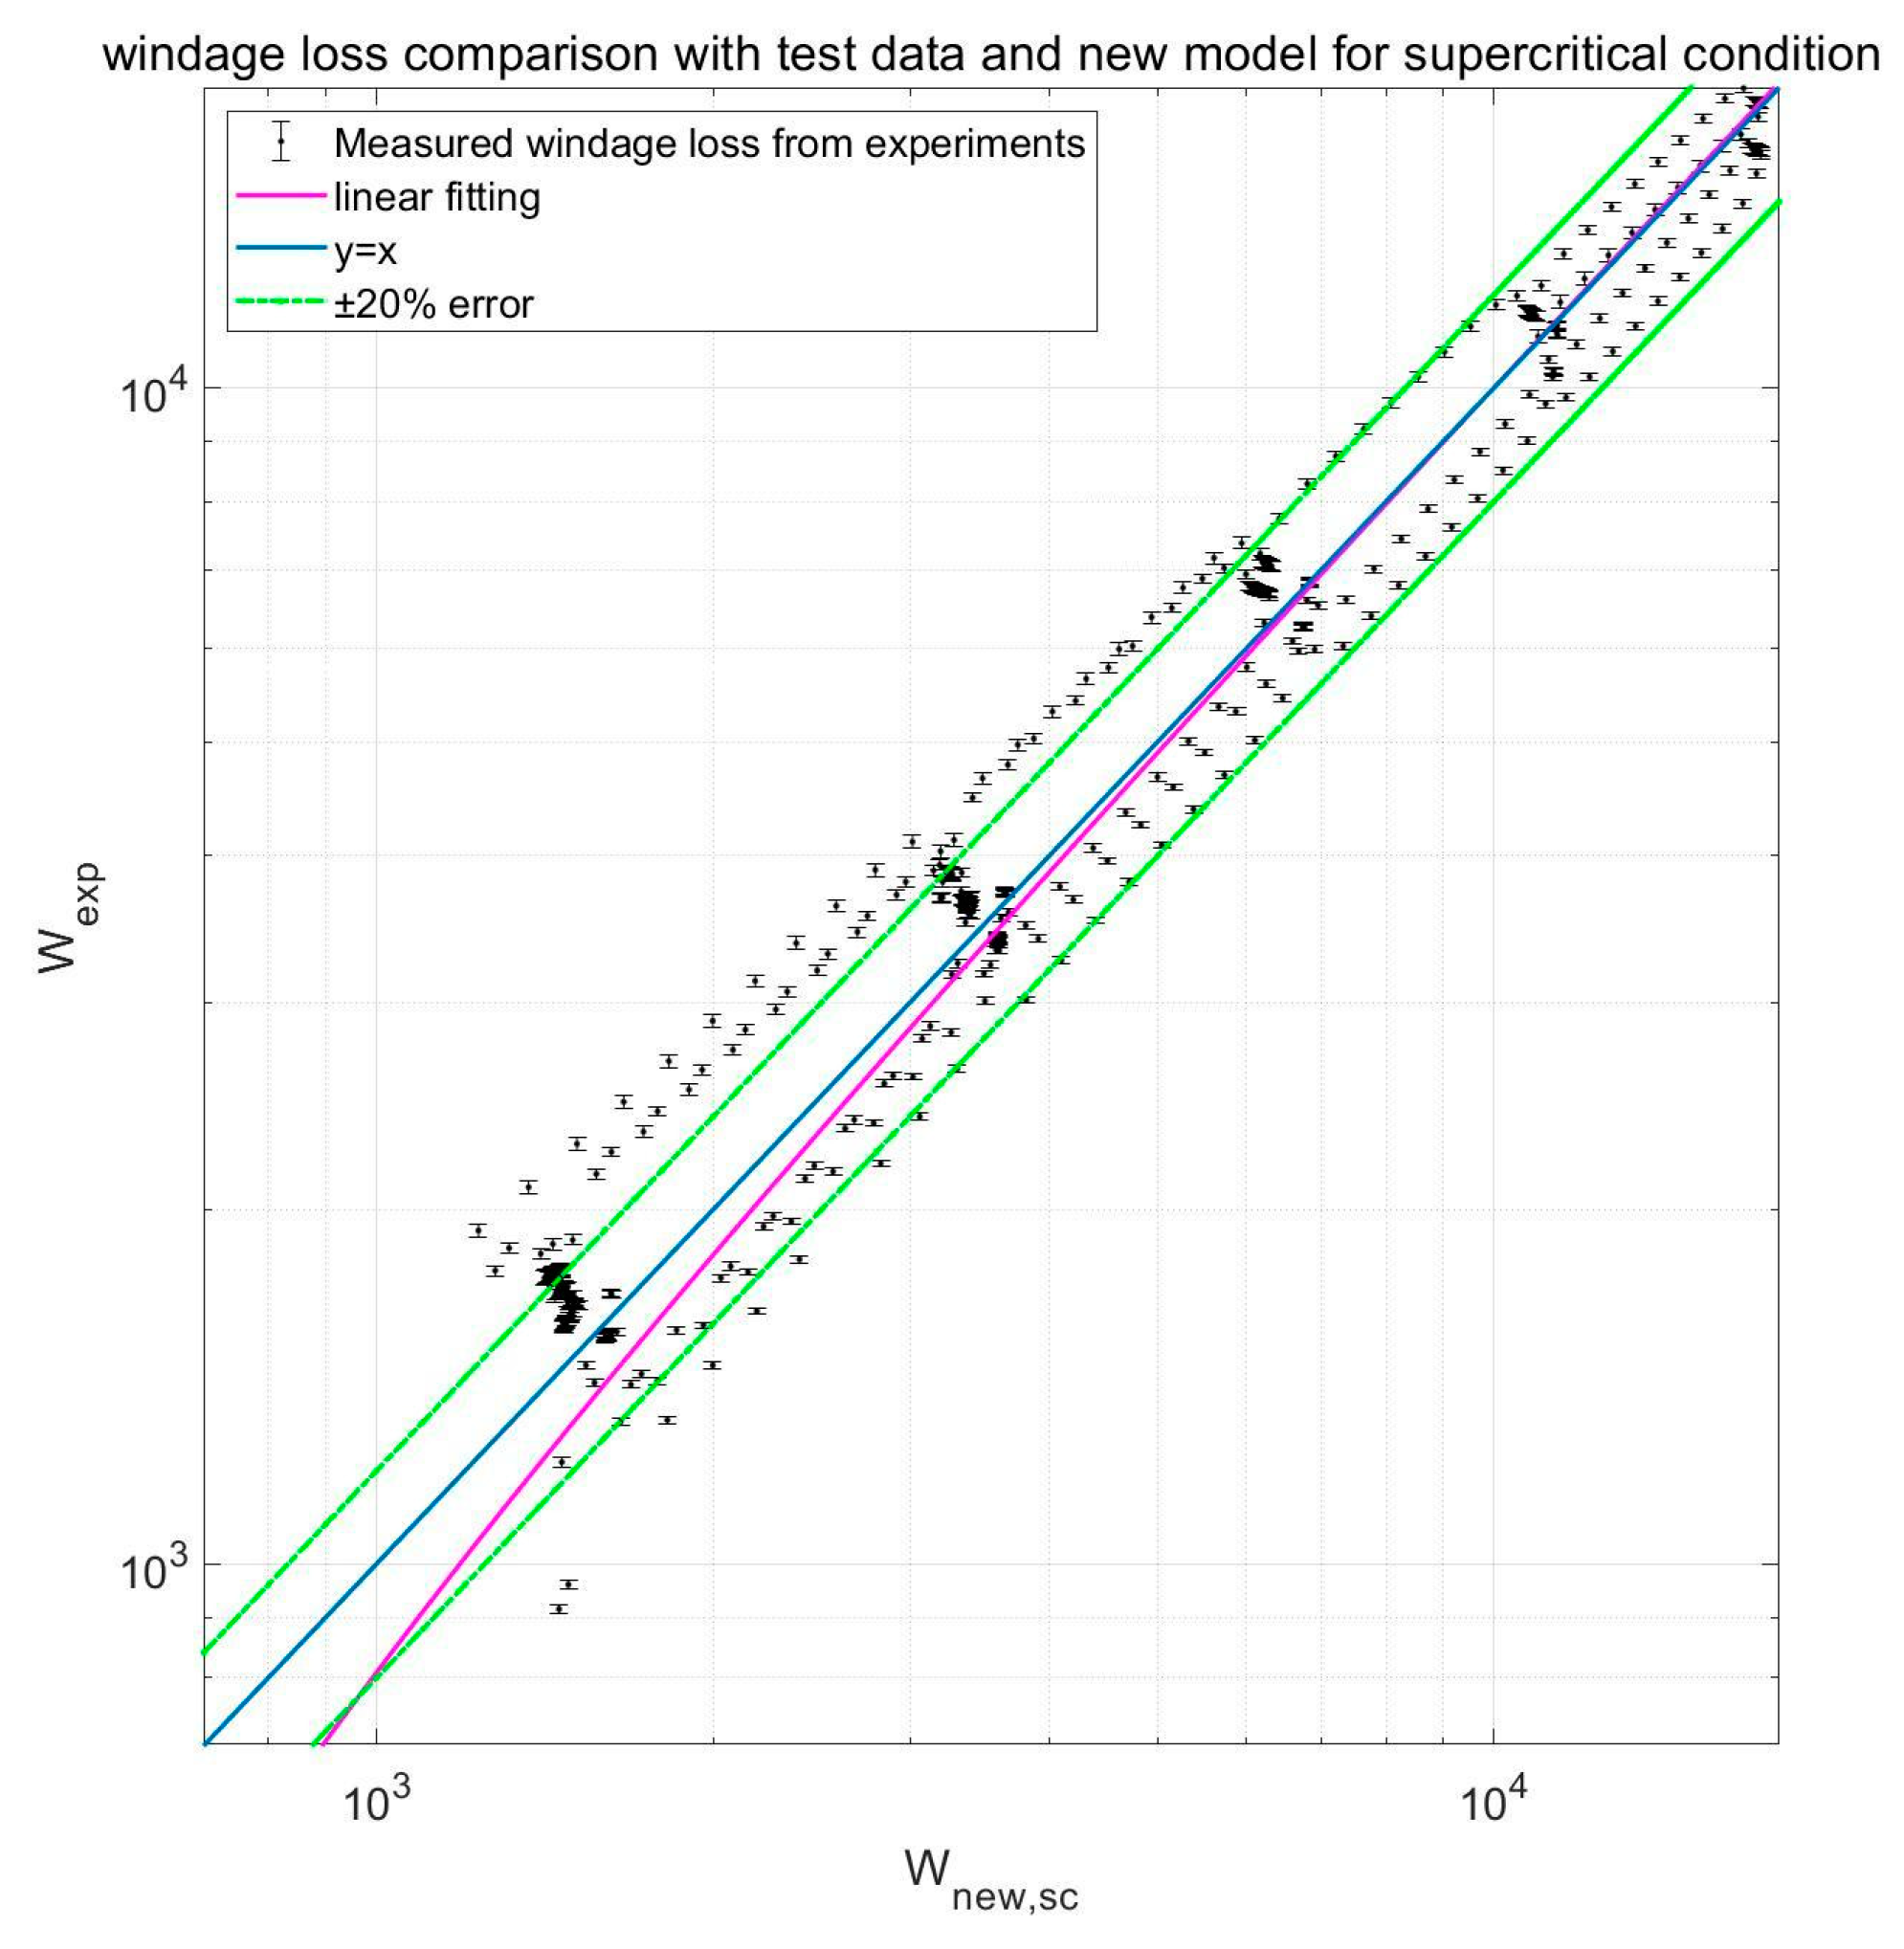
Figure 13.
Measured windage loss vs. calculated windage loss from new model for superheated gas phase.
Figure 13.
Measured windage loss vs. calculated windage loss from new model for superheated gas phase.
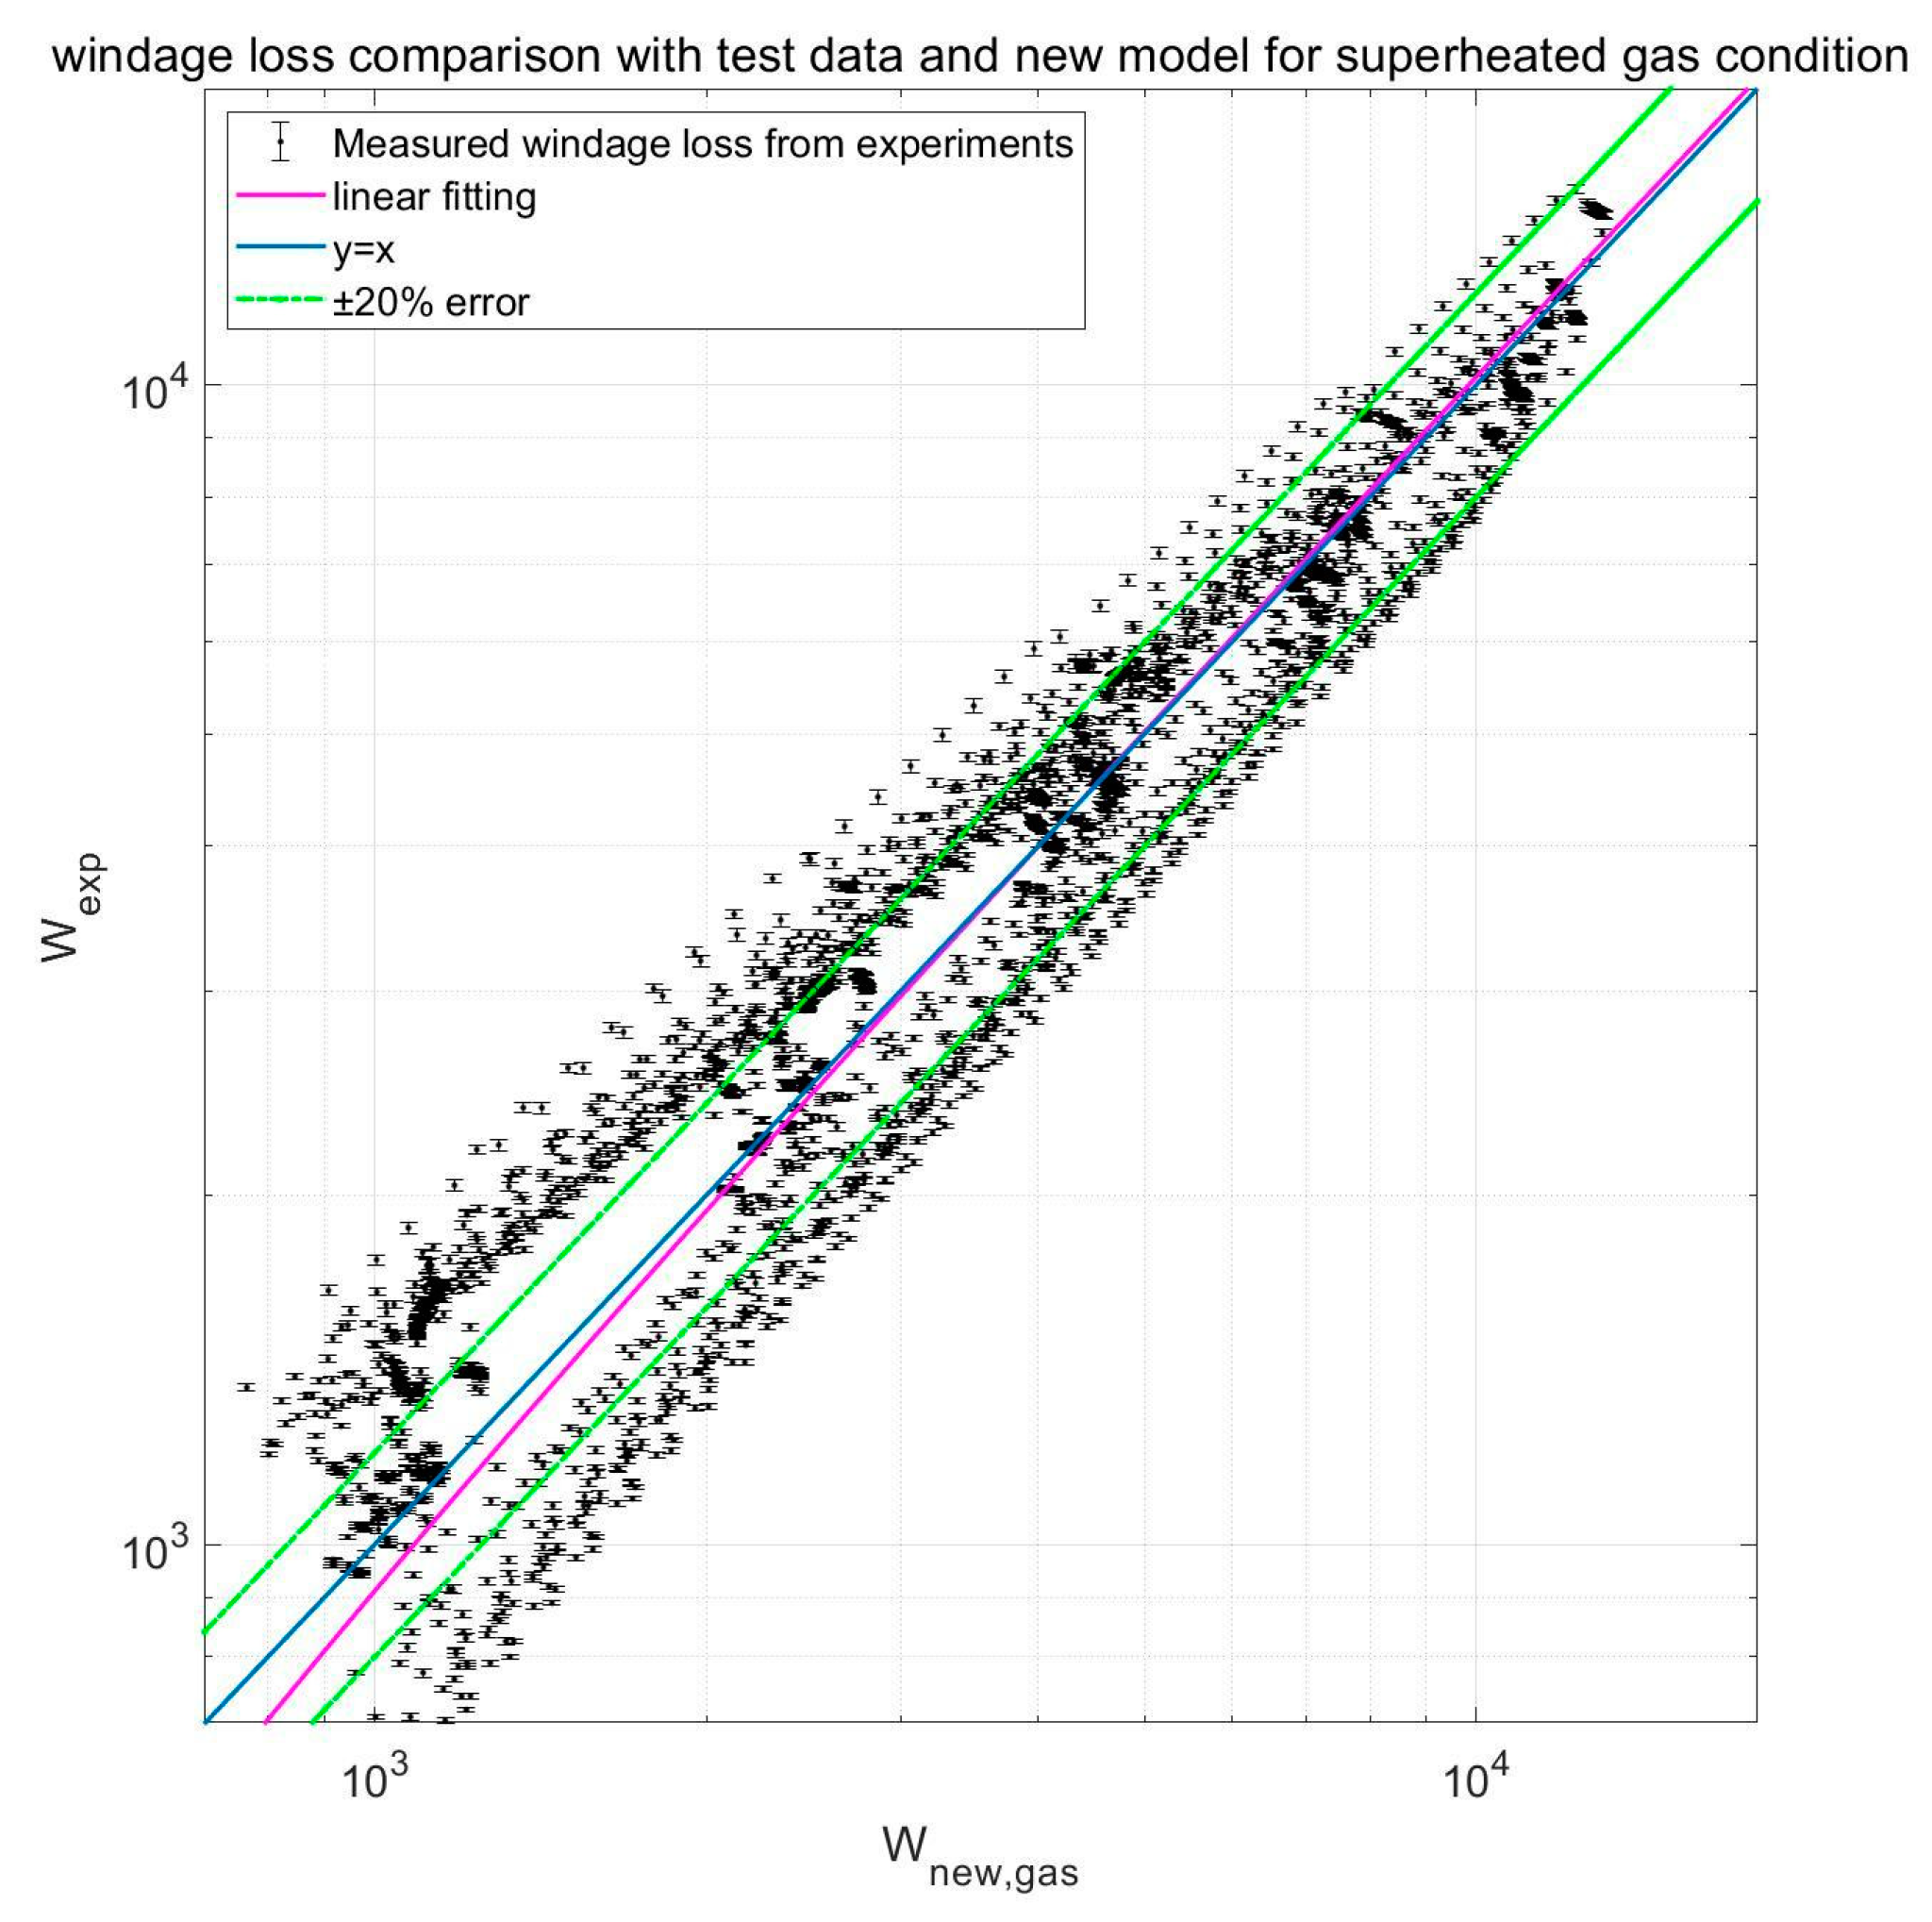
Figure 14.
Measured windage loss vs. calculated windage loss from the second new model for the supercritical phase.
Figure 14.
Measured windage loss vs. calculated windage loss from the second new model for the supercritical phase.
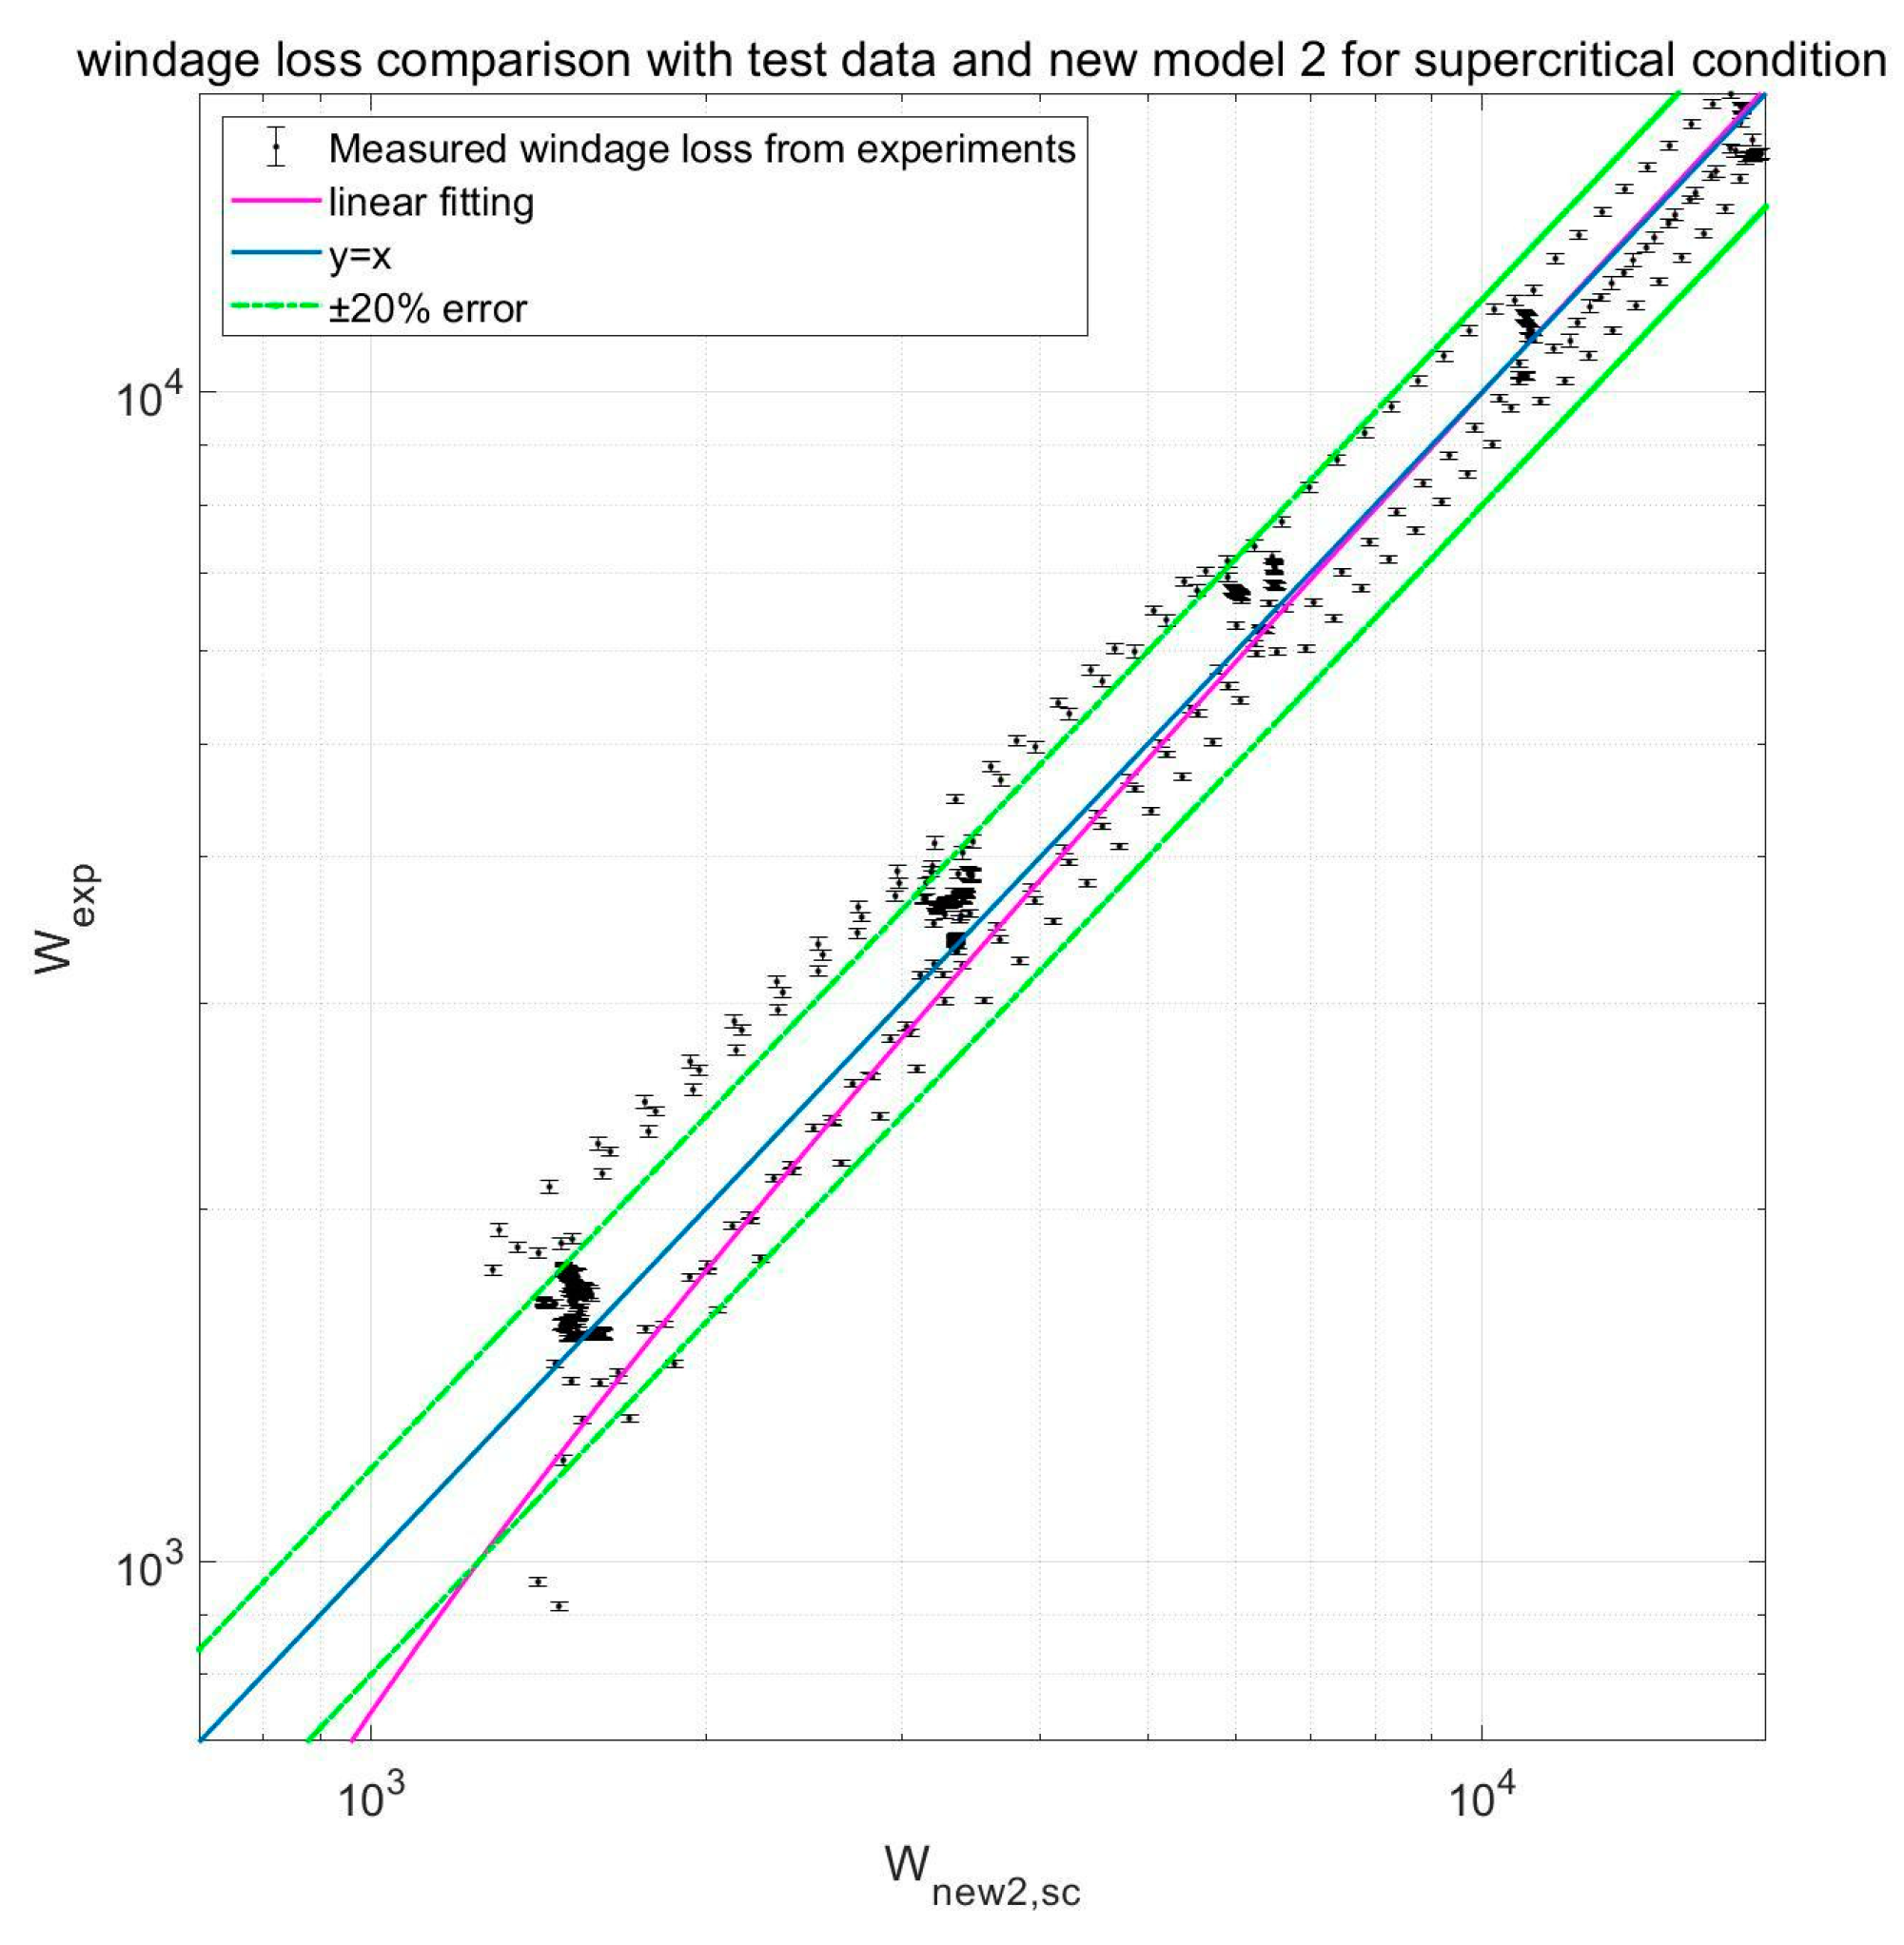
Figure 15.
Measured windage loss vs. calculated windage loss from the second new model for the superheated gas phase.
Figure 15.
Measured windage loss vs. calculated windage loss from the second new model for the superheated gas phase.
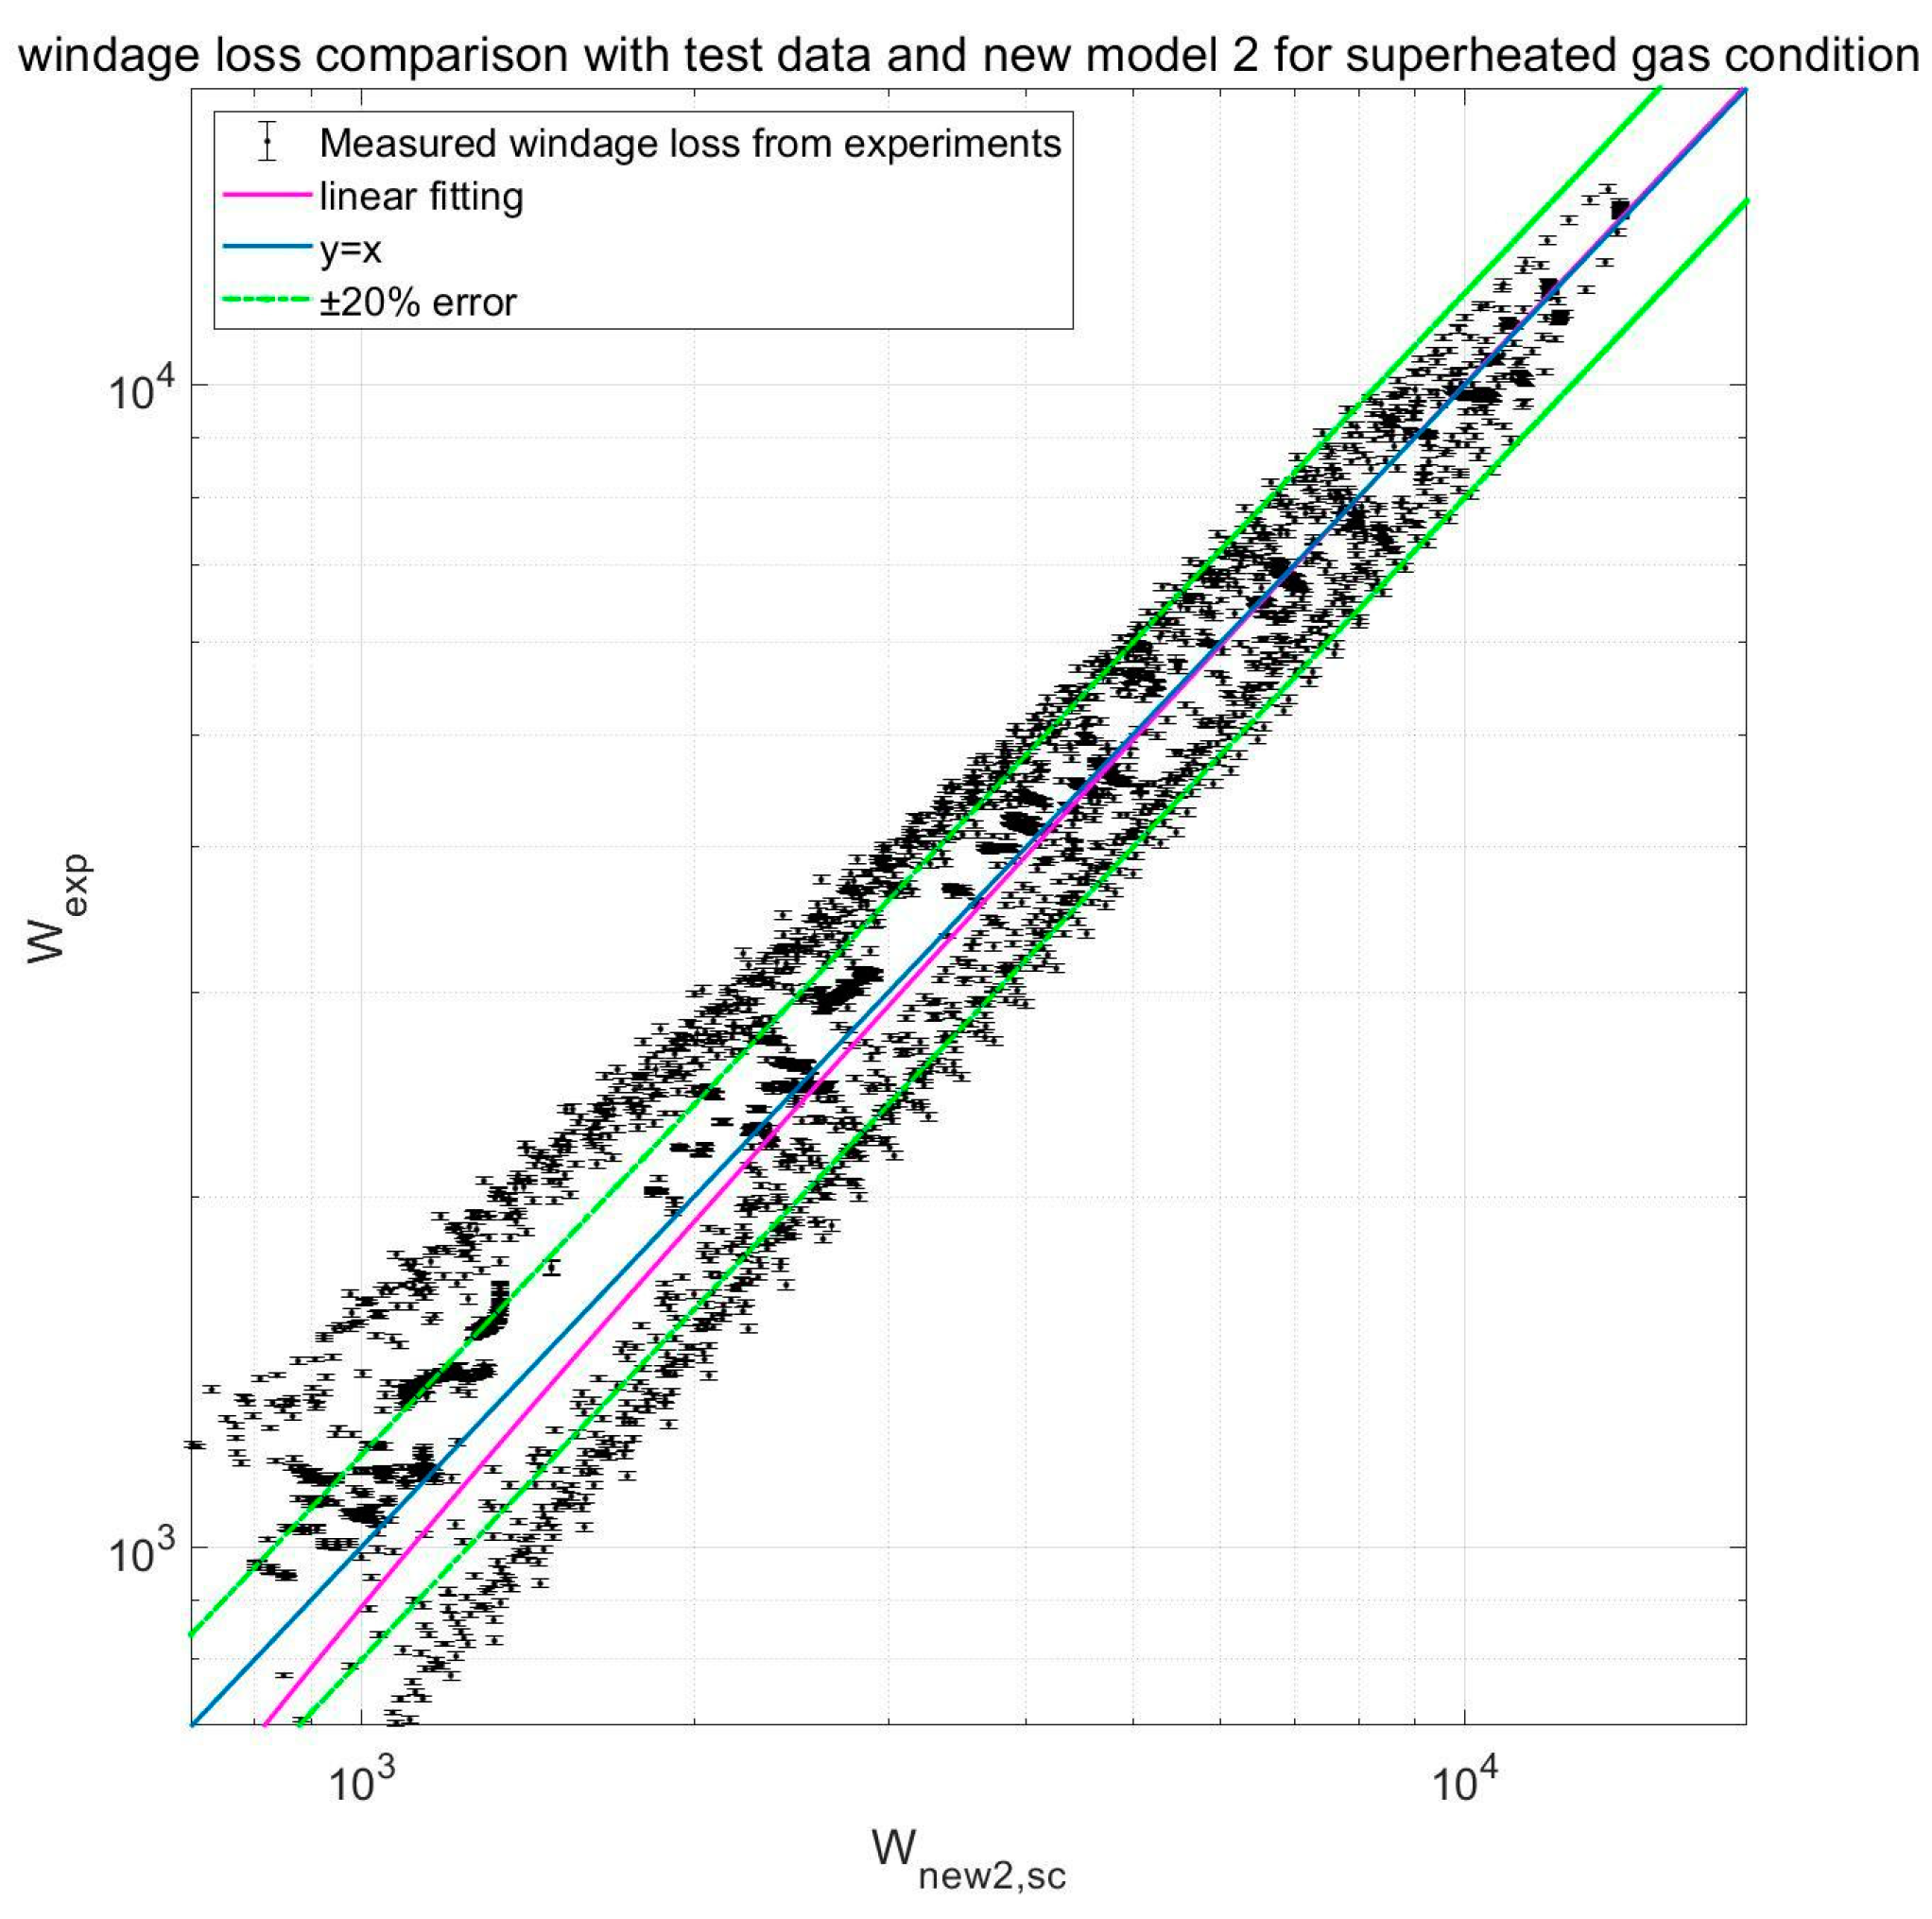
Table 1.
Uncertainty of measurement from S-CO2 windage loss test.
| Measurement Devices | |
|---|---|
| Pressure transmitter (Rosemount 3051 s), | : 0.025% |
| Temperature transmitter (RTD, A class), | : 0.2% 0.015 K |
| Power analyzer (Yokogawa WT 3000), | : 0.02% |
| Shaft length tolerance, | : 0.03 mm |
| Shaft radius tolerance, | : 0.02 mm |
Table 3.
The R2 value of existing models for measured S-CO2 windage loss.
| Empirical Models | R2 Value |
|---|---|
| Mack | 0.8604 |
| Vrancik | 0.7133 |
| Wendt | −6.2276 |
| Yamada | −31.8137 |
| Bilgen and Boulos | −0.4311 |
| Nakabayashi | −0.7444 |
Disclaimer/Publisher’s Note: The statements, opinions and data contained in all publications are solely those of the individual author(s) and contributor(s) and not of MDPI and/or the editor(s). MDPI and/or the editor(s) disclaim responsibility for any injury to people or property resulting from any ideas, methods, instructions or products referred to in the content. |
© 2023 by the authors. Licensee MDPI, Basel, Switzerland. This article is an open access article distributed under the terms and conditions of the Creative Commons Attribution (CC BY) license (https://creativecommons.org/licenses/by/4.0/).
Share and Cite
MDPI and ACS Style
Kim, D.; Jeong, Y.; Son, I.W.; Lee, J.I. A New Windage Loss Model for S-CO2 Turbomachinery Design. Appl. Sci. 2023, 13, 7463. https://doi.org/10.3390/app13137463
AMA Style
Kim D, Jeong Y, Son IW, Lee JI. A New Windage Loss Model for S-CO2 Turbomachinery Design. Applied Sciences. 2023; 13(13):7463. https://doi.org/10.3390/app13137463
Chicago/Turabian StyleKim, Dokyu, Yongju Jeong, In Woo Son, and Jeong Ik Lee. 2023. "A New Windage Loss Model for S-CO2 Turbomachinery Design" Applied Sciences 13, no. 13: 7463. https://doi.org/10.3390/app13137463
Note that from the first issue of 2016, this journal uses article numbers instead of page numbers. See further details here.