Article

Convective–Microwave–IR Hybrid Drying of Kaolin Clay—Kinetics of Process

Division of Process Engineering, Institute of Chemical Technology and Engineering, Poznan University of Technology, ul. Berdychowo 4, 60-965 Poznań, Poland
*
Author to whom correspondence should be addressed.
Appl. Sci. 2023, 13(13), 7451; https://doi.org/10.3390/app13137451
Submission received: 31 May 2023 / Revised: 13 June 2023 / Accepted: 22 June 2023 / Published: 23 June 2023
(This article belongs to the Special Issue Applied Geochemistry and Clay Science II)

Abstract

:
Kaolin clay is one of the essential components of utility and technical ceramic products. Drying is one of the stages of its production and is crucial for the quality of the obtained products. Due to the low energy efficiency of the dryers, it is also one of the most energy-intensive operations performed not only in the production of ceramics but in the industry as a whole. For this reason, modern drying techniques are sought. They are required to be energy efficient, sustainable and produce high-quality products. An example is the so-called hybrid drying, which combines several drying techniques (energy sources) into one process. The aim of this work was to determine the impact of microwave and infrared radiation on the kinetics and energy consumption of convective drying of kaolin clay and the quality of the products. The interaction of convective, microwave and infrared drying was investigated. Drying times, energy consumption and visual quality were compared for the tested processes. The fastest process was convection–microwave drying, where a reduction in drying time of 70% and energy consumption of 50% was observed. Unfortunately, intensive drying had a negative impact on the quality of the products (numerous cracks on the side surface). The best drying methods are those that use all energy sources simultaneously and periodically. Hybrid processes that use all energy sources in a periodic manner had the greatest efficiency. The drying time in these programs was shortened in relation solely to the convection process by 45 to 50% while reducing energy consumption by 3–18%. The product had the best quality.

1. Introduction

Ceramic materials are widely used in many fields, for example in the construction industry (bricks, roof tiles), the electrical industry (insulators), as sanitary or tableware. The basic method of producing ceramics consists of the following processes: mixing raw materials with water, casting or forming the product, drying and firing [1]. The drying step is particularly important, as a material that is not sufficiently dried would be destroyed during firing. Since wet material is subject to shrinkage during drying, it can also be deformed or cracked.
The basic method for drying ceramic materials is convection drying. The energy needed to heat the material and evaporate the moisture is supplied by hot air flowing past the material to be dried. This method of heat exchange is inefficient because a lot of energy is lost along with the air flowing out of the dryer. Therefore, the main disadvantages of convective drying of ceramic materials are that the process is slow, time-consuming and energy-consuming [1]. This is the reason why methods of speeding up the process or replacing the convective heat supply with other more efficient methods are sought.
One possibility is to use thermal radiation [1]. The electromagnetic wave range of thermal radiation is 0.1–100 μm. The infrared radiation (IR) range is 0.75–100 μm. Therefore, this range is used most frequently for heat transfer, also in drying [2]. Infrared heating consists of absorbing the electromagnetic wave on the surface of the dried body. Therefore, IR radiation is used primarily to dry materials in the form of a thin layer, for example, paper, paints, coatings, adhesives, ink, textiles, board [2]. In recent years, IR drying research has been extended to food. Thermal radiation has been shown to be successfully used for carrot [3], paddy [4], sweet potato [5] and mushroom [6] drying. It is obvious that, in the case of IR drying, for the process to be efficient, the surface of the material must be characterized by high absorptivity and low reflectivity.
Another possibility of supplying energy to the dried material is to use microwave heating [1]. This method of heating results from the dissipation of electromagnetic wave energy. Microwaves interact with dipole water molecules, making them vibrate. The energy of the vibrations is damped by viscous interactions and converted to heat [7]. The main advantages of microwave drying result from the direct application of heat to the moisture within the material. Thanks to this, heating can be fast and efficient with low energy losses. The operation and control of microwave drying are easy. However, microwave drying also has disadvantages. The efficient supply of energy to the inside of the dried material can cause the evaporation of moisture inside the material, causing an increase in pressure, resulting in its destruction [8]. It should also be taken into account that the microwave field generated inside the dryer is nonuniform. Industrially, microwave drying is used, among others, for lumber, textiles, paper, automobile tires and food drying [7]. Research also includes the drying of ceramics [9,10,11,12].
Hammouda and Mihoubi [13] investigated the drying of kaolin bricks numerically and compared three drying methods: convection, convection–microwave and convection–infrared. As a result of the calculations, they found that the fastest method is convection–infrared drying; however, this method can cause the greatest damage to the material. Convection–microwave drying turned out to be slightly slower than convection–infrared drying but much faster than convection drying. Since the stresses obtained as a result of convection–microwave drying were the lowest of the tested processes, this type of drying was considered the best.
Investigations of hybrid drying processes involving a combination of microwave and infrared heating of the material were carried out in several works [14,15,16,17,18]. All these works concern food drying. Aydogdu et al. [16] used the microwave–infrared method to dry eggplant; Łechtańska et al. [14] used the convection–microwave–infrared method to dry green peppers; Saengrayap et al. [15], Si et al. [17] and Chayjan et al. [18] used the microwave–infrared–vacuum method to dry red chili, raspberry and zucchini, respectively. All authors showed a positive effect of the hybrid combination of drying techniques on the process time and the quality of the product.
The aim of this work is to investigate how the use of hybrid drying techniques affects the kinetics of the process and the quality of the tested ceramic materials. For this purpose, the drying of a kaolin cylinder using convection, convection–microwave, convection–infrared and convection–microwave–infrared heating was experimentally tested. Seven different processes were tested. As a result of the research, it was shown that the most effective method results from the combination of all three energy sources; meanwhile, due to the quality of the product, the energy should be supplied periodically. The novelty of the work is the use of a hybrid drying technique, which combines the classic convection technique with modern microwave and IR technology. As a result of the research, it was found that the best method of drying is the use of all three energy sources simultaneously, with microwaves and IF used periodically. This method of drying ensures shortening of the process time, reduction in energy consumption and appropriate product quality.

2. Materials and Methods

2.1. Material

Kaolin-clay-type KOC delivered by SURMIN KAOLIN S.A. (Nowogrodziec, Poland) was used as the experimental material. The chemical composition of the kaolin is presented in Table 1.
The clay mass was prepared by mixing an appropriate amount of dry kaolin and distilled water, so that the initial moisture content of the material was approximately 30%. This material was stored in a closed box for 24 h to unify the moisture distribution inside. Next, cylindrical samples of 0.06 m diameter and 0.06 m height were extruded with the use of polypropylene form. Samples prepared in this way were dried to a constant mass.

2.2. Drying Procedures

All drying tests were carried out in a laboratory hybrid dryer, whose scheme and view are presented in Figure 1. This apparatus allows simultaneous drying using three different techniques:
  • convective—hot air;
  • microwave;
  • infrared.
Figure 1. Schematic and photo of the hybrid dryer: 1—computer, 2—controller, 3—IR heater, 4—pyrometer, 5—drying chamber, 6—air heating system, 7—microwave generation system, 8—balance, A, B, C—temperature, velocity and RH of air measurement points.
Applsci 13 07451 g001
The hot air for convective drying is provided by the air heating system (6) consisting of the electric heater (P = 2 kW) and fan (P = 1 kW). A microwave with a frequency of 2450 MHz is produced by the water-cooled magnetron (7), which works in continuous wave (CW) mode. The power of the microwaves is adjusted by the plate current from 100 to 500 W (effective power). The IR electric heater (3), located about 150 mm above the ceramic pan, supplies the IR radiation directly to the sample surface. The power of the IR may be set to 100 and 250 W. A balance (8), type WPS 2100/C/1 (precision 0.01 g), produced by Radwag (Radom, Poland), was used to measure the reduction in the sample mass during the process. The temperature of the sample surface was measured using a pyrometer (4), MI model (precision 1 °C), produced by Raytek (Wilmington, NC, USA) and placed in the corner of the dryer chamber. The pyrometer is a non-contacting device, which intercepts and measures the thermal radiation emitted by the material. Air velocity was measured with the use of a hot wire anemometer, model CTV 100 (precision 0.1 m/s), produced by KIMO (Toronto, ON, Canada). The relative humidity (RH) of the air used for drying was measured with a humidity and temperature transmitter, model Hygrotest 600 DHT-20/120, produced by Testo (Titisee Neustadt, Germany). The air RH ranged between 20 and 22%, that is, 21% on average. The electrical network analyzer, model MPR53S, produced by Entes (Istanbul, Turkey), was used to measure the energy consumption (EC) during each process (precision 0.1 kWh). The drying process was controlled by the industrial PLC controller (2). All the measured parameters were recorded throughout the whole process and stored on a standard personal computer (1) equipped with data acquisition software.
The software controlling and collecting the research data was provided by the dryer manufacturer, Ertec-Poland (Wrocław, Poland). The program was written in C++ and enables the setting of process parameters, such as the temperature and rate of air, the microwave power, the duration of the IR power, drying phase, the end condition of the drying phase and data sampling frequency. It also conducts a fully automatic acquisition of experimental data, such as sample temperature and mass, temperature, flow rate, drying air humidity and reflected power of the microwaves.
During the research, 7 different drying schedules were tested experimentally. The following settings of drying parameters were chosen:
  • air temperature Ta = 85 °C;
  • air flow velocity va = 1.2 m/s;
  • microwave power PMW = 100 W (if used);
  • infrared power PIR = 250 W (if used).
Detailed description of the drying schemes is given in Table 2.
Based on mass measurement, the dry basis moisture content MCdb (−) and drying rate DR (g/min) at a given time of the process were calculated in accordance with the following equations:
MC db   i = m i m s / m s ,
DR i = ( m i 1 m i ) / ( t i t i 1 ) ,
where mi is the mass of sample (g) at ti (min) of the process; ms is the dry matter mass (g).
The measured energy consumption was recalculated to specific energy consumption SEC, that is, energy (MJ) consumed per each gram of evaporated moisture:
SEC = 3.6 · ( EC / Δ m ) ,
where EC is the energy consumption (kWh), and Δm is the mass of evaporated moisture (g).
The kinetics of each process was assessed on the basis of the plots of moisture content, temperature of the sample surface and drying rate versus time. The quality of the obtained products was visually assessed and presented in a digital photograph.

2.3. Determination of the Drying Constant

To compare the examined processes’ effectiveness from the point of view of their kinetics, the drying constant k was evaluated. For this purpose, it is assumed that the rate of evaporation of moisture from the dried material is proportional to the difference between the current mass of moisture m m and the mass of equilibrium moisture m me :
dm m dt = k ( m m m me )
Because the moisture mass is equal to the difference between sample mass and dry sample mass m m =   m m s , Equation (4) could be rewritten in the following form:
dm dt = k ( m m e )
where m e is the equilibrium mass of the sample. The solution of Equation (5) has the following form:
m = m e + Aexp ( kt )
The value of the drying constant k can be determined by approximating the experimentally obtained drying curves with the exponential curve (6).

2.4. Formal Analysis

All processes were carried out in triplicate. The presented data are the average with standard deviation. Numerical analysis was carried out in Origin(Pro), Version 2023b (OriginLab Corporation, Northampton, MA, USA).

3. Results and Discussion

3.1. Kinetics of Process and Quality of Products

In the first part of research, pure convective drying was performed. The drying kinetics and the appearance of the sample after drying are presented in Figure 2. The characteristic periods of the convective process, namely, preheating (Figure 2a), the constant drying rate period CDRP (2) and falling drying rate period FDRP (3), were observed. At the beginning, the material heats up to the so-called wet bulb temperature, losing a negligible part of moisture. The drying rate increases up to ca. 0.4 g/min. When the temperature of the surface reached the temperature of the wet bulb, the first period of drying started. The characteristic of this period is the constant temperature of the material being dried and the almost constant rate of moisture evaporation (linear change in moisture content over time). The constant temperature of the material, despite the continuous supply of thermal energy, is the result of the high moisture content and effective transport from the inside to its surface. It is often assumed that the surface of the material is covered with a liquid film during this period, and the drying process can be considered as evaporation from the free surface. Due to the constant value of the heat of evaporation, the rate of drying is determined by the amount of energy supplied to the surface and factors of external resistance related to the removal of evaporated moisture from the surface of the material to the core of the drying agent. As drying proceeds and the material’s moisture content decreases, the first dry patches appear on the body’s surface, and its temperature begins to rise. This is due to a decrease in the efficiency of moisture transport inside the material. Because of its small amount, it is no longer able to reach the surface/evaporation front so quickly, which causes heating of the surface. When the temperature of the material begins to increase, the second drying period begins, where the rate of the process diminishes and is limited by internal resistance: diffusion of moisture from the inside of the material to the surface/evaporation front (nonlinear change of moisture content over time). The transition point occurs after crossing the so-called critical moisture content. Taking into account the temperature of the material, the transition point from the CDRP to the FDRP was observed at a moisture content of approximately 0.15. If the drying rate curve is analyzed, it may be stated that its value is not constant and decreases slightly throughout the first period of drying. However, this trend is completely different from the character of the curve for the heating period and the second drying period and can thus be assumed to be constant. A maximum drying rate was observed during CDRP (ca. 0.46 g/min). The drying time was very long (360 min). The quality of the dried samples was very poor, with the upper surface of the sample cracked significantly (Figure 2b).
In the second schedule of drying, pure convective drying was enhanced with microwave energy. Microwave radiation is a very efficient source of energy and heats the dried body in its entire volume, not only from the surface. The moisture evaporates not only on the surface of the body but also inside it. As vapor diffusion is much easier than liquid diffusion, the moisture transport is more efficient, and drying is faster. In addition, the increase in pressure inside the material, caused by the production of vapor, can also lead to nonevaporated moisture being pushed to the surface—the so-called plug flow—which further speeds up the process of drying. All these phenomena accelerate the drying and positively affect the kinetics. The kinetic curves (Figure 3a) clearly indicate a positive influence of the microwaves on the rate of the process. It increased nearly three times and reached a maximal value of ca. 1.2 g/min, which resulted in significant shortening of the drying time to 110 min. Unfortunately, the high drying rate negatively influenced the quality of the material. The samples were cracked not only on their upper surface but also on their lateral surface (Figure 3b). This was caused by the vapor pressure inside the sample.
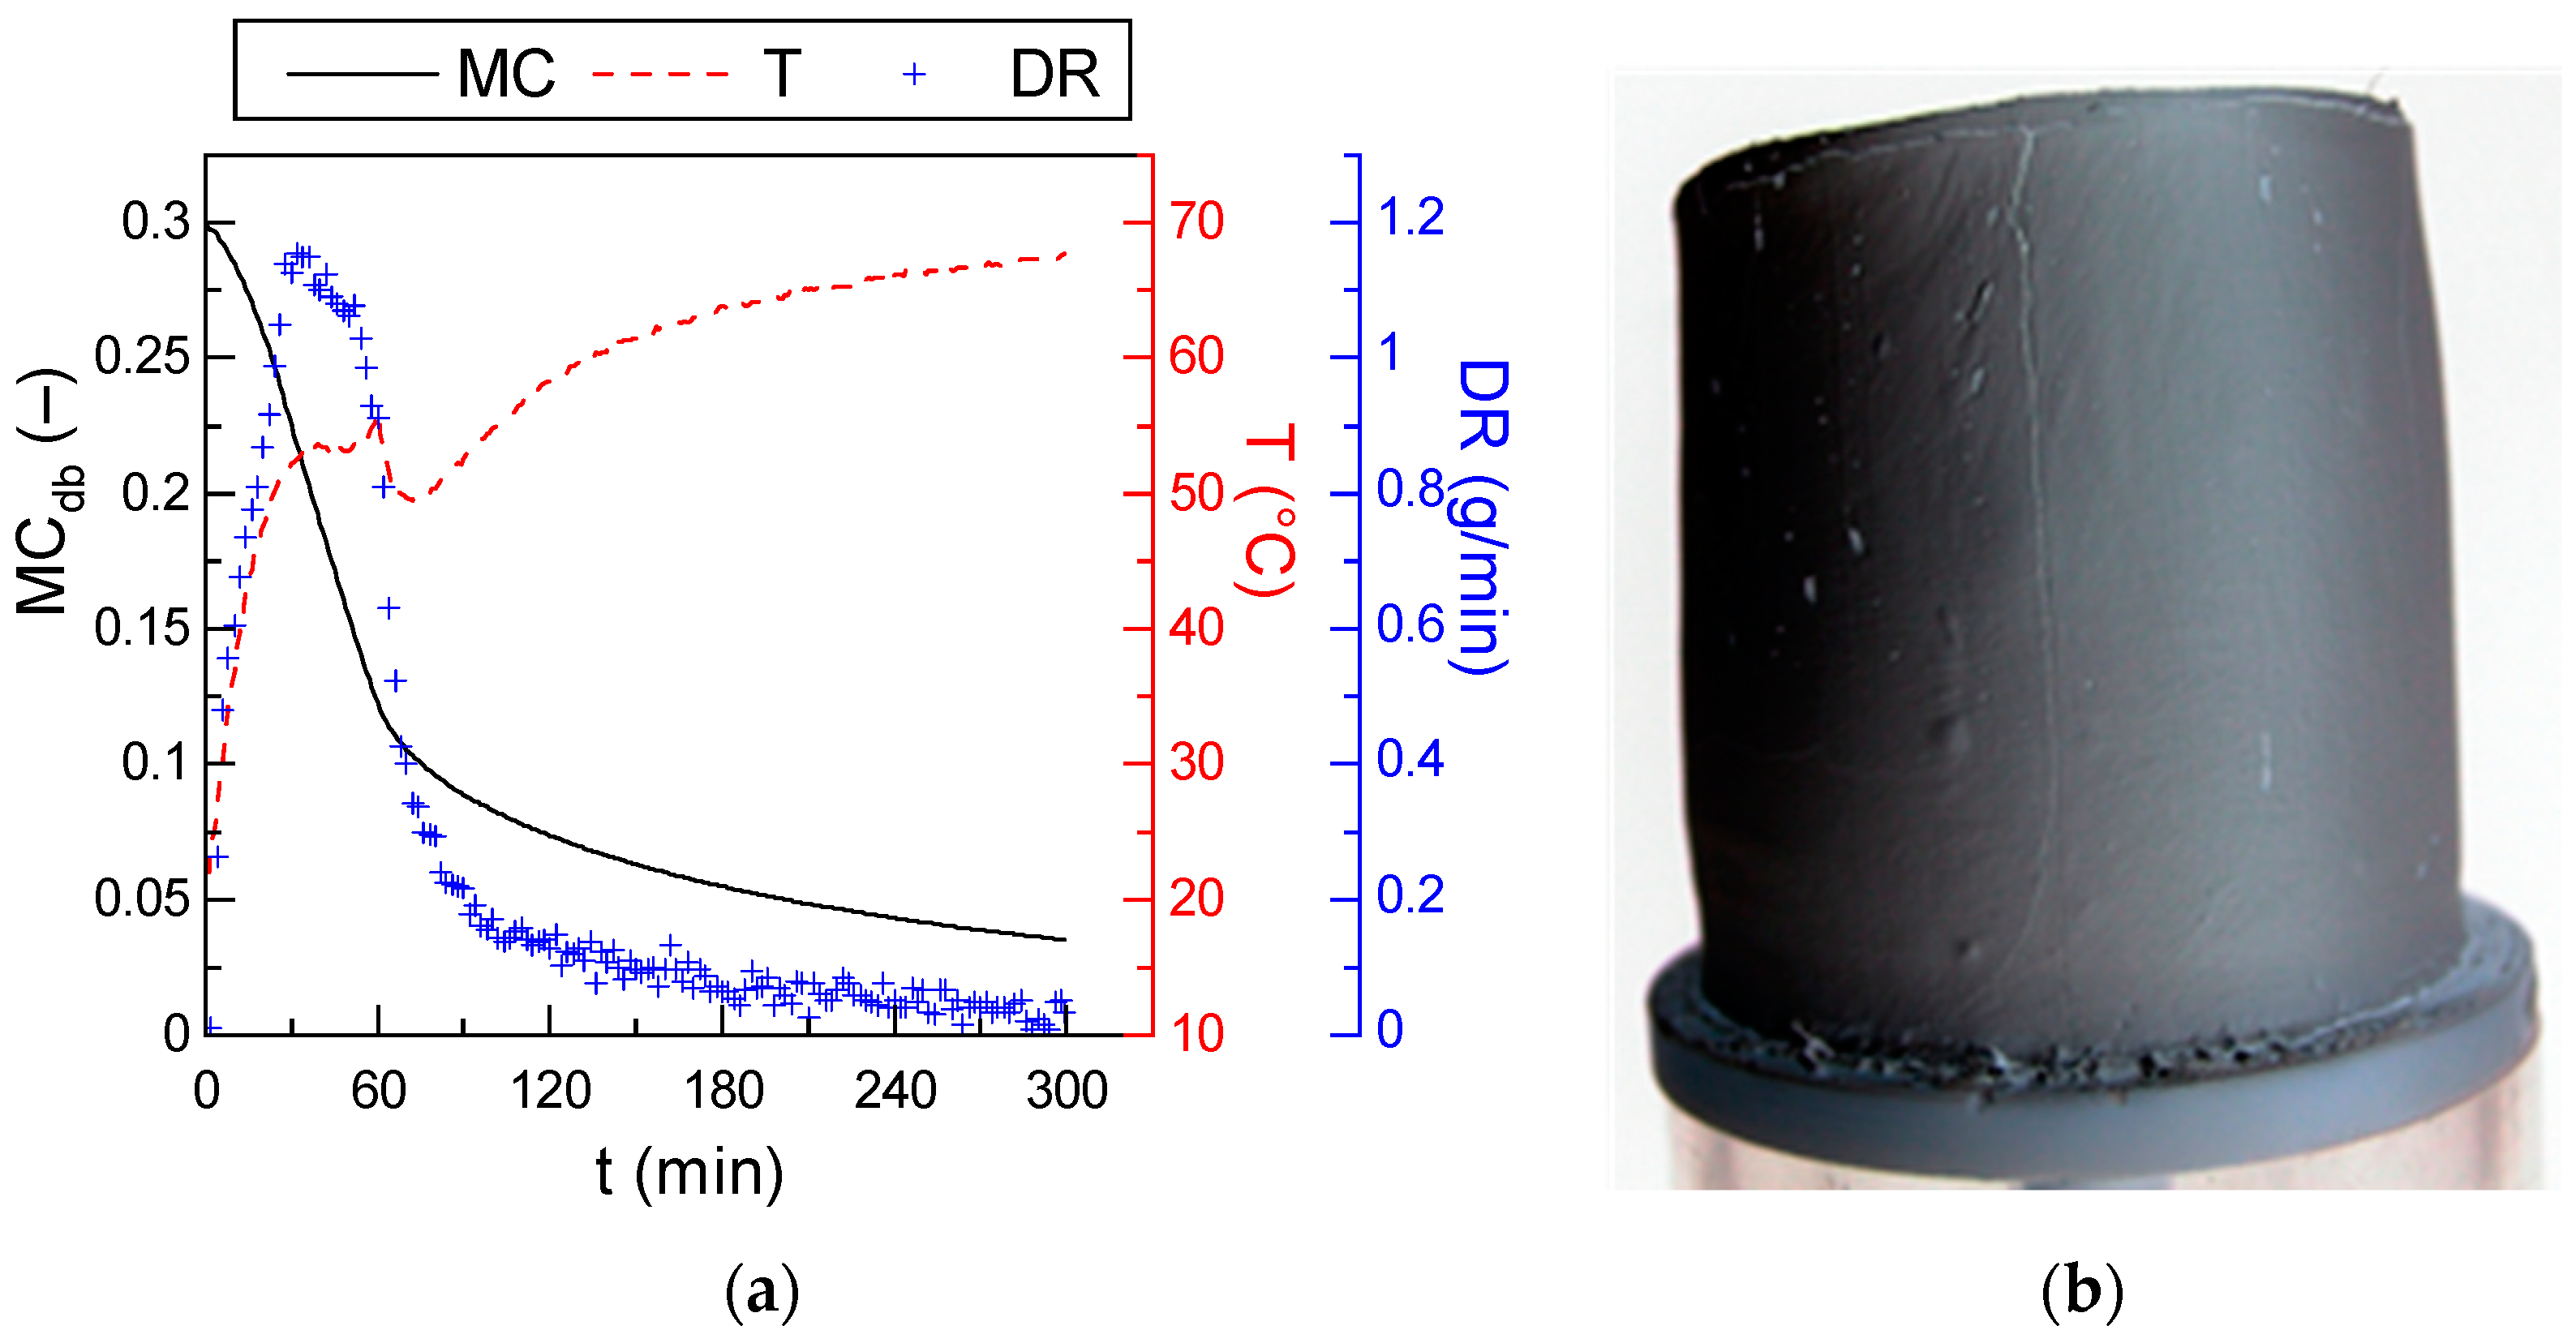
Due to the poor quality of the samples obtained in the previous schedule, in the next schedule of CV + MW60, the duration of microwave exposure was shortened to the first 60 min of the process. This was aimed at utilizing the most effective period of convective microwave drying (increasing and maintaining a high drying rate) and limiting exposure to microwaves when the efficiency of the process decreased (drop in drying rate), as observed in Figure 3a. One can see that the shortening of microwave exposure negatively affected the drying kinetics (Figure 4a). Although the maximum drying rate in this process attained a value similar to one observed previously (1.1 g/min), after switching off the magnetron, it started to decrease rapidly, which led to a very long drying time (approx. 300 min). A positive observation is that the quality of the samples improved slightly compared to previous programs (Figure 4b). The cracks were smaller, and the surface was more uniform.
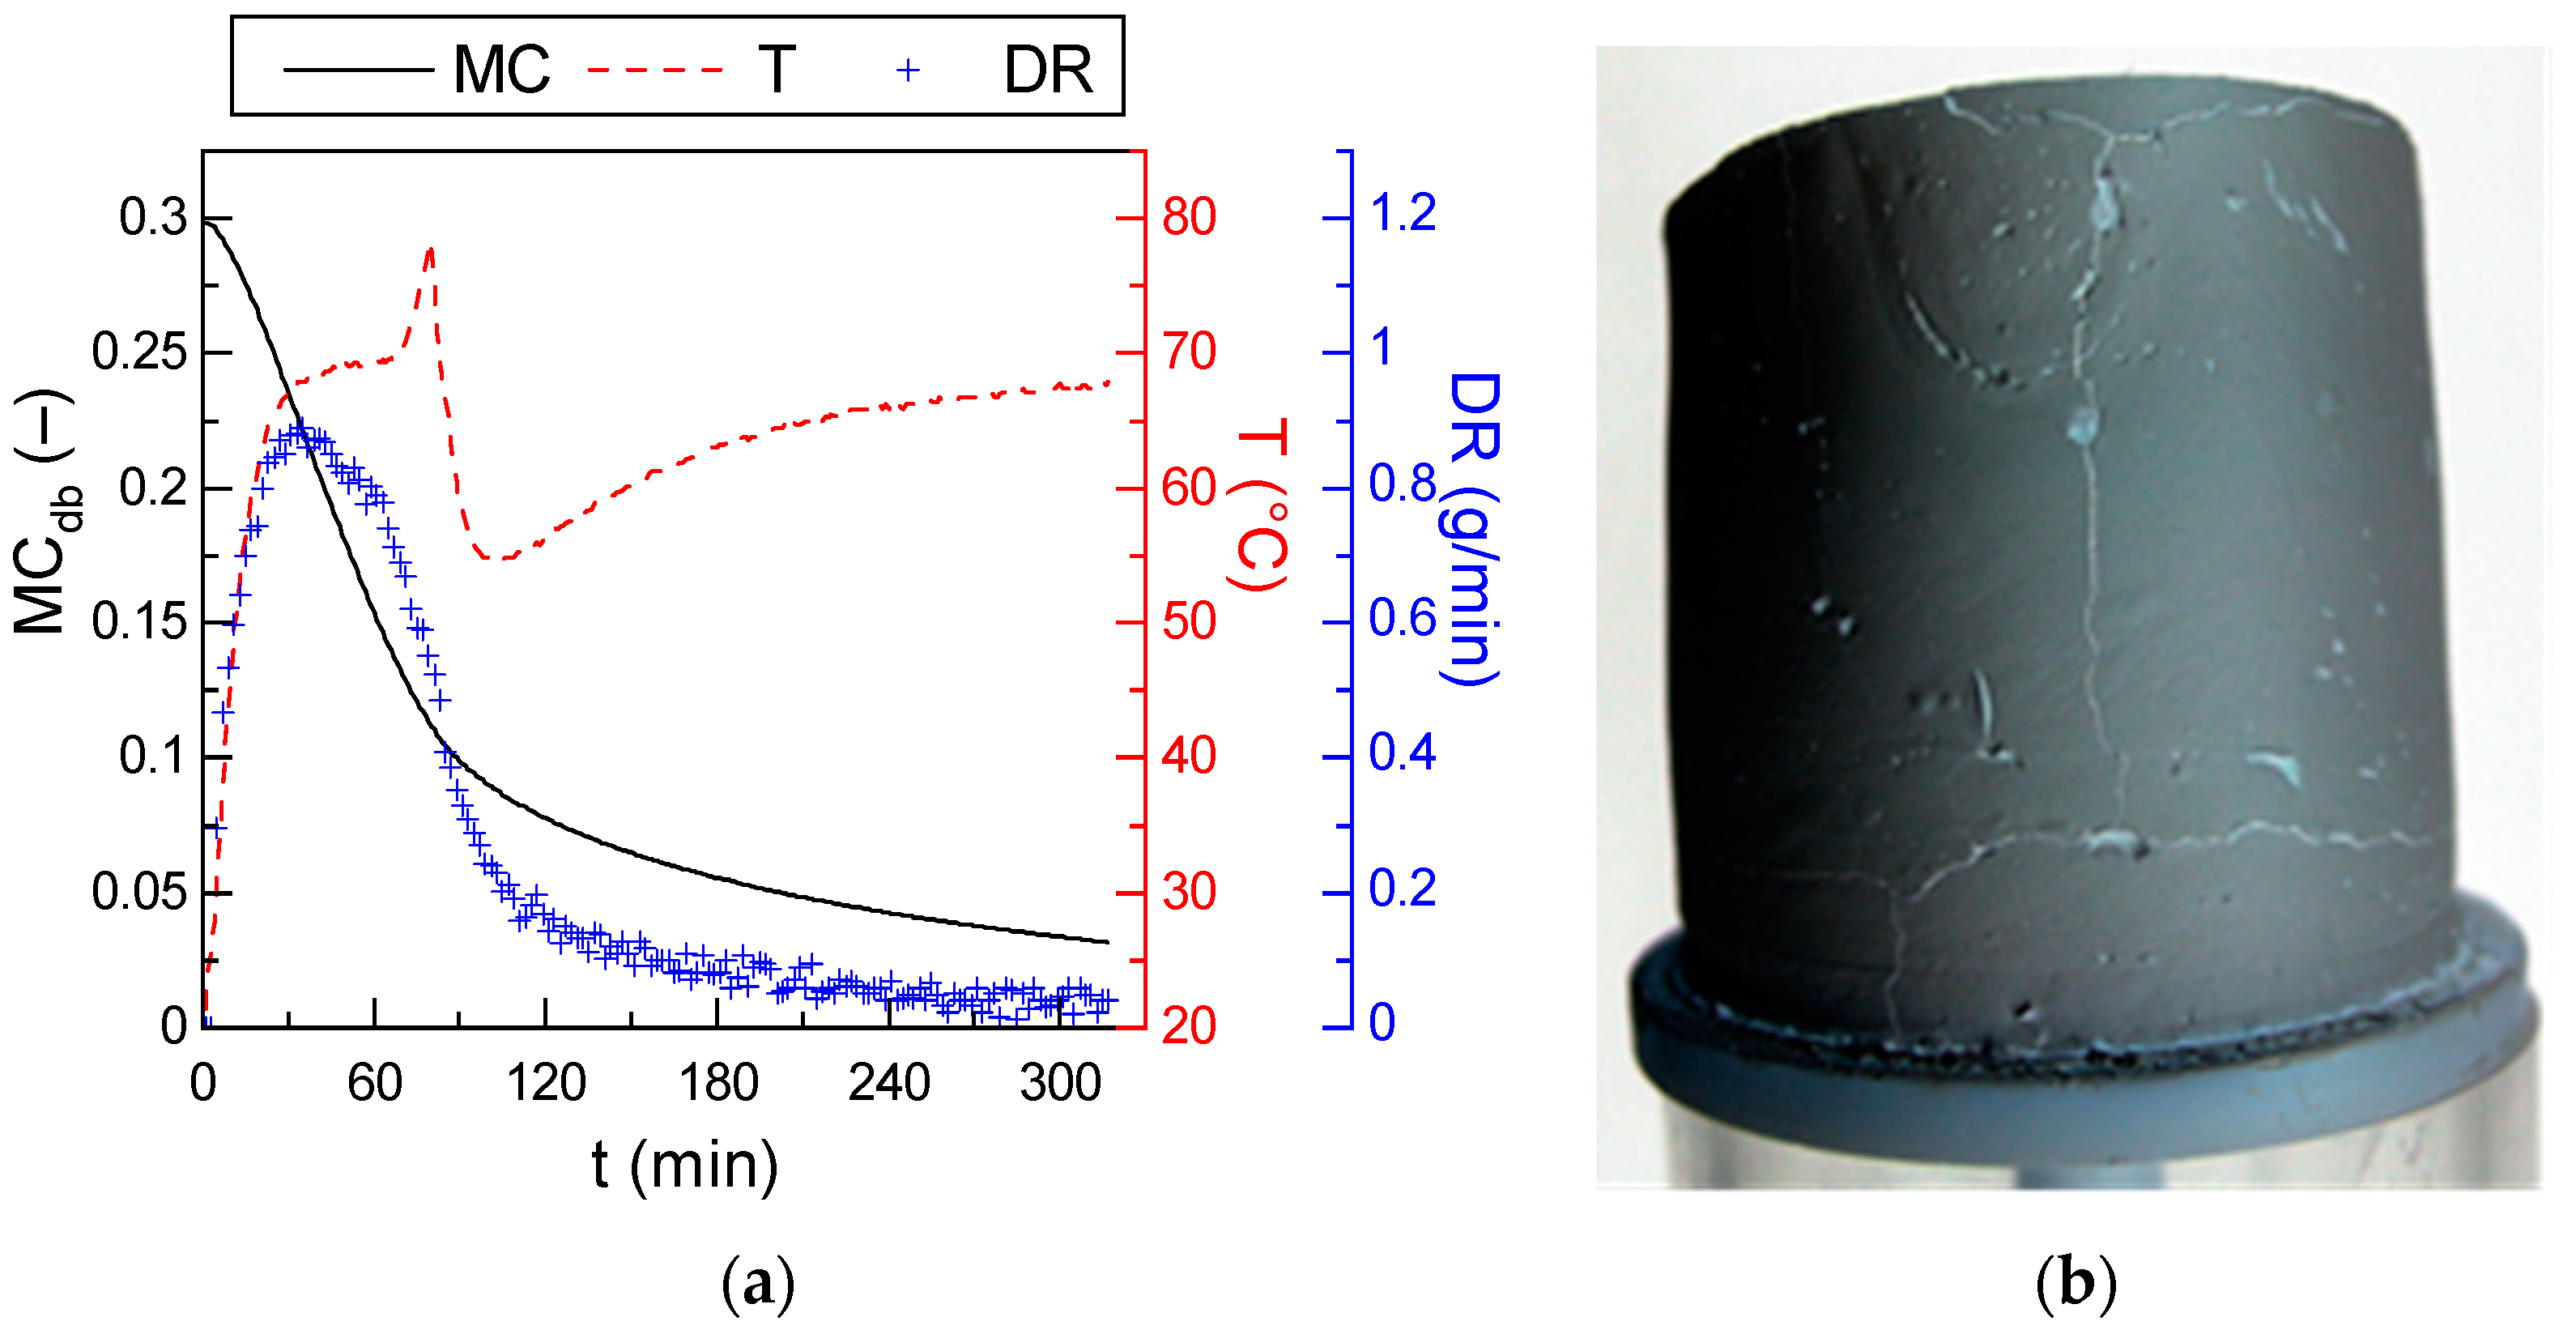
In schedule 4, convective drying was enhanced with microwaves and also with infrared radiation (IR) for the first 40 min of drying. Infrared radiation is a very effective source of heat and can be delivered to the material almost lossless. Its use in program 4 was aimed at accelerating the evaporation of moisture from the liquid film present on the surface and maximally shortening the first drying period. As can be seen in Figure 5a, the use of three different energy sources had a very positive effect on the kinetics of the process. The drying rate increased rapidly in the first stage to approximately 1.6 g/min, resulting in a significant drop in moisture content. Unfortunately, after 40 min and turning off both the microwaves and infrared, the drying rate began to drop sharply, and finally, the total drying time was similar to that observed in the previous program (approx. 300 min). The temperature curve clearly indicates that extending the time of exposure to microwave and infrared radiation could adversely affect the quality of the material and even lead to its bursting. Such effective heat sources caused very fast heating of the sample surface to almost 80 °C. The quality of the product was very good, as there were no visible cracks on the surface of the samples (Figure 5b).
In the next schedule, convective drying was enhanced only with IR for the first 80 min of the process. This IR enhancement duration results from preliminary research and is assumed to coincide with the first drying period. During this period, the surface of the material is covered with a liquid film, which can be effectively evaporated using IR radiation. As a result, it was expected to shorten the first drying period. As can be seen, the kinetic curves did not differ significantly from the previous schedule (Figure 6a). The maximum drying rate was lower compared to CV-MW and CV + (MW − IR)40 (ca. 0.9 g/min) and dropped instantly after the IR was turned off. This resulted in a long drying time of ca. 300 min. Furthermore, at the end of the strengthening period, the temperature of the sample surface increased rapidly to approximately 80 °C, and after turning off the IR heater, it dropped to a value of approximately 56 °C just as quickly. The rapid change in temperature caused drying stresses and numerous cracks on the surface of the sample (Figure 6b). However, the quality of the product was acceptable. The longitudinal strokes visible on the surface are due to the molding process and are not cracks. Only in the upper part of the sample, a small crack around the circumference occurred.
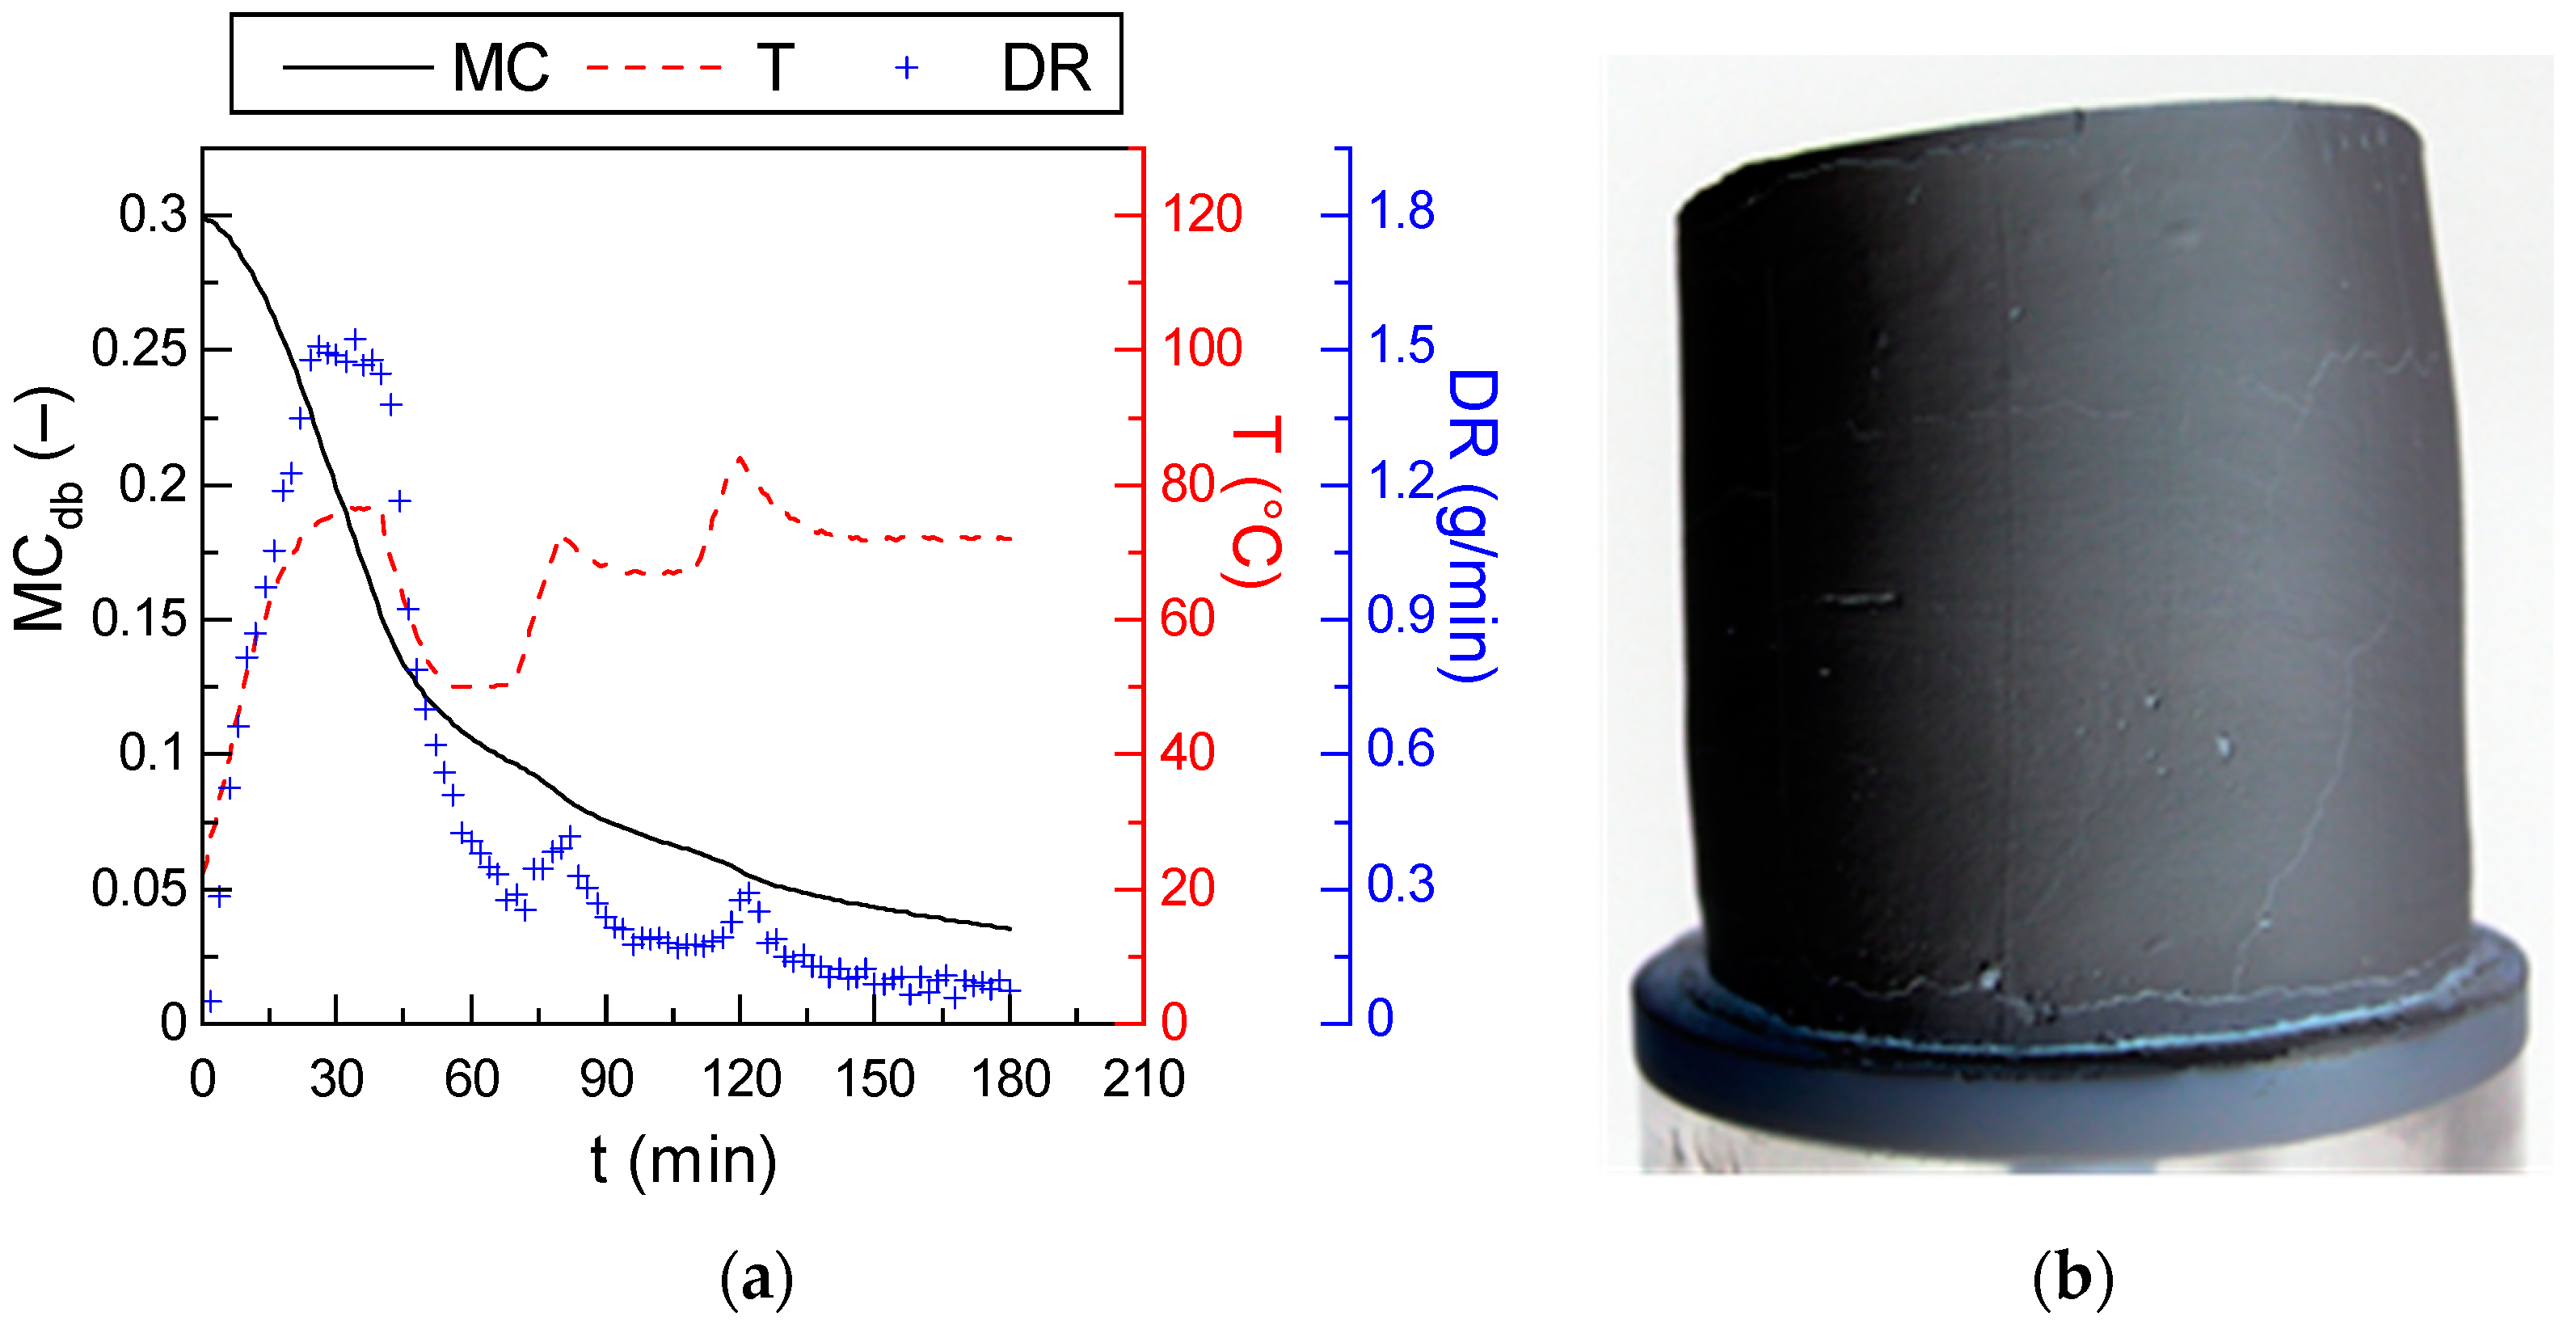
The last two schedules of drying are hybrid, nonstationary ones. In both programs, convective drying was enhanced with microwave and/or IR radiation periodically for a given time period (Table 2). The introduction of breaks between the periods of intensive hybrid drying (CV + MW or CV + MW − IR) was intended to stabilize the material, that is, to equalize the distribution of moisture and, more importantly, the temperature. In these so-called “relaxation periods”, drying was carried out only with forced convection at 85 °C and 1.2 m/s. This so-called “non-stationary drying” strategy is often applied during the drying of construction materials and is usually beneficial both for the kinetics of the process and quality of the products. The plots of moisture content, drying rate and sample surface versus time are presented in Figure 7 and Figure 8.
The results obtained in these two programs clearly indicate that the introduction of relaxation periods positively influences the drying kinetics. The drying rates reached a level similar to that observed during processes without relaxation periods (CV − MW and CV + (MW − IR)40, respectively), but the drying time was visibly reduced to 210 min and 180 min in schedules 6 and 7, respectively (Figure 7a and Figure 8a). In both cases, short constant drying rate periods are observed at the beginning of the process on the drying rate curves. Alternating periods of intense hybrid drying and relaxation are visible in the temperature and drying rate curves. It can also be noticed that in the program where infrared radiation was used (schedule 7), the temperature of the sample after the first stage of intensive drying (convection–microwave–infrared) dropped significantly. This phenomenon resulted from the intense heating of the sample surface by infrared radiation and was observed in each schedule enhanced with IR (Figure 5a and Figure 6a). After the relaxation period, the IR heater was turned on, and the temperature surface was raised again. The increases and decreases in subsequent cycles were smaller as a result of the convective heating of the dried material. In these cycles, the idea of nonstationary drying–relaxation of the material can be clearly seen. Based on the photos of the samples, it can be concluded that they were of very high quality compared to those obtained in previous programs. The surface was smooth and without major cracks, even in the area with the most intense drying stresses (see Figure 7b and Figure 8b).

3.2. Energy Consumption

Today, energy consumption is one of the most important parameters in determining the usefulness of processes. New techniques are expected to be energy-efficient and sustainable. Hybrid drying, which combines several drying techniques into one process, is part of this trend. The drying techniques are selected in such a way as to eliminate the disadvantages and highlight the advantages of each of them. For example, the combination of convection and microwave drying allows the whole body to be heated, which leads to faster and shorter drying, eliminating the basic disadvantages of the convection technique. However, such a connection must be implemented in an appropriate manner. It should be remembered that supporting the convection process with additional energy sources (e.g., microwaves) requires powering additional systems, which requires higher instantaneous energy consumption. If such an enhancement does not translate into a sufficiently large shortening of the drying time, it will increase the energy consumption of the process.
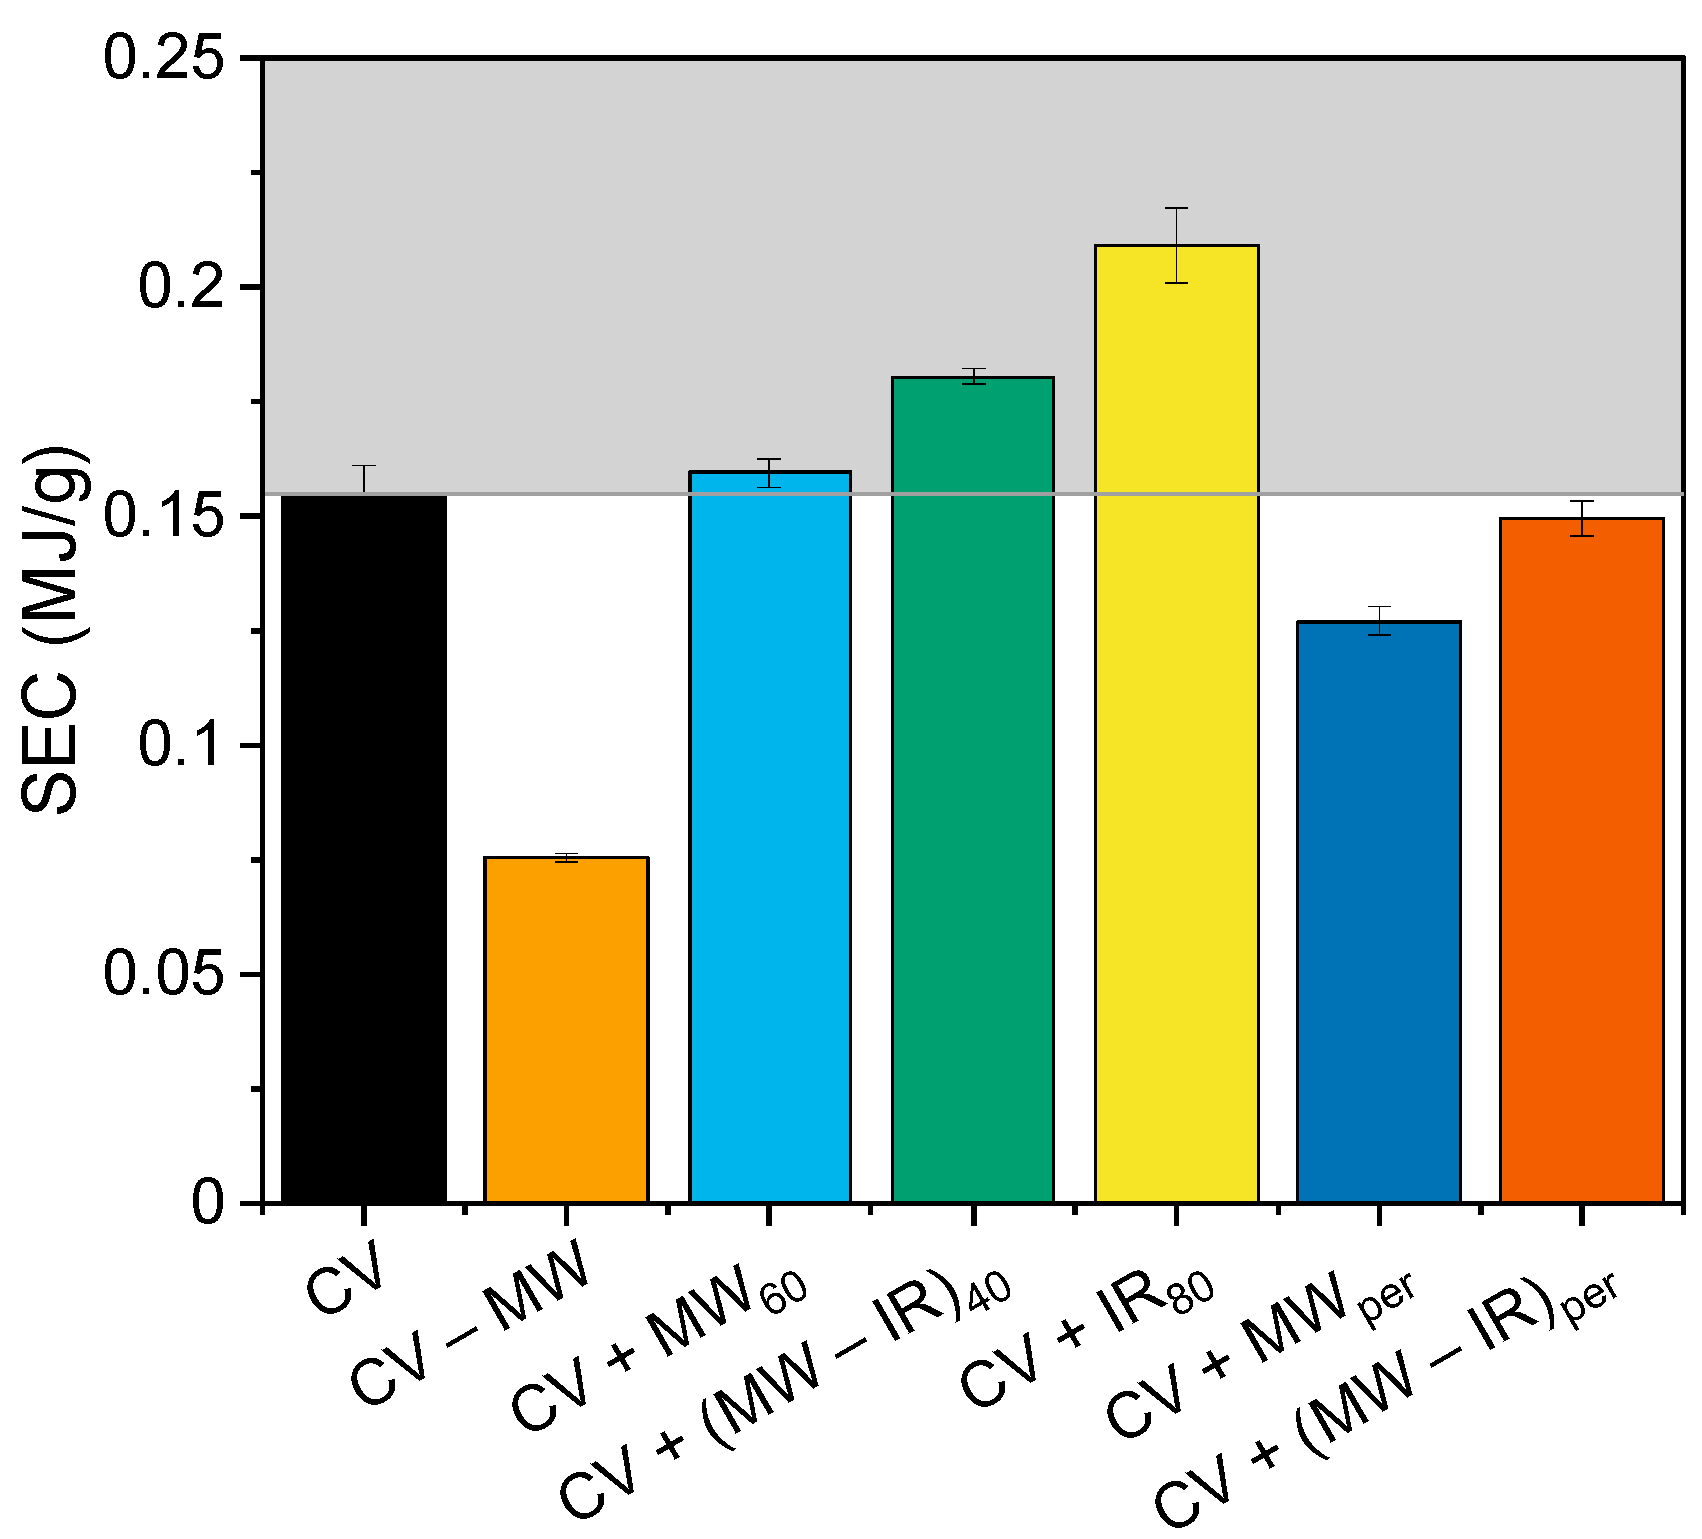
Figure 9 presents the values of specific energy consumptions for particular drying schedules. The SEC for convection (CV) was assigned as a reference. The gray area of the graph indicates a SEC higher than that of the reference process.
The use of additional energy sources undoubtedly had a positive effect on the kinetics of convective drying. Unfortunately, in some cases, the benefits were not sufficient, and the SEC was significantly higher than for the reference process. In the case of processes where support was used only at the beginning, higher energy consumption was observed, and the increase was 2.8, 16.4 and 34.9% for schedules 3–5, respectively. This is undoubtedly caused by the too short operation time of additional energy sources and the long process time. The greatest reduction in energy consumption (51.3%) was observed for the convection–microwave (CV-MW) process, where microwaves were used continuously throughout the drying. Low energy consumption correlates with a short drying time; in this case, it was only 110 min. In the case of hybrid, nonstationary schedules (CV + MWper, CV + (MW − IR)per), the specific energy consumption was higher compared to CV − MW but lower than for CV (decrease of 18.1 and 3.6%, respectively). A positive result in relation to CV results from the periodic use of additional energy sources throughout the drying period, while a negative result in relation to CV-MW results from a longer drying time. This shows that a properly constructed hybrid drying program allows significant savings not only in terms of time but also energy while maintaining a high-quality product.

3.3. Calculation of the Drying Constant k

All experimentally obtained drying curves were approximated using Equation (6). In this way, the values of the drying constant k were determined. The results of the calculations are presented in Table 3.
A comparison of CV and CV + MW processes indicates that the use of microwaves as an additional heat source resulted in a very large increase in drying efficiency. The drying constant more than doubled. Shortening the time of microwave application (CV + MW60 and CV + MWper processes) resulted in a slight decrease in the drying constant. The use of infrared radiation as an additional heat source (CV + IR80 process) resulted in an increase in drying efficiency of the same order as the use of microwaves. The highest increase in drying efficiency was obtained for processes where both additional heat sources were used simultaneously (CV + (MW − IR)40 and CV + (MW − IR)per).
The experimental results obtained in this work coincide partially with the results obtained by Hammouda and Mihoubi [13] through numerical simulations. The numerical simulations indicate a greater impact of infrared radiation than microwaves. These differences between the experimental and numerical results result from different sample geometries and different power values of the heat sources used.

4. Conclusions

On the basis of the results presented in this paper, it can be stated that a combination of several drying techniques into one hybrid process can lead to a reduction in drying time, reduce the energy consumption and improve the quality of dried products. The kinetics and energy advantages depend primarily on the duration of microwave and IR enhancement. The longer the period of radiation exposure, the shorter the drying time and the lower the energy consumption. The fastest process was convection–microwave drying, where a reduction in drying time of 70% and energy consumption of 50% was observed. However, long exposure to microwave or IR can lead to a deterioration of the product quality; therefore, a periodic change of drying conditions was examined. The drying time in these programs was shortened in relation to the simple convection process by 45 to 50% while reducing energy consumption by 3–18%. The periodic change of drying conditions leads to equalization of the temperature and humidity gradients and thereby to a reduction in drying stress. This results in better product quality. The above studies show that a periodic change of drying conditions should be recommended.

Author Contributions

Conceptualization, D.M. and G.M.; methodology, D.M.; formal analysis, D.M. and G.M.; investigation, D.M.; writing—original draft preparation, D.M. and G.M.; writing—review and editing, D.M. and G.M.; visualization, D.M. All authors have read and agreed to the published version of the manuscript.

Funding

This research was funded by Ministry of Education and Science in Poland.

Institutional Review Board Statement

Not applicable.

Informed Consent Statement

Not applicable.

Data Availability Statement

Data will be shared on reasonable request.

Conflicts of Interest

The authors declare no conflict of interest.

References

  1. Itaya, Y.; Mori, S.; Hasatani, M. Drying of Ceramics. In Handbook of Industrial Drying, 4th ed.; Mujumdar, A.S., Ed.; Taylor and Francis: Oxfordshire, UK, 2015; pp. 17–28. [Google Scholar]
  2. Ratti, C.; Mujumdar, A.S. Infrared Drying. In Handbook of Industrial Drying, 4th ed.; Mujumdar, A.S., Ed.; Taylor and Francis: Oxfordshire, UK, 2015; pp. 405–420. [Google Scholar]
  3. Habib, K.; Dilvin, T. Drying of Carrot Slices Using Infrared Radiation. Int. J. Food Sci. Technol. 2009, 44, 953–959. [Google Scholar] [CrossRef]
  4. Zare, D.; Naderi, H.; Ranjbaran, M. Energy and Quality Attributes of Combined Hot-Air/Infrared Drying of Paddy. Dry. Technol. 2015, 33, 570–582. [Google Scholar] [CrossRef]
  5. Doymaz, I. Infrared Drying of Sweet Potato (Ipomoea Batatas L.) Slices. J. Food Sci. Technol. 2012, 49, 760–766. [Google Scholar] [CrossRef] [Green Version]
  6. Guo, L.L.; Zhou, L.Y.; Bi, J.F.; Deng, F.M.; Yi, J.Y.; Chen, Q.Q. Optimization of Medium-and Short-Wave Infrared Radiation Drying Process for Shiitake Mushroom. Food Sci. 2016, 37, 44–51. [Google Scholar] [CrossRef]
  7. Schiffman, R.F. Microwave and Dielectric Drying. In Handbook of Industrial Drying, 4th ed.; Mujumdar, A.S., Ed.; Taylor and Francis: Oxfordshire, UK, 2015; pp. 283–301. [Google Scholar]
  8. Kowalski, S.J.; Banaszak, J.; Rybicki, A. Damage Analysis of Microwave-Dried Materials. AIChE J. 2012, 58, 2097–2104. [Google Scholar] [CrossRef]
  9. Kowalski, S.J.; Rajewska, K.; Rybicki, A. Mechanical effects in saturated capillary-porous materials during convective and microwave drying. Dry. Technol. 2004, 22, 2291–2308. [Google Scholar] [CrossRef]
  10. Itaya, Y.; Uchiyama, S.; Hatano, S.; Mori, S. Drying Enhancement of Clay Slab by Microwave Heating. Dry. Technol. 2005, 23, 1243–1255. [Google Scholar] [CrossRef]
  11. Vorhauer, N.; Tretau, A.; Bück, A.; Prat, M. Microwave drying of wet clay with intermittent heating. Dry. Technol. 2019, 37, 664–678. [Google Scholar] [CrossRef]
  12. Briest, L.; Wagner, R.; Tretau, A.; Tsotsas, E.; Vorhauer-Huget, N. Microwave-assisted drying of clay roof tiles. Dry. Technol. 2022, 40, 1804–1818. [Google Scholar] [CrossRef]
  13. Hammouda, I.; Mihoubi, D. Comparative numerical study of kaolin clay with three drying methods: Convective, convective–microwave and convective infrared modes. Energy Convers. Manag. 2014, 87, 832–839. [Google Scholar] [CrossRef]
  14. Łechtańska, J.M.; Szadzińska, J.; Kowalski, S.J. Microwave-and infrared-assisted convective drying of green pepper: Quality and energy considerations. Chem. Eng. Process. Process Intensif. 2015, 98, 155–164. [Google Scholar] [CrossRef]
  15. Saengrayap, R.; Tansakul, A.A.; Mittal, G.S. Effect of far-infrared radiation assisted microwave-vacuum drying on drying characteristics and quality of red chilli. J. Food Sci. Technol. 2015, 52, 2610–2621. [Google Scholar] [CrossRef] [Green Version]
  16. Aydogdu, A.; Sumnu, G.G.; Sahin, S. Effects of microwave-infrared combination drying on quality of eggplants. Food Bioprocess Technol. 2015, 8, 1198–1210. [Google Scholar] [CrossRef]
  17. Si, X.; Chen, Q.; Bi, J.J.; Yi, J.; Zhou, L.; Wu, X. Infrared radiation and microwave vacuum combined drying kinetics and quality of raspberry. J. Food Process Eng. 2016, 39, 377–390. [Google Scholar] [CrossRef]
  18. Chayjan, R.A.; Dibagar, N.; Alaei, B. Drying characteristics of zucchini slices under periodic infrared-microwave vacuum conditions. Heat Mass Transf. 2017, 53, 3473–3485. [Google Scholar] [CrossRef]
  19. Musielak, G.; Śliwa, T. Modeling and Numerical Simulation of Clays Cracking During Drying. Dry. Technol. 2015, 33, 1758–1767. [Google Scholar] [CrossRef]
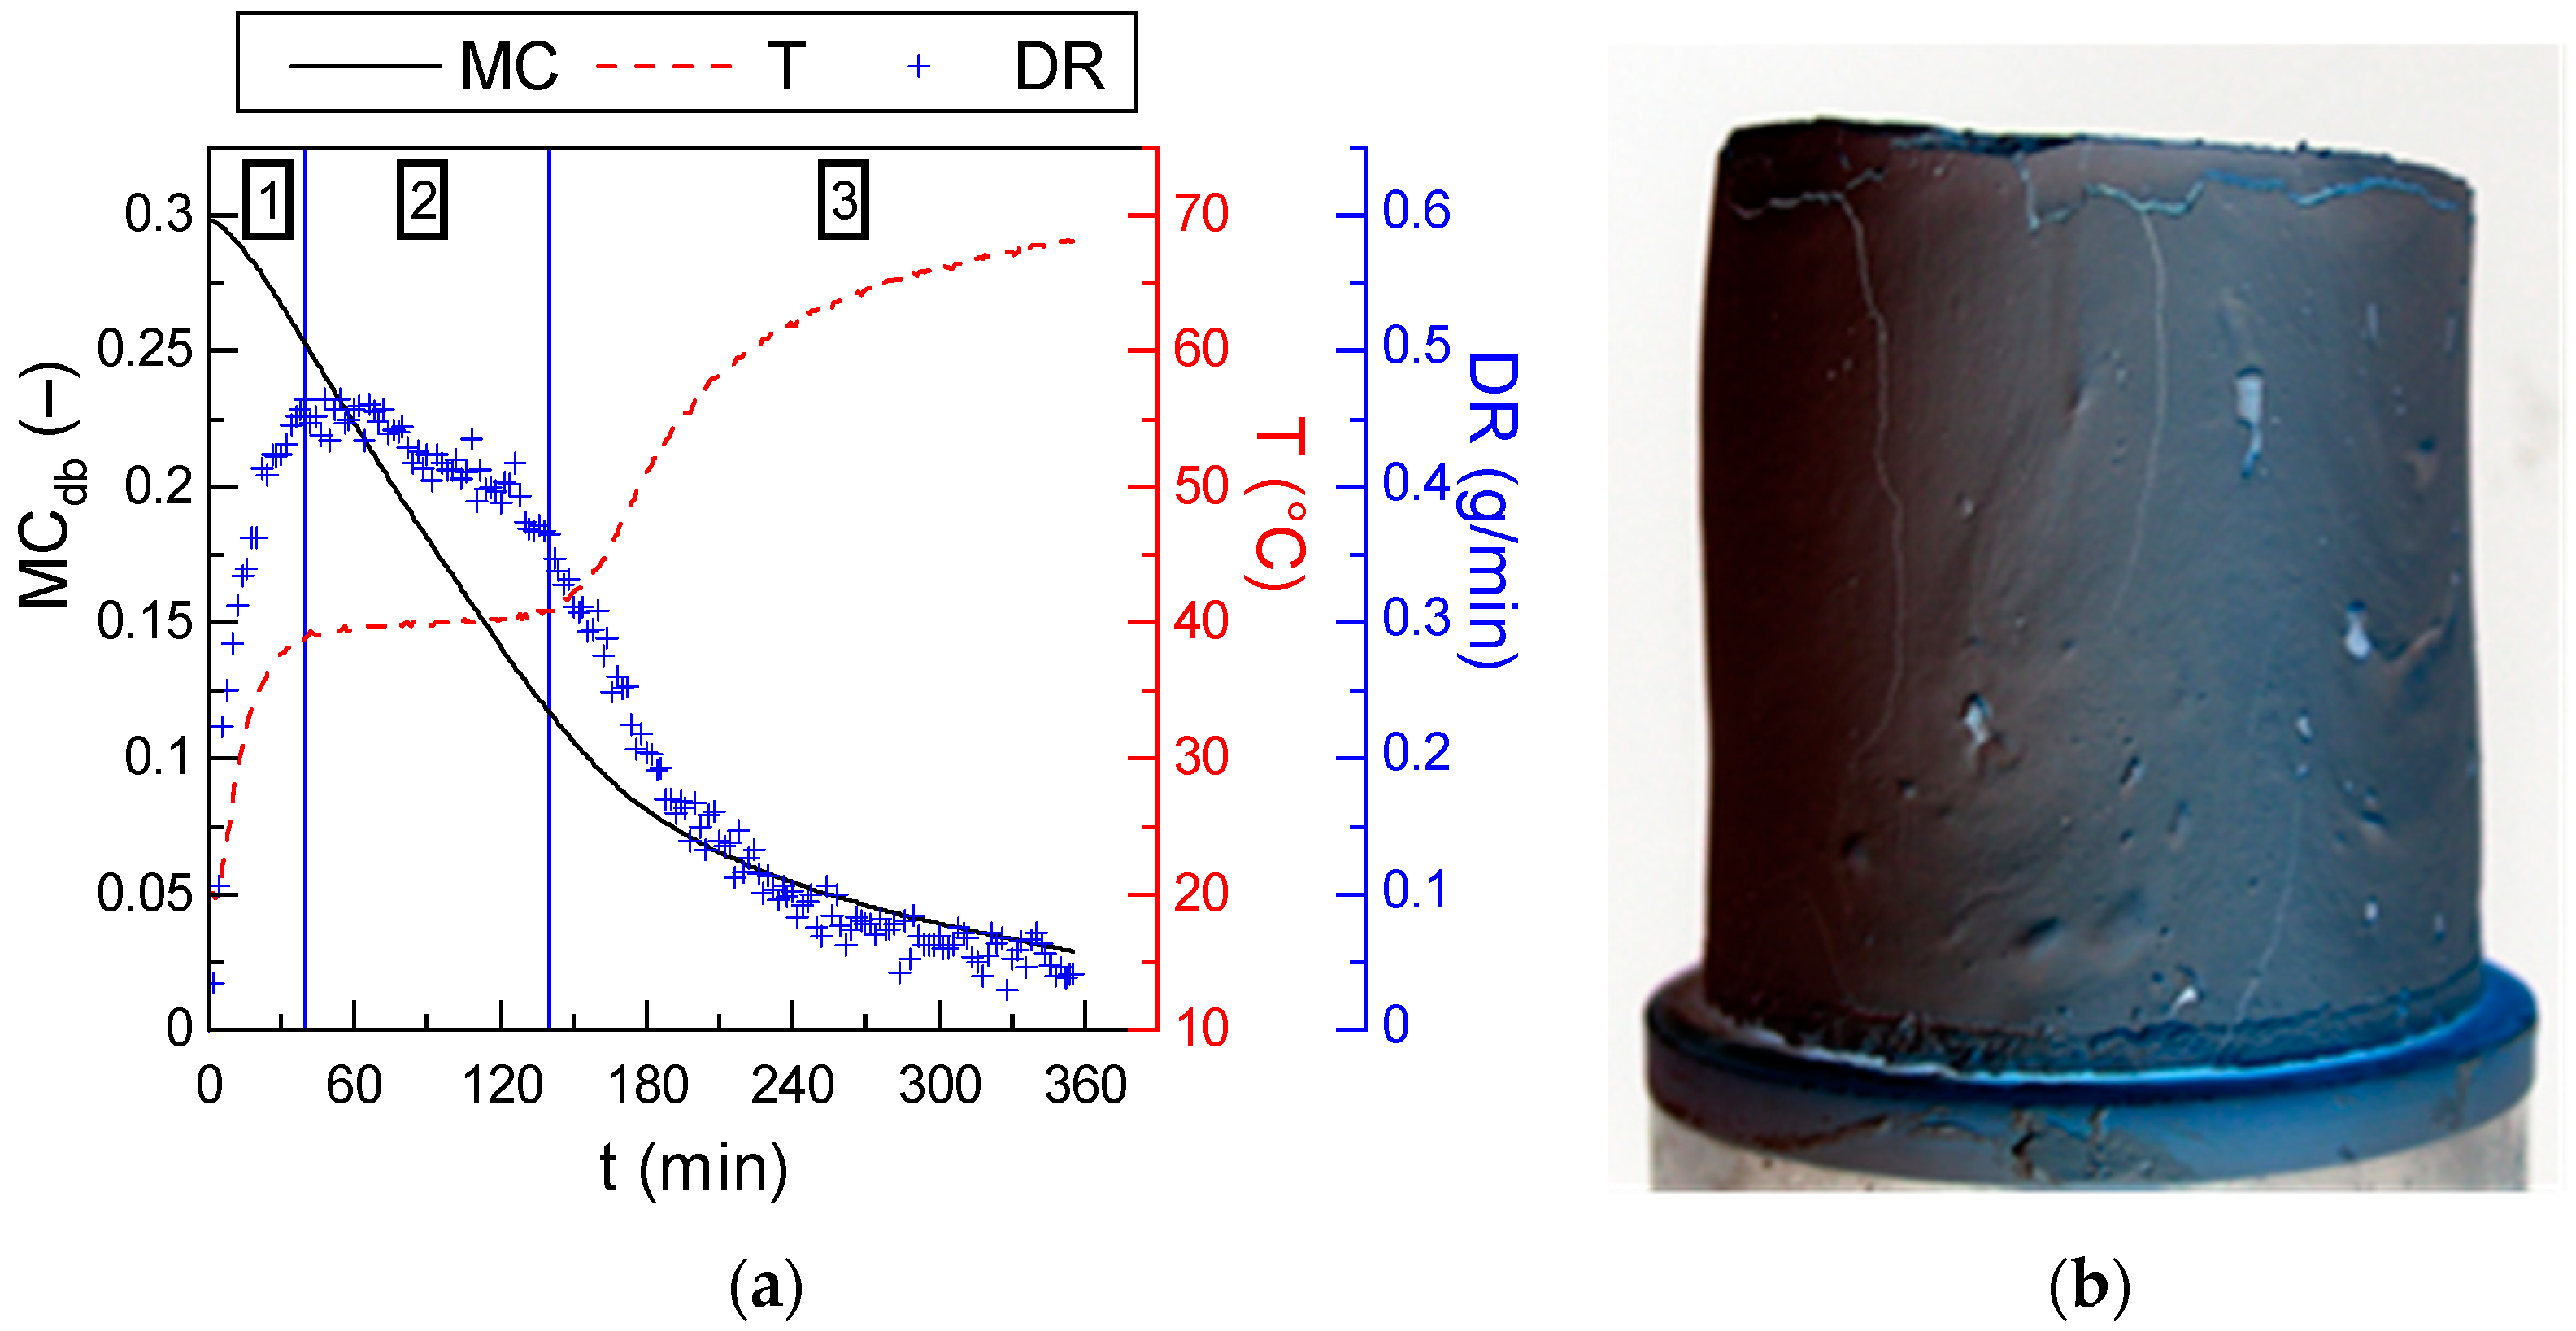
Figure 2. Dry basis moisture content (black line), sample surface (red dashed line) and drying rate (blue cross) for schedule No 1—CV (a) and appearance of dried sample (b).
Applsci 13 07451 g002
Figure 3. Dry basis moisture content (black line), sample surface (red dashed line) and drying rate (blue cross) for schedule No 2—CV-MW (a) and appearance of dried sample (b).
Applsci 13 07451 g003
Figure 4. Figure 4. Dry basis moisture content (black line), sample surface (red dashed line) and drying rate (blue cross) for schedule No 3—CV + MW60 (a) and appearance of dried sample (b).
Applsci 13 07451 g004
Figure 5. Dry basis moisture content (black line), sample surface (red dashed line) and drying rate (blue cross) for schedule No 4—CV + (MW − IR)40 (a) and appearance of dried sample (b).
Applsci 13 07451 g005
Figure 6. Dry basis moisture content (black line), sample surface (red dashed line) and drying rate (blue cross) for schedule No 5—CV + IR80 (a) and appearance of dried sample (b).
Applsci 13 07451 g006
Figure 7. Dry basis moisture content (black line), sample surface (red dashed line) and drying rate (blue cross) for schedule No 6—CV + MWper (a) and appearance of dried sample (b).
Applsci 13 07451 g007
Figure 8. Dry basis moisture content (black line), sample surface (red dashed line) and drying rate (blue cross) for schedule No 7—CV + (MW − IR)per (a) and appearance of dried sample (b).
Applsci 13 07451 g008
Figure 9. Specific energy consumption (SEC) for particular drying schedules.
Applsci 13 07451 g009
Table 1. Composition of the KOC kaolin clay [19].
ComponentSiO2TiO2Al2O3Fe2O3MgOCaONa2OK2OP2O5SO3Sum
% mass53.30.542.50.40.10.12.00.60.20.199.8
Table 2. Drying schedules.
Schedule No.NameDescription
1CVConvective drying.
2CV − MWConvective drying enhanced with microwave during the whole process.
3CV + MW60Convective drying enhanced with microwave in the first 60 min of the process.
4CV + (MW − IR)40Convective drying enhanced with microwave and IR in the first 40 min of the process.
5CV + IR80Convective drying enhanced with IR in the first 80 min of the process.
6CV + MWperConvective drying enhanced with microwave periodically. The application of radiation was controlled by the time in the following scheme:
phase 1: CV + MW → 60 min
phase 2: CV → 30 min
phase 3: CV + MW → 10 min
phase 4: CV → 30 min
phase 5: CV + MW → 10 min
phase 6: CV → 60 min
7CV + (MW − IR)perConvective drying enhanced with microwave and IR periodically. The application of radiation was controlled by the time in the following scheme:
phase 1: CV + MW + IR → 40 min
phase 2: CV → 30 min
phase 3: CV + MW + IR → 10 min
phase 4: CV → 30 min
phase 5: CV + MW + IR → 10 min
phase 6: CV → 60 min
CV—convective drying, MW—microwave, IR—infrared, 60, 80—duration in min, per—periodically.
Table 3. Value of the calculated drying constant k for particular schedules.
Processk (s−1)Standard ErrorAdjusted R2
CV0.0089.23 · 1050.9610
CV + MW0.0174.95 · 1040.9147
CV + MW600.0161.62 · 1040.9768
CV + (MW − IR)400.0181.82 · 1040.9762
CV + IR800.0141.11 · 1040.9842
CV + MWper0.0172.61 · 1040.9669
CV + (MW − IR)per0.022.75 · 1040.9735
Disclaimer/Publisher’s Note: The statements, opinions and data contained in all publications are solely those of the individual author(s) and contributor(s) and not of MDPI and/or the editor(s). MDPI and/or the editor(s) disclaim responsibility for any injury to people or property resulting from any ideas, methods, instructions or products referred to in the content.