Article

Temperature-Controlled Hyperthermia with Non-Invasive Temperature Monitoring through Speed of Sound Imaging

1
School of Electronic Science and Engineering, Nanjing University, Nanjing 210023, China
2
Department of Radiology, University of Michigan, Ann Arbor, MI 48109, USA
*
Authors to whom correspondence should be addressed.
These authors contributed equally to this work.
Appl. Sci. 2023, 13(12), 7317; https://doi.org/10.3390/app13127317
Submission received: 23 May 2023 / Revised: 16 June 2023 / Accepted: 17 June 2023 / Published: 20 June 2023
(This article belongs to the Section Biomedical Engineering)

Abstract

:
Hyperthermia therapy (HT) is used to treat diseases through heating of high temperature usually in conjunction with some other medical therapeutics such as chemotherapy and radiotherapy. In this study, we propose a promising temperature-controlled hyperthermia method that uses high-intensity focused ultrasound (HIFU) for clinical tumor treatment combined with diagnostic ultrasound image guidance and non-invasive temperature monitoring through speed of sound (SOS) imaging. HIFU heating is realized by a ring ultrasound transducer array with 256 elements. In this study, tumors in the human thigh were set as heating targets. The inner structure information of thigh tissue is obtained by B-mode ultrasound imaging. Since the relationship between temperature and SOS in different human tissue is available, the temperature detection is converted to the SOS detection obtained by the full-wave inversion (FWI) method. Simulation results show that our model can achieve expected hyperthermia of constant temperature on tumor target with 0.2 °C maximum temperature fluctuation for 5 h. Through simulation, our proposed thermal therapy model achieves accurate temperature control of ±0.2 °C in human thigh tumors, which verifies the feasibility of the proposed temperature-controlled hyperthermia model. Furthermore, the temperature measurement can share the same ring ultrasound transducer array for HIFU heating and B-mode ultrasound imaging, which provides a guiding significance for clinical application.

1. Introduction

HYPERTHERMIA therapy (HT) is used to treat diseases through maintaining high-temperature heating of the whole body or a part for a long period, which is usually used alone or in conjunction with some other medical therapeutics such as chemotherapy and radiotherapy [1]. Many successful clinical trials have applied the therapy to treat different types of cancer tumors, such as recurrent breast cancer, liver cancer, uterine fibroids and bladder cancer [2,3,4,5]. HT is mainly divided into three categories: local HT, regional HT and whole-body HT [6]. The purpose of local HT is to increase the temperature of the tumor without affecting the surrounding normal tissue. Generally, local HT is applied to treat tumors below the skin or in body cavities near the surface of the body through using external or interstitial heating modalities [7]. In contrast, regional HT is more complicated than local HT because its targets are deep-seated tumors in body cavities, especially locally advanced tumors. Non-invasive methods to realize regional HT include heating the blood, irrigating the body cavities and radiofrequency (RF). Whole-body HT is usually applied to treat metastatic cancer by using surface heating, radiation induction or extracorporeal induction. During the entire hyperthermia treatment period, the temperature of the tumor and surrounding tissues needs to be strictly controlled at the expected temperature. Among many techniques such as microwave, infrared and RF, high-intensity focused ultrasound (HIFU) is increasingly being developed as a promising modality to induce hyperthermia for clinical tumor treatment combined with diagnostic ultrasound guidance [8,9].
For many kinds of benign and malignant tumors, HIFU plays an auxiliary role in the current standard treatments such as surgery, gene therapy and radiation. It was first reported by Lynn et al. in the early 1940s that HIFU can pass through tissue without harm and cause tissue ablation in a focal area. In the 1950s and 1960s, significant early work including high-intensity ultrasound and ultrasound visualization was completed. By the late 1990s, commercially available ultrasound-guided HIFU devices had been developed [10]. Extensive advances in phased-array applicator technology have enabled HIFU to perform better in focusing [11]. With the advances in imaging, the accurate focus position makes clinical application possible [12]. Magnetic resonance imaging (MRI) and ultrasound imaging are two guiding modalities with complementary guiding features [13,14,15] which have few side effects in humans. HIFU uses the characteristic that ultrasound can penetrate the human body without damage and focus on tumors in vivo causing a thermal effect (main effect), cavitation effect and mechanical effect. Since the high temperature generated by thermal effect on the focus can destroy the cell structure and damage the protein, it will lead to the coagulation necrosis of the tumor target [16,17,18] instead of burning the surrounding normal tissue. The sensor emits high-intensity ultrasound signals to the tissue target, and then the tissue absorbs ultrasound energy and converts energy into thermal energy during therapy. This heat deposition can cause the rapid temperature rise of tissue. Due to the focusing of the ultrasound beam, thermal energy is mainly concentrated on the tumor target, improving the temperature to the desired range (e.g., 5 °C–6 °C higher than the human body temperature). Therefore, there is almost no obvious heat deposition on the surrounding tissue, which avoids the unpredictable growth of healthy tissue caused by excessive temperature [19].
There are three typical types of HIFU equipment systems that have been put into clinical practice for treatment of tumors: HIFU systems guided by MRI (MRgHIFU), HIFU systems guided by ultrasound (USgHIFU) and HIFU systems guided by both MRI and ultrasound. During the MRgHIFU treatment, MRI equipped with a thermal mapping system can make tumors visible clearly and monitor the thermal ablation effect of target tissue based on the sensitivity to temperature changes in real time [20,21,22,23]. The high spatial resolution of MRgHIFU enables the accuracy of image guidance, which offers abundant anatomic details for tumor detection [24]. However, USgHIFU is a more affordable imaging method and has many successful clinical applications. In addition to its high temporal and spatial resolution, USgHIFU is also insensitive to geometrical distortions, and all these characteristics make ultrasound imaging suitable for guiding HIFU therapy [25]. Considering the advantages of imaging capabilities combining MRI with ultrasound, a new HIFU technology has been proposed, in which ultrasound imaging is used for continuous target tracking and real-time MR-thermometry is performed to guide HIFU heating simultaneously [26]. However, MRgHIFU needs large and expensive systems in comparison with USgHIFU, which is relatively cheap and portable [27]. When USgHIFU systems are equipped with specially designed transducers, it is possible to realize real-time visual temperature monitoring of the target soft tissue [28].
It is hard to realize long-time constant temperature hyperthermia and control the temperature with little fluctuation [29] because of the lack of precisely adjustable heating and temperature measurement techniques [30]. In our study, we aim to simplify the hyperthermia system by using a ring array ultrasound transducer to perform two major functions of HIFU heating and temperature measurement in human tissue.

2. Mathematical Model and Theory

2.1. Acoustic Heating

Acoustic waves are the propagation forms of sound, which are essentially the transmission of energy in the medium. When acoustic waves propagate, the classic case is to pass through a lossless fluid medium with homogeneous density that satisfies the simple conservation of momentum, mass and energy [31]. However, the reality is that the acoustic medium is heterogeneous, and its SOS and ambient density are different. At the same time, the propagation of acoustic waves cannot ignore the loss of acoustic energy due to random thermal motion. In addition, acoustic waves passing through the compressible medium will cause dynamic fluctuations in variables such as density, velocity of acoustic particle, pressure, temperature, etc. The vibration and friction between the acoustic waves and the medium will convert a part of the acoustic energy into thermal energy and generate acoustic absorption physically with dispersion [32].
Since we use a ring ultrasound transducer array in this study, acoustic heating is realized by the dynamic delayed emission of acoustic pulse signals for each ultrasound transducer element according to Equation (1):
( x i o x 0 ) 2 + ( y i o y 0 ) 2 = R 2 ,
l i = ( x i o x ) 2 + ( y i o y ) 2 ,
t 0 = l 0 v s ,
Δ t i = t 0 l i v s ,
where ( x i , y i ) is the coordinate of a single element on the ring ultrasound transducer array with the radius of R, which has 256 elements ( i ranges from 1 to 256). ( o x 0 , o y 0 ) is both the center of the ring ultrasound transducer array and the center of the human thigh model whereas ( o x , o y ) is both the focus position and the center of the tumor. In addition, v s stands for the SOS of tissue and l i stands for the distance from each element to the focus. We take the time t 0 calculated from the farthest distance l 0 as a benchmark, which can ensure that the delay value of each element Δ t i is greater than or equal to 0 when transmitting signals. When we add the corresponding delay Δ t i to each ultrasound transducer element, all the transmitted signals can reach the focus of the target position at the same time.
The ring ultrasound transducer array model applied in this study is illustrated in Figure 1. Furthermore, the simulation model is immersed in the water bath at a constant temperature of 30 °C.
The heat conduction equation is an important partial differential equation in HIFU heating, which describes how the temperature in a region varies over time. Thermal diffusion is the main factor needing consideration during heating. In addition, Pennes’ bioheat equation [33] accounts for many aspects, such as heat deposition due to ultrasound absorption and advective heat loss due to tissue perfusion (blood flowing through the tissue). Therefore, the heat conduction equation including the factor of vascular heat perfusion is given by:
d T d t = k c ρ · 2 T B c ρ ( T T a ) + Q c ρ ,
where k is thermal conductivity in W/m·°C, c is specific heat capacity in J/kg·°C, ρ is medium density in kg/m 3 . Q is the volume rate of heat deposition in W/m 3 , which can be treated as the initial heat source used for hyperthermia. Furthermore, B is the product of blood density (kg/m 3 ), blood specific heat capacity (J/kg·°C) and blood perfusion rate ( s 1 ) whereas T a is the blood ambient temperature set to 37 °C by default. 2 denotes the Laplace operator and 2 T needs to consider the specific case of a function T ( x , y , z ) of three spatial variables ( x , y , z ) given by:
2 T = 2 T x 2 + 2 T y 2 + 2 T z 2 ,
where T is the temperature at the point ( x , y , z ) .
We establish a preset relationship equation between the temperature change Δ T (°C) and the heat source change Δ Q (W/m 3 ) in Equation (4), which is the key to temperature-controlled hyperthermia model.
Δ Q = m · Δ T ,
m i = m i 1 α 1 · m i 1 , Δ T > 0 m i 1 + α 2 · m i 1 , Δ T < 0
where m is the core operator that allows the constant temperature system to modify the intensity of the heat source as the temperature changes. m i stands for the value of in the period, which is calculated from m i 1 (the value of m in the last period). Furthermore, α is the control factor of m. α 1 is used after the temperature has risen, and α 2 is used to prevent temperature dropping. When the temperature rises during the last heating period, Δ T is positive and Δ Q is negative correspondingly, so it is necessary to reduce the intensity of heat source in the consequent heating period. When the temperature drops, the process is opposite. Using continuous heating by adjusting the intensity of heat source ensures that the temperature fluctuates up and down around the target temperature. To achieve the objective that the temperature fluctuation is within the desired range of the target temperature, it is important to fine-tune m. We first set small upper and lower limits according to the target temperature range. If the temperature exceeds the preset upper limit, m will decrease by α 1 times the m of the previous period. The increase by α 2 times the m of the previous period occurs when the temperature exceeds the preset lower limit. The increasing thermal diffusion over time requires the control factor α to strengthen the control of m. Therefore, as long as the temperature exceeds the upper or lower limits, α 1 and α 2 will respectively add 0.01 to their own current values. Through combining the above equations, we can achieve effective and accurate temperature control where the temperature fluctuation is within little range by the frequent iteration of core operator m.

2.2. Speed of Sound Imaging

SOS imaging is a non-invasive imaging modality that can show the acoustic property change in body tissue [34]. Previous studies have shown that the SOS in body tissue is sensitive to the temperature change [35]. In our study, the temperature control is necessary for the constant temperature hyperthermia system. Due to the available relationship between temperature and SOS (temperature and SOS vary in direct proportion) [36], the temperature monitoring in the medium is realized by the SOS imaging.
There are basically three categories of SOS imaging methods. The first one is filtered back projection (FBP) reconstruction technique, which is also one of the main techniques in image reconstruction of clinical CT applications [37]. By employing the Radon transform, FBP technique can complete the image reconstruction in frequency domain, which avoids the direct solution of complex inverse problem including finding the mapping function that matches the measured projection data and the SOS distribution. In this way, the FBP reconstruction technique can provide fast computing speed with a reduction of computation complexity by using the Radon transform, which is the foundation of the FBP algorithm. A high-quality image can be produced when enough transmission data have been acquired, which is difficult to realize in practical application. Furthermore, FBP technique assumes that the propagation of acoustic waves travels along straight lines in body tissue [38]. The approximation causes the limitation of the precision in SOS reconstruction. The second one is bent-ray tracing method (BRTM) based on ray theory, which employs time of flight (TOF) of acoustic wave propagation paths to achieve the SOS distribution reconstruction [39]. In this method, the acoustic wave propagation paths can be estimated by using the principles of geometrical optics and these paths are not straight when traveling through different medium interfaces [40]. The precision of the TOF measurement is crucial to the accuracy of the SOS distribution estimation. In our application, the average length of acoustic wave propagation paths is around 120 and the average SOS is about 1580. Assuming that the sampling frequency of the ring ultrasound transducer array is 20, the average error of SOS is more than 1, which means that the deviation of temperature monitoring is not satisfied with the temperature fluctuation limitation. The third one is full-wave inversion (FWI) based on the theory of acoustic wave propagation, which has many applications in medical imaging and geophysics [41,42,43]. When applying the FWI method, the SOS image reconstruction is realized by estimating the SOS distribution using the acoustic wave equation and the measured data. The measured acoustic wave data can be acquired by the receiver ultrasound sensor elements and the estimated acoustic wave data can be acquired through pseudospectral k-space method. Given the gradient of a sum of squared norms between the measured data and the estimated data, a gradient descent-based optimization algorithm can be employed to update the SOS estimate at every iteration [44].
Considering high order diffraction and scattering, FWI method can provide the better image quality in robustness, resolution and accuracy compared with two previous methods that have an approximate hypothesis [45]. In our work, temperature monitoring in the soft tissue is realized by the FWI method, which depends on the optimization iteration algorithm to achieve the SOS distribution reconstruction. At the beginning of iterations, the initial assumed SOS values of the medium play an important role in calculation speed and accuracy of SOS image reconstruction. Through a correspondent B-mode ultrasound image, the boundary information and position information of human thigh tissues can be acquired. Combined with cross-sectional anatomy images of human thigh and the acoustic properties of the human body, the precise initial values of SOS can be employed as a priori information to estimate the actual SOS values, which is helpful to improve the calculation efficiency.

3. Experiment and Analysis

3.1. Simulation Tools

Our simulation mainly relies on K-Wave to build the model and perform HIFU heating. K-Wave as an open-source toolbox can provide users with a MATLAB script interface to simulate the time-domain propagation of acoustic waves in one-dimensional, two-dimensional or three-dimensional space. In addition to explaining linear and nonlinear acoustic propagation, K-Wave toolbox also has various functions including the calculation of the distribution of heterogeneous material parameters and power law acoustic absorption. More details about the K-Wave model including its main governing equations and the boundary conditions used to our simulation can be found in the K-Wave user manual [46,47,48].

3.2. Simulation Setup

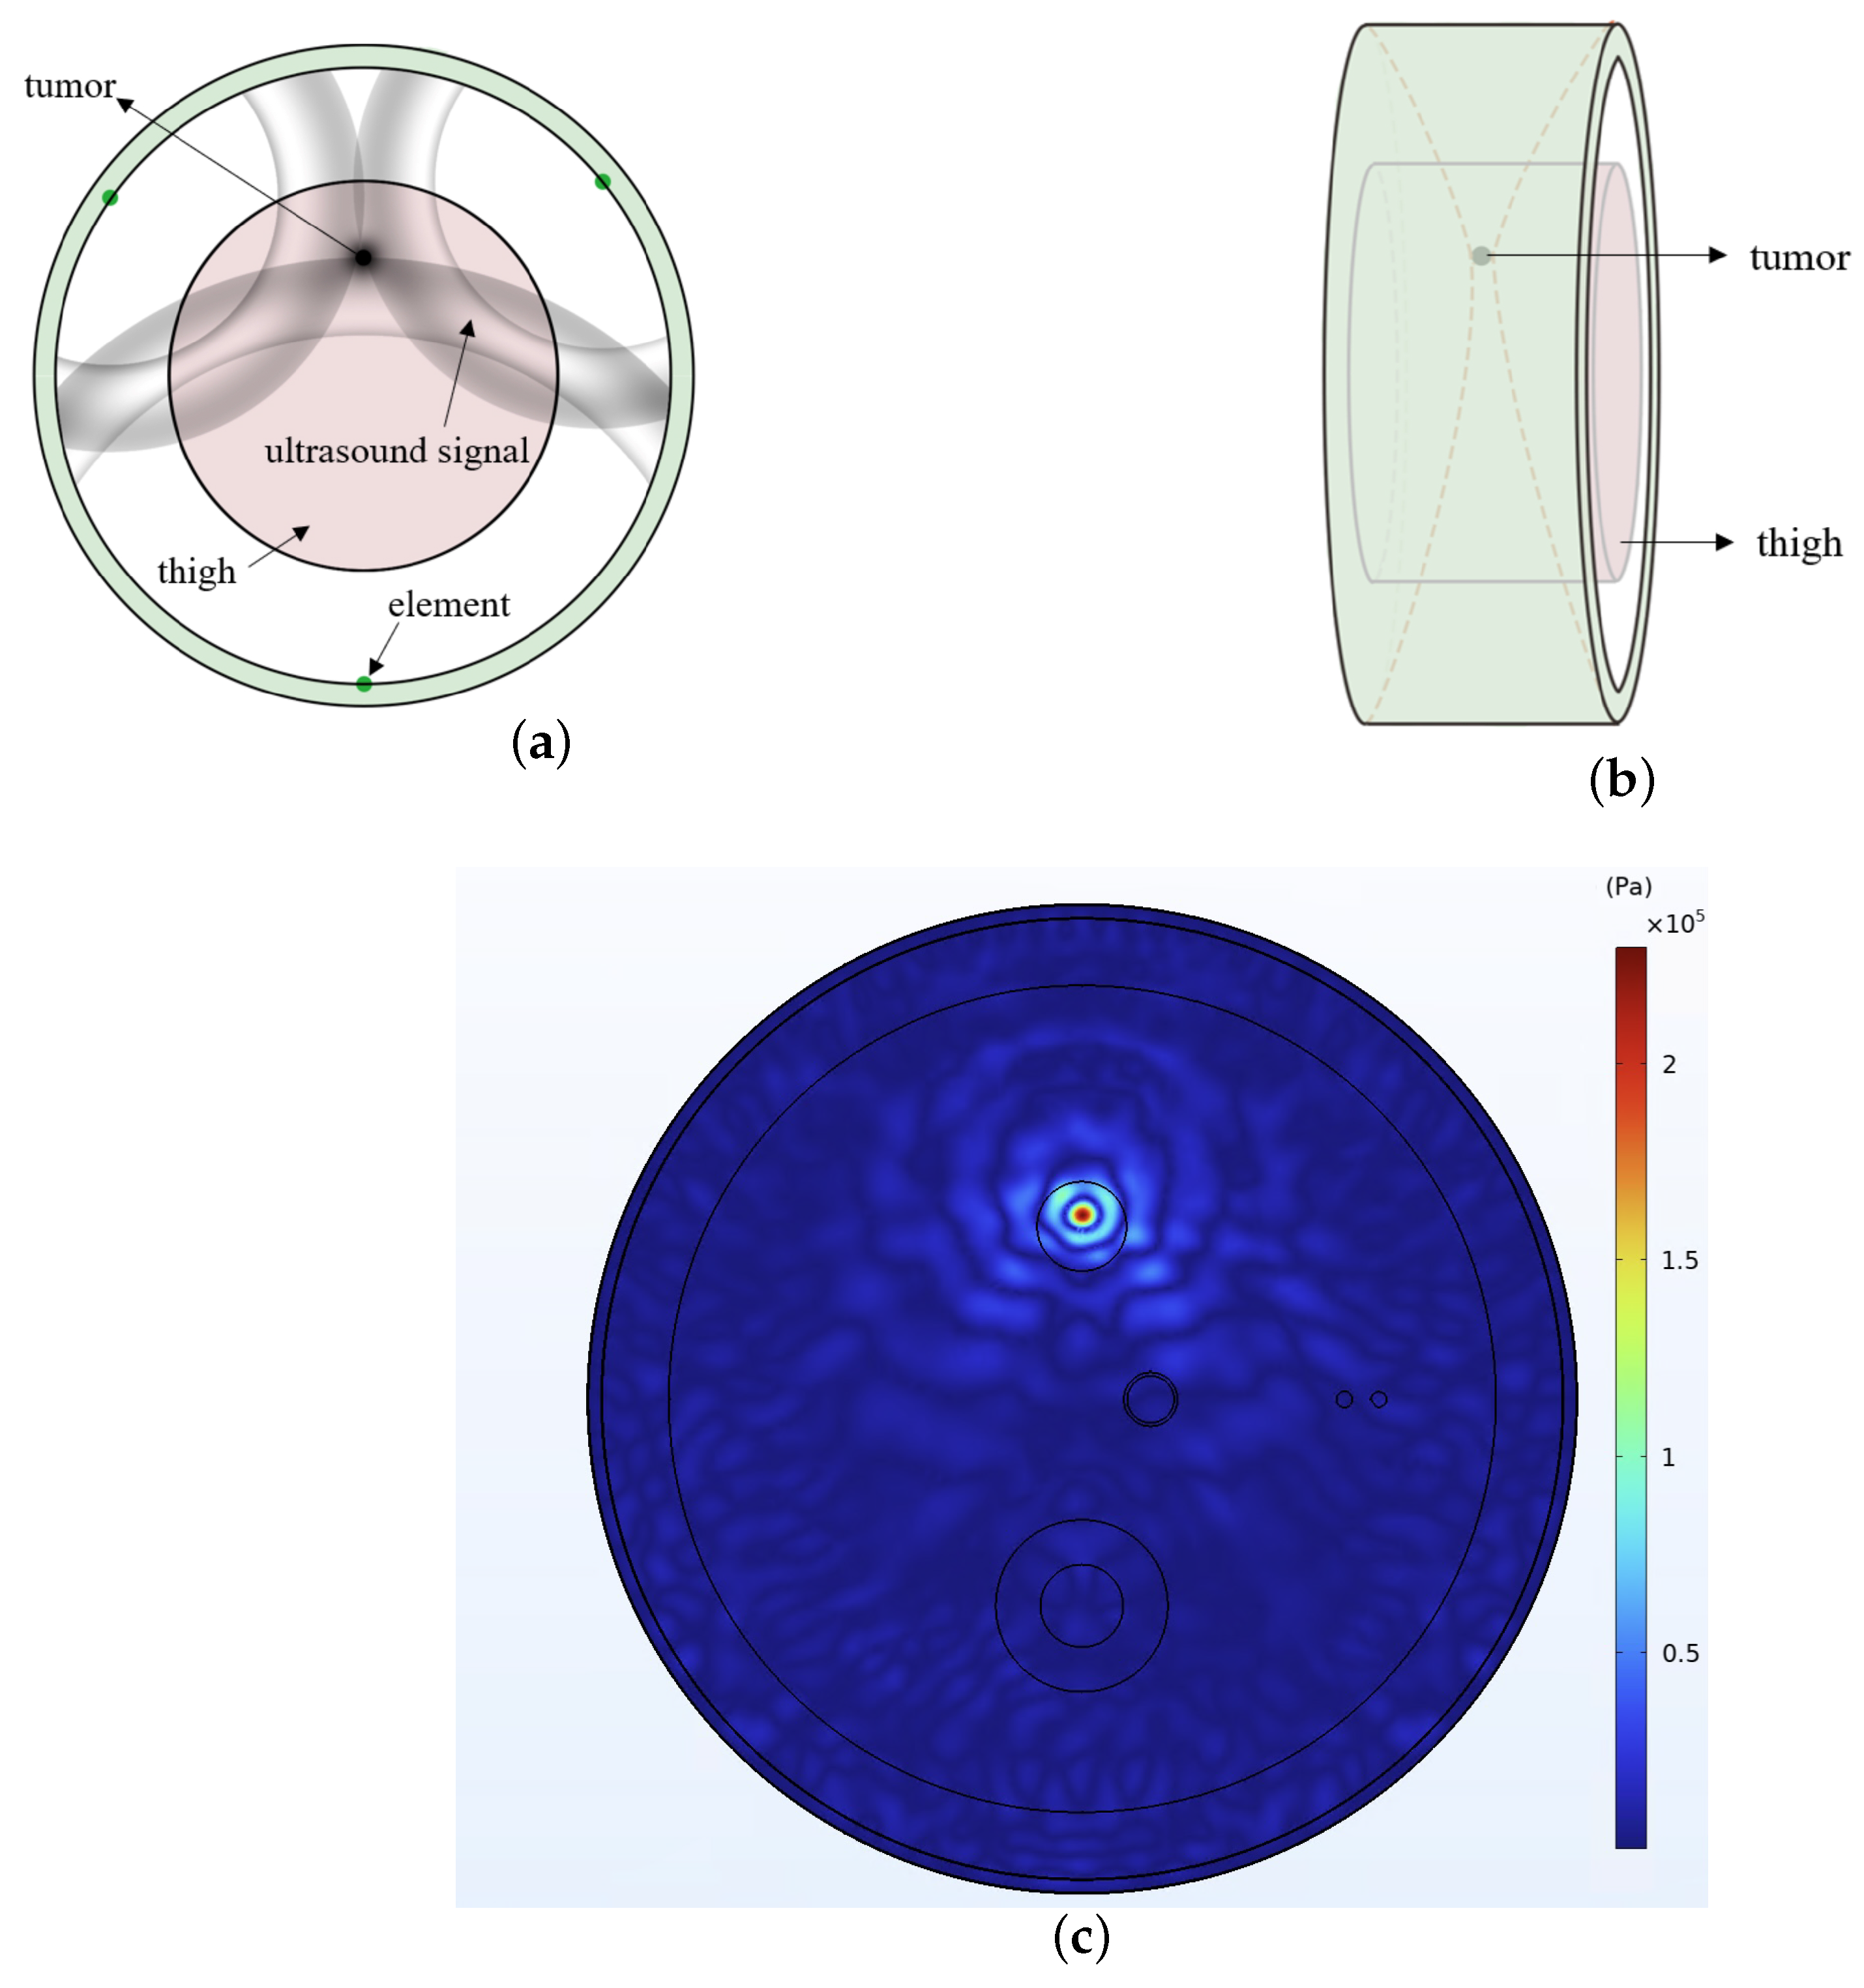
Our simulation is performed in a three-dimensional space supported by K-Wave. 3D simulation space is defined as N x × N y × N z ( 490 × 490 × 40 ) in grid size, in which the spacing of each grid point is about 0.449 mm. The actual physical size of the simulation model is 220 × 220 × 18 mm. By observing Figure 2a, we can find that the internal structures of the human thigh including: skin, subcutaneous fat, muscle, thigh bone, bone marrow, tumor and blood vessels. All the tissues are defined respectively with reference to the properties such as size, SOS, density, attenuation coefficient, thermal conductivity and heat capacity in Table 1 [49]. In addition, the blood perfusion rate is set to 0.01 s 1 . In our study, we assume the human thigh is placed in the ring ultrasound transducer array with 256 elements (with 100 mm radius and 9 mm height) as shown in Figure 1. The whole thigh is immersed in water at a constant temperature of 30 °C. All the ultrasound elements transmit pulse signals with five cycles. In addition, the center frequency of the transmitted signals is 1.5 Mhz whereas the sampling frequency is 12 MHz. Therefore, the wavelength is approximately 1mm calculated from the center frequency and SOS. Considering that the height of the ring ultrasound transducer array is 9 mm, the focal shape should be a linear acoustic source composed of nine elements instead of one single acoustic source. Figure 3a illustrates the focus of ultrasound signals emitted by three of the 256 elements. The gray level represents the intensity of sound pressure and the focus spot is in black. It is illustrated that the profiles of ultrasound signals generated by 2 of 256 elements in Figure 3b. Figure 3c shows the pressure field in Pa generated by the ring ultrasound transducer array with 256 elements.
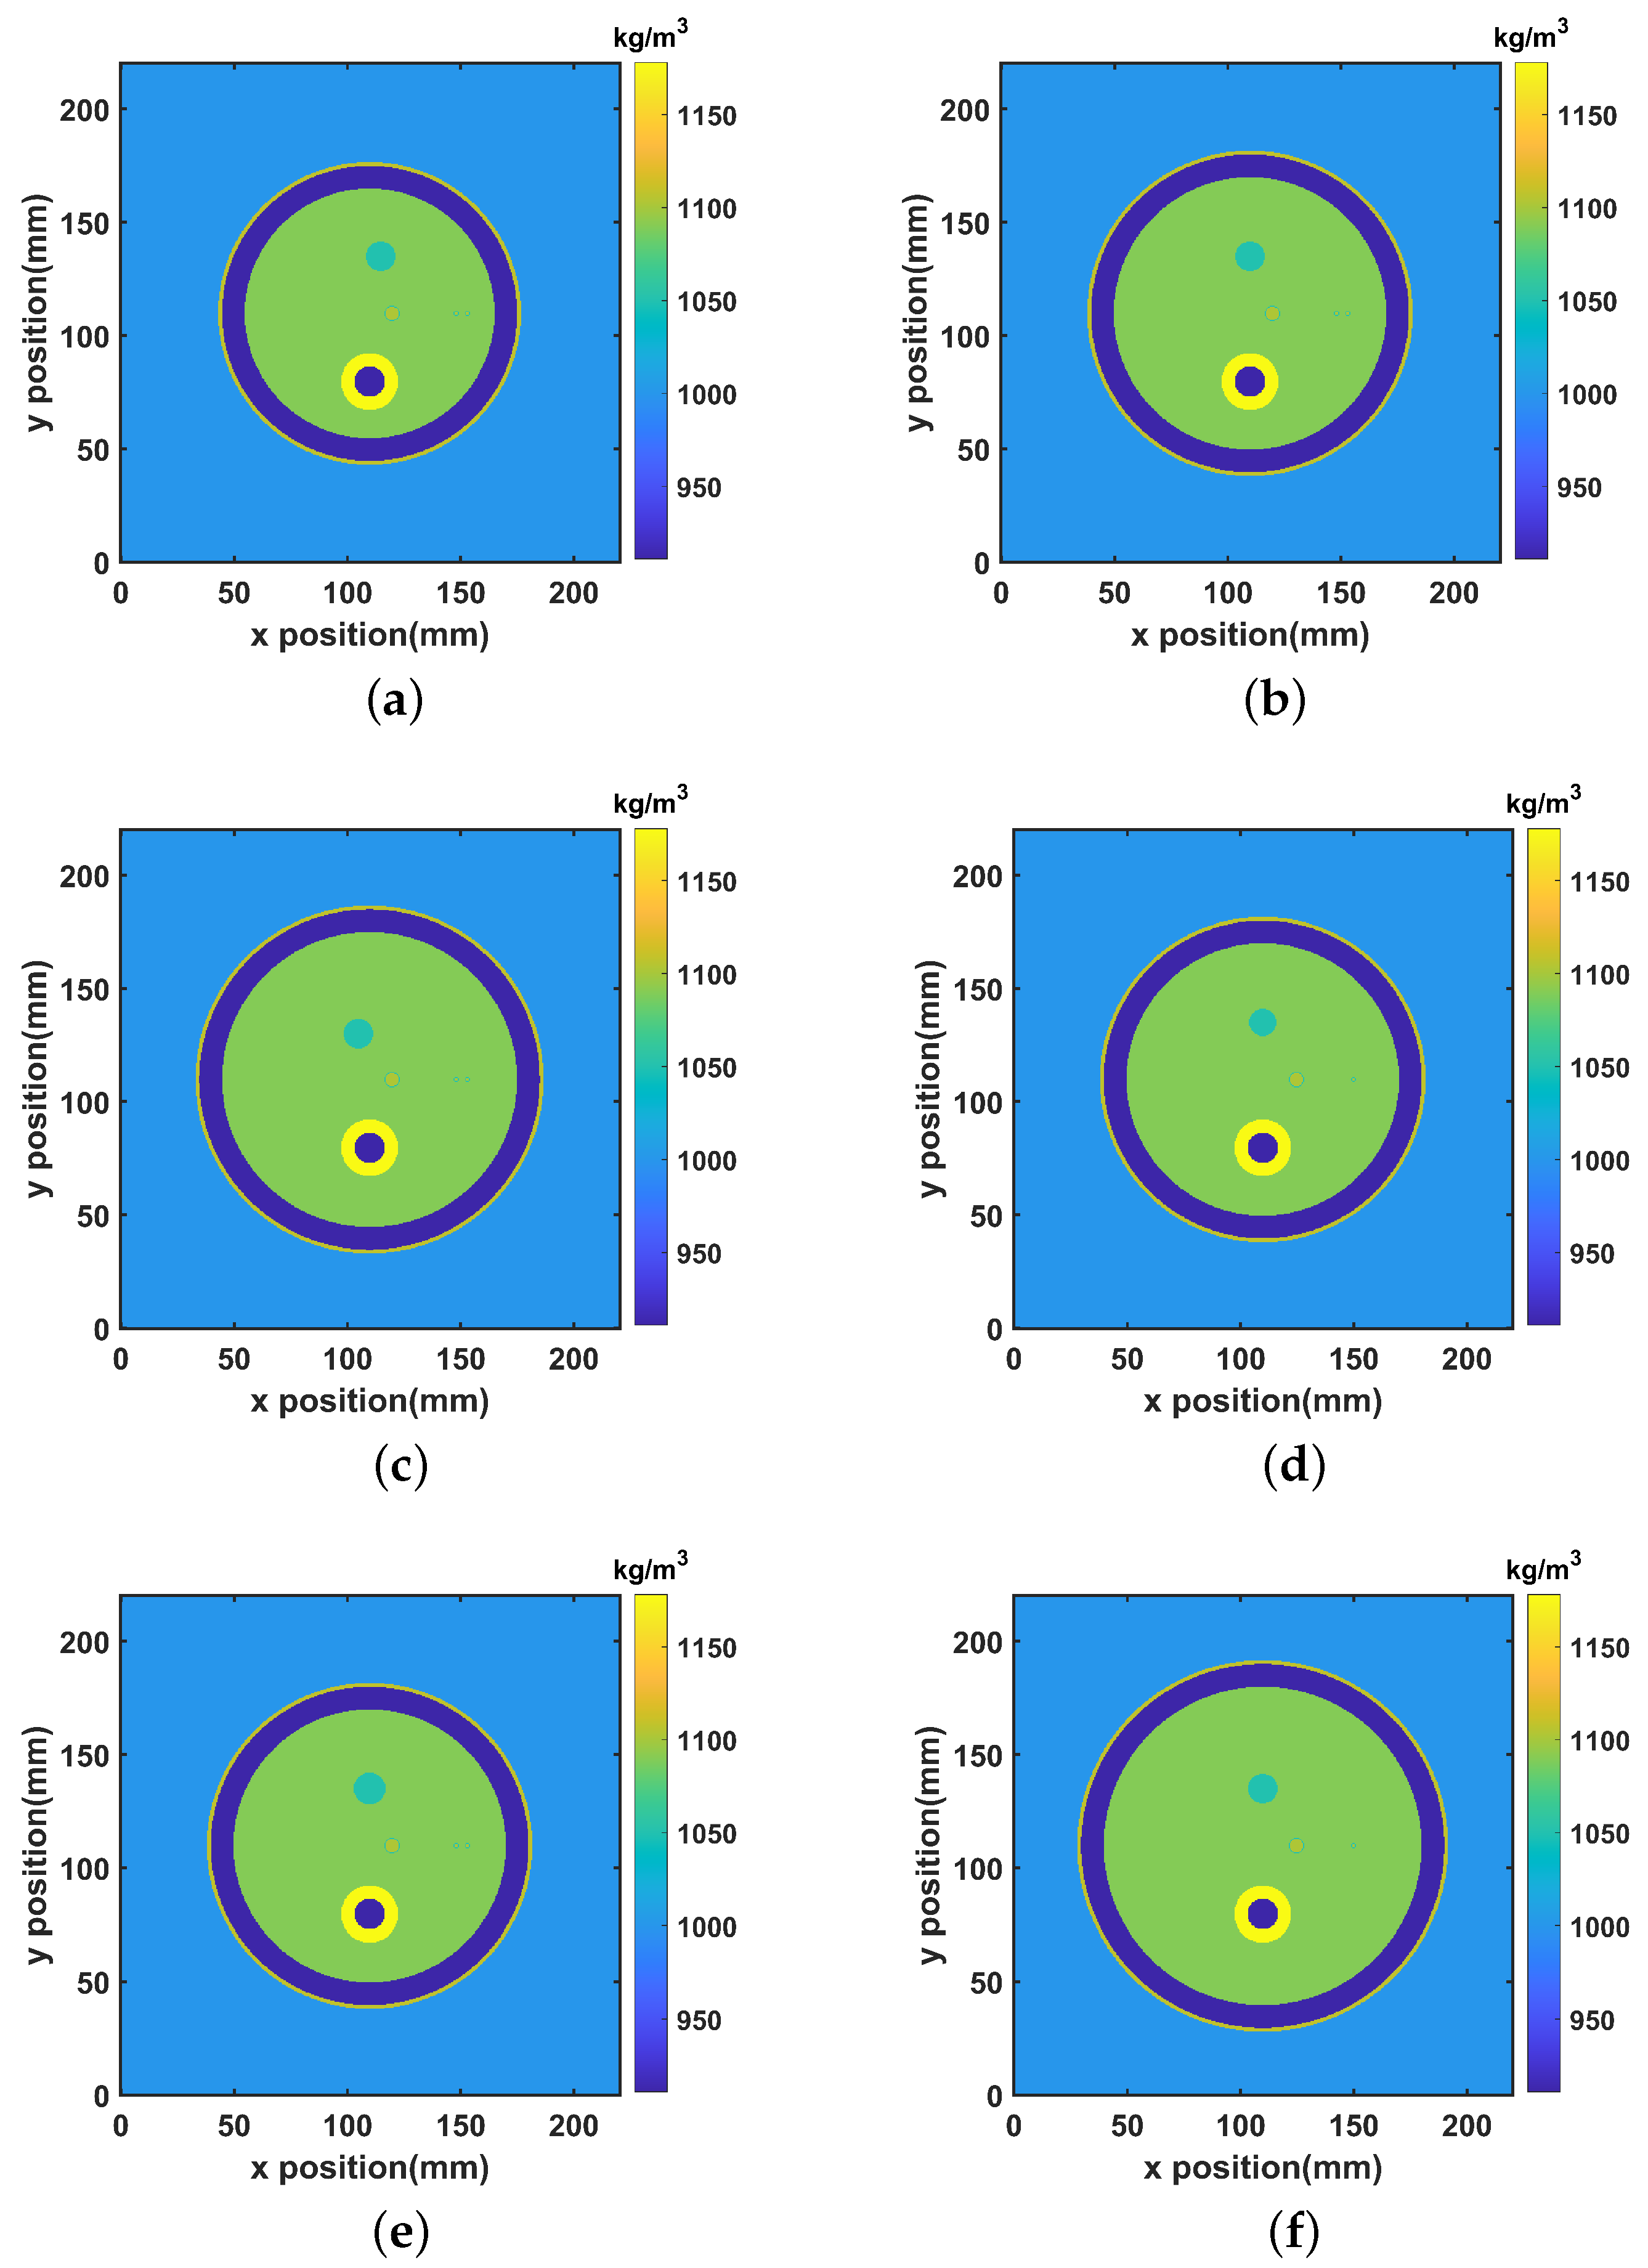
To confirm the universality of the simulation, we set three human thigh models with different muscle radius including 55.00 mm, 60.00 mm and 65.00 mm. Furthermore, we change the position of the tumor according to the growth characteristic that tumors may grow close to blood vessels because they rely on vessels to provide a lot of oxygen and nutrients [50]. The multiple models of human thigh referring to Figure 2a are given in Figure 4, which displays the density maps of different human thigh models.

3.3. Imaging

Figure 2a as a cross-sectional anatomy image provides a preliminary reference [51] for us to understand the human thigh structure. In order to build a simulation model with more details, the inner structure information of human thigh needs to be obtained by B-mode ultrasound imaging, especially the details of the tumor region.
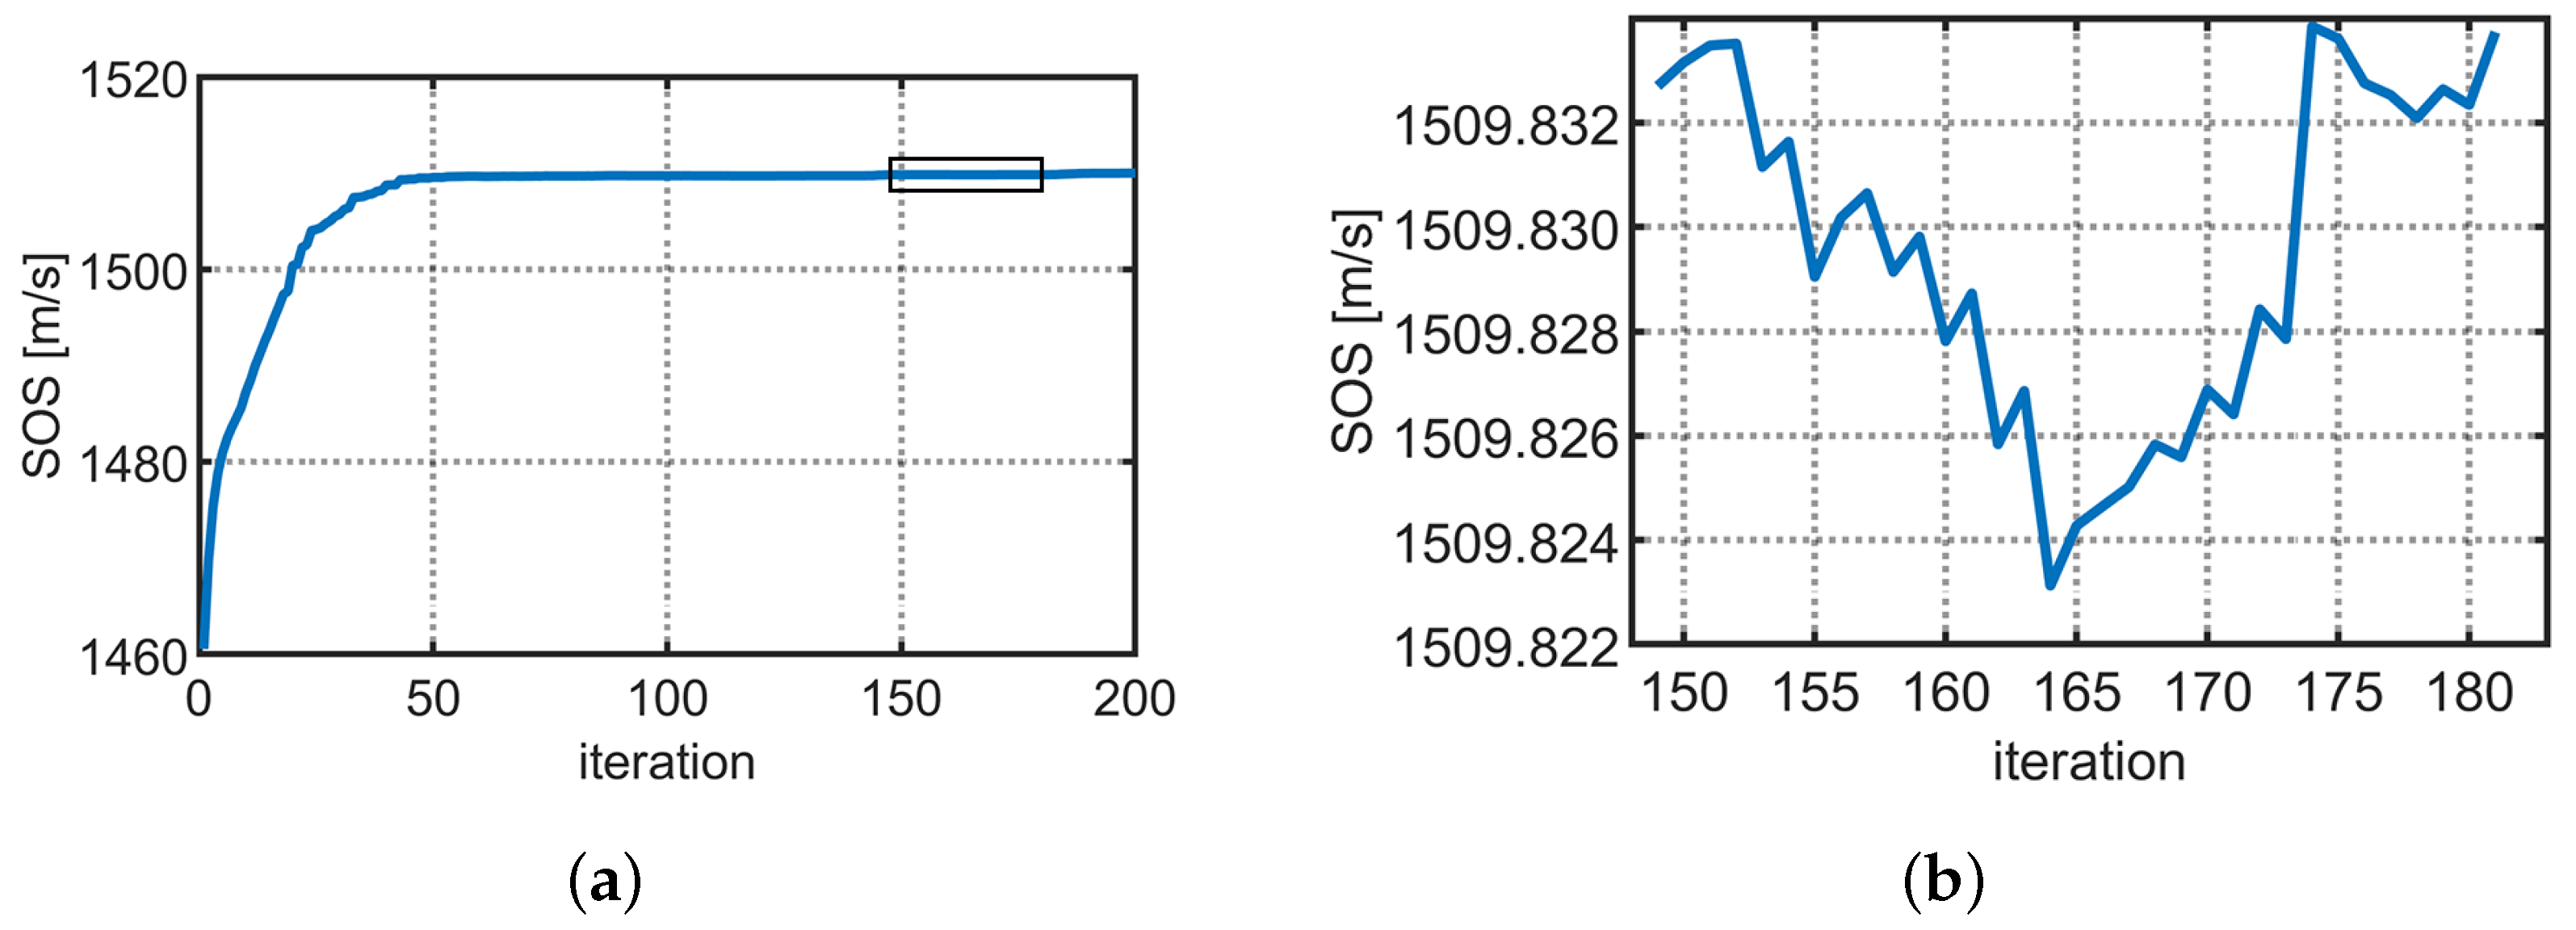
The B-mode ultrasound image of human thigh tissue has been constructed by the Delay and Sum (DAS) [52] algorithm, which is supported by the K-Wave simulation tool with ring ultrasound transducer array, as shown in Figure 2b. B-mode ultrasound image helps us to find the focus position for HIFU heating and provides us with the a priori information of the internal medium in SOS imaging. In the process of SOS image reconstruction, we first split up the human thigh model into seven parts including skin, subcutaneous fat, muscle, thigh bone, bone marrow, tumor and blood vessels with the boundary information from the B-mode ultrasound image. Due to the existence of thermal diffusion, the temperature gradually decreases along the direction of thermal diffusion with the focusing position as the center. Therefore, the SOS in each part is not consistent. The simplification model of SOS distribution reconstruction is established using the average value of each part in the actual SOS image as the value of the target SOS in the corresponding part. In the iterative estimation of SOS distribution with FWI method, the SOS in each part is unrelated with other parts and the initial SOS in each part refers to the acoustic properties of the corresponding human tissue. Furthermore, we set the SOS in thigh bone, bone marrow and blood vessels to the standard values (SOS values at room temperature) and keep the SOS in these regions constant. The reasons for the constant SOS in the above regions are as follows. Firstly, since the regions of bone and bone marrow are outside the effective heating area, HIFU heating almost has little influence in the two regions. Secondly, considering the size of vessel regions, the SOS change in the small region hardly contributes to the accuracy of the whole SOS iteration. Meanwhile, the SOS iteration in the small region is sensitive to noise which may lead to the wrong iteration direction of SOS, so it is necessary that SOS in vessel regions remains constant. These assumptions help us to improve the accuracy in estimating the SOS values and the reconstruction image of SOS is shown in Figure 2c. Since the accurate SOS in the tumor region is essential to the temperature-controlled hyperthermia, the SOS in the internal region of the tumor is averaged to improve the robustness and accuracy of SOS estimation. During the SOS imaging iteration, the averaged SOS value in tumor region is illustrated in Figure 5. From Figure 5b (a zooming curve of the black rectangle region in Figure 5a); we can discern that the SOS fluctuation in the tumor region can be limited to less than 0.2 m/s which in return can yield the temperature monitoring accuracy to 0.2 °C.

3.4. Temperature-Controlled Hyperthermia

Through the focusing process of HIFU, the ultrasound beams with high intensity are focused in the center of the tumor to generate acoustic pressure field that demonstrates a good focusing effect. Long-term constant temperature hyperthermia can be divided into two heating stages. The first heating stage aims to quickly heat the human thigh tissue until the temperature of the tumor center is close to the target temperature. The second heating stage is constant temperature control realized by the combination of the heat conduction equation (as shown in Equation (2)) and the equation of temperature-controlled hyperthermia model (as shown in Equation (4)).
The key of the second heating stage is dynamical modification of the heat source according to Equation (4) every 60 s. The core operator is set to multiple initial values suitable for different Δ T based on the relationshipthat and are inversely proportional (the product of m and Δ T ranges from 8 × 10 4 W/m 3 to 2 × 10 5 W/m 3 , which is also 0.005 to 0.01 times the amplitude of the heat source of the previous period). According to Equation (4), when the temperature of the tumor center exceeds the upper and lower limits of the target temperature, the operator will self-adjust by α times that of the previous period. It will self-decrease when the temperature rises and exceeds the upper limit, and it will self-increase to prevent the area of tumor cooling down when temperature drops. The initial values of α 1 and α 2 in our study are both set to 0.01. Since the relationship between temperature and SOS in the different human tissue is available (temperature and SOS vary in direct proportion), the temperature detection in the last heating period is converted from the SOS value which is updated accordingly.
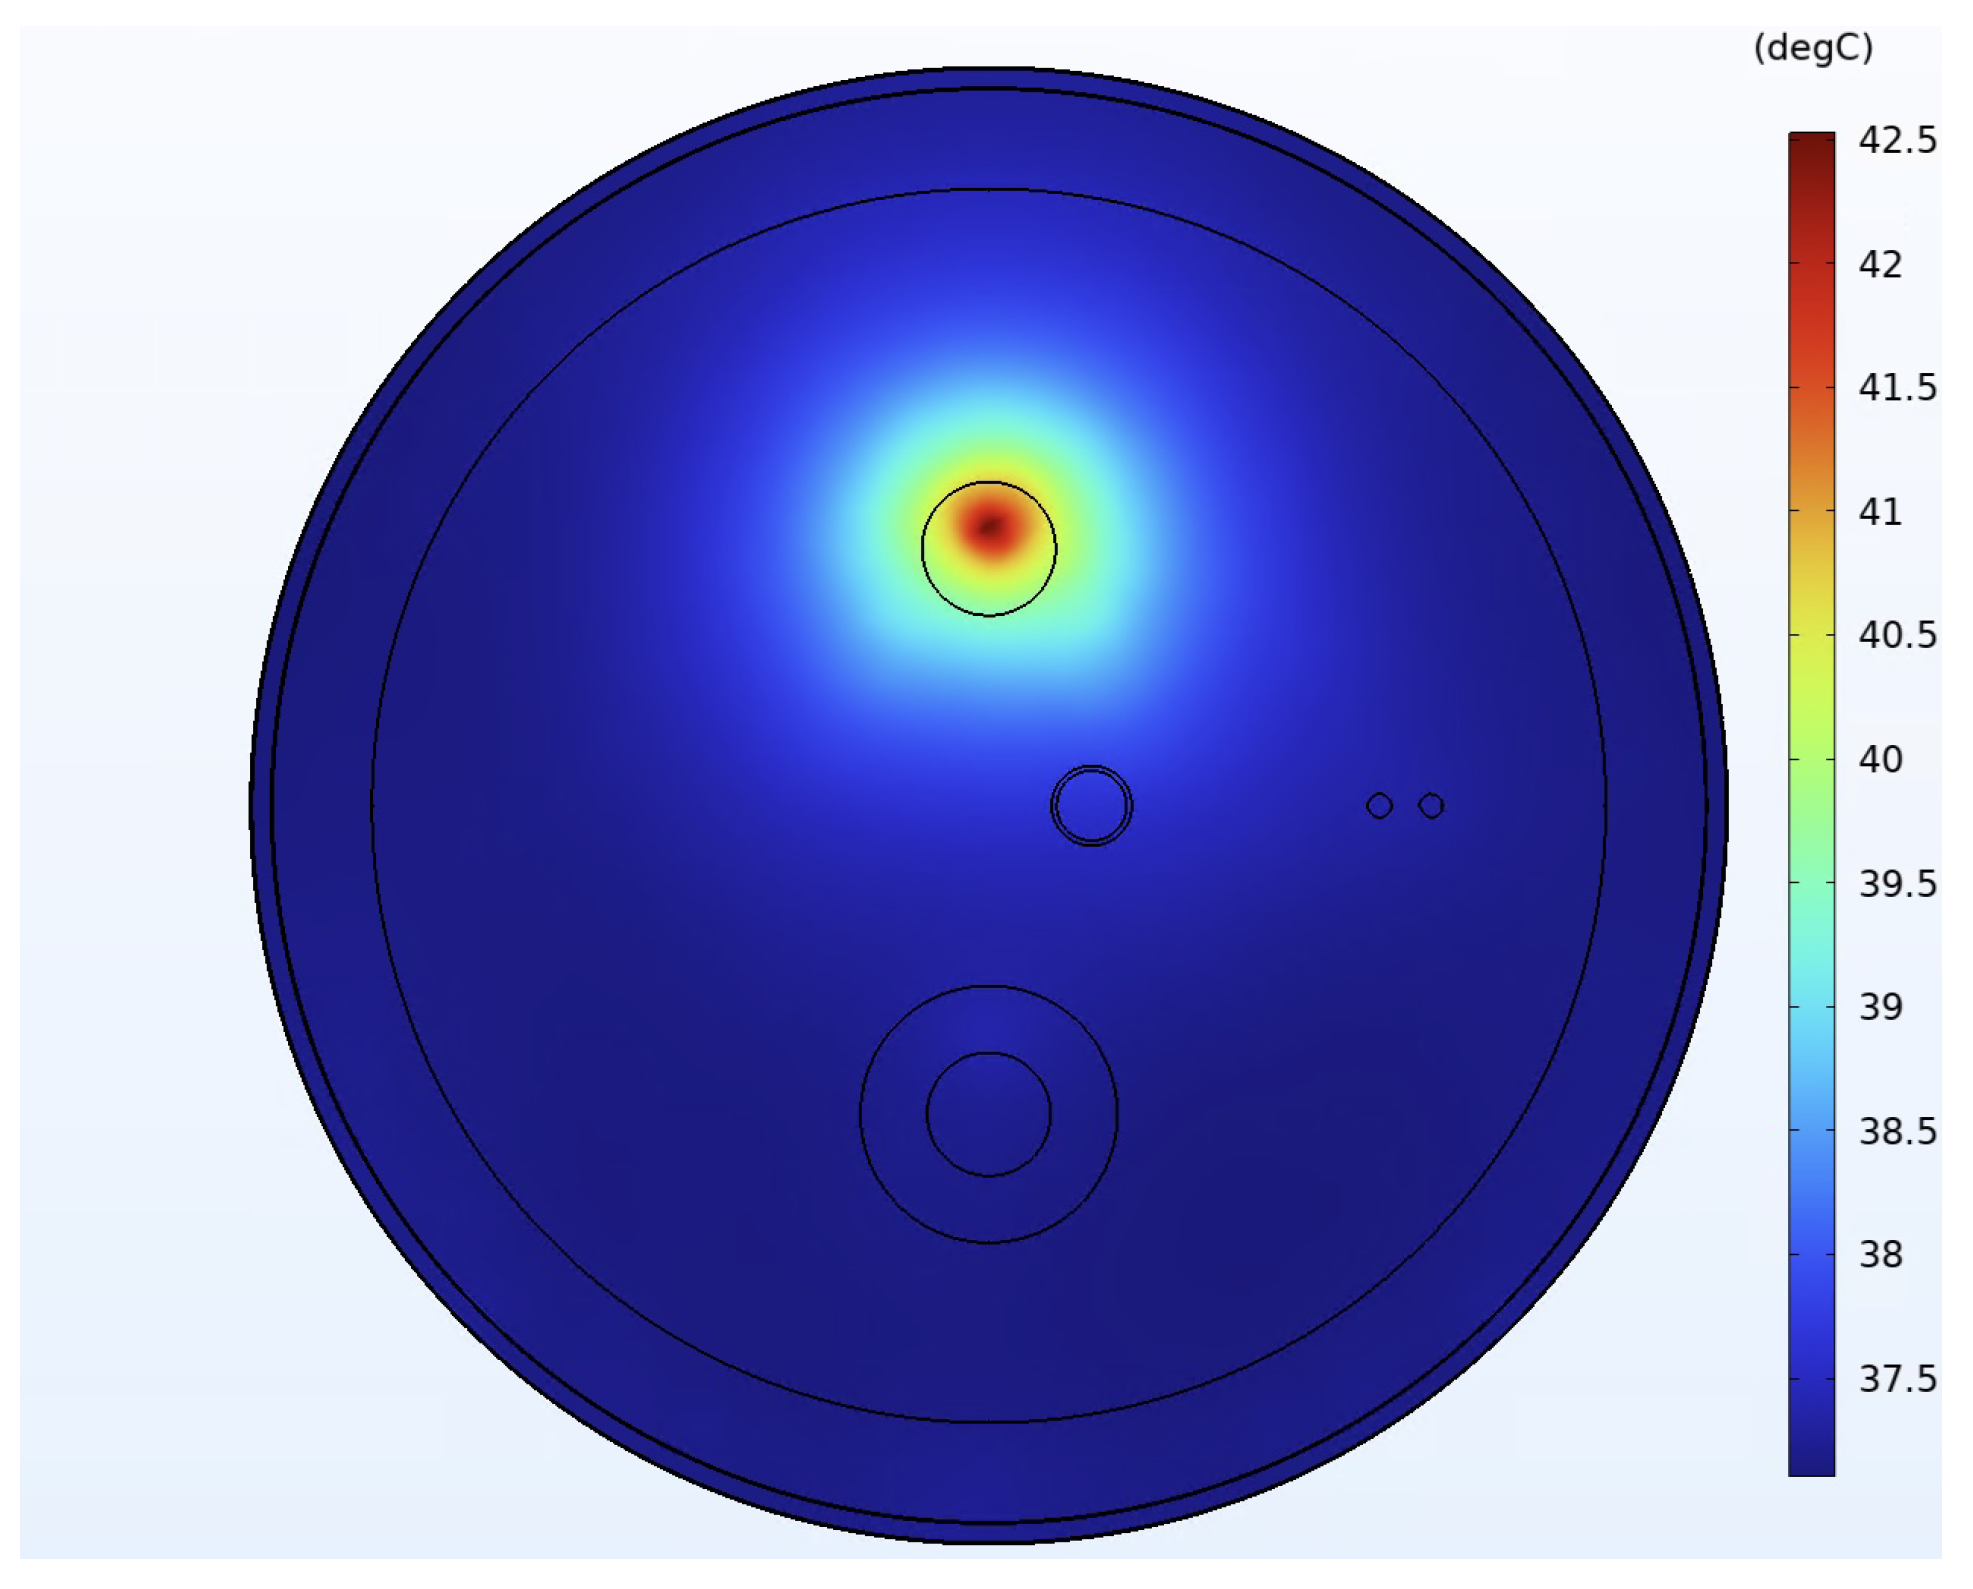
We set target temperatures at 43 °C for each model and the temperature control curve of long-term constant temperature hyperthermia is illustrated in Figure 6. It can be observed that the temperature can be kept within ±0.2 °C range of the target temperature with slight fluctuations for 5 h. Furthermore, we are also concerned with the temperature distribution in three-dimensional perspective during the whole heating process. We select model B in Figure 4b with the target temperature of 43 °C as an observation object, using COMSOL Multiphysics ® , for simulation. As shown in Figure 7, the heat is mainly concentrated in the center of the tumor and there is almost no obvious heat deposition in other areas, which proves that our HIFU heating can achieve precise focusing on the tumor.

4. Conclusions

This paper proposes a temperature-controlled hyperthermia model for tumor therapy with non-invasive temperature measurement through SOS imaging. We use the ring ultrasound transducer array to achieve a precise and variable focus position with good focusing effect at the tumor center. In addition, the results of the temperature control process prove that we have solved the critical problem of long-time temperature-controlled hyperthermia with the temperature being kept constant. Furthermore, the temperature monitoring and the constant-temperature hyperthermia sharing the same system are designed to guide the production of corresponding medical equipment, which realizes the integration of functions and reduces the difficulty of clinical implementation. When performing the simulation, the program divides the simulation space into several grids. Due to the small size of the individual array elements of the toroidal array transducer proposed in this paper, the deviation of this discretization is small. However, in practical applications, larger curved transducers are often used to increase the power of the transducer, which may lead to greater deviations in the sound field simulation. In this case, it is necessary to reduce the size of individual grids to improve the accuracy of the simulation, but this will lead to an increase in the resources occupied by the simulation. Balancing simulation accuracy and resource occupation is an issue worthy of continued discussion.
Next, we will produce the ring array transducer as designed and gradually test it on phantom, experimental animals to verify the reliability of our proposed thermal therapy model. Since the model is cost-controllable and non-invasive, it can extend the clinical application of hyperthermia. Furthermore, the thermotherapy model has good compatibility with several human sites, and with appropriate improvements, it may be possible to extend the treatment of tumors from the thigh to other parts of the body, such as the breast, providing promising clinical applications.

Author Contributions

Coding and test, Y.S. and H.W.; Theoretical analysis, Y.W.; System analysis, Y.C. and Y.G.; Project administrator, J.Y. and P.C. All authors have read and agreed to the published version of the manuscript.

Funding

This research received no external funding.

Institutional Review Board Statement

Not applicable.

Informed Consent Statement

Not applicable.

Data Availability Statement

The research data are available online https://github.com/YuchenSun2000/Hyperthermia, accessed on 1 June 2023.

Acknowledgments

In this study, we appreciate the valuable discussion on the future clinical application by Alexander Pattyn, Mohammad Ehrmohammadi and Karl Kratkiewicz from Wayne State University, Detroit, MI 48202, USA.

Conflicts of Interest

The authors declare no conflict of interest.

References

  1. Mallory, M.; Gogineni, E.; Jones, G.C.; Greer, L. Therapeutic hyperthermia: The old, the new, and the upcoming. Crit. Rev. Oncol. 2016, 97, 56–64. [Google Scholar] [CrossRef] [PubMed]
  2. Al-Bataineh, O.; Jenne, J.; Huber, P. Clinical and future applications of high intensity focused ultrasound in cancer. Cancer Treat. Rev. 2012, 38, 346–353. [Google Scholar] [CrossRef] [PubMed]
  3. Zhou, Y.-F. High intensity focused ultrasound in clinical tumor ablation. World J. Clin. Oncol. 2011, 2, 8. [Google Scholar] [CrossRef] [PubMed]
  4. Group, I.C.H.; Vernon, C.C.; Hand, J.W.; Field, S.B.; Machin, D.; Whaley, J.B.; van der Zee, J.; van Putten, W.L.; van Rhoon, G.C.; van Dijk, J.D.; et al. Radiotherapy with or without hyperthermia in the treatment of superficial localized breast cancer: Results from five randomized controlled trials. Int. J. Radiat. Oncol. Biol. Phys. 1996, 35, 731–744. [Google Scholar]
  5. Longo, T.A.; Gopalakrishna, A.; Tsivian, M.; Van Noord, M.; Rasch, C.R.; Inman, B.A.; Geijsen, E.D. A systematic review of regional hyperthermia therapy in bladder cancer. Int. J. Radiat. Oncol. Biol. Phys. 2016, 32, 381–389. [Google Scholar] [CrossRef]
  6. der Zee, T.J.V. Heating the patient: A promising approach? Ann. Oncol. 2002, 13, 1173–1184. [Google Scholar] [CrossRef]
  7. Habash, R.; Krewski, D.; Bansal, R.; Alhafid, H.T. Principles, applications, risks and benefits of therapeutic hyperthermia. Front. Biosci. Elite Ed. 2011, 3, 1169–1181. [Google Scholar] [CrossRef] [Green Version]
  8. Zhu, L.; Altman, M.B.; Laszlo, A.; Straube, W.; Zoberi, I.; Hallahan, D.E.; Chen, H. Ultrasound hyperthermia technology for radiosensitization. Ultrasound Med. Biol. 2019, 45, 1025–1043. [Google Scholar] [CrossRef] [Green Version]
  9. Eranki, A.; Srinivasan, P.; Ries, M.; Kim, A.; Lazarski, C.A.; Rossi, C.T.; Khokhlova, T.D.; Wilson, E.; Knoblach, S.M.; Sharma, K.V.; et al. High-Intensity focused ultrasound (HIFU) triggers immune sensitization of refractory murine neuroblastoma to checkpoint inhibitor therapy. Clin. Cancer Res. 2020, 26, 1152–1161. [Google Scholar] [CrossRef] [Green Version]
  10. Ebbini, E.S.; Haar, G.T. Ultrasound-guided therapeutic focused ultrasound: Current status and future directions. Int. J. Hyperth. 2015, 31, 77–89. [Google Scholar] [CrossRef]
  11. Botros, Y.Y.; Volakis, J.L.; VanBaren, P.; Ebbini, E.S. A hybrid computational model for ultrasound phased-array heating in presence of strongly scattering obstacles. IEEE Trans. Biomed. Eng. 1997, 44, 1039–1050. [Google Scholar] [CrossRef] [Green Version]
  12. Kennedy, J.E.; Haar, G.T.; Cranston, D. High intensity focused ultrasound: Surgery of the future? Br. J. Radiol. 2003, 76, 590–599. [Google Scholar] [CrossRef]
  13. Hindley, J.; Gedroyc, W.M.; Regan, L.; Regan, L.; Stewart, E.; Tempany, C.; Hynnen, K.; Macdanold, N.; Inbar, Y.; Itzchak, Y.; et al. MRI guidance of focused ultrasound therapy of uterine fibroids: Early results. Am. J. Roentgenol. 2004, 183, 1713–1719. [Google Scholar] [CrossRef]
  14. Huber, P.E.; Jenne, J.W.; Rastert, R.; Simiantonakis, I.; Sinn, H.P.; Strittmatter, H.J.; von Fournier, D.; Wannenmacher, M.F.; Debus, J. A new noninvasive approach in breast cancer therapy using magnetic resonance imaging-guided focused ultrasound surgery. Cancer Res. 2001, 61, 8441–8447. [Google Scholar]
  15. Martin, E.; Jeanmonod, D.; Morel, A.; Zadicario, E.; Werner, B. High-intensity focused ultrasound for noninvasive functional neurosurgery. Ann. Neurol. Off. J. Am. Neurol. Assoc. Child Neurol. Soc. 2009, 66, 858–861. [Google Scholar] [CrossRef] [Green Version]
  16. Wright, N.; Humphrey, J. Denaturation of collagen via heating: An irreversible rate process. Annu. Rev. Biomed. Eng. 2002, 4, 109–128. [Google Scholar] [CrossRef]
  17. Hildebr, T.B.; Wust, P.; Ahlers, O.; Dieing, A.; Sreenivasa, G.; Kerner, T.; Felix, R.; Riess, H. The cellular and molecular basis of hyperthermia. Crit. Rev. Oncol. 2002, 43, 33–56. [Google Scholar] [CrossRef]
  18. Mazumder, D.; Vasu, R.M.; Roy, D.; Kanhirodan, R. A remote temperature sensor for an ultrasound hyperthermia system using the acoustic signal derived from the heating signals. Int. J. Hyperth. 2018, 34, 122–131. [Google Scholar] [CrossRef]
  19. Solovchuk, M.A.; Hwang, S.C.; Chang, H.; Thiriet, M.; Sheu, T.W. Temperature elevation by HIFU in ex vivo porcine muscle: MRI measurement and simulation study. Med. Phys. 2014, 41, 052903. [Google Scholar] [CrossRef] [Green Version]
  20. Poorter, J.D.; Wagter, C.D.; Deene, Y.D.; Thomsen, C.; Ståhlberg, F.; Achten, E. Noninvasive MRI thermometry with the proton resonance frequency (PRF) method: In vivo results in human muscle. Magn. Reson. Med. 1995, 33, 74–81. [Google Scholar] [CrossRef]
  21. Crezee, J.; Van Leeuwen, C.M.; Oei, A.L.; van Heerden, L.E.; Bel, A.; Stalpers, L.J.A.; Ghadjar, P.; Franken, N.A.P.; Kok, H.P. Biological modelling of the radiation dose escalation effect of regional hyperthermia in cervical cancer. Radiat. Oncol. 2016, 11, 1–9. [Google Scholar] [CrossRef] [PubMed] [Green Version]
  22. Datta, N.R.; Rogers, S.; Ordóñez, S.G.; Puric, E.; Bodis, S. Hyperthermia and radiotherapy in the management of head and neck cancers: A systematic review and meta-analysis. Int. J. Hyperth. 2016, 32, 31–40. [Google Scholar] [CrossRef] [PubMed]
  23. Hurwitz, M.D.; Ghanouni, P.; Kanaev, S.V.; Iozeffi, D.; Gianfelice, D.; Fennessy, F.M.; Kuten, A.; Meyer, J.E.; LeBlang, S.D.; Roberts, A.; et al. Magnetic resonance–guided focused ultrasound for patients with painful bone metastases: Phase III trial results. JNCI J. Natl. Cancer Inst. 2014, 106, dju082. [Google Scholar] [CrossRef] [Green Version]
  24. Ellis, S.; Rieke, V.; Kohi, M.; Westphalen, A.C. Clinical applications for magnetic resonance guided high intensity focused ultrasound (MRgHIFU): Present and future. J. Med. Imaging Radiat. Oncol. 2013, 57, 391–399. [Google Scholar] [CrossRef] [PubMed]
  25. Celicanin, Z.; Manasseh, G.; Petrusca, L.; Scheffler, K.; Auboiroux, V.; Crowe, L.A.; Hyacinthe, J.N.; Natsuaki, Y.; Santini, F.; Becker, C.D.; et al. Hybrid ultrasound-MR guided HIFU treatment method with 3 D motion compensation. Magn. Reson. Med. 2018, 79, 2511–2523. [Google Scholar] [CrossRef] [PubMed]
  26. Ries, M.; de Senneville, B.D.; Regard, Y.; Moonen, C. Combined magnetic resonance imaging and ultrasound echography guidance for motion compensated HIFU interventions. AIP Conf. Proc. 2012, 1503, 202–206. [Google Scholar]
  27. Maloney, E.; Hwang, J.H. Emerging HIFU applications in cancer therapy. Int. J. Hyperth. 2015, 31, 302–309. [Google Scholar] [CrossRef]
  28. Vaezy, S.; Shi, X.; Martin, R.W.; Chi, E.; Nelson, P.I.; Bailey, M.R.; Crum, L.A. Real-time visualization of high-intensity focused ultrasound treatment using ultrasound imaging. Ltrasound Med. Biol. 2001, 27, 33–42. [Google Scholar] [CrossRef]
  29. Yagawa, Y.; Tanigawa, K.; Kobayashi, Y.; Yamamoto, M. Cancer immunity and therapy using hyperthermia with immunotherapy, radiotherapy, chemotherapy, and surgery. J. Cancer Metastasis Treat. 2017, 3, 218–230. [Google Scholar] [CrossRef]
  30. Bakker, A.; Holman, R.; Rodrigues, D.B.; Dobsicek Trefna, H.; Stauffer, P.R.; van Tienhoven, G.; Rasch, C.R.; Crezee, H. Analysis of clinical data to determine the minimum number of sensors required for adequate skin temperature monitoring of superficial hyperthermia treatments. Int. J. Hyperth. 2018, 34, 910–917. [Google Scholar] [CrossRef]
  31. Pierce, A.D. Acoustics: An Introduction to Its Physical Principles and Applications; Springer: Berlin/Heidelberg, Germany, 2019. [Google Scholar]
  32. Waters, K.R.; Mobley, J.; Miller, J.G. Causality-imposed (Kramers-Kronig) relationships between attenuation and dispersion. IEEE Trans. Ultrason. Ferroelectr. Freq. Control 2005, 52, 822–823. [Google Scholar] [CrossRef]
  33. Pennes, H.H. Analysis of tissue and arterial blood temperatures in the resting human forearm. J. Appl. Physiol. 1948, 1, 93–122. [Google Scholar] [CrossRef]
  34. Pérez-Liva, M.; Herraiz, J.; Udías, J.; Miller, E.; Cox, B.; Treeby, B. Time domain reconstruction of sound speed and attenuation in ultrasound computed tomography using full wave inversion. J. Acoust. Soc. Am. 2017, 141, 1595–1604. [Google Scholar] [CrossRef] [Green Version]
  35. Shishitani, T.; Yoshizawa, S.; Umemura, S.-I. 2P-46 Study on Change in Sound Speed by HIFU-Exposure in Chicken Breast Muscle. In Proceedings of the Symposium on Ultrasonic Electronics, Tokyo, Japan, 6–8 December 2010; Institute for Ultrasonic Elecronics: Hong Kong, China; Volume 31, pp. 381–382. [Google Scholar]
  36. Zhu, Y.H.; Yuan, J.; Pinter, S.Z.; Kripfgans, O.D.; Cheng, Q.; Wang, X.D.; Tao, C.; Liu, X.J.; Xu, G.; Carson, P.L. Adaptive optimization on ultrasonic transmission tomography-based temperature image for biomedical treatment. Chin. Phys. B 2017, 26, 064301. [Google Scholar] [CrossRef]
  37. Anam, C.; Haryanto, F.; Widita, R.; Arif, I.; Dougherty, G. An investigation of spatial resolution and noise in reconstructed CT images using iterative reconstruction (IR) and filtered back-projection (FBP). Ournal Phys. Conf. Ser. 2019, 1127, 012016. [Google Scholar] [CrossRef]
  38. Yuan, Y.; Shen, Y.; Zhao, Y.; Xiao, Y.; Jin, J.; Feng, N. A Modified Ray Tracing Method for Ultrasound Computed Tomography in Breast Imaging. In Proceedings of the 2020 IEEE International Instrumentation and Measurement Technology Conference (I2MTC), Dubrovnik, Croatia, 25–28 May 2020; pp. 1–6. [Google Scholar]
  39. Ozmen, N.; Dapp, R.; Zapf, M.; Gemmeke, H.; Ruiter, N.V.; van Dongen, K.W. Comparing different ultrasound imaging methods for breast cancer detection. IEEE Trans. Ultrason. Ferroelectr. Freq. Control 2015, 62, 637–646. [Google Scholar] [CrossRef] [Green Version]
  40. Hormati, A.; Jovanović, I.; Roy, O.; Vetterli, M. Robust ultrasound travel-time tomography using the bent ray model. In Medical Imaging 2010: Ultrasonic Imaging, Tomography, and Therapy; International Society for Optics and Photonics: Bellingham, WA, USA, 2010; Volume 7629, p. 76290I. [Google Scholar]
  41. Zhang, Z.; Huang, L.; Lin, Y. Efficient implementation of ultrasound waveform tomography using source encoding. In Medical Imaging 2012: Ultrasonic Imaging, Tomography, and Therapy; International Society for Optics and Photonics: Bellingham, WA, USA, 2012; p. 832003. [Google Scholar]
  42. Roy, O.; Jovanović, I.; Hormati, A.; Parhizkar, R.; Vetterli, M. Sound speed estimation using wave-based ultrasound tomography: Theory and GPU implementation. In Medical Imaging 2010: Ultrasonic Imaging, Tomography, and Therapy; International Society for Optics and Photonics: Bellingham, WA, USA, 2010; p. 76290J. [Google Scholar]
  43. Wiskin, J.; Borup, D.; Johnson, S.; Berggren, M. Non-linear inverse scattering: High resolution quantitative breast tissue tomography. J. Acoust. Soc. Am. 2012, 131, 3802–3813. [Google Scholar] [CrossRef] [Green Version]
  44. Wang, K.; Matthews, T.; Anis, F.; Li, C.; Duric, N.; Anastasio, M.A. Waveform inversion with source encoding for breast sound speed reconstruction in ultrasound computed tomography. IEEE Trans. Ultrason. Ferroelectr. 2015, 62, 475–493. [Google Scholar] [CrossRef] [Green Version]
  45. Li, Y.; Shi, Q.; Li, Y.; Song, X.; Liu, C.; Ta, D.; Wang, W. High-resolution bone microstructure imaging based on ultrasonic frequency-domain full-waveform inversion. Chin. Phys. B 2021, 30, 014302. [Google Scholar] [CrossRef]
  46. Treeby, B.E.; Cox, B.T. K-Wave: MATLAB toolbox for the simulation and reconstruction of photoacoustic wave fields. J. Biomed. Opt. 2010, 15, 021314. [Google Scholar] [CrossRef] [Green Version]
  47. Treeby, B.E.; Jaros, J.; Rendell, A.P.; Cox, B. Modeling nonlinear ultrasound propagation in heterogeneous media with power law absorption using ak-space pseudospectral method. J. Acoust. Soc. Am. 2012, 131, 4324–4336. [Google Scholar] [CrossRef] [PubMed] [Green Version]
  48. Treeby, B.E.; Cox, B.T. Modeling power law absorption and dispersion for acoustic propagation using the fractional Laplacian. J. Acoust. Soc. Am. 2010, 127, 2741–2748. [Google Scholar] [CrossRef] [PubMed] [Green Version]
  49. Folkman, J. Tumor angiogenesis: Therapeutic implications. N. Engl. J. Med. 1971, 285, 1182–1186. [Google Scholar] [PubMed]
  50. Eyckeshymer, A.C.; Schoemaker, D.M. A Cross-Sectional Anatomy; Meridith Corp: New York, NY, USA, 1970; p. 137. [Google Scholar]
  51. Duck, F.A. Physical Properties of Tissues: A Comprehensive Reference Book; Academic Press: Cambridge, MA, USA, 2013. [Google Scholar]
  52. Klemm, M.; Craddock, I.J.; Leendertz, J.A.; Preece, A.; Benjamin, R. Improved delay-and-sum beamforming algorithm for breast cancer detection. Int. J. Antennas Propag. 2008, 2008, 761402. [Google Scholar] [CrossRef] [Green Version]
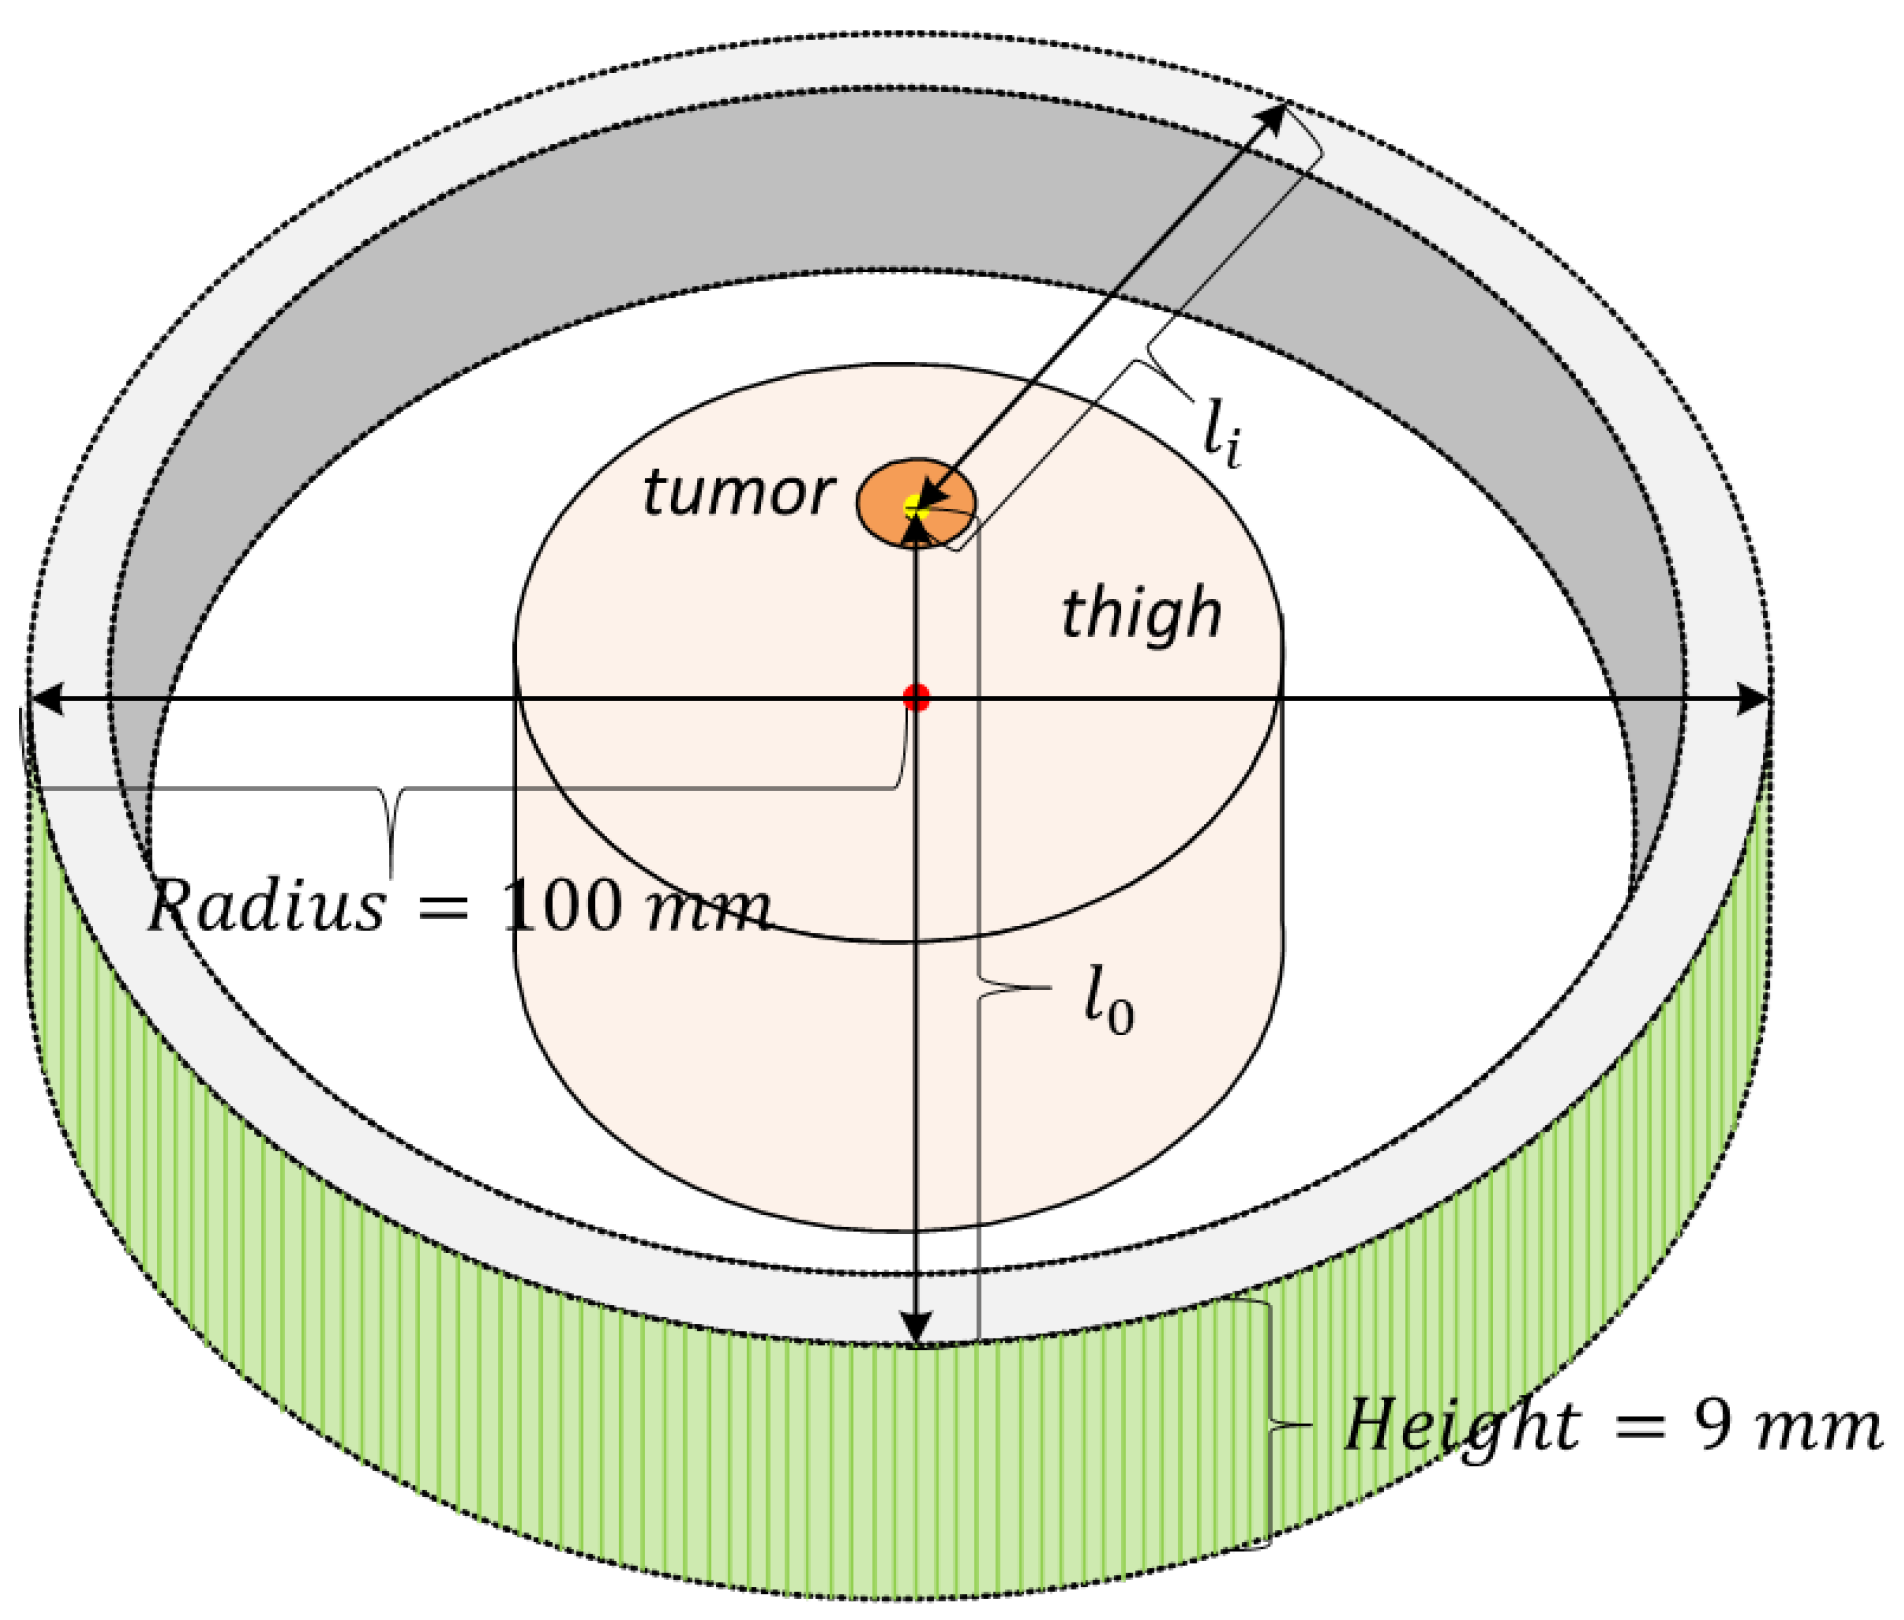
Figure 1. Schematic illustration of the ring ultrasound transducer array. The green ring on the periphery stands for the ring ultrasound transducer array of 256 elements. The flesh-colored cylinder indicates human thigh whereas the orange area indicates the tumor. Furthermore, the red dot is the center of the thigh cross section and the yellow dot is the center of tumor.
Applsci 13 07317 g001
Figure 2. (a) Cross-sectional anatomy image of human thigh tissue. (b) B-mode ultrasound imaging of human thigh tissue provided by K-Wave simulation tool with ring ultrasound transducer array. (c) Reconstruction image of SOS imaging (unit: m/s).
Applsci 13 07317 g002
Figure 3. (a) The focus of ultrasound signals emitted by 3 of 256 elements. (b) The profiles of ultrasound signals generated by 2 of 256 elements. (c) The pressure field generated by the ring ultrasound transducer array.
Applsci 13 07317 g003
Figure 4. Density map of human thigh model (Submerged in water). (a) Model A: radius of muscle is 55 mm, radius of tumor is 6.5 mm. (b) Model B: radius of muscle is 60 mm, radius of tumor is 6.5 mm. (c) Model C: radius of muscle is 65 mm, radius of tumor is 6.5 mm. (d) Model D: radius of muscle is 60 mm radius of tumor is 6 mm. (e) Model E: radius of muscle is 60 mm radius of tumor is 7 mm. (f) Model F: radius of muscle is 70 mm radius of tumor is 6.5 mm.
Applsci 13 07317 g004
Figure 5. (a) The sound speed iteration of tumor region. (b) The average sound speed fluctuation of tumor region in the black rectangular box of (a).
Applsci 13 07317 g005
Figure 6. Temperature control curve at tumor center for about 5 h’ HIFU heating with 43 °C target temperature.
Applsci 13 07317 g006
Figure 7. Temperature distribution at steady state.
Applsci 13 07317 g007
Table 1. Properties of medium.Size describes the internal structure in the simulation model we used. SOS, Density and Attenuation Coefficients were used to calculate the acoustic field, and Thermal Conductivity and Specific Heat Capacity were used to calculate the biological heat transfer.
MediumSize (mm)SOS (m/s)Density (kg/m 3 )Attenuation Coefficient (NP/Mhz·m)Thermal Conductivity (W/m · °C)Specific Heat Capacity (J/kg · °C)
Water220 × 220 × 18148210000.0250.604178
Skin1.70 (Thickness)1595110921.1580.373391
Fat10.00 (Radius)14309114.3580.212348
Muscle60.00 (Radius)158010907.1090.493421
Bone5.80 (Radius)2198117847.0000.321313
Bone Marrow6.70 (Radius)13729804.3580.202065
Tumor6.50 (Radius)145010505.6500.513540
Blood Vessel Wall0.50 (Thickness)157011007.0200.463306
Big Vessel (Blood)2.90 (Radius)155010602.3680.523617
small Vessel (Blood)0.65 (Radius)155010602.3680.523617
Disclaimer/Publisher’s Note: The statements, opinions and data contained in all publications are solely those of the individual author(s) and contributor(s) and not of MDPI and/or the editor(s). MDPI and/or the editor(s) disclaim responsibility for any injury to people or property resulting from any ideas, methods, instructions or products referred to in the content.