1. Introduction
The current outbreak of the novel coronavirus SARS-CoV-2 and its variants has spread to many countries [
1]. The virus has infected a wide range of humans and animals, with human-to-human transmission and animal-to-human transmission documented [
2,
3]. The number of infected people is still increasing, and many people show mild symptoms or no symptoms at all [
4,
5]. Asymptomatic infections are still at risk of transmission, which increases the difficulty of epidemic prevention, control, and monitoring. In the era of globalization, the rapid flow of the population has played a big role in the spread of the virus [
6]. Meanwhile, crowd gatherings and social interaction have accelerated the spread of the virus. At present, the main methods of epidemic prevention and control are to restrict interpersonal communication, maintain social distance, and wear masks, which can limit the spread of the epidemic to a certain extent [
7,
8]. However, these methods may also harm economic development and daily life [
9]. Due to the long development cycle of vaccines, the limited maintenance time of the human body, and the high rate of viral single-stranded RNA acquisition, it is foreseeable that the new coronavirus will impact activities.
In the information age, digital tracking technology and Geo-Information systems have played a vital role in the fight against COVID-19 [
10,
11,
12], providing a reference for solving travel restrictions. The analysis and mining of big data can help control and track the epidemic’s development, playing a role in prediction and prevention. Many countries have adopted close contact tracking applications [
13]. Different countries utilize different technologies such as Bluetooth, Global Positioning System (GPS), Global System for Mobile Communication (GSM) technology, mobile tracking technology, and card transaction data.
For instance, Health Code (China) and Corona100m (Korea) are applications that identify and store users’ location through GPS or GSM tracking. The government usually collects location data centrally, and contact tracking programs are mandatory in both countries. The Health Code’s holder’s movement is restricted by its color [
14,
15], which achieves isolation to some extent. However, it cannot be communicated between different provinces.
In addition to GPS positioning, many contact tracking applications use Bluetooth to estimate the distance between smartphones to protect privacy, such as COVIDSafe in Australia and TraceTogether in Singapore [
16]. Australia’s COVIDSafe uses Bluetooth to record the information of people who stayed for a set time within a set distance, and it will be automatically cleared after 21 days [
17]. This reduces the time needed to find and locate close contacts to a certain extent. However, there are strict restrictions on the duration of stay.
Furthermore, Apple and Google jointly developed an API for exposure notification, which can be used across borders. It is mainly based on the DP3T protocol [
18], a decentralized protocol. Exposure notification APIs have been applied by applications in many countries, such as COVID Tracker in Ireland and My Trace in Malaysia [
19]. The use and implementation largely depend on the corresponding public health department, and the authorities need to follow development standards such as privacy and security.
In addition to national application development, many research institutions and scholars have carried out a lot of related research. Nowadays, there are several types of related research on the use of Bluetooth for digital tracking. Firstly, many studies have used RSSI-based distance estimation. The authors of [
20] improved the accuracy of distance estimation based on RSSI, while the authors of [
21] found a method to maintain social distancing by RSSI. Secondly, some studies have optimized the framework design for privacy security. The authors of [
22] outline three common tracking application architectures and discuss privacy security issues. The authors of [
23] developed a privacy-preserving mobile and fog computing framework to track infections and suspected cases through fog nodes without revealing the identity of the infected person. Thirdly, some studies have assessed the risk level. The authors of [
24] use a combination of Bluetooth and GPS, providing a self-assessment of the severity of the new coronavirus. The authors of [
25] use different features to calculate the matching scores of two users to complete contact tracking. However, the above level assessment method given in those papers does not have real-time dynamics.
Therefore, the problem is that existing technology cannot accurately locate the sources of infection, and the epidemic prevention and control measures are inadequate. Taking all of this into account, this paper presents a system and method which can effectively locate the sources of infection with Bluetooth to solve the predicament. The system needs a Bluetooth system of smartphones and a server. We have designed and applied for a patent for the design of this system [
26].
This system provides the precise location of the infection sources based on GPS and Bluetooth, enabling real-time recording and close contact tracking. It also provides a real-time display of multi-user risk levels and the infection sources’ location information. The technical background will be introduced in the second section, and the related algorithms adopted by this method will be discussed in the third section. The fourth section will briefly introduce the system architecture and functional design. The proposed method’s advantage lies in the dynamic and real-time updating of the risk level, which updates the risk level of people at regular intervals during the process of crowd contact. Warnings are issued as the risk level changes to help users isolate and self-isolate. The system does not rely heavily on infectious disease monitoring, as it can calculate and update the regional risk level of each location and each person’s risk level at any time based on the flow of people’s big data. The method of locating the sources of infection can be applied to suppress the transmission of infectious diseases, thus controlling or preventing epidemics. The method can also intelligently generate epidemic investigation reports to guide epidemic prevention and control.
2. System Composition Architecture
As shown in
Figure 1, the overall system principle includes the data collection and transmission. User1 represents people in within short range of the circle of Bluetooth transmission of the target person, User2 represents persons located in the critical circle of the target person’s Bluetooth transmission, and User3 represents persons located outside the critical circle of the target person’s Bluetooth transmission. Users in different Bluetooth propagation circles have different effects on target users, and the probability of virus propagation is greatly reduced in the case of exceeding the risk range. Therefore, we record only the information of people in the proximity circle through the algorithm and record information about users’ close contacts through the software installed on the smartphone and update it to the server side through the network for unified processing. The measurement of the risk range is achieved by low-power Bluetooth technology. We will then describe these components in detail as follows.
2.1. Smartphone
Data collection is completed on smart devices such as smartphones, smartwatches, smart bands, etc. We use smartphones as an example in our system implementation.
Many people carry their smartphones with them, which makes it possible to track close contacts through smartphones [
27]. Therefore, we use smartphones to constantly perform Bluetooth scans and broadcasts by turning on background services and collecting the necessary data from each user. Smartphones collect the necessary data and store it in a local database. These data are then uploaded to the server under certain circumstances. The data on the mobile phone are set to expire and are periodically deleted from the local database of the mobile phone.
Specifically, the software installed on the target person’s mobile device may obtain Bluetooth permission and GPS permission to track the movement trajectory. By turning on the Bluetooth function, the target person can exchange individual identity information, personal risk level, and Bluetooth signal strength with other people in the Bluetooth critical transmission circle. Then, regular updates to personal risk levels are performed on the smartphone. The information transmitted by smartphones includes received signal strength information, target personal risk level, and personal protection information.
2.2. The Server
During the process of data transmission and processing, the mobile terminal transmits the user identity information, location information, protection information, and risk level information collected to the cloud platform’s database through the data network. The cloud platform is a general framework that provides data storage, computing, and network transmission functions. The large amount of data collected from the client require us to choose a cloud-centric database to build a powerful storage platform. We can also build a cloud service platform ourselves. We use the server to store and analyze data passed from the user’s local database, maintain the database on the server side, and update the risk level. When the user’s risk exceeds the threshold, a warning is sent to the client. When the user’s status becomes infected, the server will ask the user to upload a scan record of the local database. After comparing the time stamp and unique identifier, the server will return the list of close contacts.
As shown in
Figure 1, the server analyzes the uploaded data and manages the person risk information database, the regional risk information database, and the map library in real time. Through data network transmission, the relevant risk information may be available on smart mobile terminals. The user’s location may be visualized on the map, and an alarm may be given based on the set threshold. The server side can also generate risk reports based on big data, which assist in the prevention and control of the epidemic. Then, we can engage in real-time interaction with users.
When a person is found to be infected with a virus and is identified or tagged as an infected person, we can quickly obtain the personal information of the infected person through this system. We may use the database to obtain the places he has recently visited and screen out all the information of close contacts. These close contacts will receive the warning message as soon as possible. We can cooperate with mobile phone operators and send SMS notifications at the same time. Then, the risk level information can be updated promptly. As such, the system helps control the further spread of the epidemic. At the same time, the warning function reduces the possibility of exposure to dangerous environments and lessens the risk of spreading infections.
2.3. Low-Power Bluetooth Technology
In environments where GPS positioning is not accurate, such as indoor environments, Bluetooth positioning can be used in combination with GPS to accomplish accurate positioning. Bluetooth positioning has the benefit of low power consumption [
28]. The beacon node can automatically transmit information to users within its coverage area, determine the user’s location, and provide relevant information based on the location. In this system, we can obtain the distance between two devices through Bluetooth and exchange information between different mobile devices through Bluetooth.
Bluetooth Low Energy (BLE) has a wide range of applications for proximity detection and interaction, and both Google and Apple have introduced proximity-based applications [
29]. Furthermore, low-power Bluetooth technology is now heavily used in various mobile terminals. With the development and use of smart devices, Bluetooth has increasingly become useful as an everyday tool, providing the possibility for the practical application of this article. In low-power Bluetooth broadcast mode, the role of smart devices is divided into observer and broadcaster [
30,
31]. The Bluetooth protocol stack does not limit the range of roles of devices; each BLE device is peer-to-peer, and smartphones can act as both broadcasters and observers. There are two types of broadcast modes, non-connectable and connectable broadcasts. Connectable broadcasts allow another device to request a connection. In this article, we are using the non-connectable broadcast mode. In this mode, the device does not establish a connection, which ensures that neighboring devices do not access private information. To track contacts, we configure the smartphone to periodically broadcast advertising packets via the non-connected advertising mode. When a nearby smartphone receives the packet, it can measure the received signal strength.
2.3.1. Advertising Package
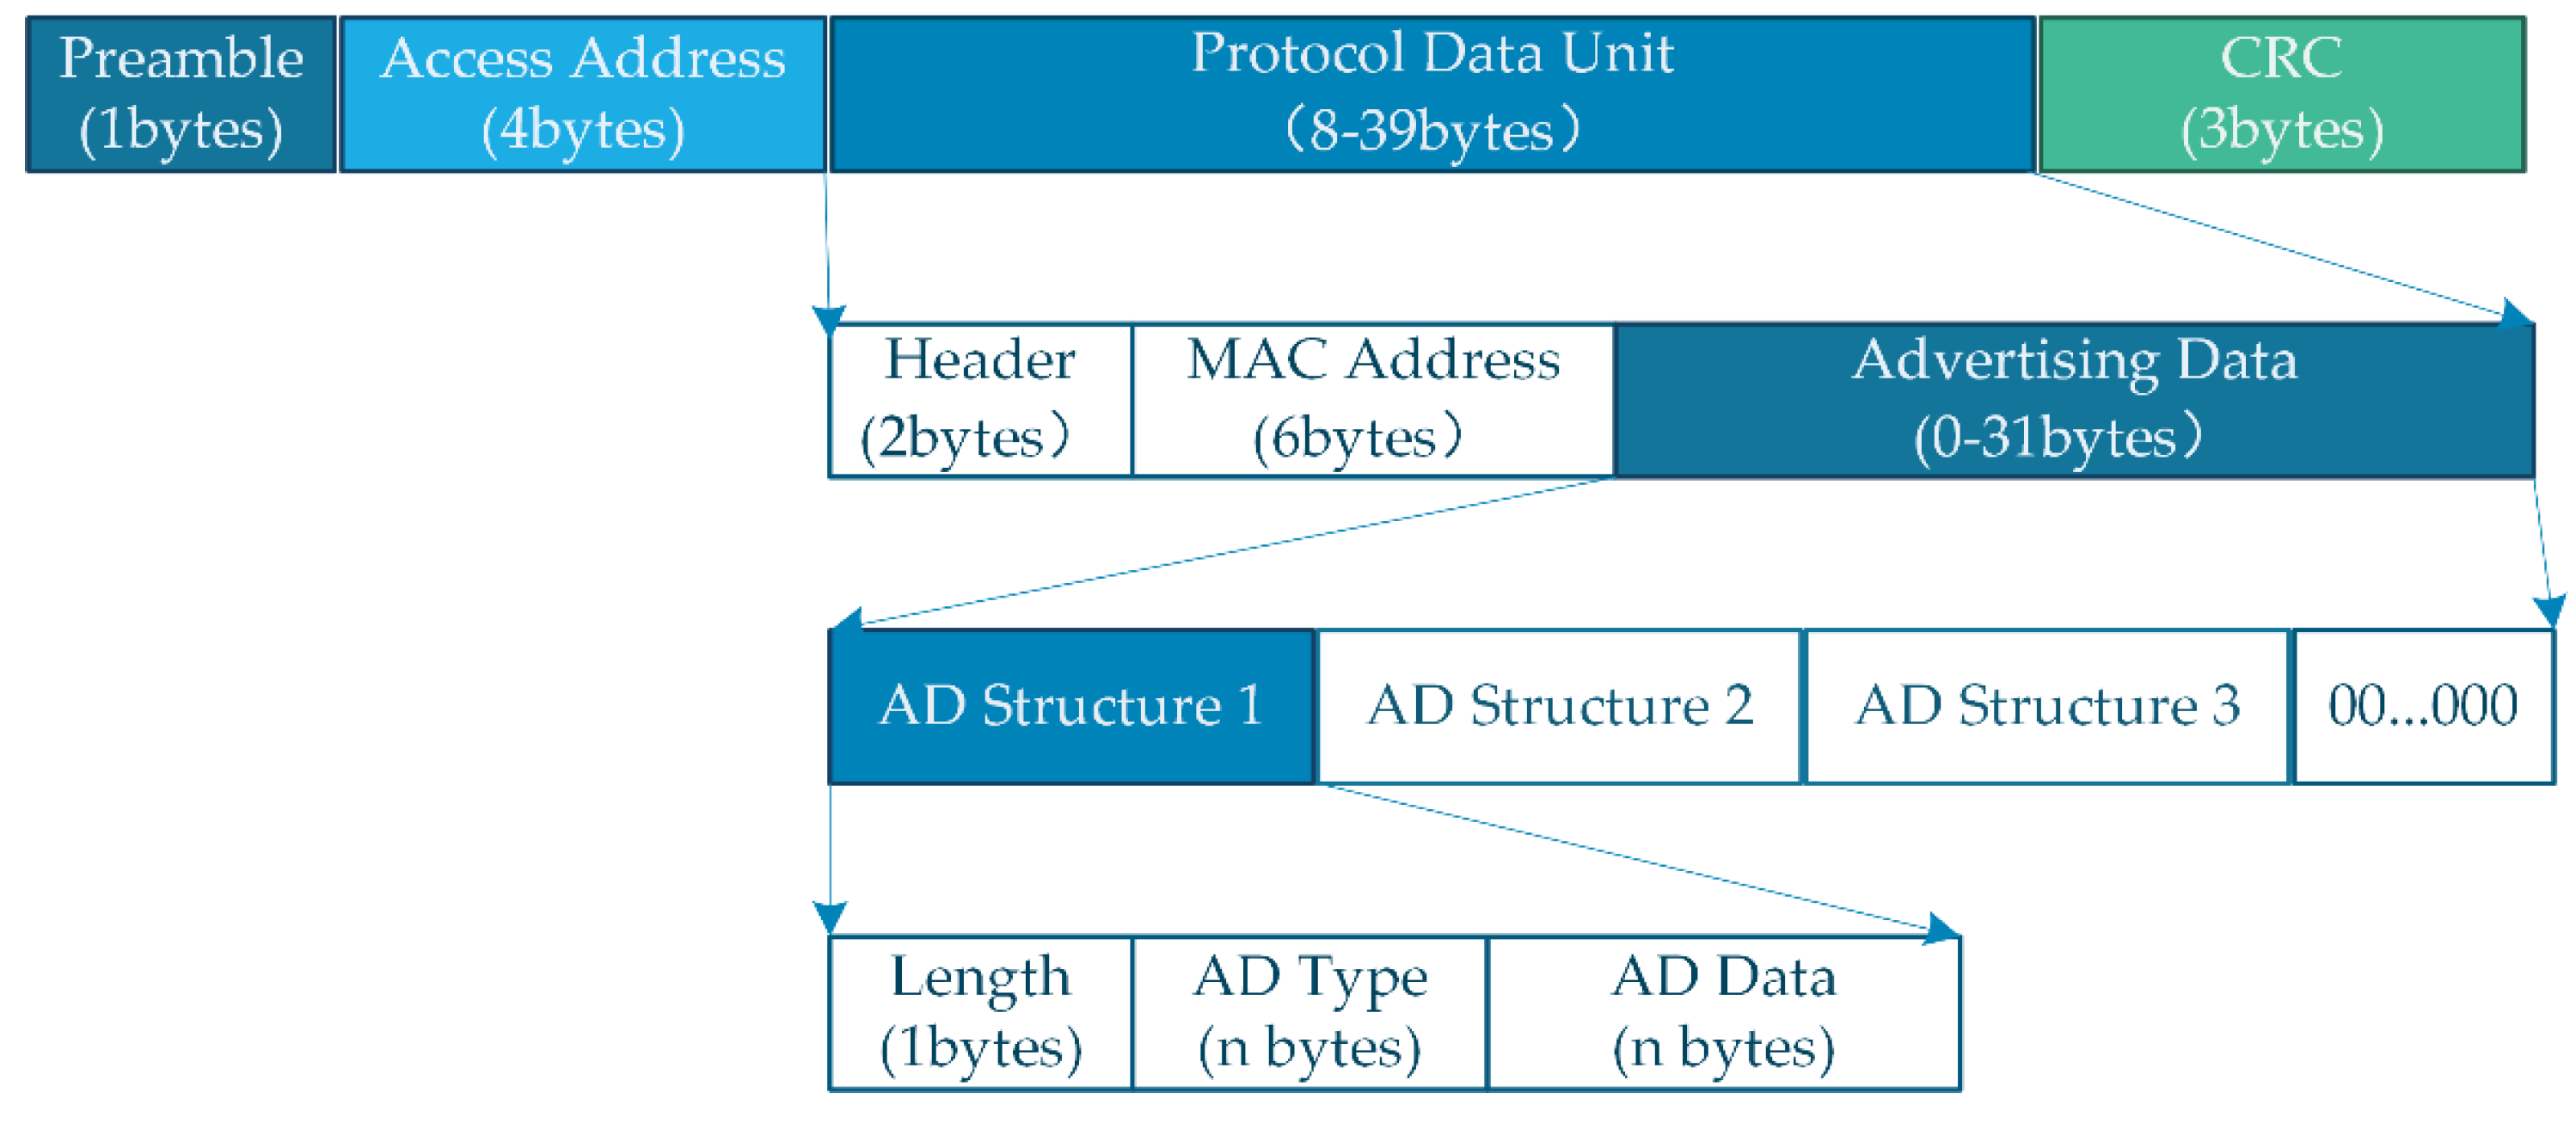
In the non-connected advertising mode, the smartphone will broadcast advertising packets periodically based on the advertising interval (the advertising interval defines the broadcast frequency of the message). As shown in
Figure 2, messages of up to 47 bytes can be broadcast. Note that 16 bytes are used for the preamble (1 byte), access address (4 bytes), header (2 bytes), MAC address (6 bytes) and CRC (3 bytes). Thus, there are 31 bytes left for information related to the environment signature. Both broadcast and scan response data are contained in multiple advertising (AD) data segments, and each AD data segment must consist of the length and data. Broadcast packets contain information including personal risk levels and other necessary information. It is sent as AD data after encryption.
Figure 3 shows an example of how the personal risk level and protection measures are translated into a stream of bytes, which are encrypted and packaged into advertising packets. From there, it spreads through the crowd.
2.3.2. Received Signal Strength Indication
The parameters related to distance estimation are mainly Received Signal Strength Indication (RSSI). The received Bluetooth signal RSSI has a certain mathematical relationship with the distance. According to the signal strength received by the transmitting end and the receiving end, the propagation loss of the signal is calculated and converted into the distance through the fitting regression function [
32]. The calculation method of the distance between two smart mobile terminals may be given as
where Dist is the distance between two devices,
is the signal strength from the Bluetooth port of the second mobile terminal to the first one,
is the signal strength from the Bluetooth port of the first mobile terminal to the second one,
is the Bluetooth channel attenuation coefficient under the standard 1-m distance,
is the environmental attenuation factor, and
represents the environmental correction parameters. According to the inverse square law, RSSI is inversely proportional to the square of the distance.
The above distance Dist is the estimated distance between two smart mobile terminals. Under normal circumstances, according to the surrounding environment, the value of
can be given as 59, the value of
is 2, and the value of
is 0.2 [
33].
Different environments have different effects on the variation of RSSI, even if the distance between any two devices in these environments is the same. Therefore, environmental factors need to be considered when applying the path loss model to estimate the distance for a given RSSI. After a comparative analysis of filtering algorithms, Kalman’s algorithm is the most effective solution [
34]. Kalman’s algorithm is a linear filter and the basic idea is to use the minimum mean square error as the best estimate of time and to complete the estimation of the state variables by the estimate of the previous moment and the observation of the current moment [
35].
Therefore, we preprocess the RSSI of the collected broadcast packets to obtain the corrected RSSI values. The Kalman filter model includes the following equations.
The Kalman filter time update equations are
The measurement update equations are
in Equation (2) is a prior state estimate and
is the covariance between the true and predicted values.
in Equation (3) is the Kalman gain,
is the optimal estimate and
is the covariance between the true value and the optimal estimate.
As shown in Equation (4), the Kalmafn gain characterizes the proportion of model predicted error to measurement error in the process of optimal state estimation.
As shown in
Figure 4, we extract the information of Bluetooth scan packets as RSSI array. The Kalman gain is calculated from Equation (4). Then,
and
are calculated from Equation (3). The corrected RSSI is
. The time update equations are updated according to the values of the measurement update equations. Afterwards, the next correction loop begins.
3. Risk Level Algorithm
In this system, the size of infection probability is described by the risk level. Therefore, as a core function, this section will discuss the algorithm to implement real-time updates and query function for the risk level, as well as the algorithm for early warning.
3.1. The Personal Risk Level Query
The system provides real-time personal risk level updates and queries. Due to the mobility of people, changes in the detection circumstances, the situation of contact people, and the characteristics of the contact area, the personal risk level needs to be updated in real time.
Taking into account the transmission characteristics of COVID-19 [
36], the risk level of each target person at each moment is related to the following factors:
The personal risk level at the previous time.
The personal risk level correction parameter that determined based on the detection information at the current moment.
The infection transmission probability at the previous time.
The regional risk level of the previous moment.
The infection probability of the environment which the target person is exposed to.
Wherein the current moment and the previous moment are separated by a period. The initial personal risk level of each target can be preset according to the initial information including the initial position and initial protective measures. Assuming the current moment is recorded as t, the period is recorded as
, and the previous moment is recorded as
, the calculation and update methods of the personal risk level of each target person at each moment may be determined by
where
is the risk level of the target person at
moment, D(t) is the risk level detection parameter of a person after the detection based on detection information at t moment,
is the risk level of each person obtained by the target person’s smartphone through Bluetooth interconnection within the set distance,
is the person number, and the total number of people other than target person is n.
is the transmission probability for infection. The infection transmission probability is determined by the relative position of the infected person’s device and each other device, and by the protective measures taken by the infected person. It is a small value.
is the regional risk level of the target person at the location
at time
.
, the probability of the target person being infected by others in the environment, is determined based on the target person’s protective measures and time spent in the environment.
Through the above formula, the personal risk level can be obtained iteratively, as shown in
Figure 5. The risk level detection parameter D(t) is an important influencing factor. The risk level can be cleared when sources of infection no longer exist in the monitoring environment. As the number of infected people increases and the environmental risk level rises, the risk level detection parameter increases. The risk level of the target person is affected by factors such as the target person’s protective measures, the infection rate of other people within the set range, and the environmental infection rate.
The people in the risk circle have an effect on the risk level of the target person. People with different risk levels set different infection transmission probabilities according to the relative position and protective measures of the people. The longer the distance, the lower the probability of propagation. As such, the risk level of people within the set range is added according to the weight and has an impact on the risk level of the target person at the current moment. In addition, the database must be called to check whether people in the current list are frequent contacts before adding. If there is frequent contact in 14 days, the impact will not be superimposed.
Taking into account the impact of the environment on the risk level of the person, the impact factor is determined by the protective measures of the target person and the time spent in the environment. If the target person stays in a high-risk environment for a long time, the value of will increase accordingly, the risk level of the person will increase, and the overall risk level will increase.
3.2. The Regional Risk Level Query
The system provides a real-time regional risk level query. The reasons for the update include personal contamination, disinfection measures, and the natural decay of viruses over time. The regional risk level of each target location at each moment is related to the following factors:
The regional risk level of the target location at the previous moment.
The disinfection coefficient at the previous time.
The personal risk level at the previous moment.
The transmission probability of the infected person to the environment and the infection source dissipation coefficient.
In this context, the current moment and the previous moment are separated by a period, and the initial regional risk level of each target location is preset.
The initial regional risk level of each target location can be preset according to the relevant data provided by the disease control department. Supposed that the current moment is recorded as t
1, the period is recorded as
, and the previous moment is
. The method of calculating the regional risk level of each target location at each moment may be given by
Here, is the regional risk level of location at time . is the disinfection coefficient of the virus that the virus in the current area before time is eliminated in a set ratio after disinfection measures are taken at time . is the personal risk level of number i at time . is the transmission probability of an infected person to the environment at time . In addition, the transmission probability of the infected person to the environment is related to the protection measures taken by and the risk level of the infected person. is the dissipation factor of the sources of infection, is the attenuation coefficient, and is the residence duration of the sources of infection. The attenuation coefficient is related to the environment and surrounding materials.
From the above formula, it can be confirmed that the regional risk level can also be obtained iteratively, as shown in
Figure 6. The regional risk level is related to the disinfection measures and the person remaining in the environment. If the disinfection is better, the regional risk level is lower, and the area is safer. If there is a long-term gathering of infected persons in this area, the longer the time, the higher the regional risk level will be under the influence of the second term of Equation (6). If a person in range is not an infected person, the infection transmission rate gamma is 0, which does not affect the risk level of the region. The second term on the right side of the Equation (6) calls the database to check whether people in the current list are infected within 14 days before adding. If they are not, the impact will not be superimposed.
3.3. The Early Warning and the High-Risk Warning
The system provides early warning, which is divided into two aspects. Alarms are given to smart mobile terminals with a regional risk level greater than the set regional risk level threshold. Simultaneously, if a smart mobile device with a personal risk level exceeding the predetermined threshold enters the designated Bluetooth connectivity range, an alert will be activated. The Bluetooth interconnection range may be 30 m. Distance measurements can be obtained using the RSSI distance conversion algorithm described in the previous section. During the actual application process, areas with a regional risk level higher than the regional risk level threshold are designed as high-risk areas. Additionally, individuals whose personal risk level exceeds the set personal risk level threshold are considered high-risk persons. In this article, we did not consider exact scope or classification standards. The research and system implementation data from epidemiologists will play an important role in this regard.
When a high-risk person appears in the iterative process, the server side of the cloud platform will send alarm information to the high-risk target and the relevant management department to process the alarm information and perform nucleic acid detection and screening. The system backtracks the contact within 14 days, sends a warning notice to these people for the first time, and updates their risk level. People with high risk will display a red circle range on the map, and an alarm will be given to each smart mobile terminal when people with high risk enter the range set for Bluetooth.
Official announcements are required to check existing areas with medium and high risk levels, which can be inconvenient. It is unlikely that users will be aware of all the places to avoid, and in such cases, the area alarm function of this system provides great assistance. High-risk areas are marked in red on the map in the alarm feature. Early warnings are achieved by regularly requesting area risk level updates from the server, based on the user’s current location information. When the user is near high-risk areas, the server system sends a warning message to their intelligent terminal, and protective tips appear in a pop-up window.
4. System Structure Design
This section discusses the architecture and implementation of the system. This paper only serves as a reference for the method of locating infection sources.
4.1. System Architecture
We have developed a smartphone application to demonstrate our proposed system. The application has several functions:
Provide risk level queries: After entering the necessary parameters, the query includes the risk level of personnel and the risk level of the area.
Provide location tracking function and self-information display interface: Visualize the collected data on a digital map and generate epidemic reports to reflect the epidemic status intuitively.
Update the epidemic status in real-time, track the movement of the infectious sources, and realize rapid contact positioning.
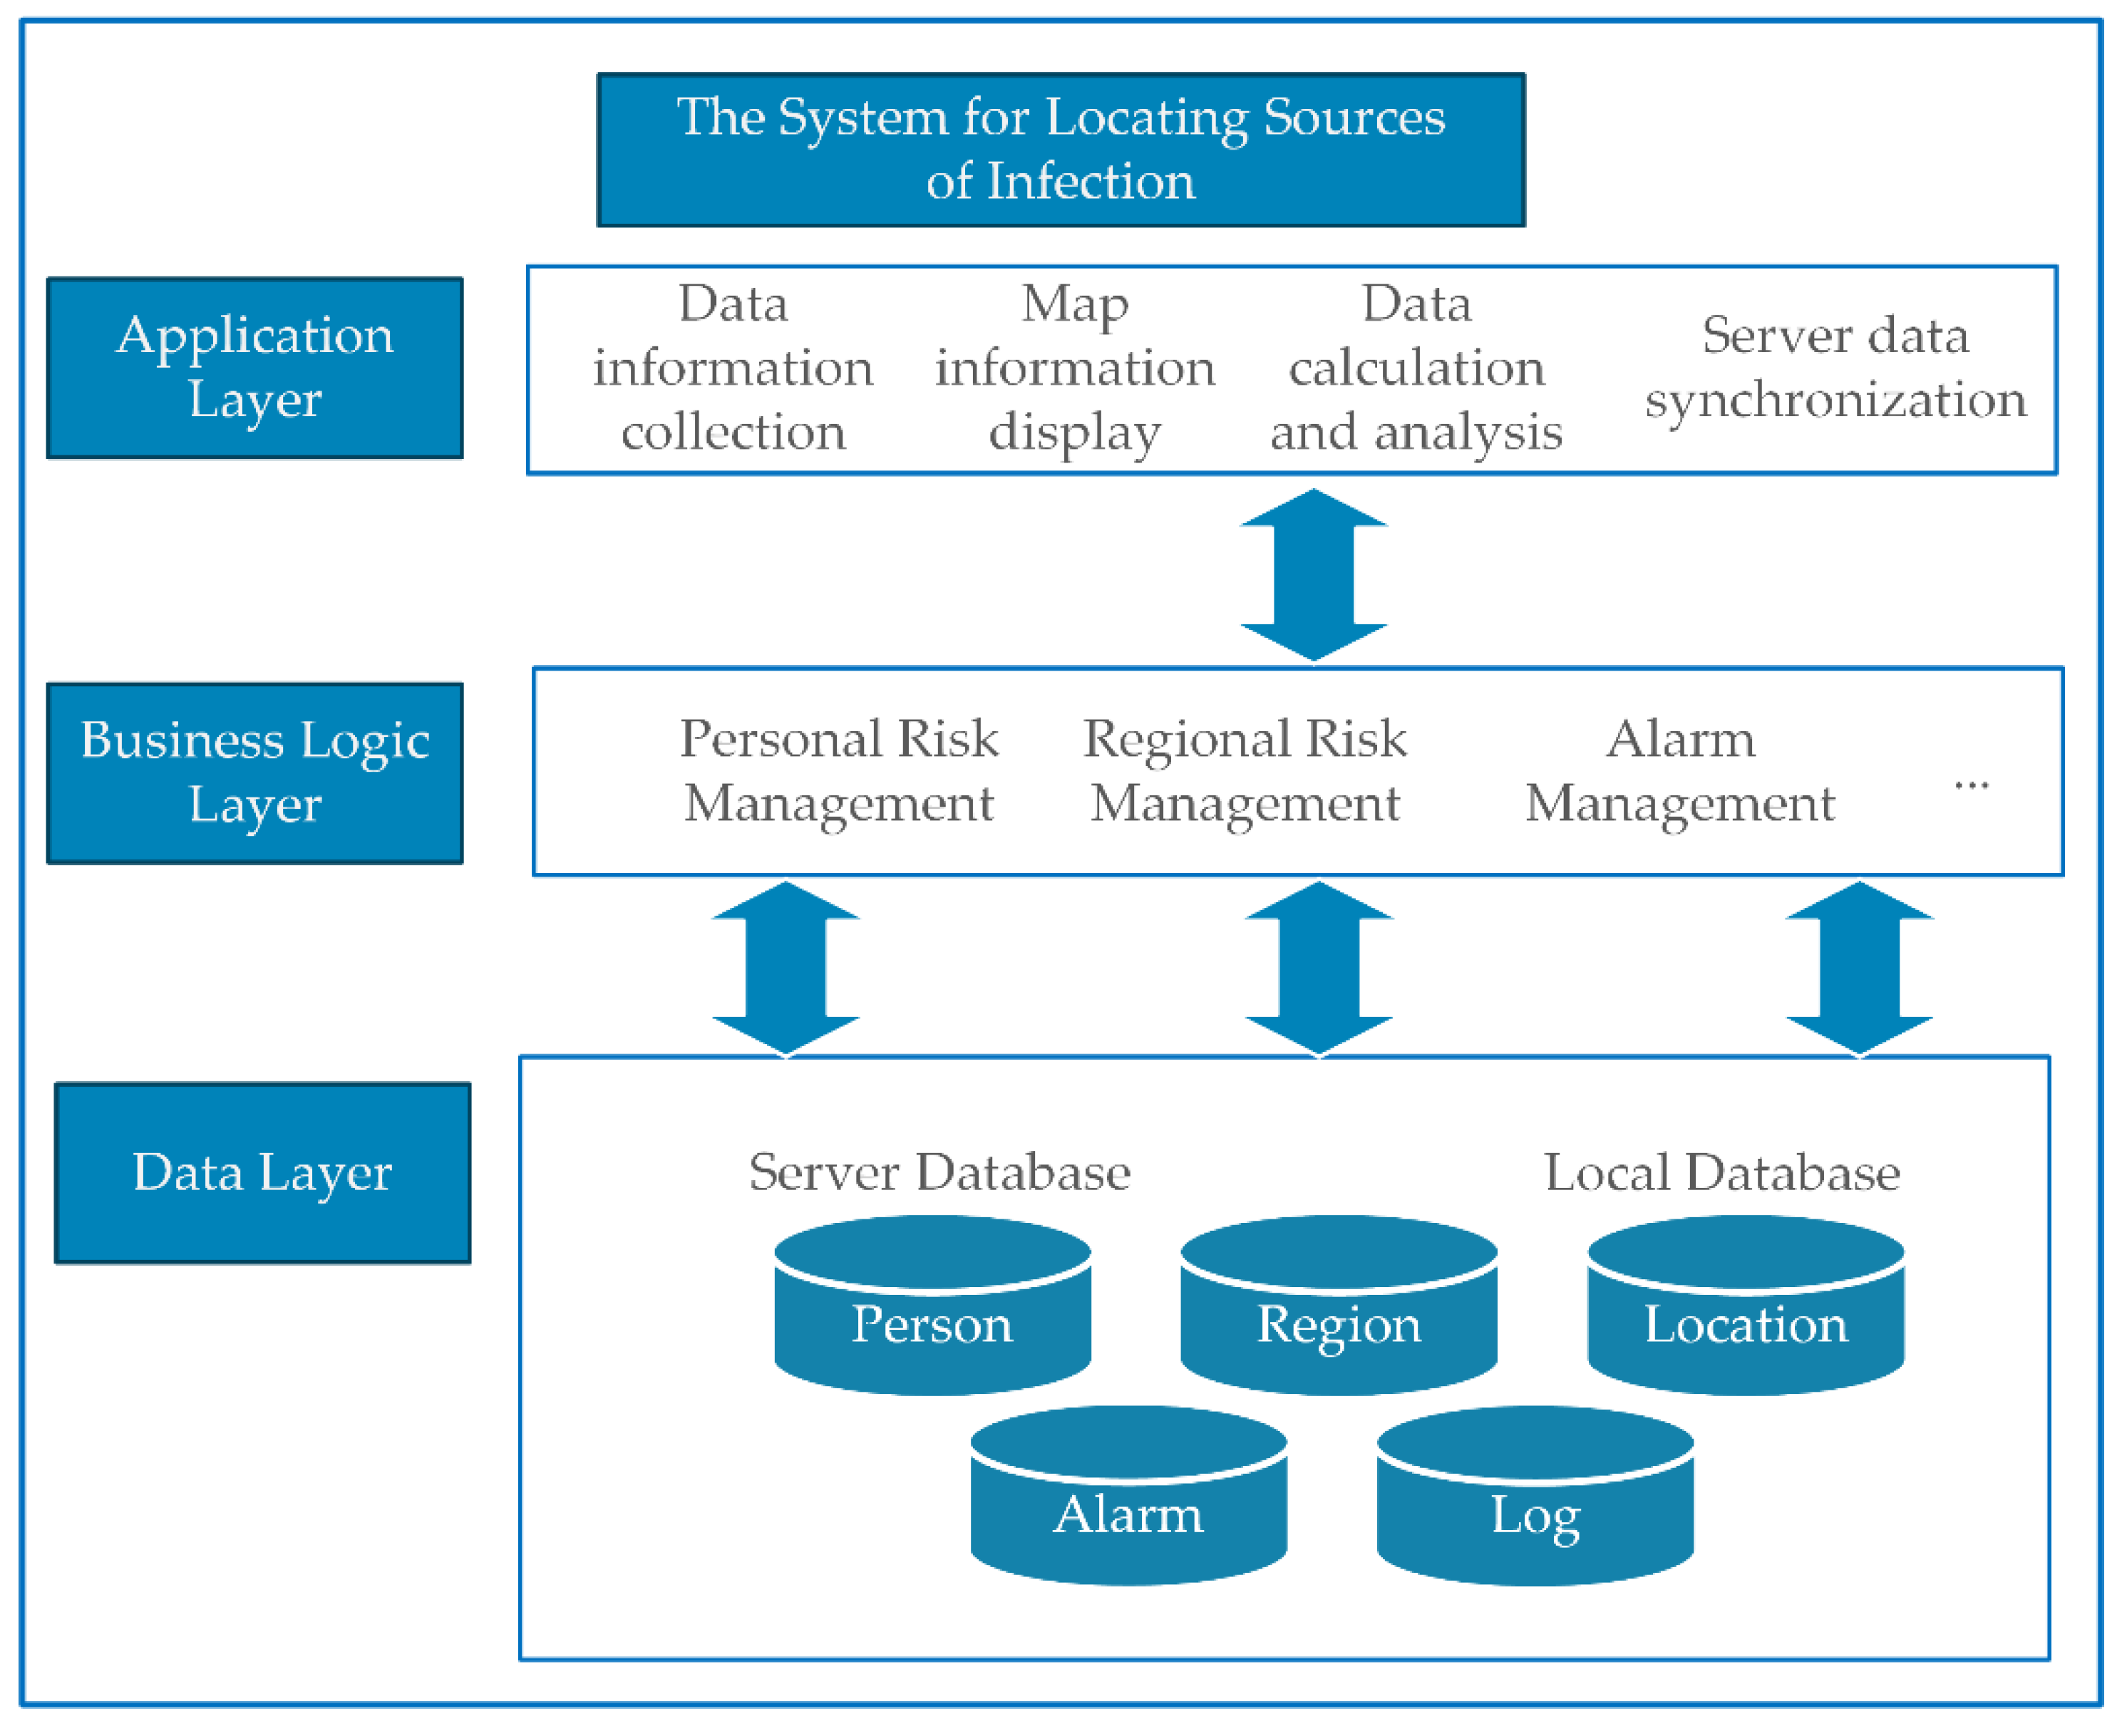
As shown in
Figure 7, the system is separated into three layers: the application layer, business logic layer, and data layer. Each layer represents a specific function of the application. The user layer provides a visual graphical operation interface, while the business logic layer is the core of the system architecture. It provides specific functional implementation, including personal risk level queries, regional risk level queries, and alert function. The data layer handles the storage and exchange of various data, intelligently and efficiently managing a massive amount of information.
4.2. The Application Layer
The application layer primarily facilitates the collection of basic user information, data display, data calculation and analysis, and data synchronization and interaction with the server. The system users are divided into two groups: mobile phone client software users, and infectious source monitoring and management users. These two groups have different requirements for the system. As illustrated in
Figure 8, the client view provides login, basic positioning, Bluetooth information interaction, map display, risk level query, and alarm functions. The administrators have additional functions and permissions, including person and regional risk level management and modification, person data maintenance and statistics, alarm processing, and historical track query management. The administrators also trace the sources and generate trace reports. The primary task of the mobile client is positioning, collecting user information, and issuing warnings. The main task of the personal positioning monitoring administrator is monitoring, early warning, and management.
4.3. The Business Logic Layer
The business logic layer implements core functional module management, including the personal risk management module, regional risk management module, and alarm management module.
Based on the above analysis, the system can be divided into two software for development and implementation: client-side software based on a Bluetooth intelligent mobile terminal system and server-side infectious sources tracking monitoring management software. These two components are functionally interrelated through the background database. The system architecture is a mixture of C/S (Client/Server) and B/S (Browser/Server). The client software of the mobile terminal adopts the C/S architecture, and the server-side infectious source location monitoring management software adopts the B/S architecture.
As shown in
Figure 9, the functional design of the infectious source localization system is divided into two parts. First, the mobile client software is automatically started on booting, and the application performs the following functions:
Bluetooth Broadcast: The smartphone periodically broadcasts a packet containing risk-level information that is not connectable.
Bluetooth scanning: The smartphone scans three broadcast channels and listens to broadcast packets broadcast by neighboring phones.
Personal risk level update: The smartphone updates the current personal risk level at set intervals.
Alarm: The smartphone measures RSSI values and uses them to estimate the distance to other devices nearby, including close contacts when the distance is less than a set distance. The pop-up alarm is triggered by sending a notification when a high-risk group is received.
Map display: The front-end page displays the user’s current location information while marking the risk level with differently colored blocks in the map interface.
All scanned broadcasts are stored in the user’s local storage. An expiration time is set for the scanned broadcast information, and once it expires, it will be permanently deleted from the local storage. Referring to the incubation period of a new coronavirus outbreak, the broadcast information storage date can be recorded as 14 days from the scan date. If the user is diagnosed as a positive patient, the infectious sources surveillance management server-side can request the smart mobile terminal to upload the locally stored data and information.
Following these steps, the Infection Source Monitoring Management software receives locally uploaded information for statistical analysis, and the application performs the following functions:
Risk level update and maintenance: counts the infected people in the current system every set time and updates the current regional risk level. Updates the risk level of people in the region every set time.
Person and equipment management: it is possible to unify the management of software registration, people and devices.
Generate a list of close contacts: Compare to generate a list of close contacts. Then, distribute the message to immediately instruct close contacts to self-quarantine.
4.4. The Data Layer
The data layer mainly handles the storage and interaction of data, including the local database and cloud server database. It contains the personal risk database, regional risk database, geolocation database, warning database, and log database, storing a large amount of information. The regional risk library stores the regional risk level of each location at each moment, while the personal risk database stores the personal risk level of each person at each moment. Based on the calculation method mentioned in the third part, the data stored in the data layer are updated in real-time. The server can generate the transmission report of the sources of infection based on the regional risk library and the personal risk database. The content of the circulation report includes close contact with the sources of infection and the locations where the sources of infection were present, providing solid data support for the prevention and control of the epidemic.
5. Conclusions
The purpose of this paper is to propose a method for infectious source localization and tracing to solve the problem of insufficient epidemic prevention and control methods and offer valuable technical support for rapid and efficient epidemic prevention and control. It can be applied to regular and highly efficient epidemic prevention and control to help people isolate and self-isolate through risk level assessment. The system has broad application prospects and practical significance.
This paper presents a method to achieve the location of infection sources with a Bluetooth system for smart devices, which combines Bluetooth and GPS positioning. The system uses GPS to record the user’s activity trajectory. The distance between users is estimated by the Bluetooth RSSI, which enables the exchange of Bluetooth packets from smart devices within a set distance and early warning. The risk level real-time update algorithm is also proposed. The advantage of the method proposed in this paper lies in the dynamic and timely updating of the risk level. With the change in the risk level, the system sends warnings, which help in early user isolation and self-isolation.
An infectious source tracking system was designed based on the proposed algorithm, and the implementation of the main functions was completed. However, the functionality of the system is still poor, and is a direction that can be continued in subsequent research.


