1. Introduction
One of the main goals of consumer researchers and marketing practitioners is to identify, predict, and understand how consumers behave [
1]. This is considered essential to increase the chances of product success [
2].
In this regard, researchers have increasingly focused on the complexity of consumer decision-making [
3,
4]. Consequently, the definition of consumer behavior has expanded to include the entire spectrum of the decision-making process, starting with the choice to consume and concluding with product usage, disposal, and post-purchase contemplation [
5]. In this context, the study of consumer behavior can help designers and marketers gain insights into users’ needs and preferences, allowing them to create products that better meet consumers’ expectations [
2].
The development of new technologies has opened new possibilities for studying consumer behavior and improving the design of products. In fact, e-commerce is becoming increasingly important, and traditional forms of interaction with products in physical stores are being replaced by digital means [
6,
7]. In an increasingly competitive market where product presentation is becoming one of the key factors for standing out from the competition, it is important to understand how consumers behave when presented with products using these new visualization techniques.
Virtual Reality (VR) can help researchers to create immersive and interactive environments that simulate real-world experiences with no limits [
8]. The availability and affordability of VR in terms of both hardware and software have fueled its adoption in many sectors [
9]. This is highly based on the development of a new generation of low-cost headsets which has democratized global purchases of VR devices. In this situation, a new generation of Head Mounted Displays (HMDs) have emerged featuring more sophisticated capabilities. Researchers can more accurately measure the cognitive and affective responses of consumers to different stimuli and gain a better understanding of how these responses influence behavior by using the collection of physiological measures (e.g., eye-tracking), which can provide insight into the underlying neural processes involved in decision-making.
Eye-tracking has been extensively used in traditional laboratory settings to study visual attention and decision-making [
10,
11]. The use of eye-tracking techniques for product evaluation has become increasingly popular in recent years as it provides more accurate and objective information than conventional self-report questionnaires [
12,
13], such as the procedure established by Felip et al. [
14] or the Semantic Differential technique proposed by Osgood et al. [
15]. In fact, physiological techniques can reveal responses or reactions that consumers may not be willing to disclose or are not consciously aware of, such as attitudes towards products or brands that are socially undesirable [
16]. In this regard, self-report questionnaires have proven to be highly subjective [
17], as they rely on the user’s own perception and interpretation of their experience with the product [
18]. This can lead to biased or inaccurate feedback, as users may not always be aware of their own preferences or may have difficulty articulating their thoughts and feelings about the product.
One interesting phenomenon that was observed using eye-tracking during the decision-tasks is the Gaze Cascade Model proposed by Shimojo et al. [
19], i.e., when monitoring eye movements, the gaze is initially distributed between the stimuli presented, but then gradually shifted toward the one that the user chooses. This was further studied by Glaholt et al. [
20], who discovered that this effect was accentuated using an eight Alternative Forced-Choice (AFC) instead of the 2-AFC originally proposed. This suggests that through the monitoring of eye movements, it might be feasible to ascertain an individual’s forthcoming choice or preference even before they possess conscious awareness of it. This could be achieved prior to an explicit response or even before their choice has been consciously determined. At present, some studies continue to investigate the reproducibility of this effect, such as Rojas et al. [
21] who used eye-tracking as a method to understand consumer preferences in children.
The integration of VR and eye-tracking measures has the potential to further investigate this effect in the context of product design and to identify the specific features of products that elicit the strongest cognitive and affective responses in consumers. By identifying these features, designers can create products that better meet the needs and preferences of consumers, and thus improve their overall experience. This collaboration between consumers, scientists, and marketing experts can lead to better identification, recognition, and understanding of consumer behavior.
Despite the promise of this technology, there has been limited research investigating the use of VR and physiological measures in predicting consumer behavior, particularly in the context of product design. However, we believe that eye-tracking measures will provide valuable insights into the underlying cognitive and affective processes involved in consumer decision-making and will help inform the development of more effective product designs. In this paper, we present a study that explores the use of eye-tracking in a VR setting to predict consumer behavior in the context of product design.
3. Materials and Methods
3.1. Experimental Design
A within-subject experiment was designed to test the postulated hypotheses mentioned above, where a group of participants completed two tasks in a fixed order: (1) an 8-AFC task, presenting participants with multiple product alternatives, and (2) an individual evaluation of each of the design alternatives selected.
The spatial arrangement of products in the virtual environment was considered as the independent variable, and the eye-tracking metrics analyzed as the dependent variables: (1) gaze time, i.e., the total time that each object has been seen, (2) visits, i.e., the total number of visits defined as a group of consecutive gazes on the same object, and (3) time to first gaze, i.e., the time between the start of the exploration and the first gaze on a specific object. The evaluations obtained from the second task were also considered as a dependent variable.
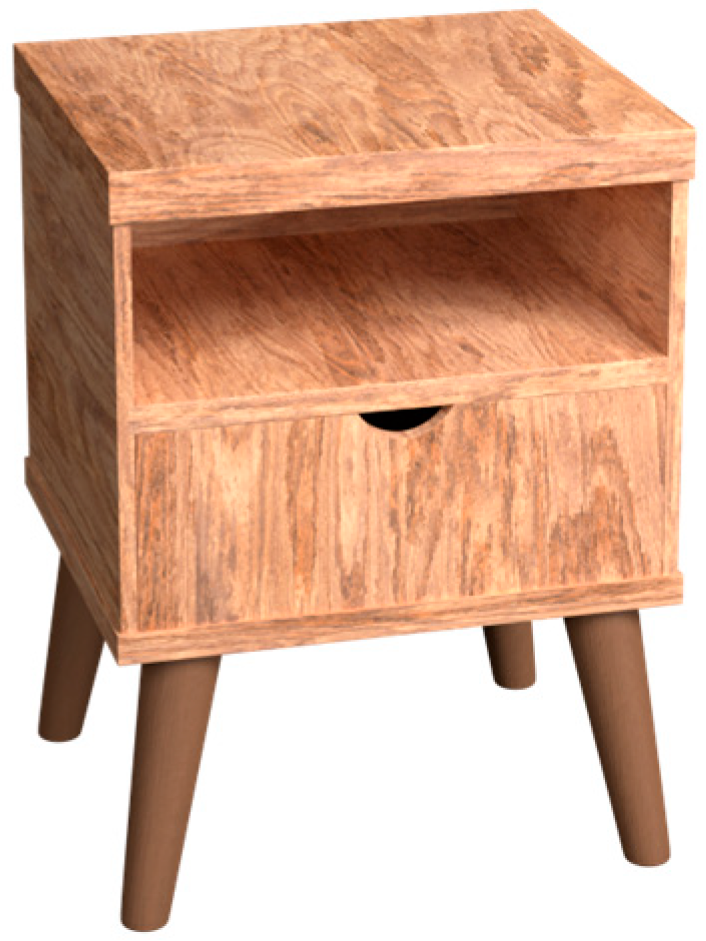
Within this context, we selected a nightstand as the product typology (
Figure 1) due to its possession of various interesting elements, which make it ideal for the generation of numerous distinct design alternatives. In this regard, Glaholt and Reingold [
22] found that eye-tracking could better reveal subject preferences when presented with eight alternatives. On the other hand, Rojas et al. [
21] decided to display multiple sets of options to obtain more robust results. For this reason, we have decided to design at least 64 alternatives of the selected product by manipulating four key design elements: (1) leg design and (2) its material, (3) top design, and (4) its material. We selected four alternative options for each of dimensions 1 and 2, and two alternative options for dimensions 3 and 4, resulting in a wide range of design possibilities.
The stimuli selection for each 8-AFC was conducted using a semi-random approach, following a set of guidelines aimed at ensuring diversity in the chosen options. The first criterion was based on the material and design of the upper area of the product, requiring the inclusion of two options for each material and two options for each available design. The second criterion was based on the leg design, requiring the inclusion of four alternatives for each of the options. The selection of materials for these alternatives was performed through a random process.
3.2. Sample
To determine the appropriate sample size for the experiment, a comprehensive review of the relevant literature was conducted [
19,
20,
21,
22]. Based on this review, a total of 24 volunteers participated in the study.
Before the experiment began, all participants were asked to rate their previous experience with VR technology on a four-point Likert scale ranging from 0 to 3, where 0 indicated no prior experience with VR and 3 indicated significant experience. The results indicated that 45.8% of the participants had no prior experience with VR, 37.5% rated their experience as limited, 12.5% had considerable experience, and 4.8% reported significant experience.
Participants were recruited through web advertising on the university website. No specific target population was identified, as any individual was eligible to participate. Interested individuals were required to complete an online questionnaire that provided detailed information about the experiment. Participants were subsequently contacted by a member of the research team to schedule an appointment, and those who expressed interest in receiving the results were contacted for debriefing after the experiment had concluded.
All participants provided verbal informed consent to participate in the study, and the study was determined to be exempt from institutional review board (IRB) approval, as it involved straightforward consumer acceptance testing without intervention. Additionally, all data collected were recorded in a manner that protected the privacy of the participants and maintained the confidentiality of the data. For the online portion of the study, participants provided verbal consent during a virtual meeting with a member of the research team prior to the commencement of the study.
3.3. Instrumentation
The virtual models were designed and texturized using Blender 2.93, and the VR environment was created using Unity 2020.3.11f1. In this context, the Tobii XR SDK 3.0.1.179 was employed to incorporate the eye-tracking capabilities of the VR headset. In addition, the XR Interaction Toolkit 2.0.2 was utilized to enable interactions with the virtual environment (VE) using controllers to complete tasks. The XR Plugin Management 4.2.1 was integrated to facilitate the viewing of the VE through the VR headset. The evaluation experience was specifically designed for the HP Omnicept Reverb G2 HMD, which features eye-tracking sensors for collecting eye movement data and has a resolution of 2160 × 2160 pixels per eye. Furthermore, to enhance the realism of the scene, the Universal Render Pipeline 10.8.1 with baked lights was also used. Finally, all the data processing was performed using Matlab R2013.
3.4. Procedure
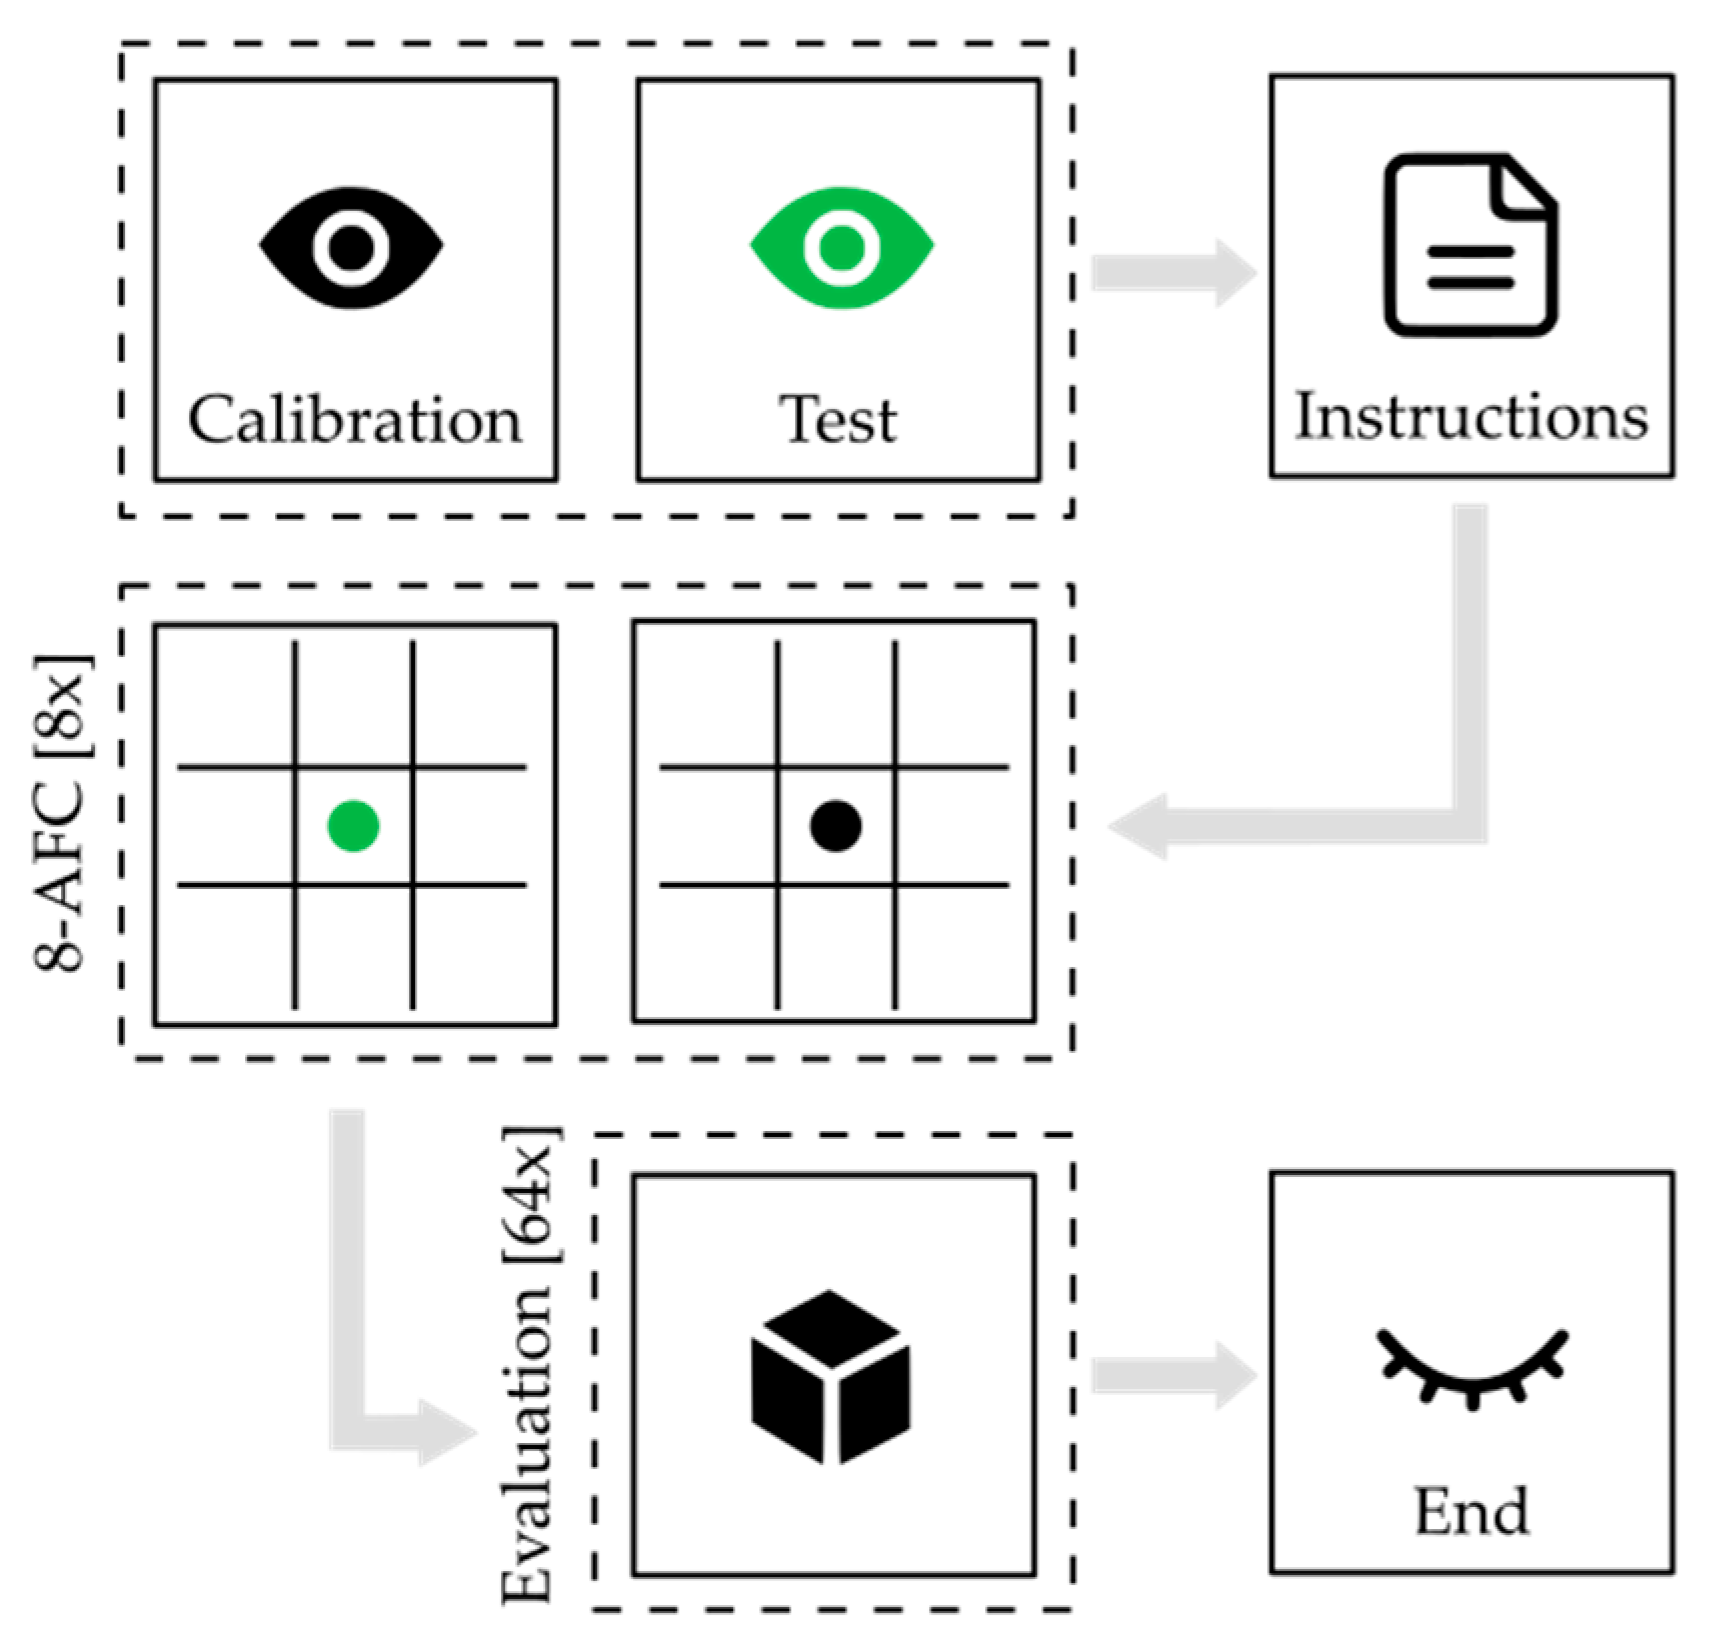
A scheme of the procedure is shown in
Figure 2. Instructions were provided to each participant before the experiment began, although they were displayed in front of the user in the virtual environment prior to starting the first task. Additionally, a training scene was designed to ensure that the volunteers understood the experiment and to address any concerns they may have had.
Prior to starting the experiment, a gaze calibration was performed using the HP Eye Tracking Calibration Tool to ensure that data were collected accurately for each of the subjects. This calibration was checked by the researcher by having the volunteer look at points within the virtual environment. Once this calibration was validated, the experiment could begin.
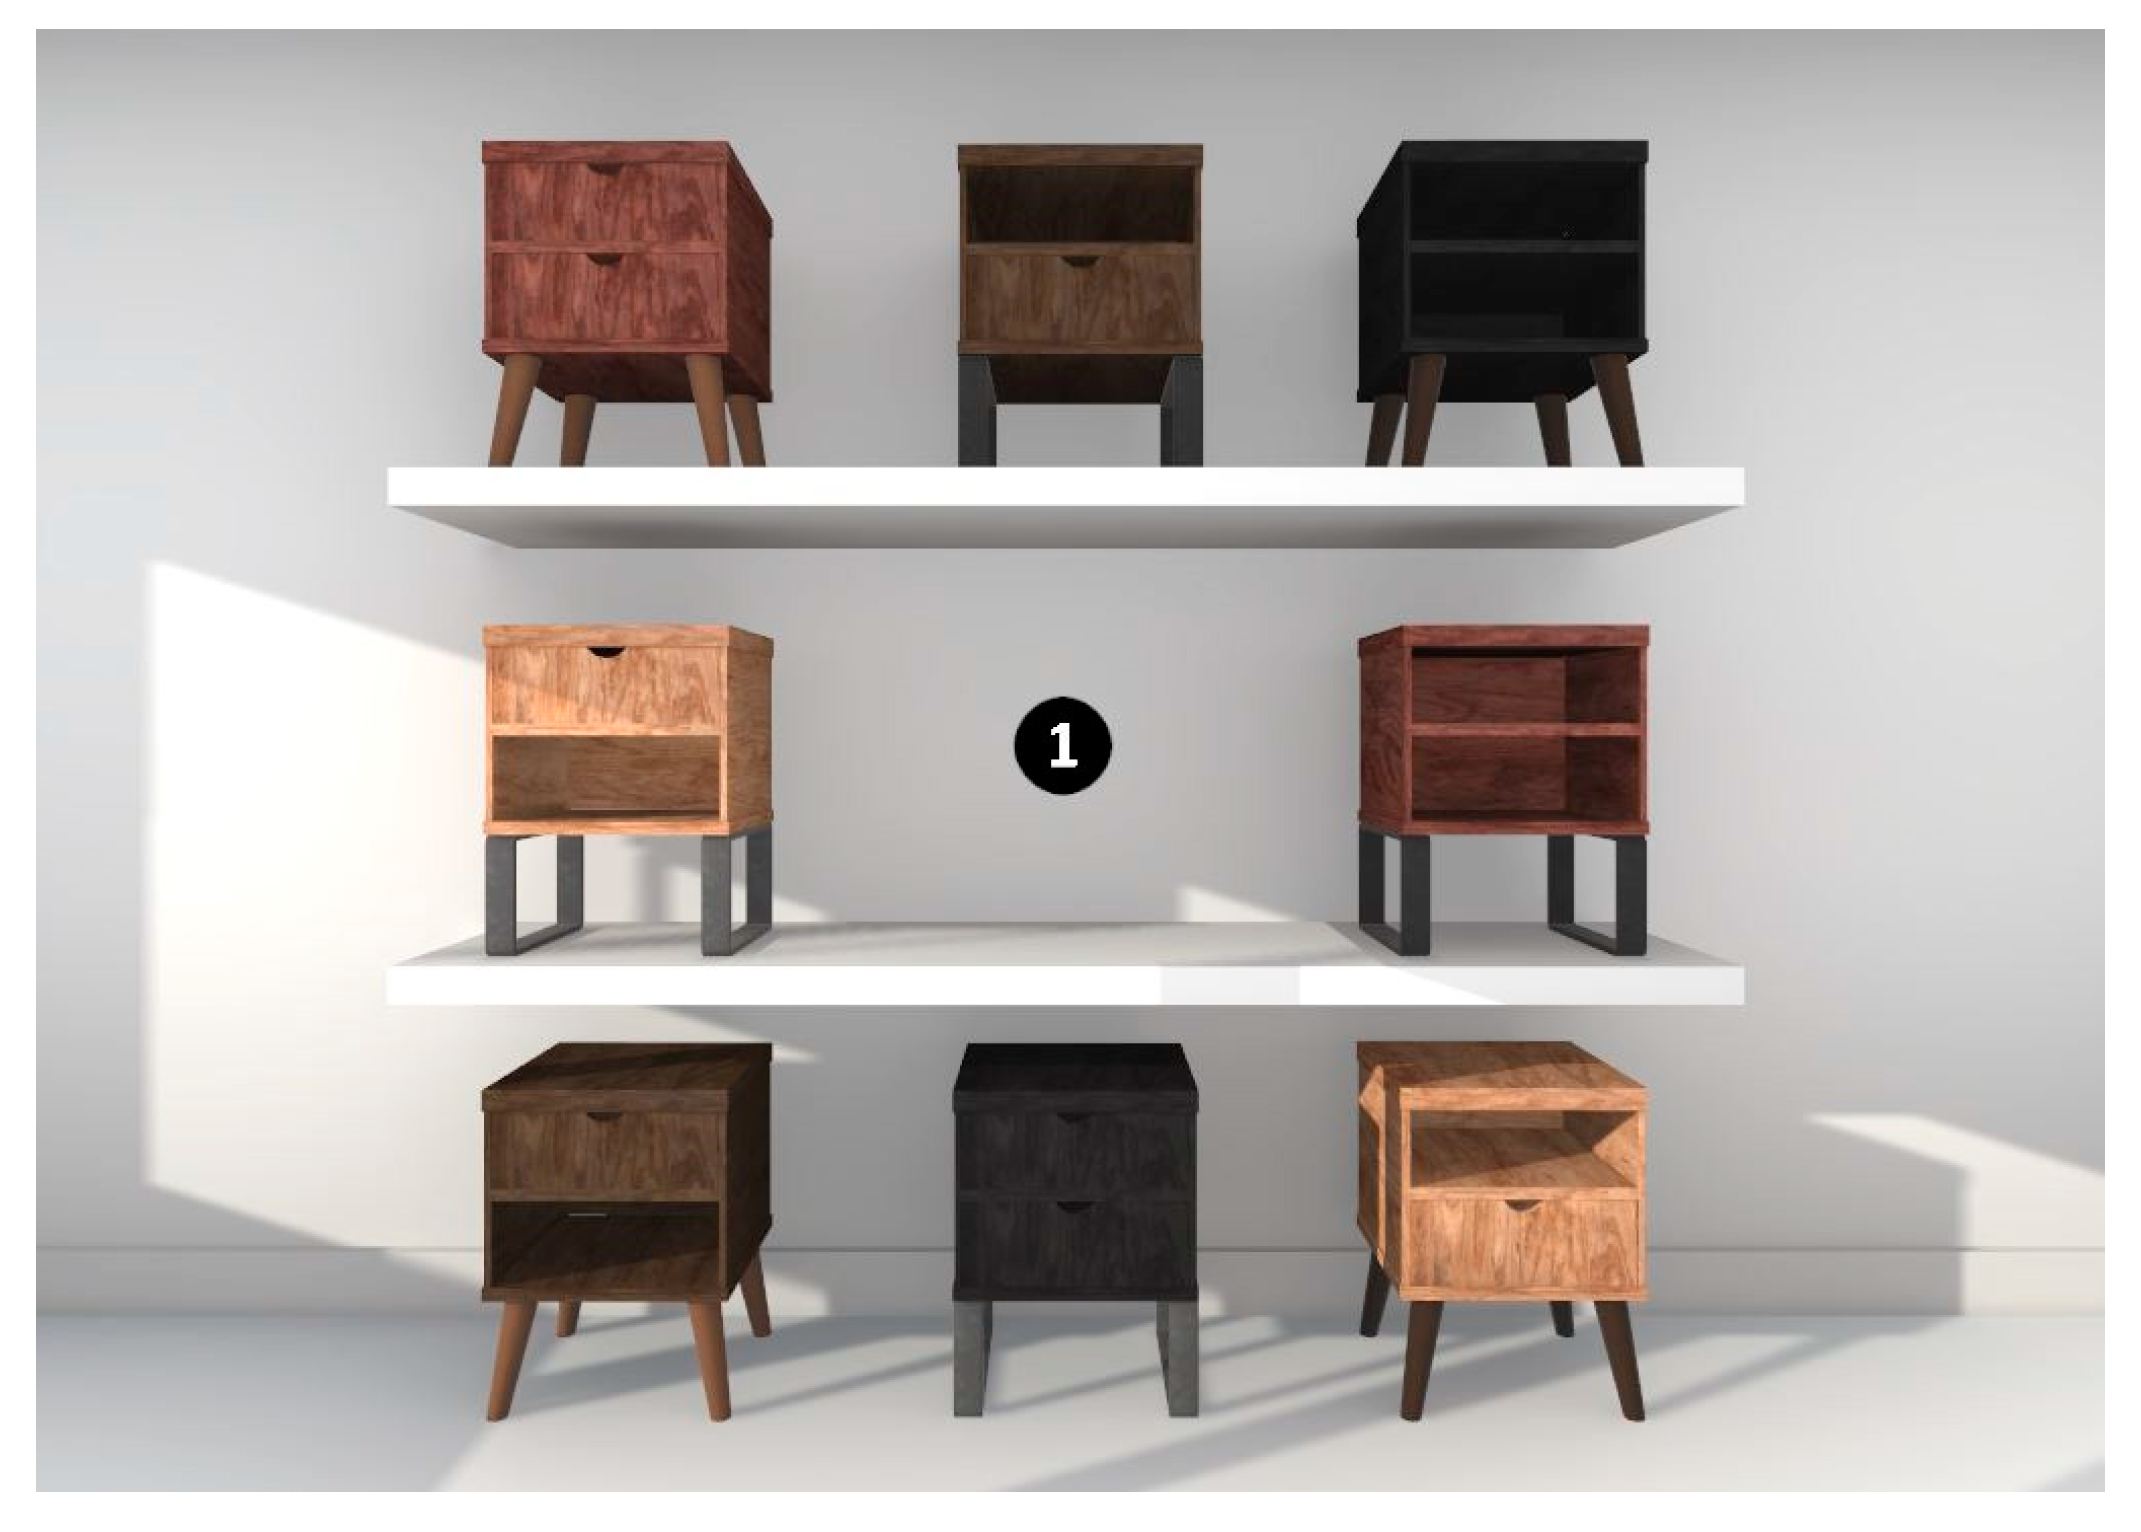
In the first task, gaze measurements were taken using the 8-AFC method [
4]. The layout consisted of a 3 × 3 grid organization of the products, with eight different options from the total nightstands designed and distributed among them. Efforts were made to arrange the 64 options into groups of eight that were sufficiently varied. The stimuli were displayed in each “box” of the grid, except for the central, where a black point was displayed as an indicator to start the task with a white number to indicate the number of the set displayed (from 1 to 8). Participants were instructed to freely view the eight different options and select their favorite one with no time limit. Once the volunteers had made their selection, they had to gaze at the black point for two seconds until it turned green, indicating the beginning of the decision-making part of the task. Participants were then asked to return to their favorite stimuli and indicate their preference using the controller. See
Figure 3.
The second task involved an independent assessment of each stimulus using a 7-point Likert scale, ranging from −3 (“I do not like it”) to +3 (“I like it”). The same 64 nightstands from the first task were presented in front of the user randomly. The questionnaire was presented in a virtual environment. Participants were asked to indicate their preference for using the controller.
3.5. Data Collection
Each of the components in the 3 × 3 grid was considered as an area of interest. Box colliders were used to detect the collision between the gaze and the object in the virtual environment. At a frequency of 120 hertz, the name of the object that was being looked at was saved in a Comma Separated Value (CSV) file. If nothing was being looked at, the name “none” was saved for better identification. Subsequently, this data underwent processing to yield results that could be subject to interpretation. This dataset was collected with the objective of analyzing the attention patterns during the exploration of the grid until the subjects decided, considered as the moment that the subject started seeing the dot. We did not consider if the subject sees the dot for less than two seconds and it did not turn green.
The study focused on three primary eye-tracking metrics: (1) gaze time, (2) visits, and (3) time to first gaze. Moreover, we collected the decision of each subject in each grid exploration as the object that was observed after the dot turns to green. The rest of the items were considered distractors ordered by gaze time from 1 to 7, being the first distractor of the object with a higher gaze time prior to the decision.
Additionally, the data collected through the questionnaire was also saved in a CSV file for further processing.
3.6. Data Analysis
Initially, Pearson correlations were performed to explore the relationship between liking and eye-tracking metrics. Univariate outlier detection was applied based on a z-score threshold of 2.56 to retain 99% of the distribution. Subsequently, the differences in these metrics between decisions (chosen object vs. distractors) have been analyzed using four repeated measures ANOVAs, where a decision is an independent feature and all others as dependent variables in each model.
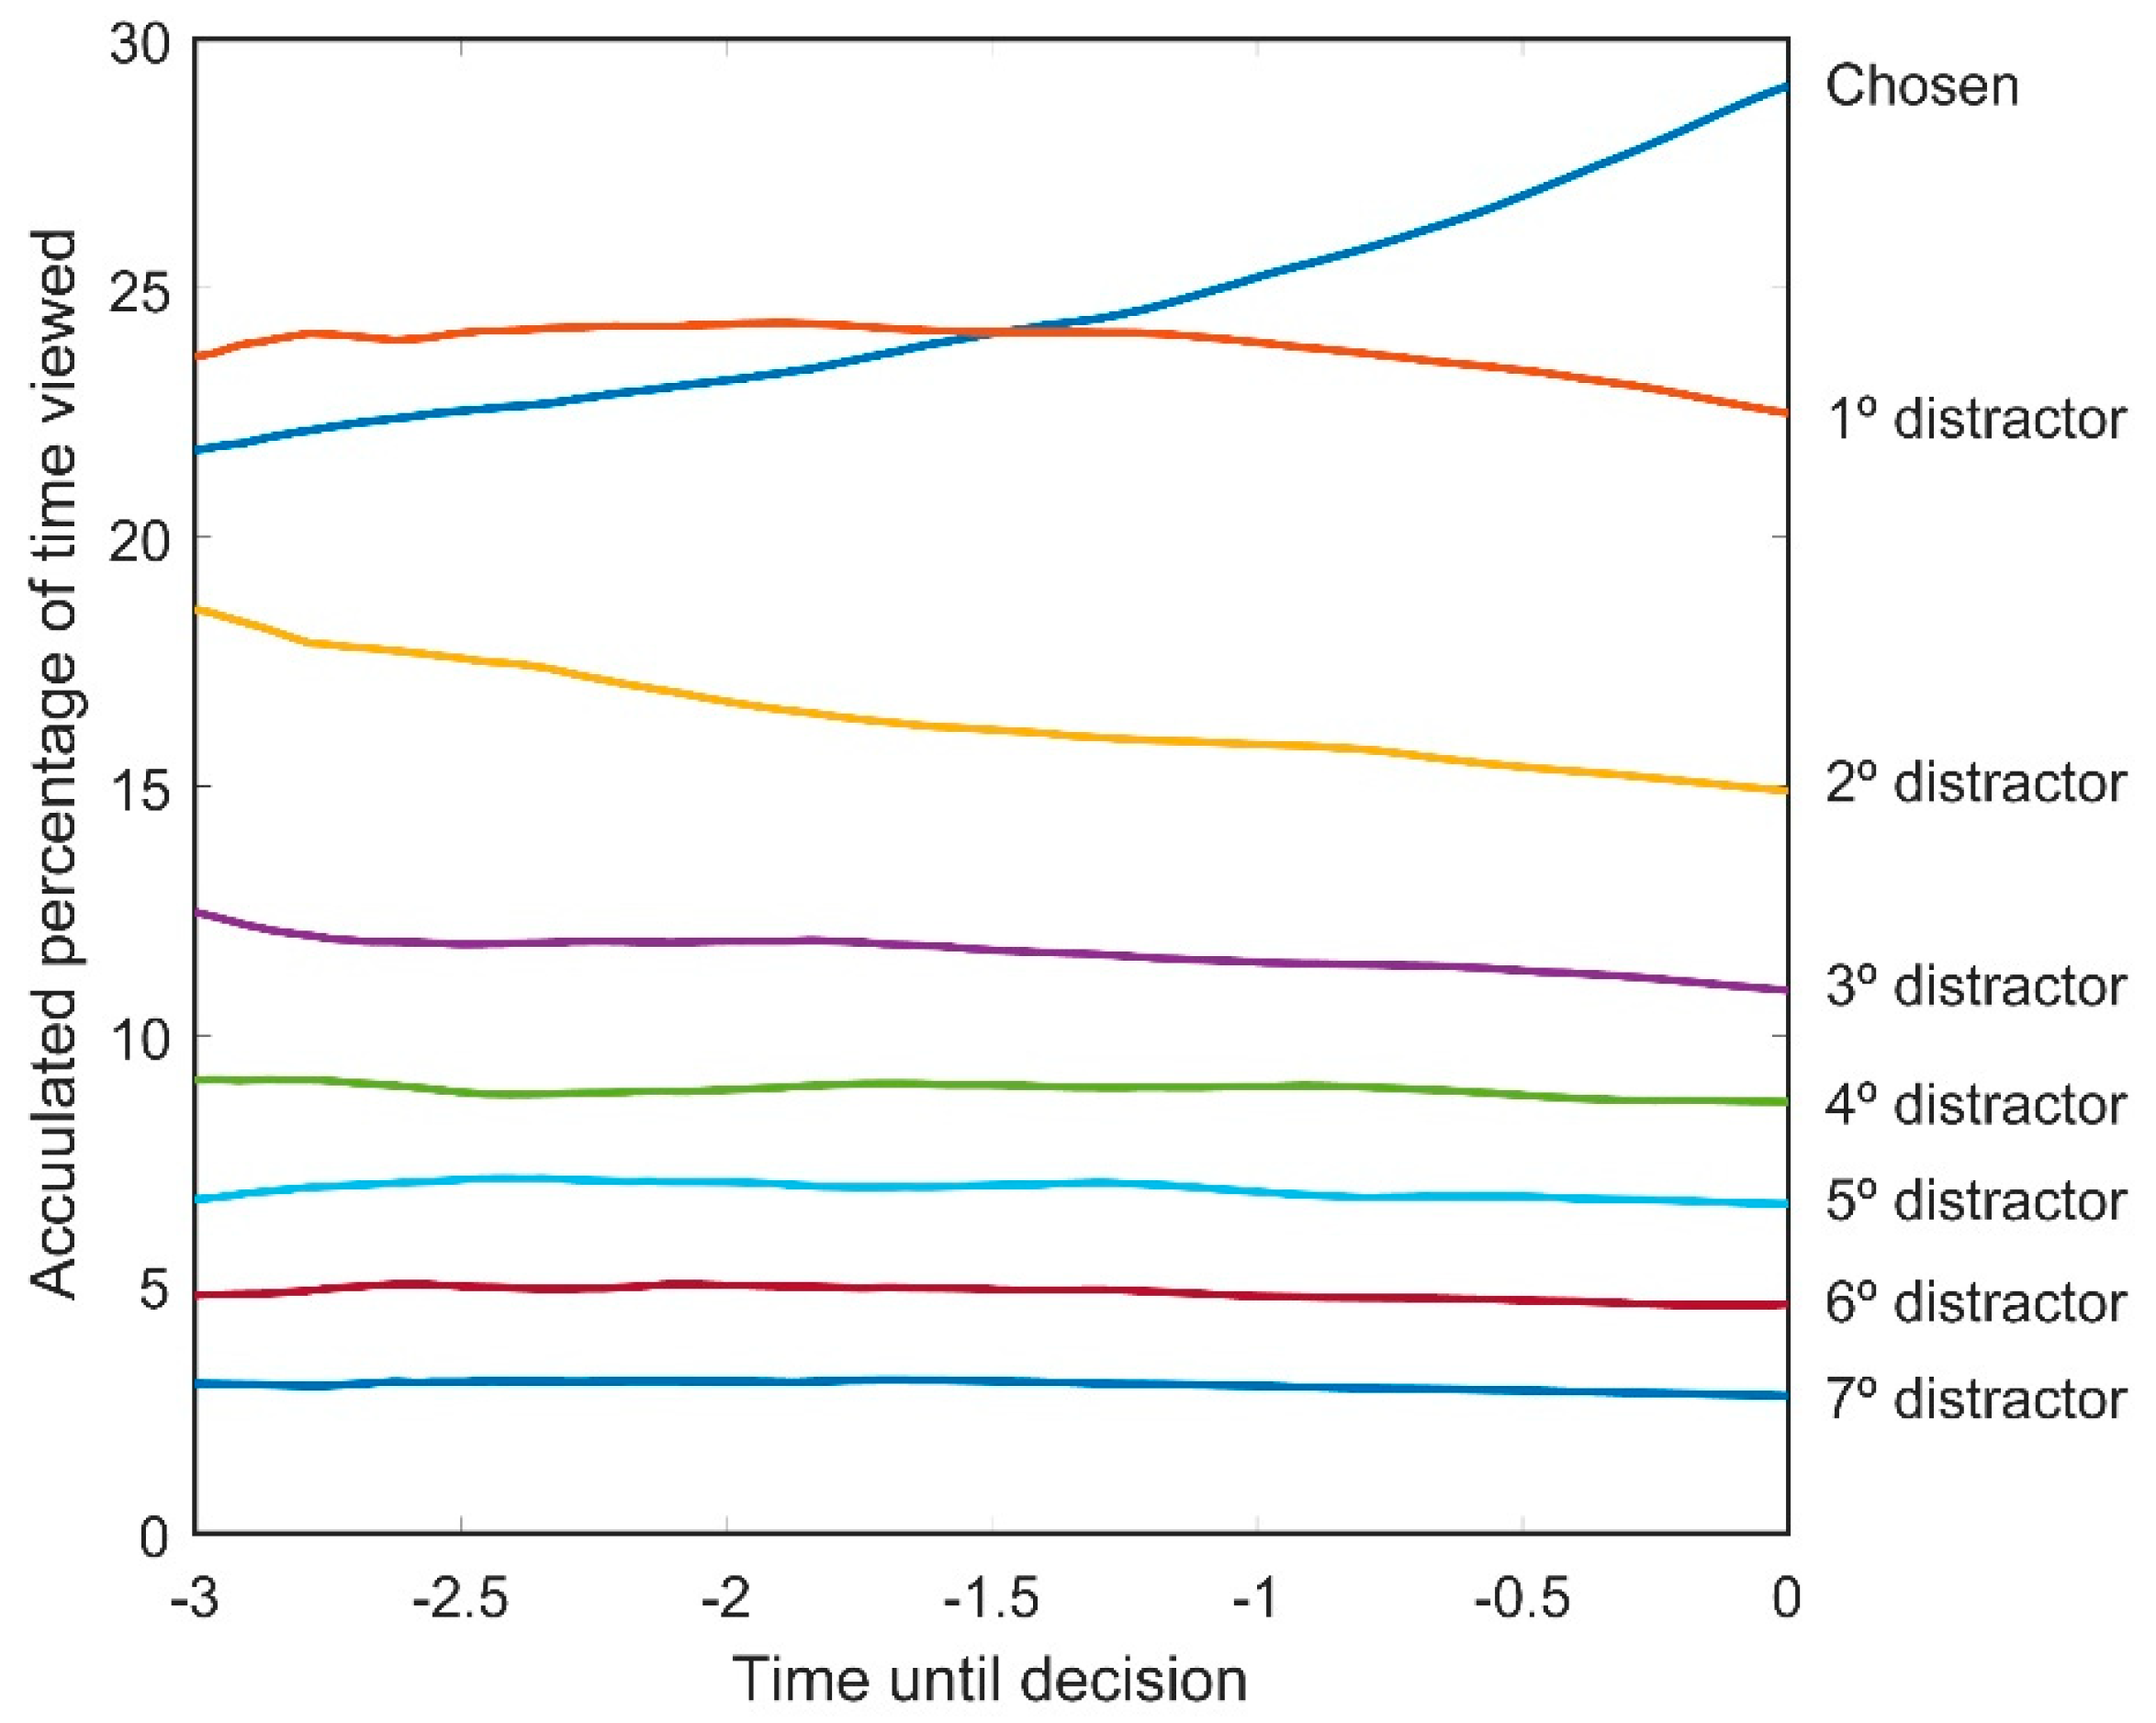
Moreover, the temporal evolution of gaze time prior to the decision was analyzed descriptively using plots. We present the accumulated gaze time as a percentage during the exploration in the last three seconds, with a resolution of 120 Hz. It is important to note that in each instance, the sum of the values is 100%, as it represents the distribution of accumulated gaze time across objects up to that moment. The plot averages all participants and grid explorations to describe the patterns during the decision-making process.
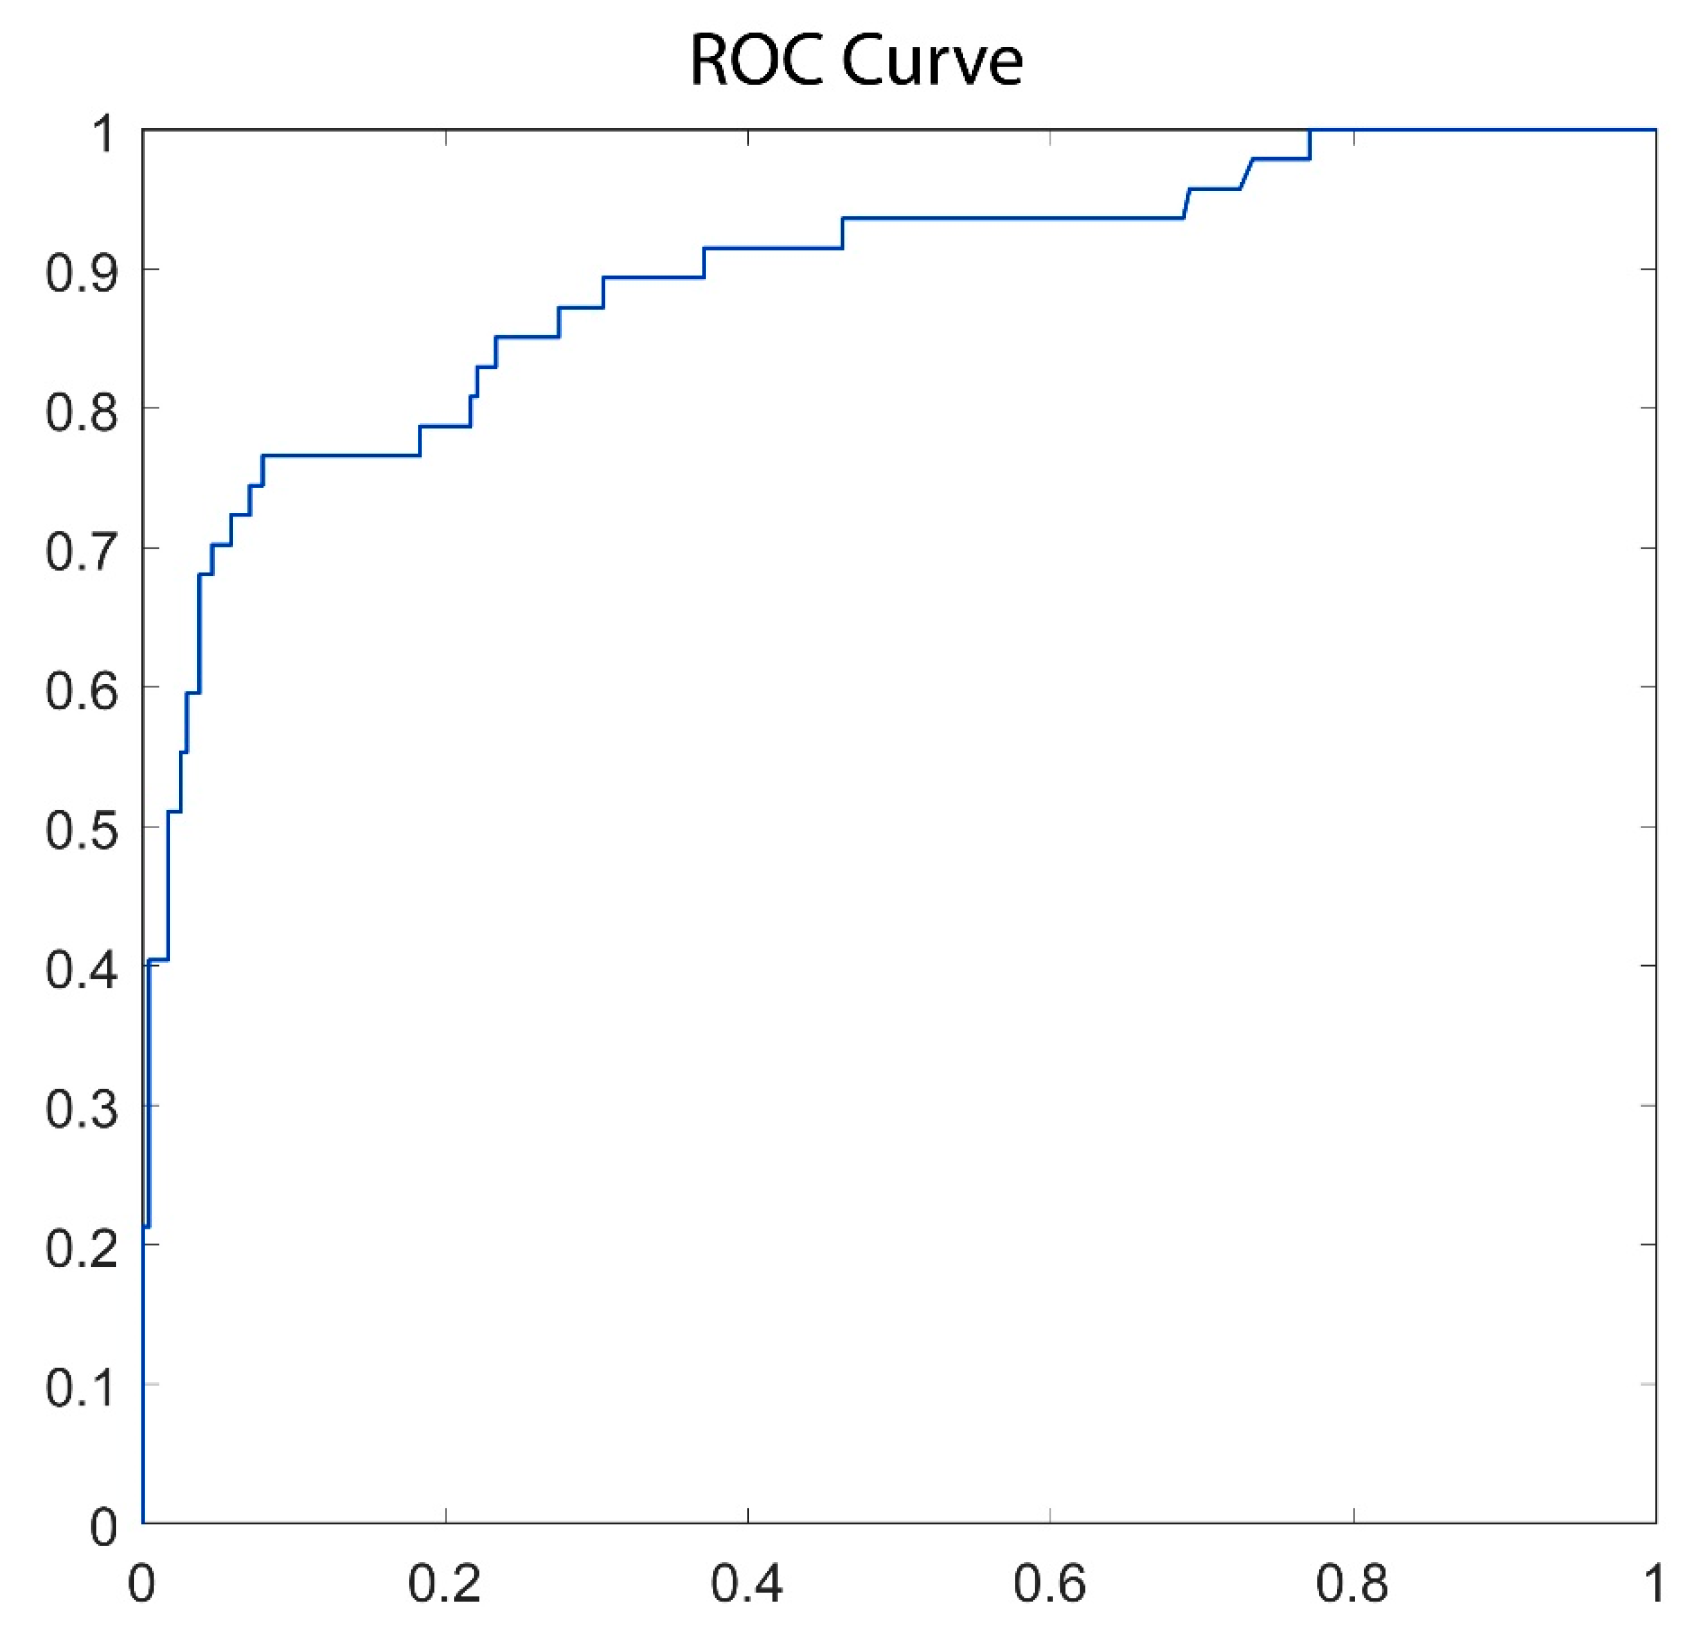
Finally, we created a classifying model to recognize the decision based on the eye-tracking dynamics during the last three seconds before the decision. It is based on the hypothesis that the final attentional patterns can predict the future decision. We used a deep learning model based on a Long Short-Term Memory (LSTM) that can recognize temporal evolutions. The input was a vector of 360 values with the accumulated gaze time in milliseconds of the last 3 s at 120 Hz. The label of each sample was 1 if the object was chosen, and 0 if not. In particular, the architecture includes a first LSTM layer of 50 neurons that returned the hidden state output for each input. The second layer is fully connected with two neurons due to the 2-class problem. Finally, a SoftMax layer produces the probability of each class and a classification layer computes the cross-entropy loss and weighted classification tasks with mutually exclusive classes. The dataset was divided into 80% for training/validation (1150 samples, 12.43% of true class), and 20% for testing (287 samples, 16.38% of true class). The model was trained with an ADAM optimizer at a learning rate of 0.001 and a batch size of 32. Due to the imbalance, we used weighted cross entropy as a cost function. The maximum number of epochs was 100. We reported accuracy, true positive rate, true negative rate, AUC, F-score, Cohen’s Kappa, and ROC curve to evaluate the model using the test split. All the algorithms were implemented by using Matlab R2022b.
5. Discussion
The primary objective of this research study was to investigate the recognition of decision-making processes when presenting individuals with multiple stimulus alternatives in an 8-AFC decision-making task through eye-tracking patterns. In an era where VR is becoming more prevalent and is being effectively utilized in product evaluation, this verification enables an evaluation of the decision-making process without relying on traditional self-report methods. Within this context, an experiment was designed to study the preferences of a group of participants towards 64 virtual prototypes exhibiting varying designs of a singular product (i.e., a bedside table). The participants were required to evaluate and subsequently select their preferred design through a series of 8-AFC tasks. Moreover, individual evaluations were conducted for each design.
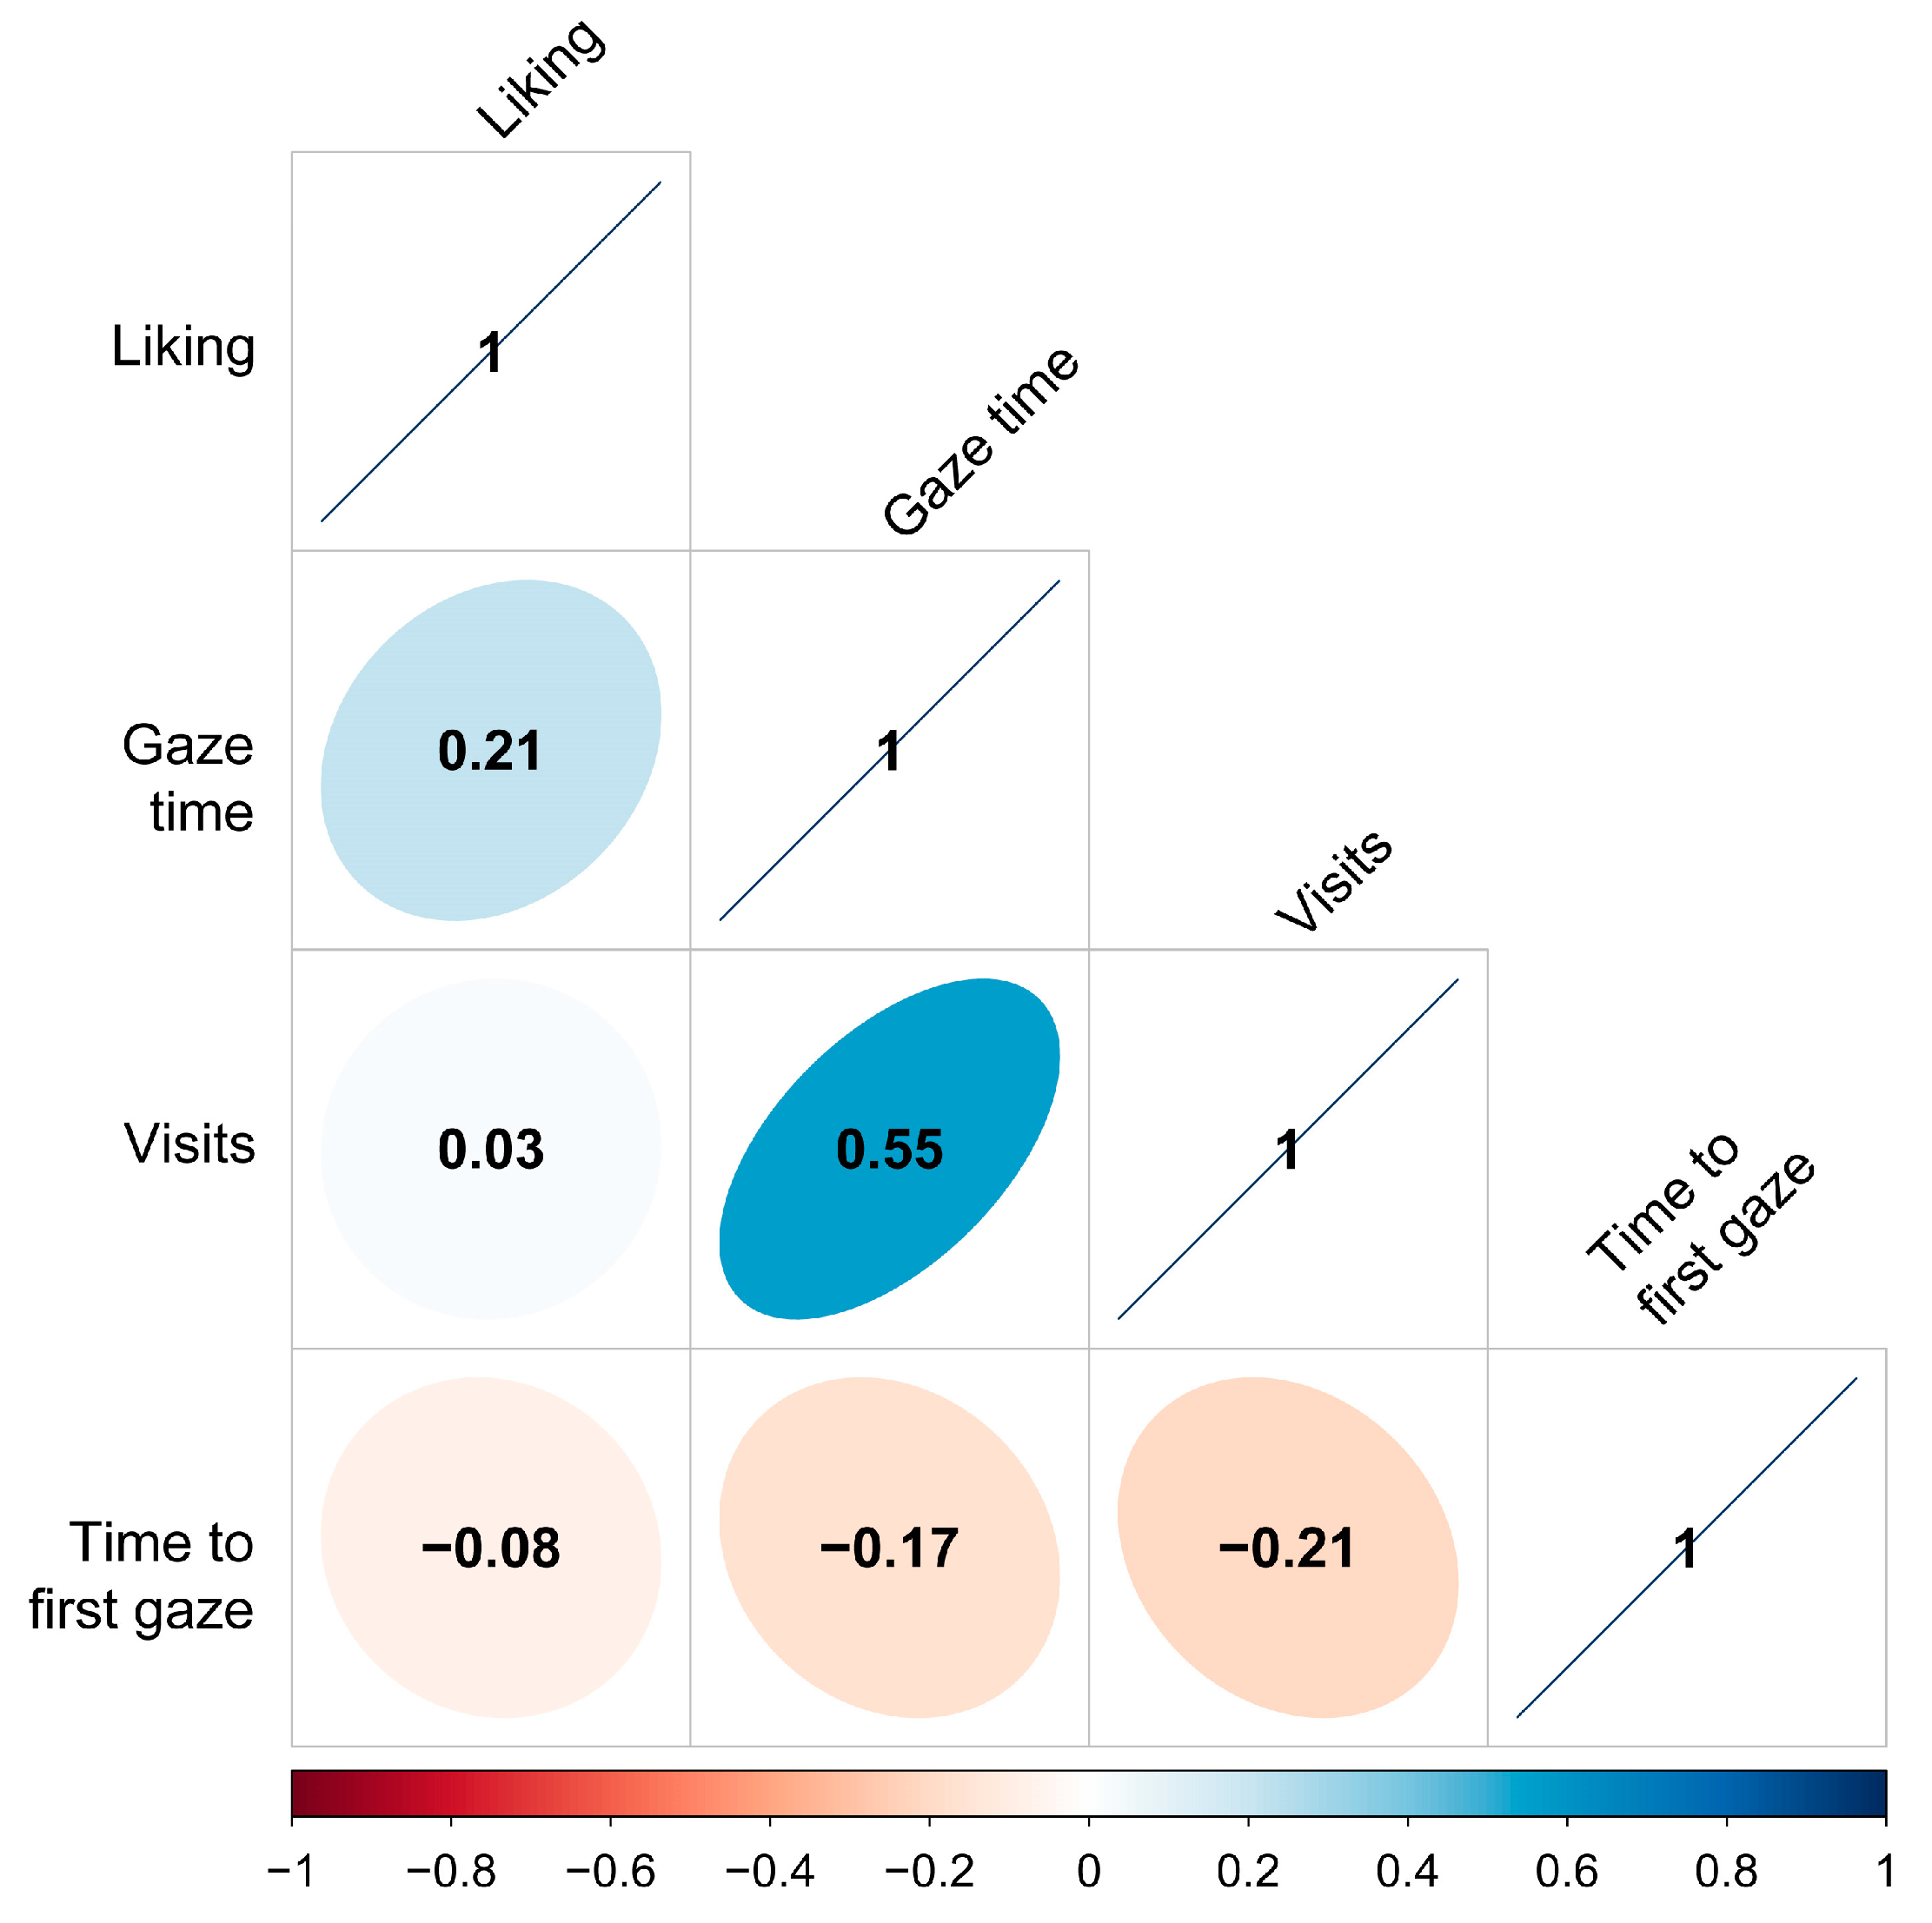
First, we postulated that there could be a correlation between liking and eye-tracking metrics (H1). This hypothesis was divided according to the eye-tracking metrics studied: gaze time (H1.1), visits, and time (H1.2) to first gaze (H1.3). In this context, the main results are shown in
Figure 4, which presents the Pearson correlation between liking and eye-tracking metrics. These results showed that there was a weak positive correlation between liking and gaze time, so H1.1 is accepted. This finding implies that participants directed a slightly longer amount of gaze time towards stimuli that they favored in comparison to those that they found less appealing. Nevertheless, this observed correlation proved to be of weak magnitude, signifying the possible presence of additional factors that may impact the duration of gaze time beyond mere liking. In this context, other researchers have also demonstrated that the product that is most well-liked by participants tends to be the one that receives the most visual attention [
23]. This is in line with results obtained by other authors [
23,
24,
25] and suggests that the level of liking or preference a person has for an object can influence how they examine it and the time they spend on it. If an object has features that appeal or seem to be important to the user, they are more likely to spend more time and attention on it [
26], which in turn could lead to a higher liking score. Furthermore, if the user finds an object less attractive, they may examine it with less attention and spend less time on it, which could lead to a lower liking score, which in our case corresponds with results obtained by each of the distractors and aligns with [
27]. On the contrary, results showed no correlation between liking and visits nor time to first gaze, so H1.2 and H1.3 are rejected. The correlation coefficient value indicates that the linear relationship between the two variables was very weak and that most of the data points do not follow a clear line. In other words, although there may be a linear relationship between the two variables, it is not a strong or reliable relationship.
In this context, results also indicated a weak negative correlation between gaze time and time to first gaze and a strong positive correlation between gaze time and visits. A weak negative correlation between gaze time and time to first gaze suggests that when participants take longer to first look at an AOI, they tend to spend less time looking at it overall. This might be attributed to the fact that they lose interest in that area after initial exposure or because they find the product unimportant. On the other hand, a strong positive correlation between gaze time and visits suggests that the more time participants spend looking at one product, the more likely they are to return to that AOI multiple times. This could be because they find the product interesting or engaging, or because they need more time to process the information presented.
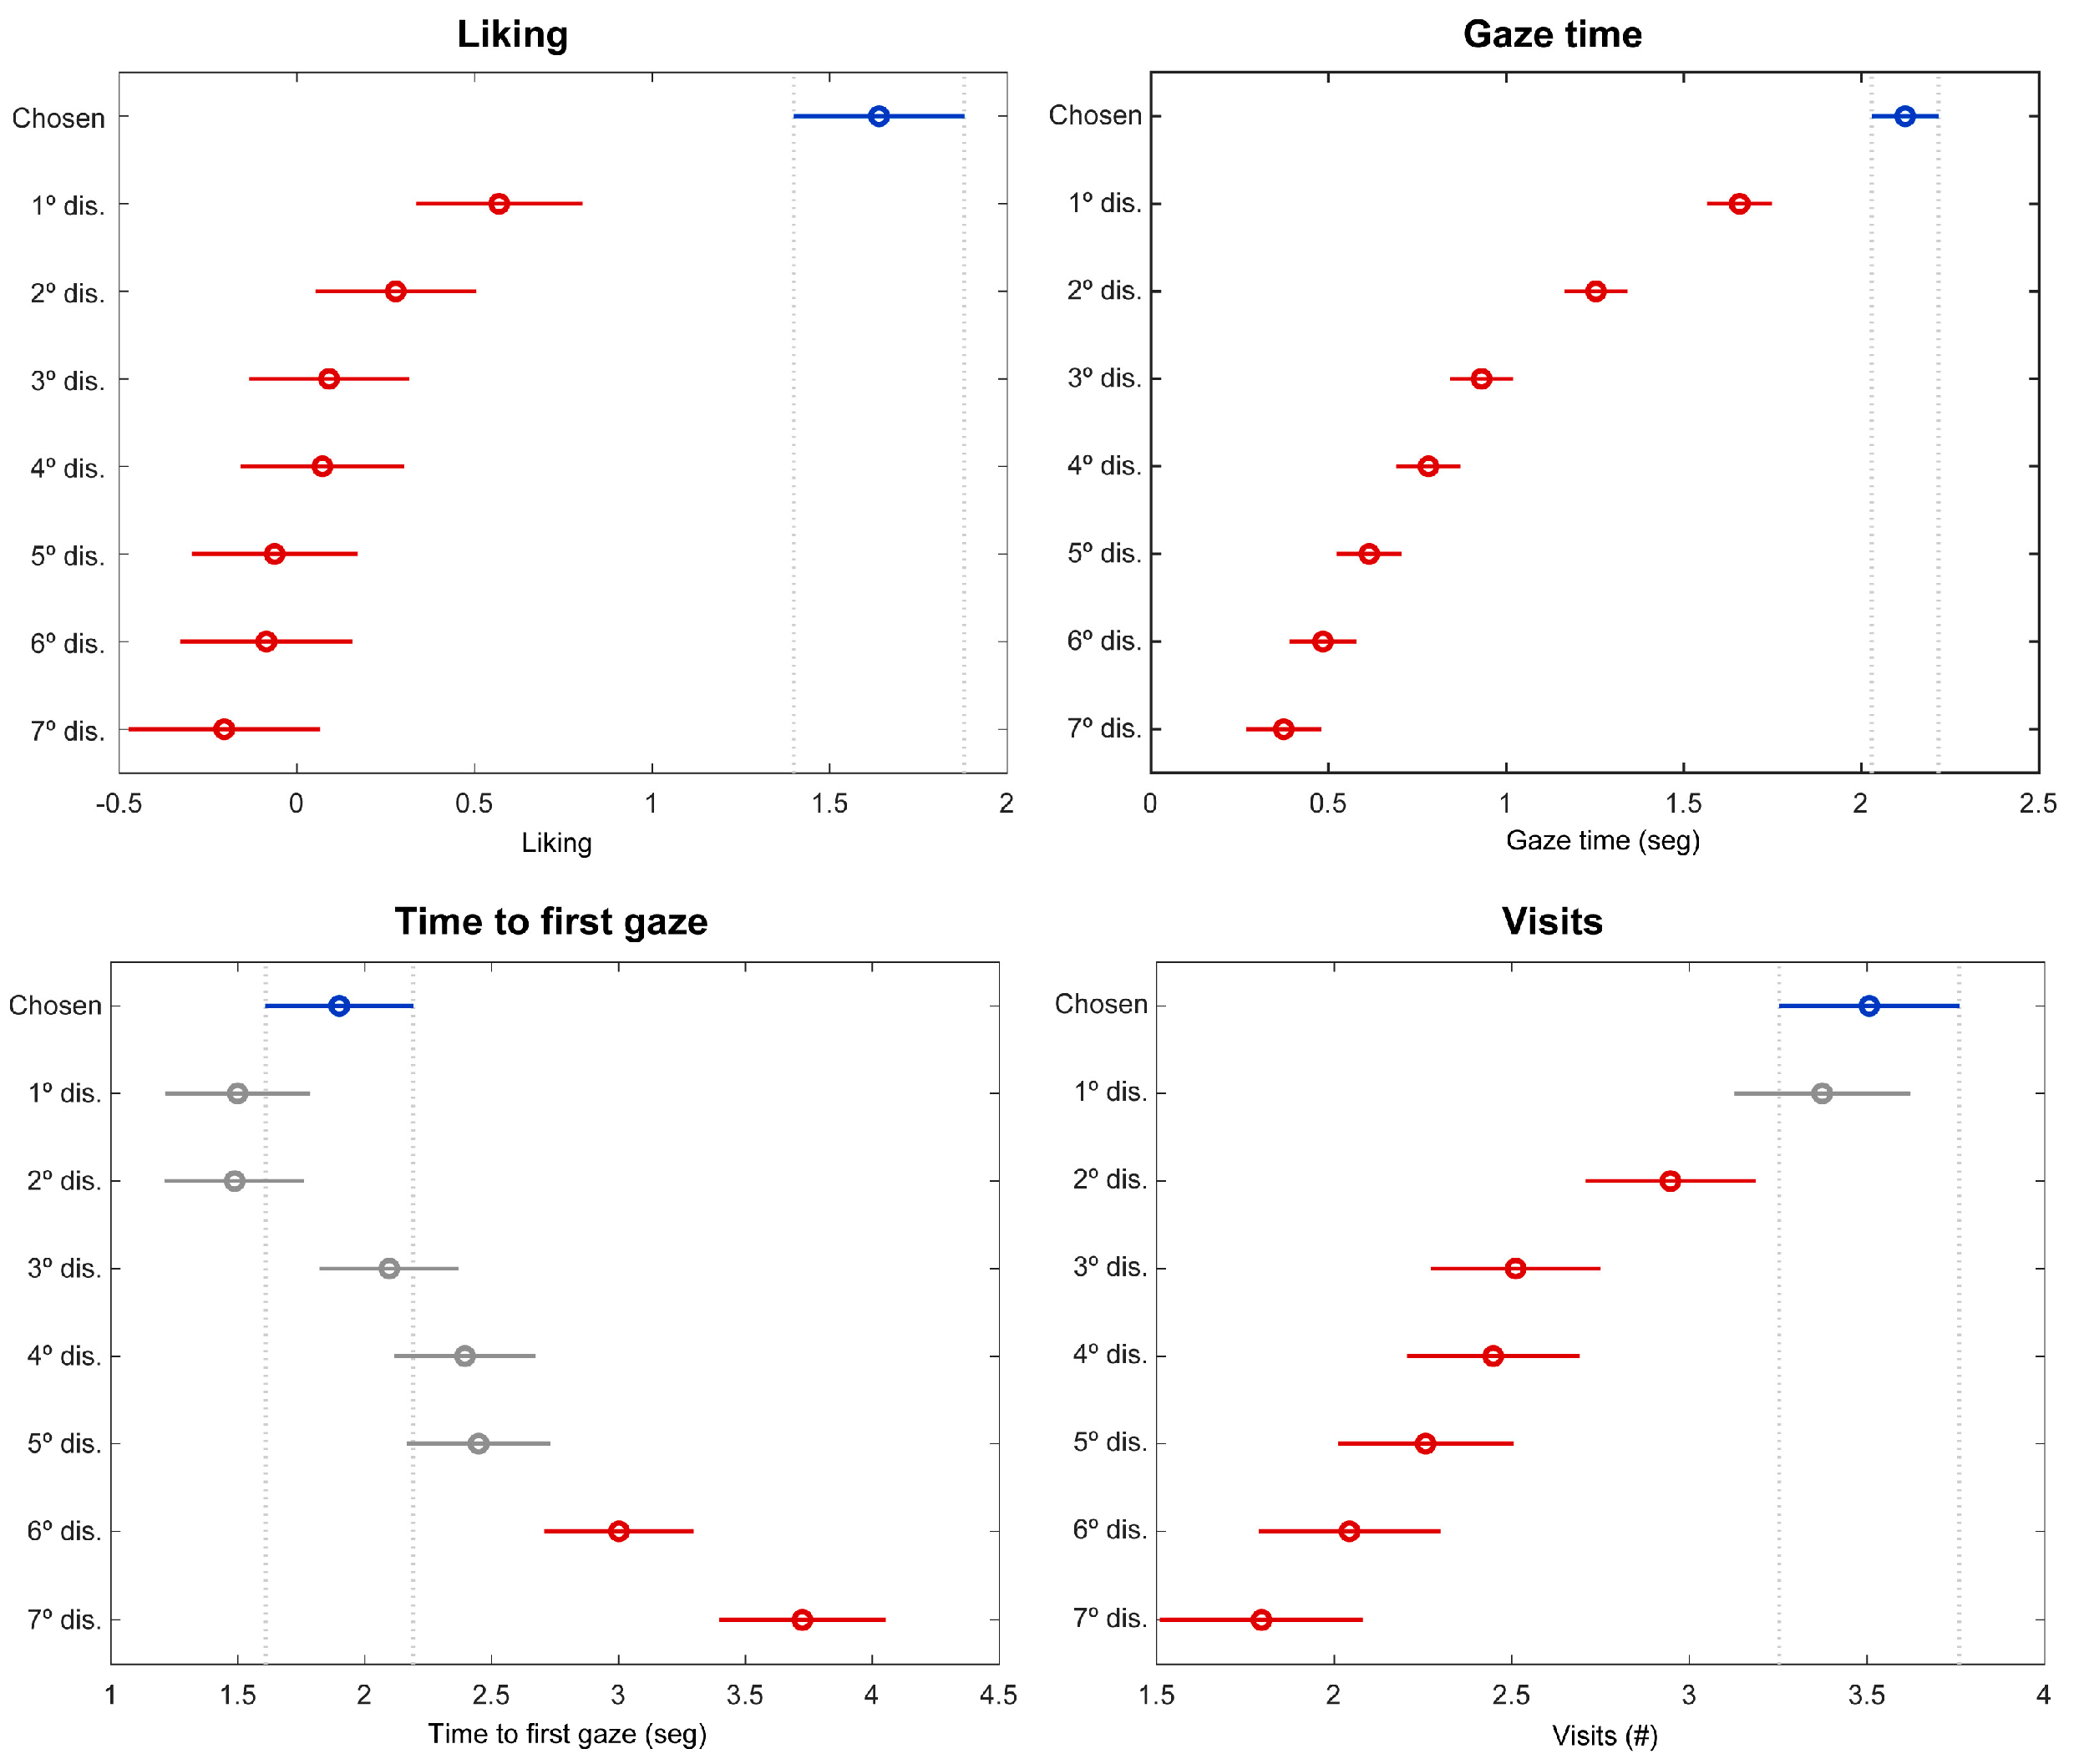
We also postulated that the selected stimuli would exhibit distinct patterns for eye-tracking metrics and scores for liking compared to the various distractors (H2). In this regard, the repeated measures ANOVAs (
Figure 5) and results shown in
Table 1 corroborated this hypothesis, so H2 is accepted. Firstly, results showed that there was a statistically significant difference in the liking score obtained for the product between the final selection and the other distractors, and descriptive statistics showed a higher score for this data set for the chosen stimuli. Moreover, the analysis revealed statistically significant differences between the selected stimulus and the other distractors across two eye-tracking metrics: (1) gaze time and (2) number of visits. In this sense, descriptive statistics showed that participants allocated a significantly higher amount of gaze time towards the chosen stimulus, and similarly, volunteers tended to revisit the chosen stimulus more frequently than the distractors, indicating a heightened level of attention and attraction towards the selected item. On the other hand, although there were some statistically significant differences between groups for the metric of Time to First Gaze, these differences were not as prominent as those found in Gaze time and the number of visits. From these results, we can infer that a user’s level of liking for an object can influence the amount of time they spend examining it according to [
25], which in turn could influence the final selection of the object. Therefore, analyzing the relationship between examination time and liking level can provide valuable information for understanding how users interact with objects and how their preference for them is formed.
On the other hand, it was postulated that the Gaze Cascade Model would occur in virtual environments (H3). For this, we studied the relationship between choices and distractors of 8-AFC with the visual attention patterns during the last seconds before the decision. In this regard, the results of ANOVA of gaze time indicate that our main hypothesis is accepted, since in the last instant before the decision, the choice is the most viewed. This is in line with results obtained by other authors in 2D environments [
19,
21,
22]. Analyzing the last seconds before the decision (
Figure 6), this trend was manifested approximately 1.5 s prior to the decision. This result was also obtained by [
21], who demonstrated that this time may increase for more complex stimuli, so we recommend conducting this type of study with different furniture items with varying complexity levels to observe whether this duration increases or decreases.
In this regard, achieving similar results between 2D and 3D media may raise questions about the efficacy of VR in evaluating decision-making processes, as presenting stimuli in an immersive VR environment may require a greater investment of time and resources compared to the use of 2D images. However, some research has demonstrated that perceptual differences exist when displaying products using different visualization techniques [
28,
29,
30], differences which may be minimized through the use of more sophisticated visualization techniques given its ability to convey more information than basic representations such as images [
31,
32]. Therefore, the observation that similar effects are manifest in virtual environments represents a significant improvement in the evaluation process of a range of products, since the feedback provided by users will be more accurate and comparable to the evaluation of the real product. Furthermore, VR can help minimize the cost associated with the evaluation process, as the use of physical prototyping can be significantly reduced.
Finally, it was proposed that we could predict the user’s decision by analyzing the gaze time evolution in the last three seconds leading up to the product selection (H4), which was accepted. Our results are in line with other authors [
33,
34], who correlated eye-tracking metrics with the consumer’s choice. In our case, more complex statistical modeling was conducted to demonstrate this hypothesis, since statistical hypothesis testing as ANOVA or correlation does not directly imply that user choices can be predicted. A deep learning 2-class model was developed to recognize chosen and non-chosen stimuli based on the gaze time patterns in the final three seconds prior to the decision. We selected this time window based on the previous results of the Gaze Cascade Model (
Figure 6). The architecture chosen was an LSTM since it can model the temporal dynamics of a signal. Recent studies used this architecture to recognize the patterns of eye-tracking in VR environments [
35]. To evaluate the model, we used an independent test set of 287 decisions. The results demonstrated that the model achieved an overall accuracy of 90.59% when predicting the decision (specifically, the chosen stimuli were correctly identified 59.57% of the time, while non-chosen stimuli were accurately recognized 96.67% of the time). These findings suggest that gaze time can serve as a valuable indicator of decision-making, and the deep learning model has shown accuracy in predicting user choices using eye-tracking metrics. The high accuracy in recognizing non-chosen stimuli indicates that the model can effectively differentiate between selected and non-selected options. Overall, this research highlights the potential of using gaze time analysis and deep learning techniques for understanding and predicting user decisions. Further investigations and refinements to the model could lead to even more accurate predictions, making it a valuable tool for product evaluation and user research in various fields.
6. Conclusions
This study represents a significant step forward in understanding consumer behavior in virtual environments, specifically in the realm of product design and development. In this research, the eye-tracking technique was used to record and analyze participants’ eye movements while interacting with virtual products. This physiological measurement method is particularly valuable in decision-making research because it provides objective information about participants’ preferences and attitudes, even those that are unconscious or difficult to verbalize. In fact, information obtained through eye-tracking can be more accurate and reliable than that collected through self-report questionnaires, which often rely on participants’ memory and subjective interpretation.
In this context, the findings demonstrate that the decision-making process in virtual environments is comparable to that in other media (i.e., 2D images) or with other types of stimuli (i.e., logos, toys, or faces). Furthermore, we demonstrated that it is possible to predict the user’s choice toward different product design alternatives through eye-tracking metrics and that a correlation exists between certain eye-tracking measures and users’ preferences towards products. This information is particularly valuable for industrial designers who are tasked with developing new products and must choose from various alternative concepts. By analyzing eye movements, designers can gain a better understanding of users’ attentional patterns, and this knowledge can then be used to optimize product designs and improve user satisfaction. On the other hand, this is a relatively easy technique to use, as eye-trackers are properly integrated into HMDs. This could speed up the evaluation process, which results in cost reduction.
Moreover, the use of VR in product design offers numerous advantages in terms of cost and logistics. Specifically, this technology allows for the reduction of costs and time associated with the creation of physical prototypes and the conduct of usability tests in real environments. Additionally, virtual environments enable designers and manufacturers to experiment with a wide variety of designs and materials quickly and economically, leading to greater innovation and the creation of more attractive products for consumers.
Therefore, the combination of eye-tracking techniques with VR in the product design process can be a highly effective strategy for improving the quality and efficiency of creating new products and services. In summary, research on consumer behavior in virtual environments, coupled with the use of virtual reality in the design process, can offer companies a more precise and cost-effective approach to creating innovative and attractive products for consumers.
We acknowledge the limitations of our study, which primarily serves as an initial analysis of user behavior in virtual environments concerning decision-making tasks. However, we recognize the need for future work to conduct a more comprehensive and detailed analysis specifically examining how gaze influences each individual design dimension selected for a product, rather than solely considering the product as a whole.
