
Analyzing the SAR in Human Head Tissues under Different Exposure Scenarios

Abstract
1. Introduction
1.1. Related Works on SAR
1.2. Research Gaps of Previous Work on SAR
1.3. Contribution of This Paper
- The study analyzed the impact of different exposure scenarios, such as varying frequencies, electric field levels, and age/gender, on the SAR distribution within the head tissues.
- The SAR analysis in human head tissues provides valuable insights into the potential effects of electromagnetic radiation and contributes to the development of safety measures for protecting human health.
- The analysis of SAR values in the head helps identify potential vulnerabilities or variations in different populations.
- The study investigated the effect of tissue type on SAR, aiding in the assessment of specific risks associated with different organs and body parts.
- Examining the effect of frequency on SAR values helps identify potential variations in energy absorption across frequencies used in current and emerging wireless technologies.
- SAR analysis facilitates the assessment of potential risks associated with different power levels, allowing for comparison against established safety guidelines.
- The results obtained in this study can help in designing and optimizing wireless communication devices, electromagnetic safety standards, and guidelines to minimize exposure-related health risks.
2. Materials and Methods
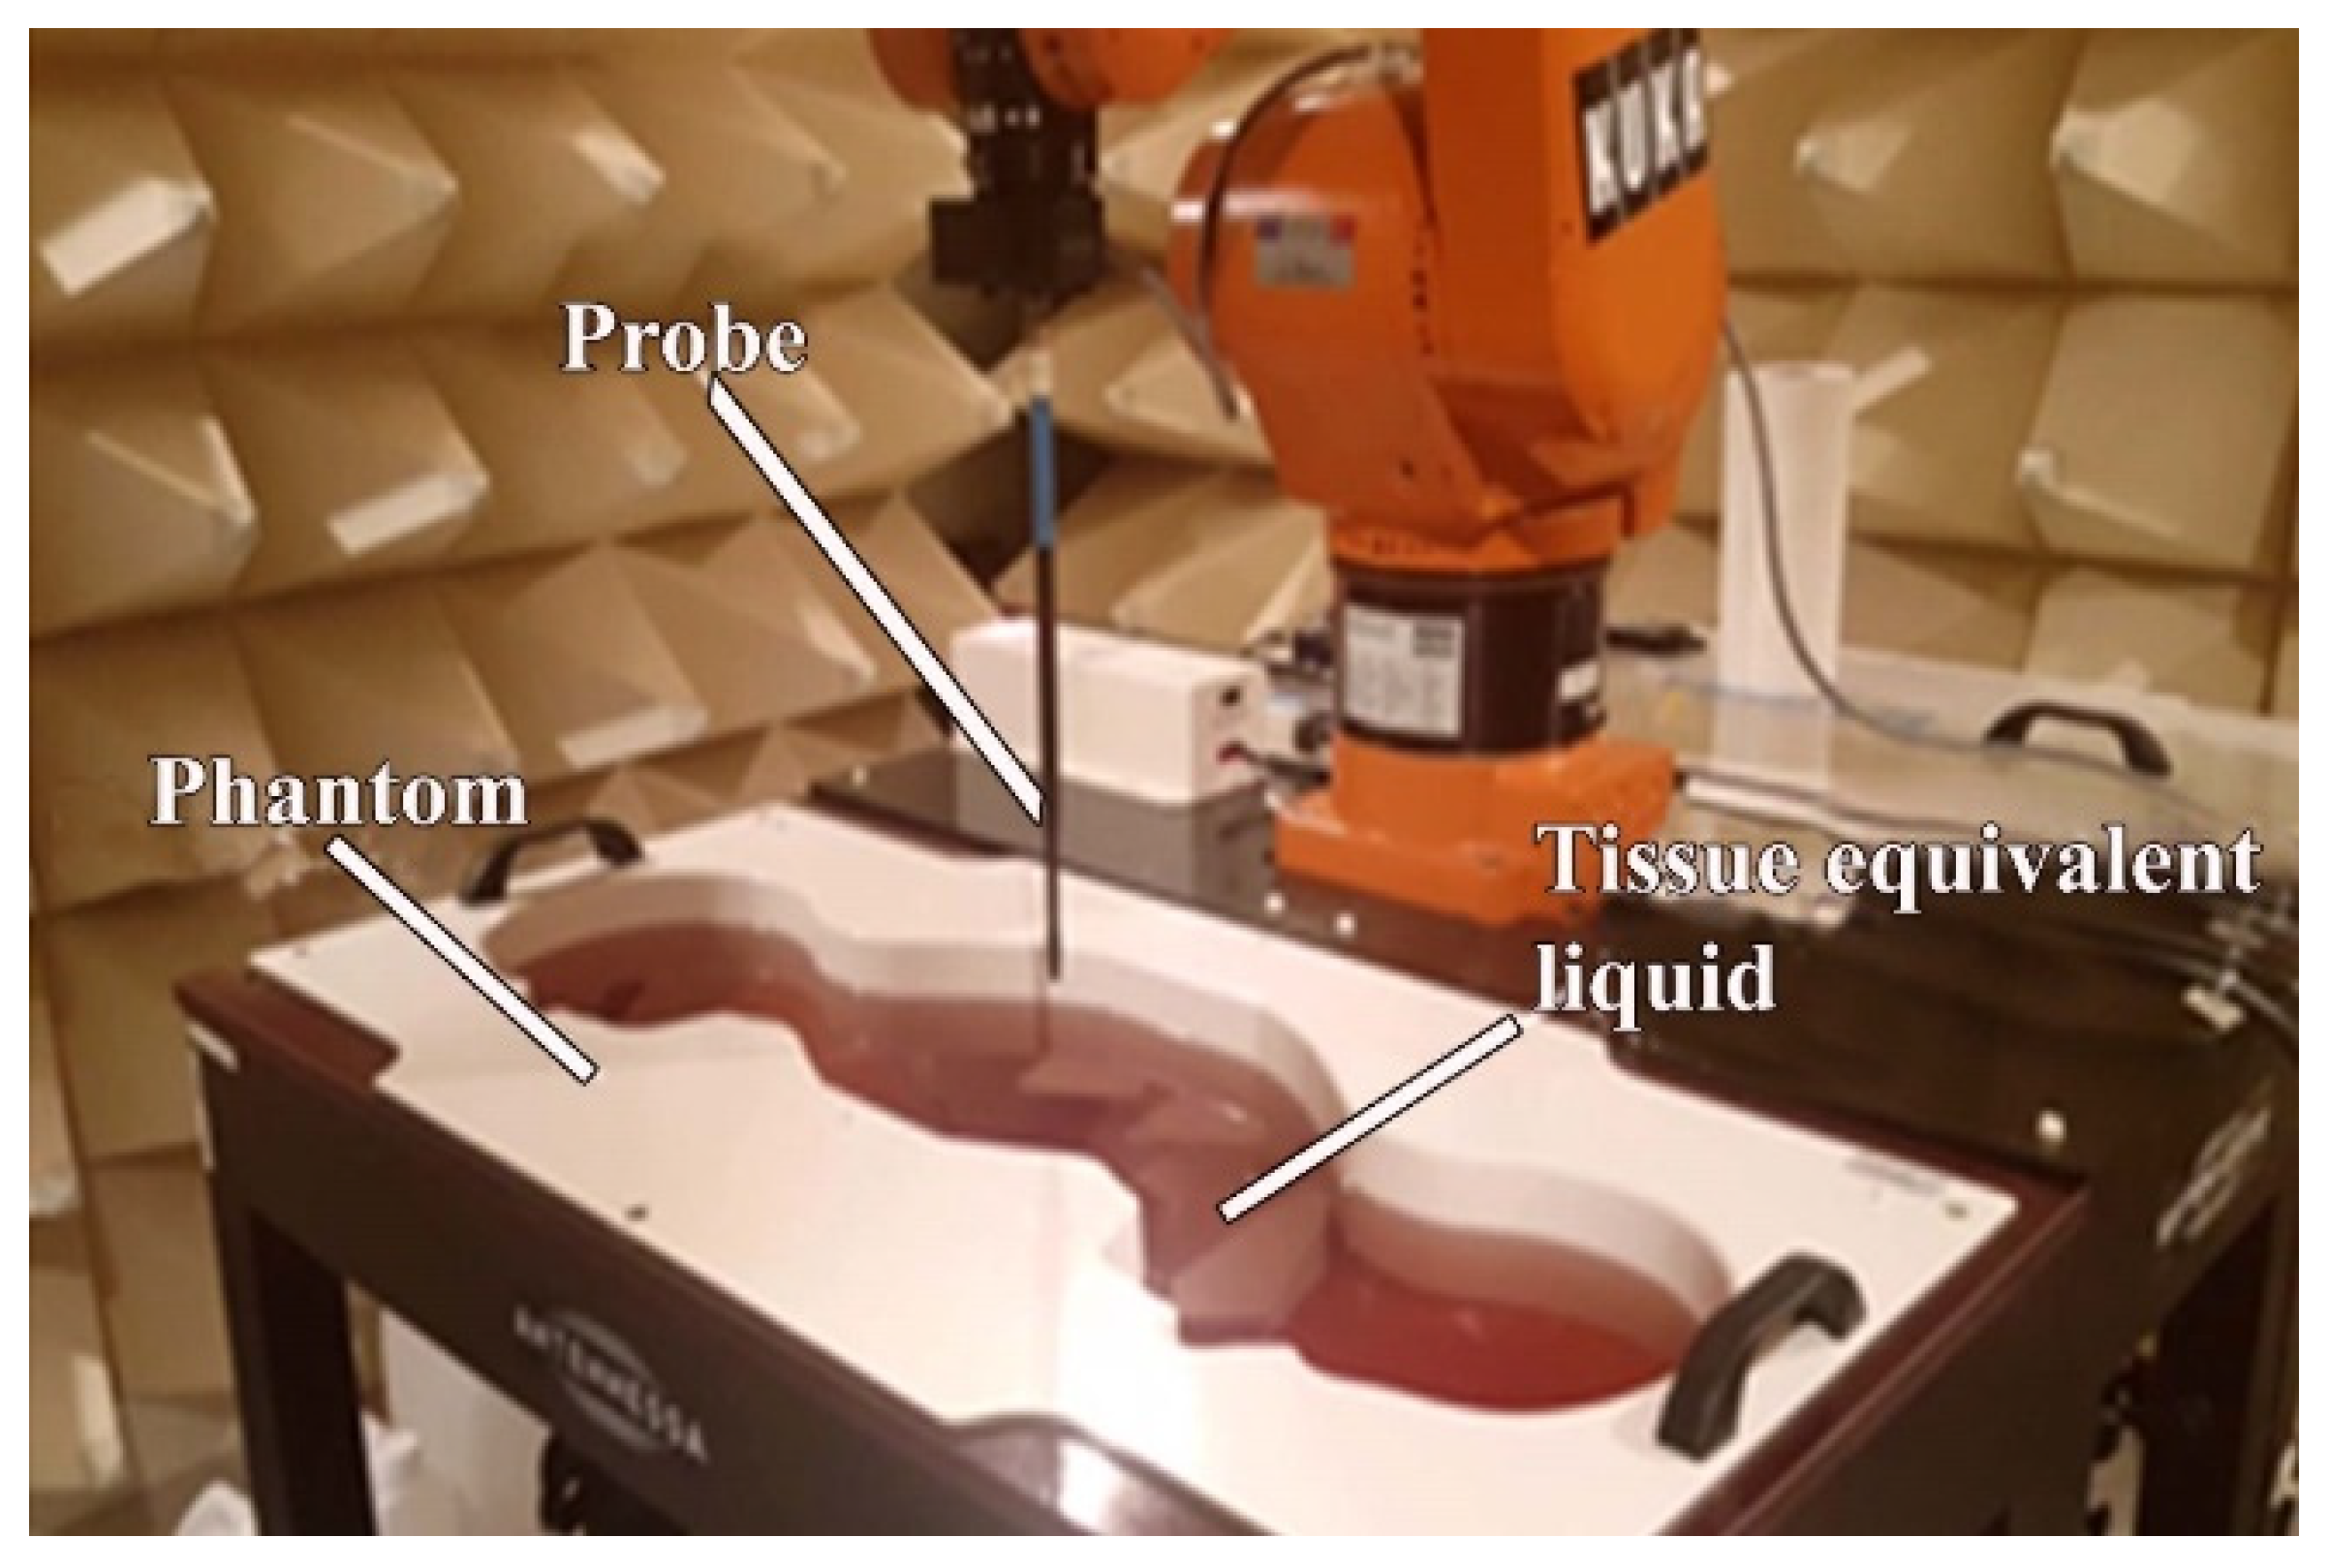
2.1. SAR Laboratory Measurements
2.2. SAR Simulations
3. Results and Discussion
3.1. SAR Laboratory Measurements
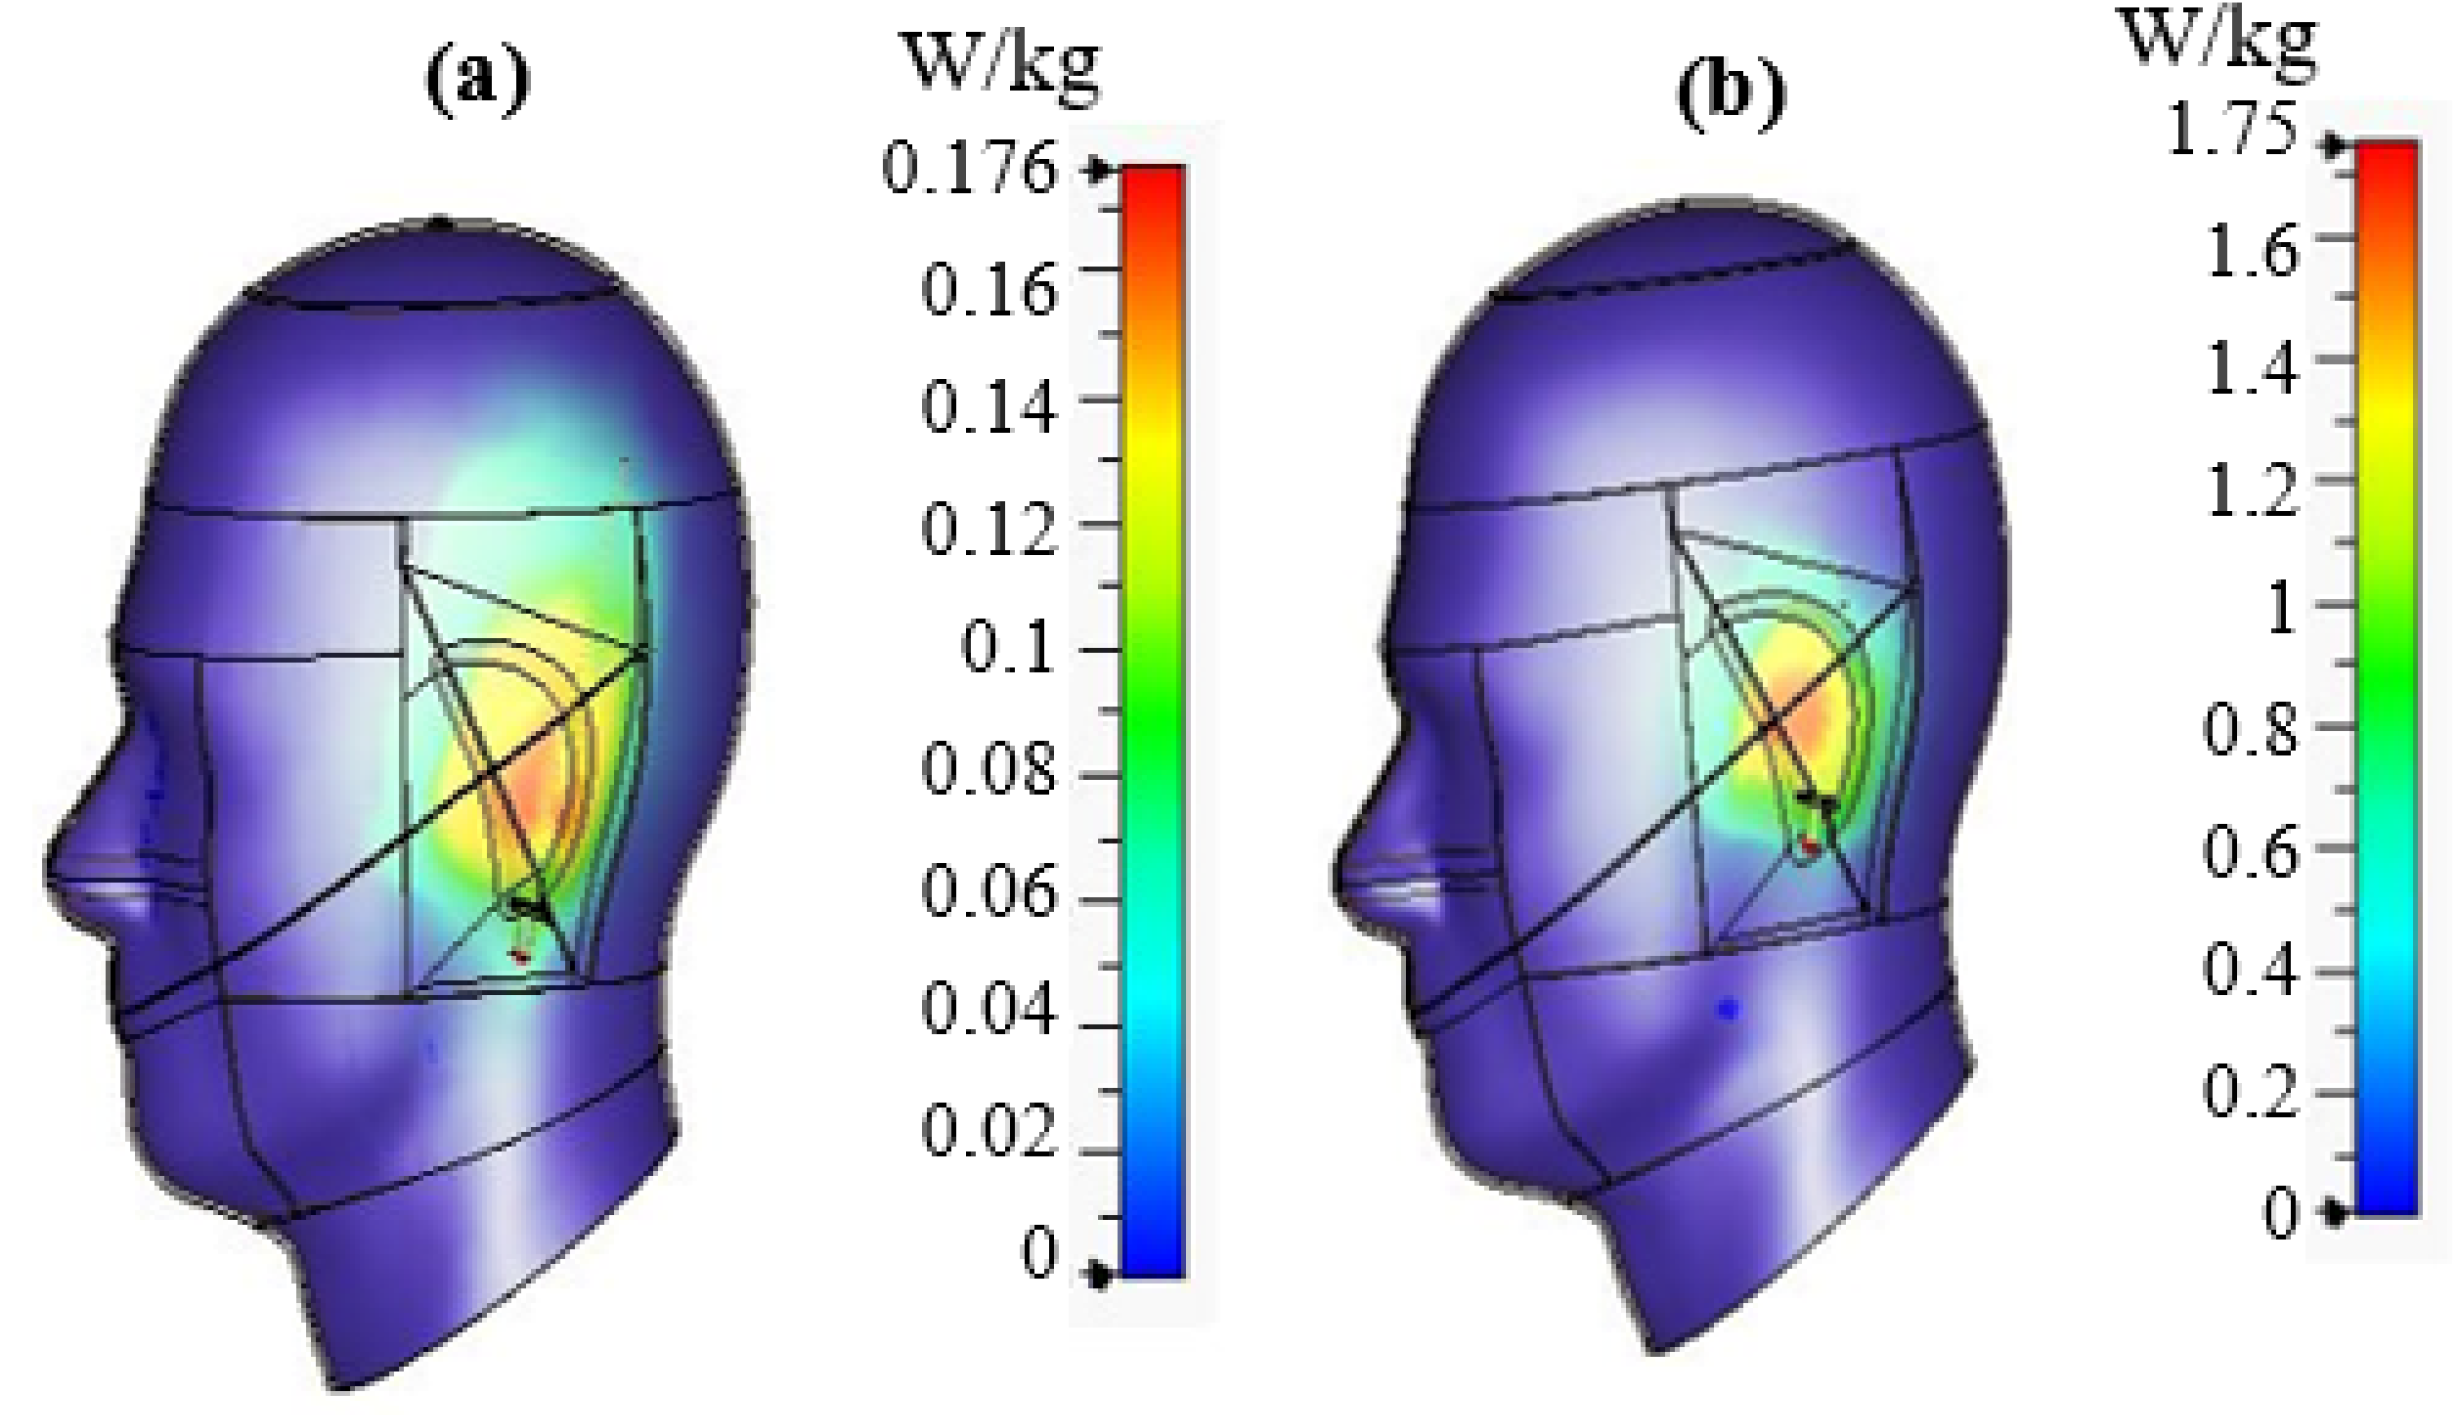
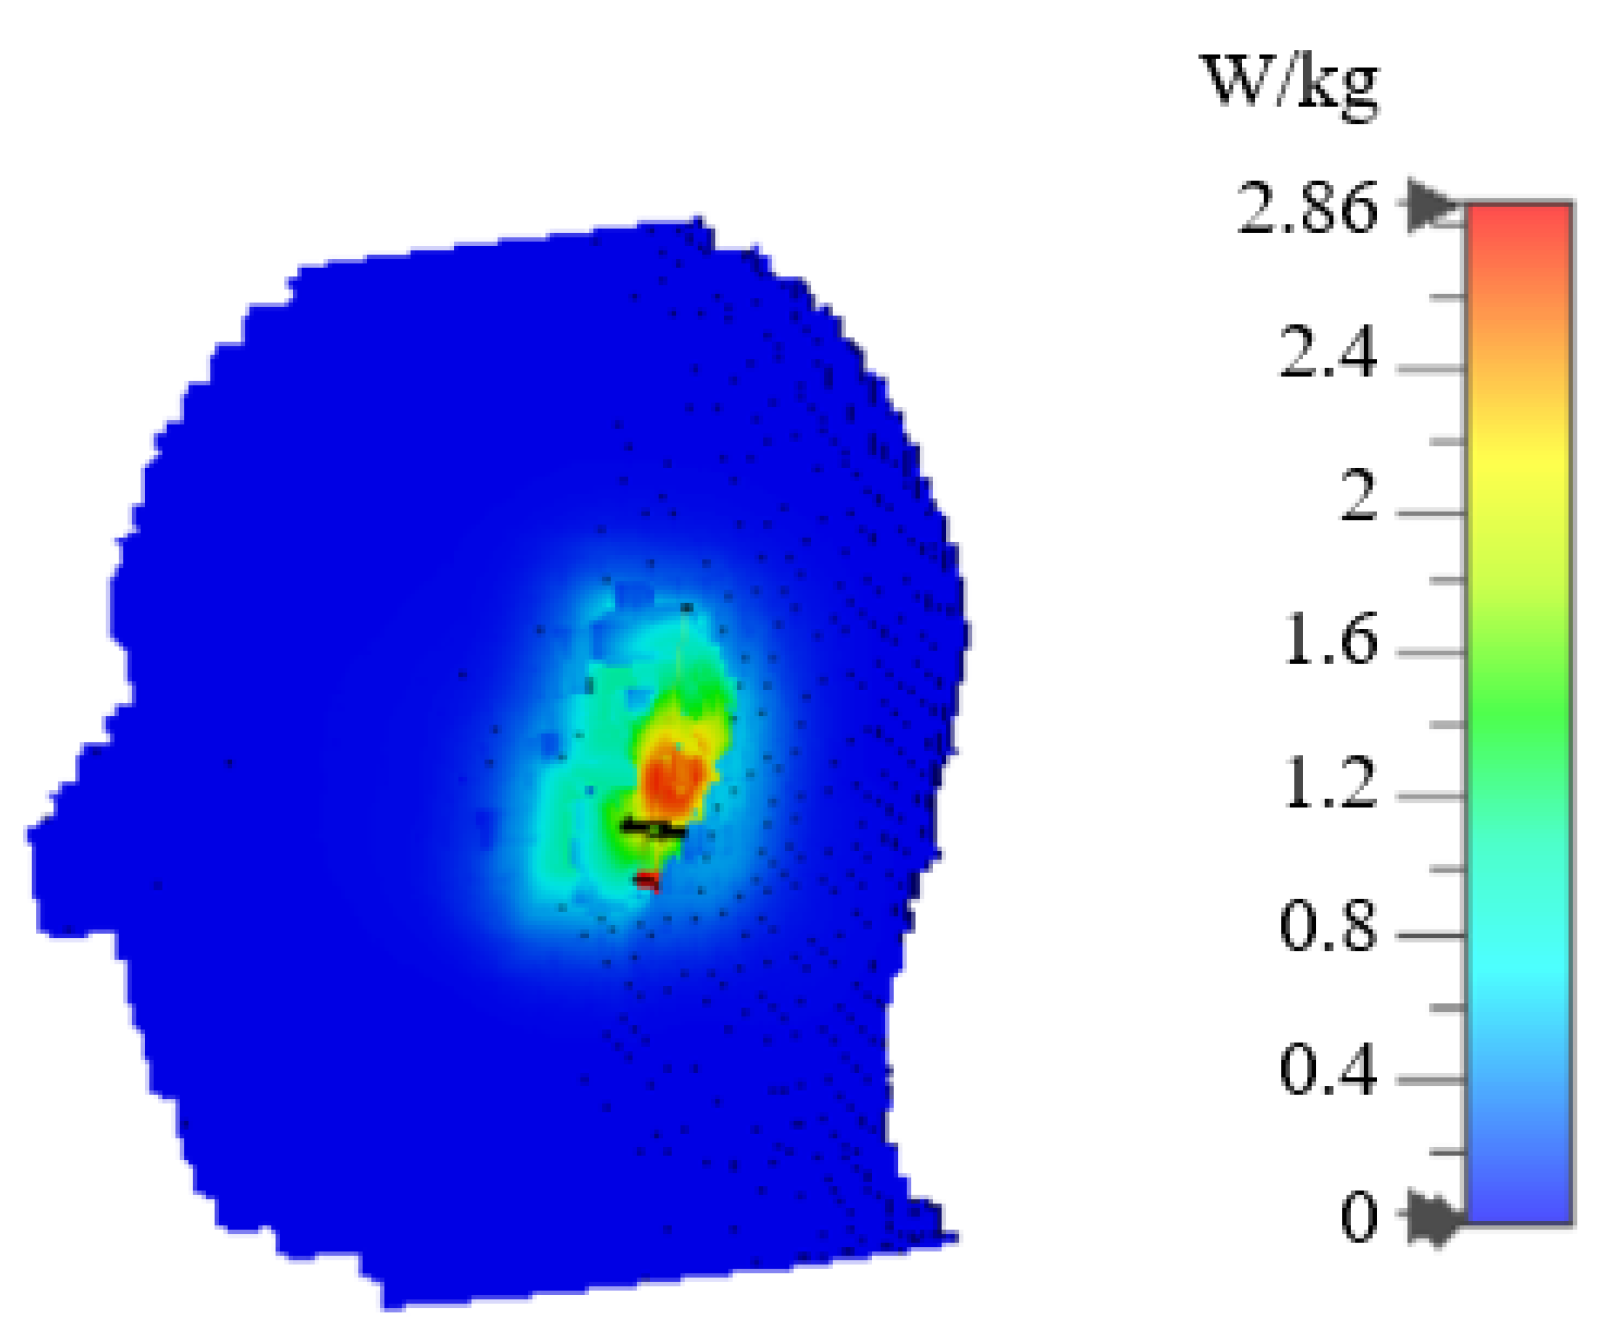
3.2. SAR Simulations for SAM
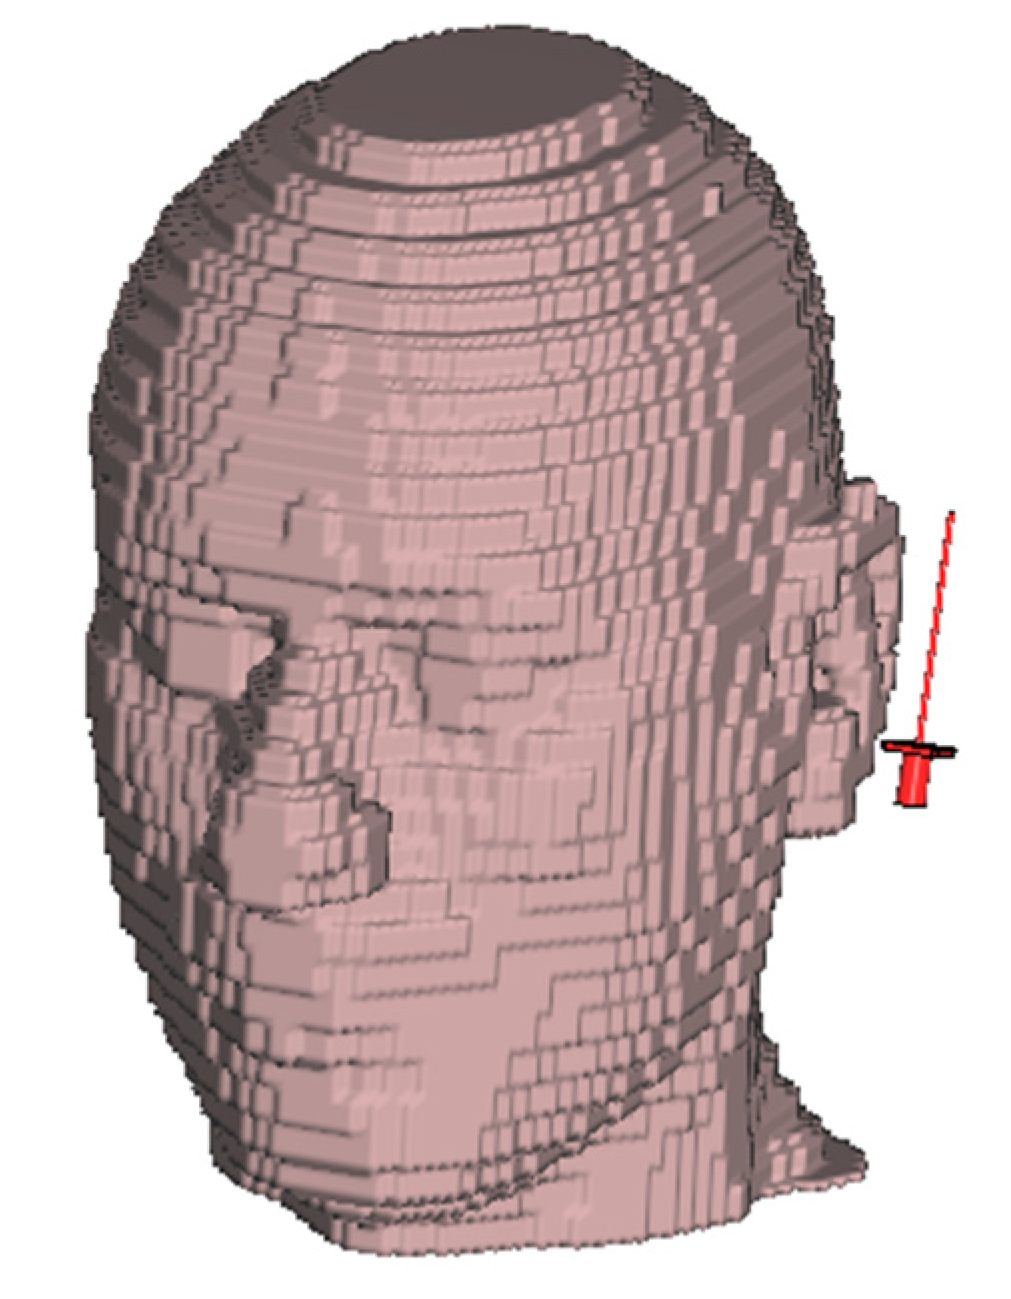
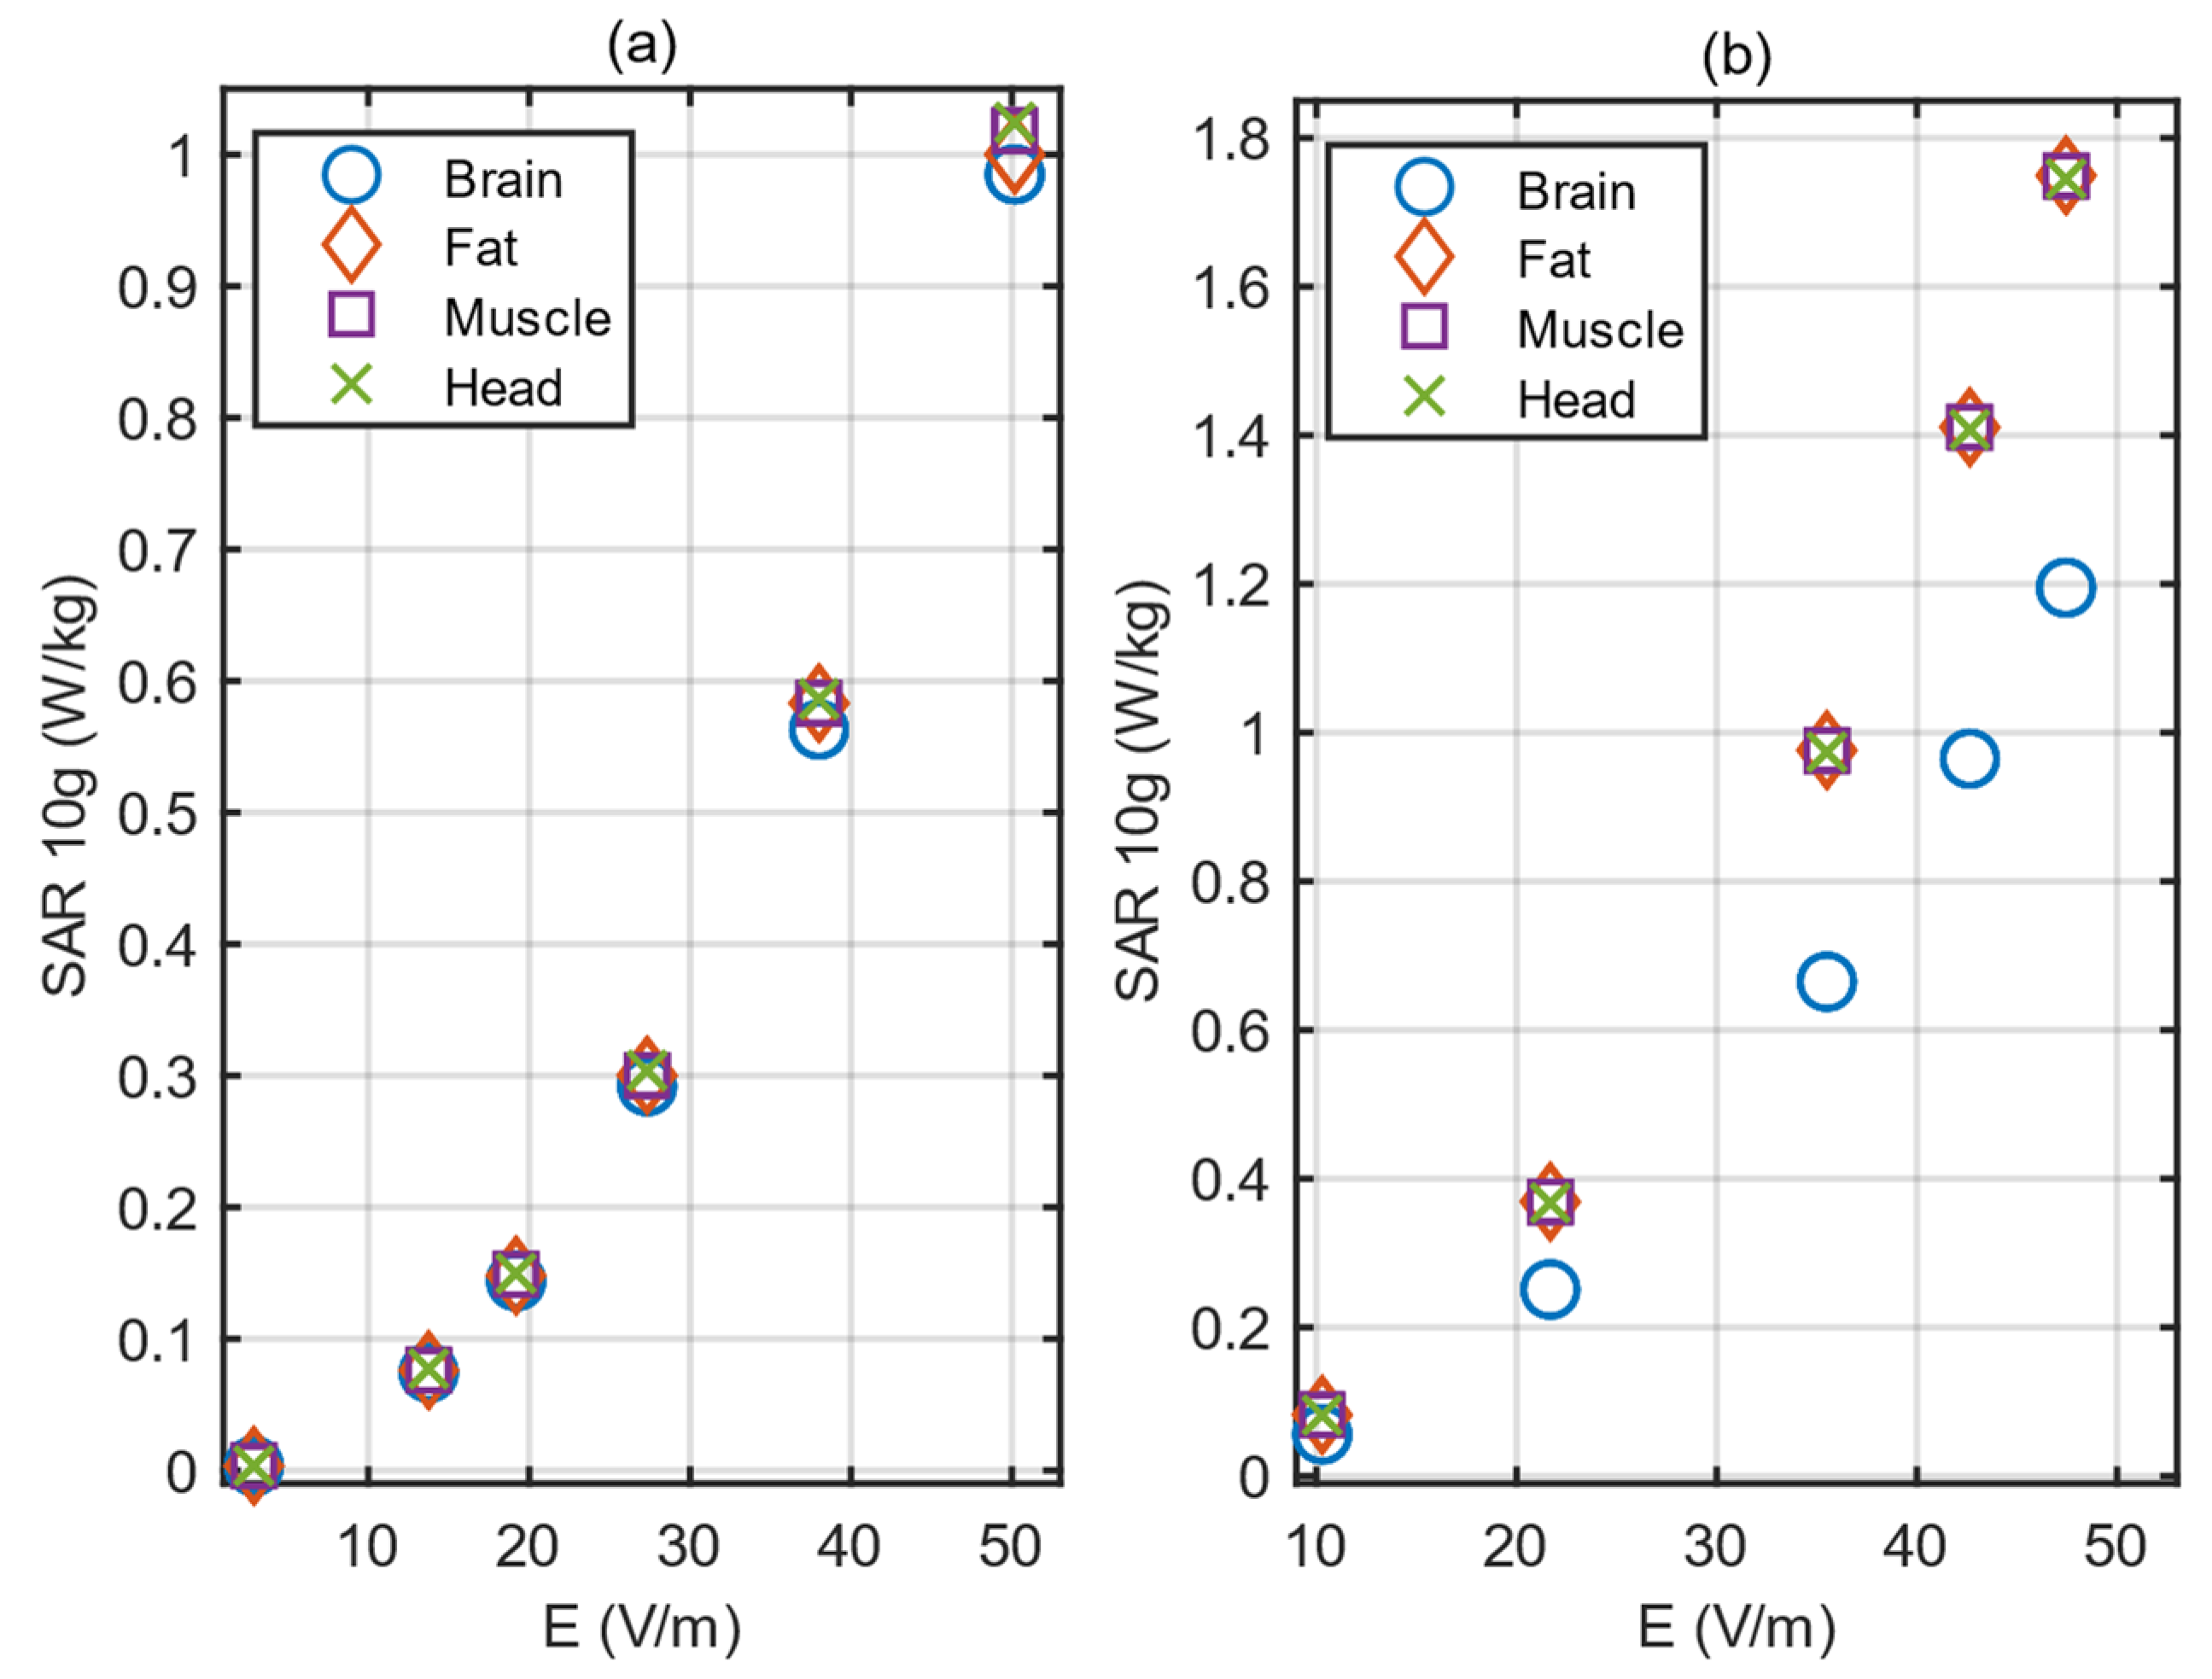
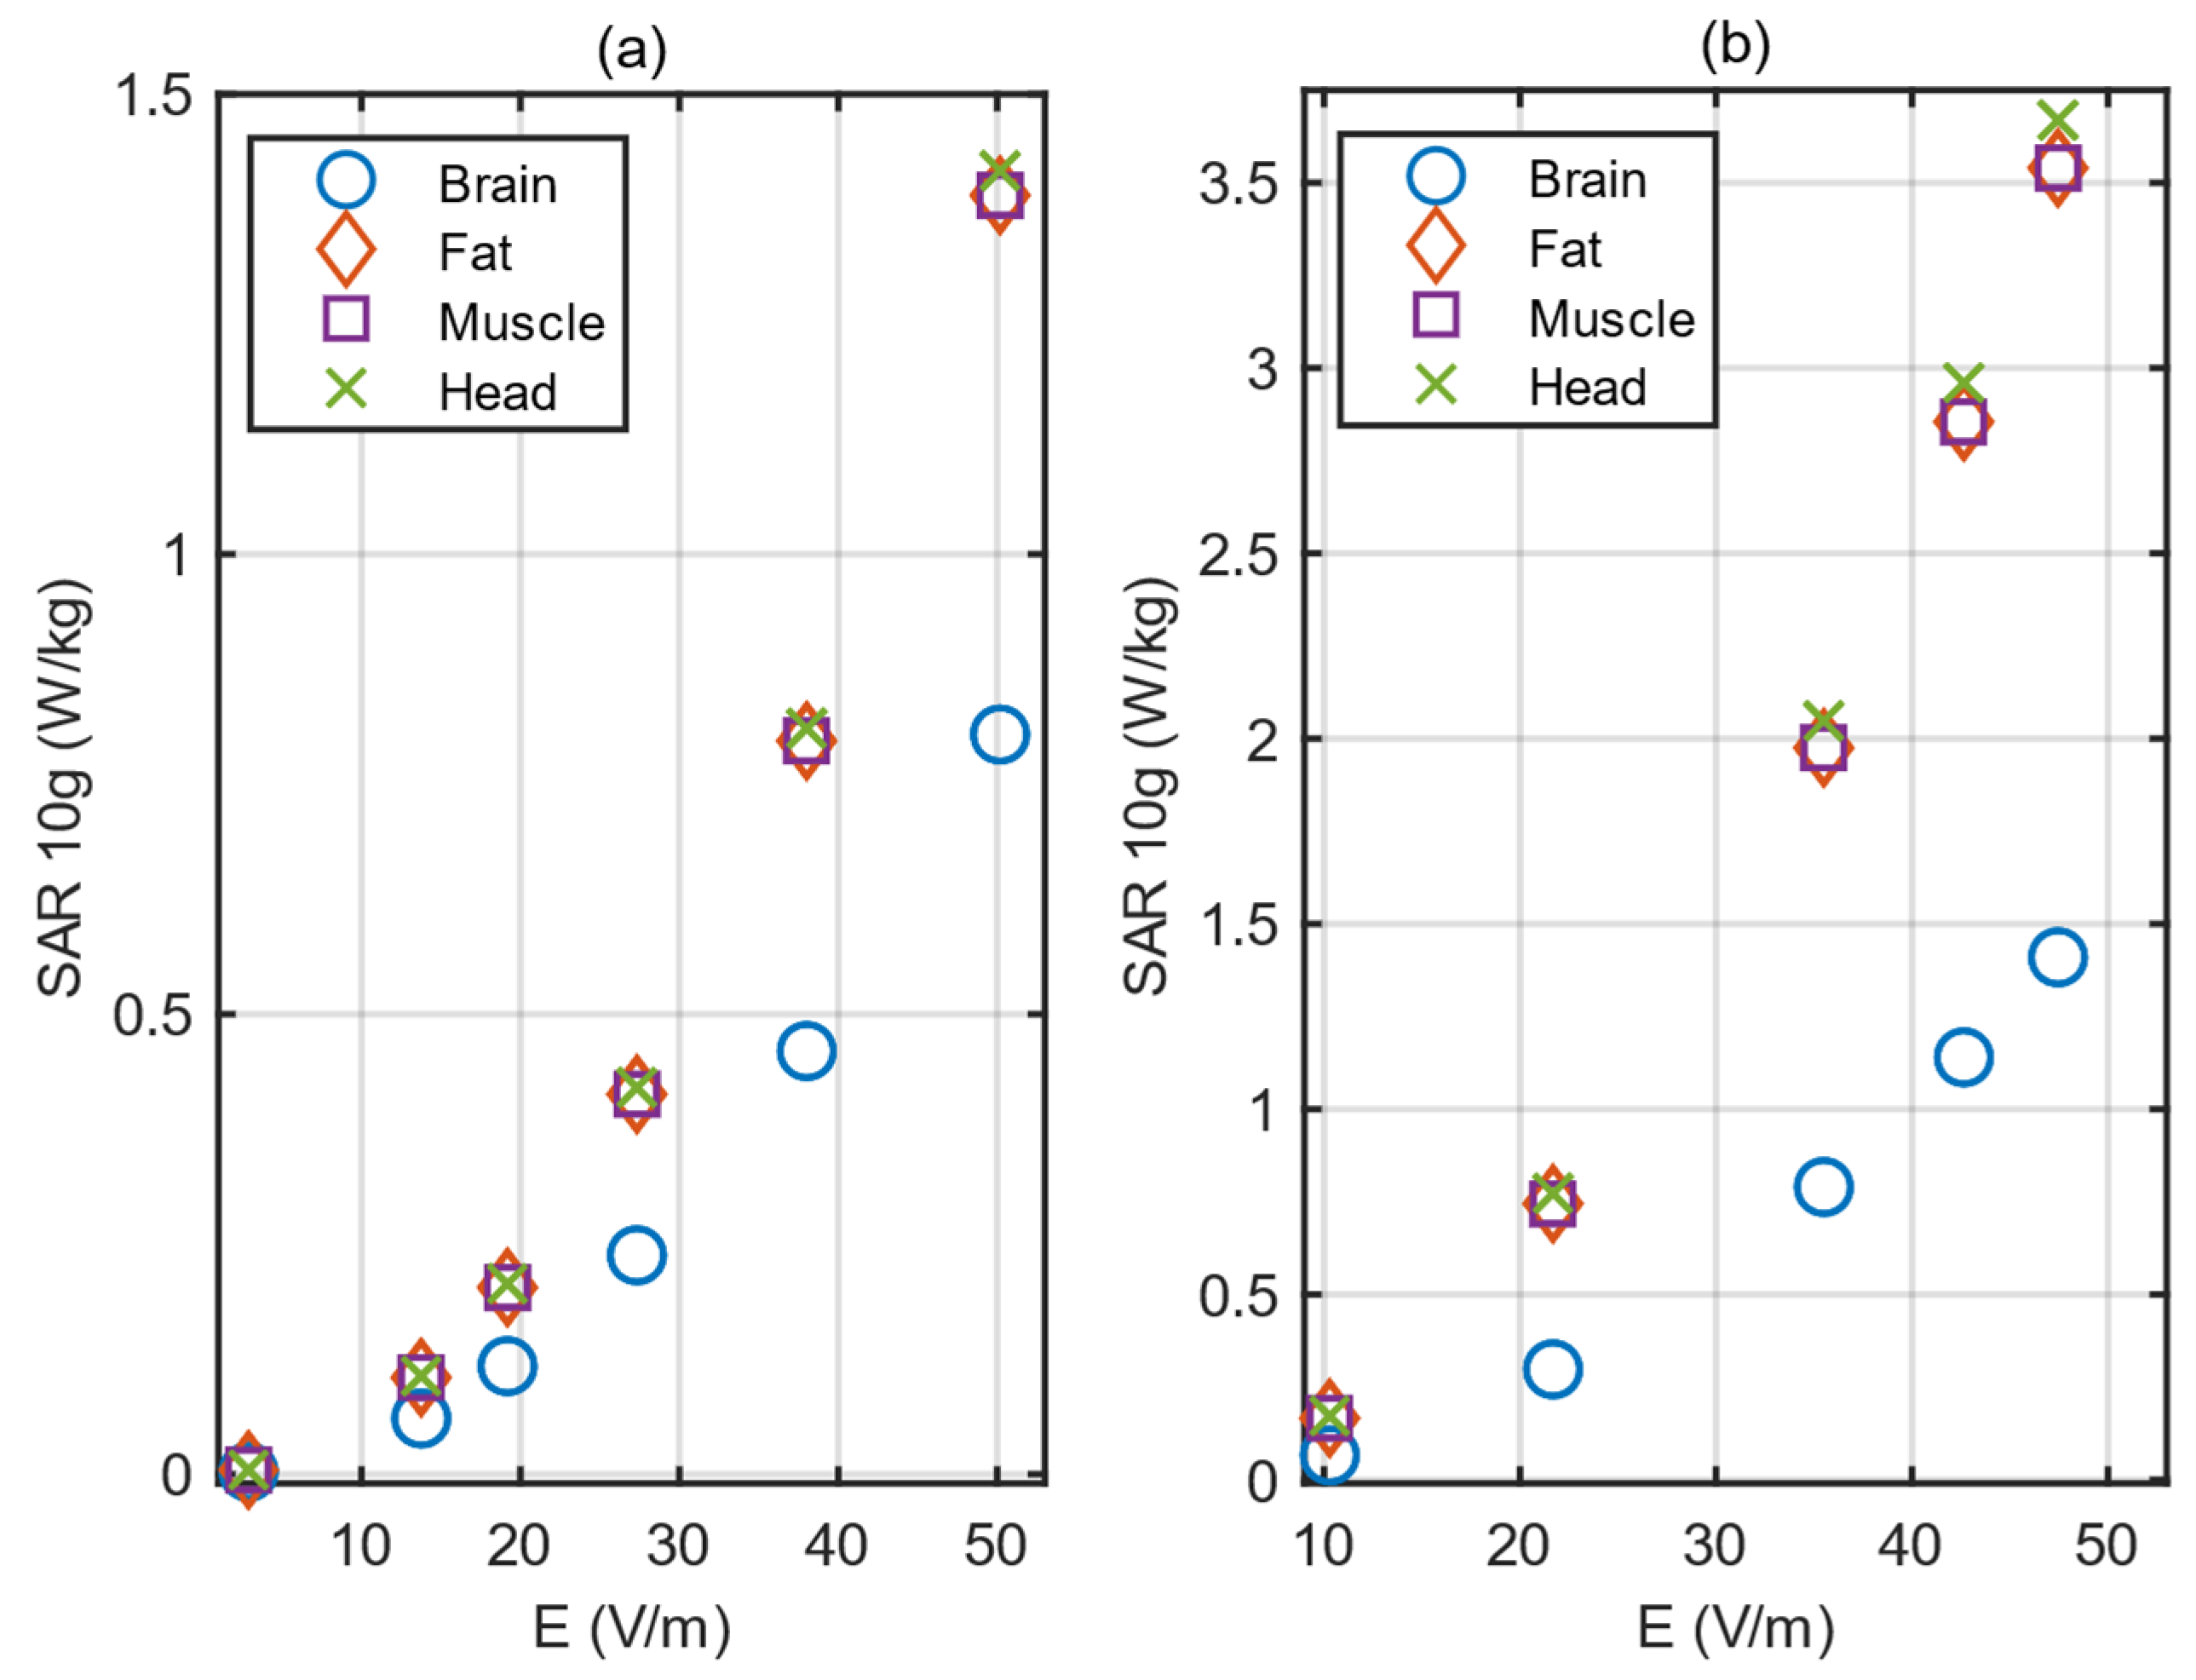
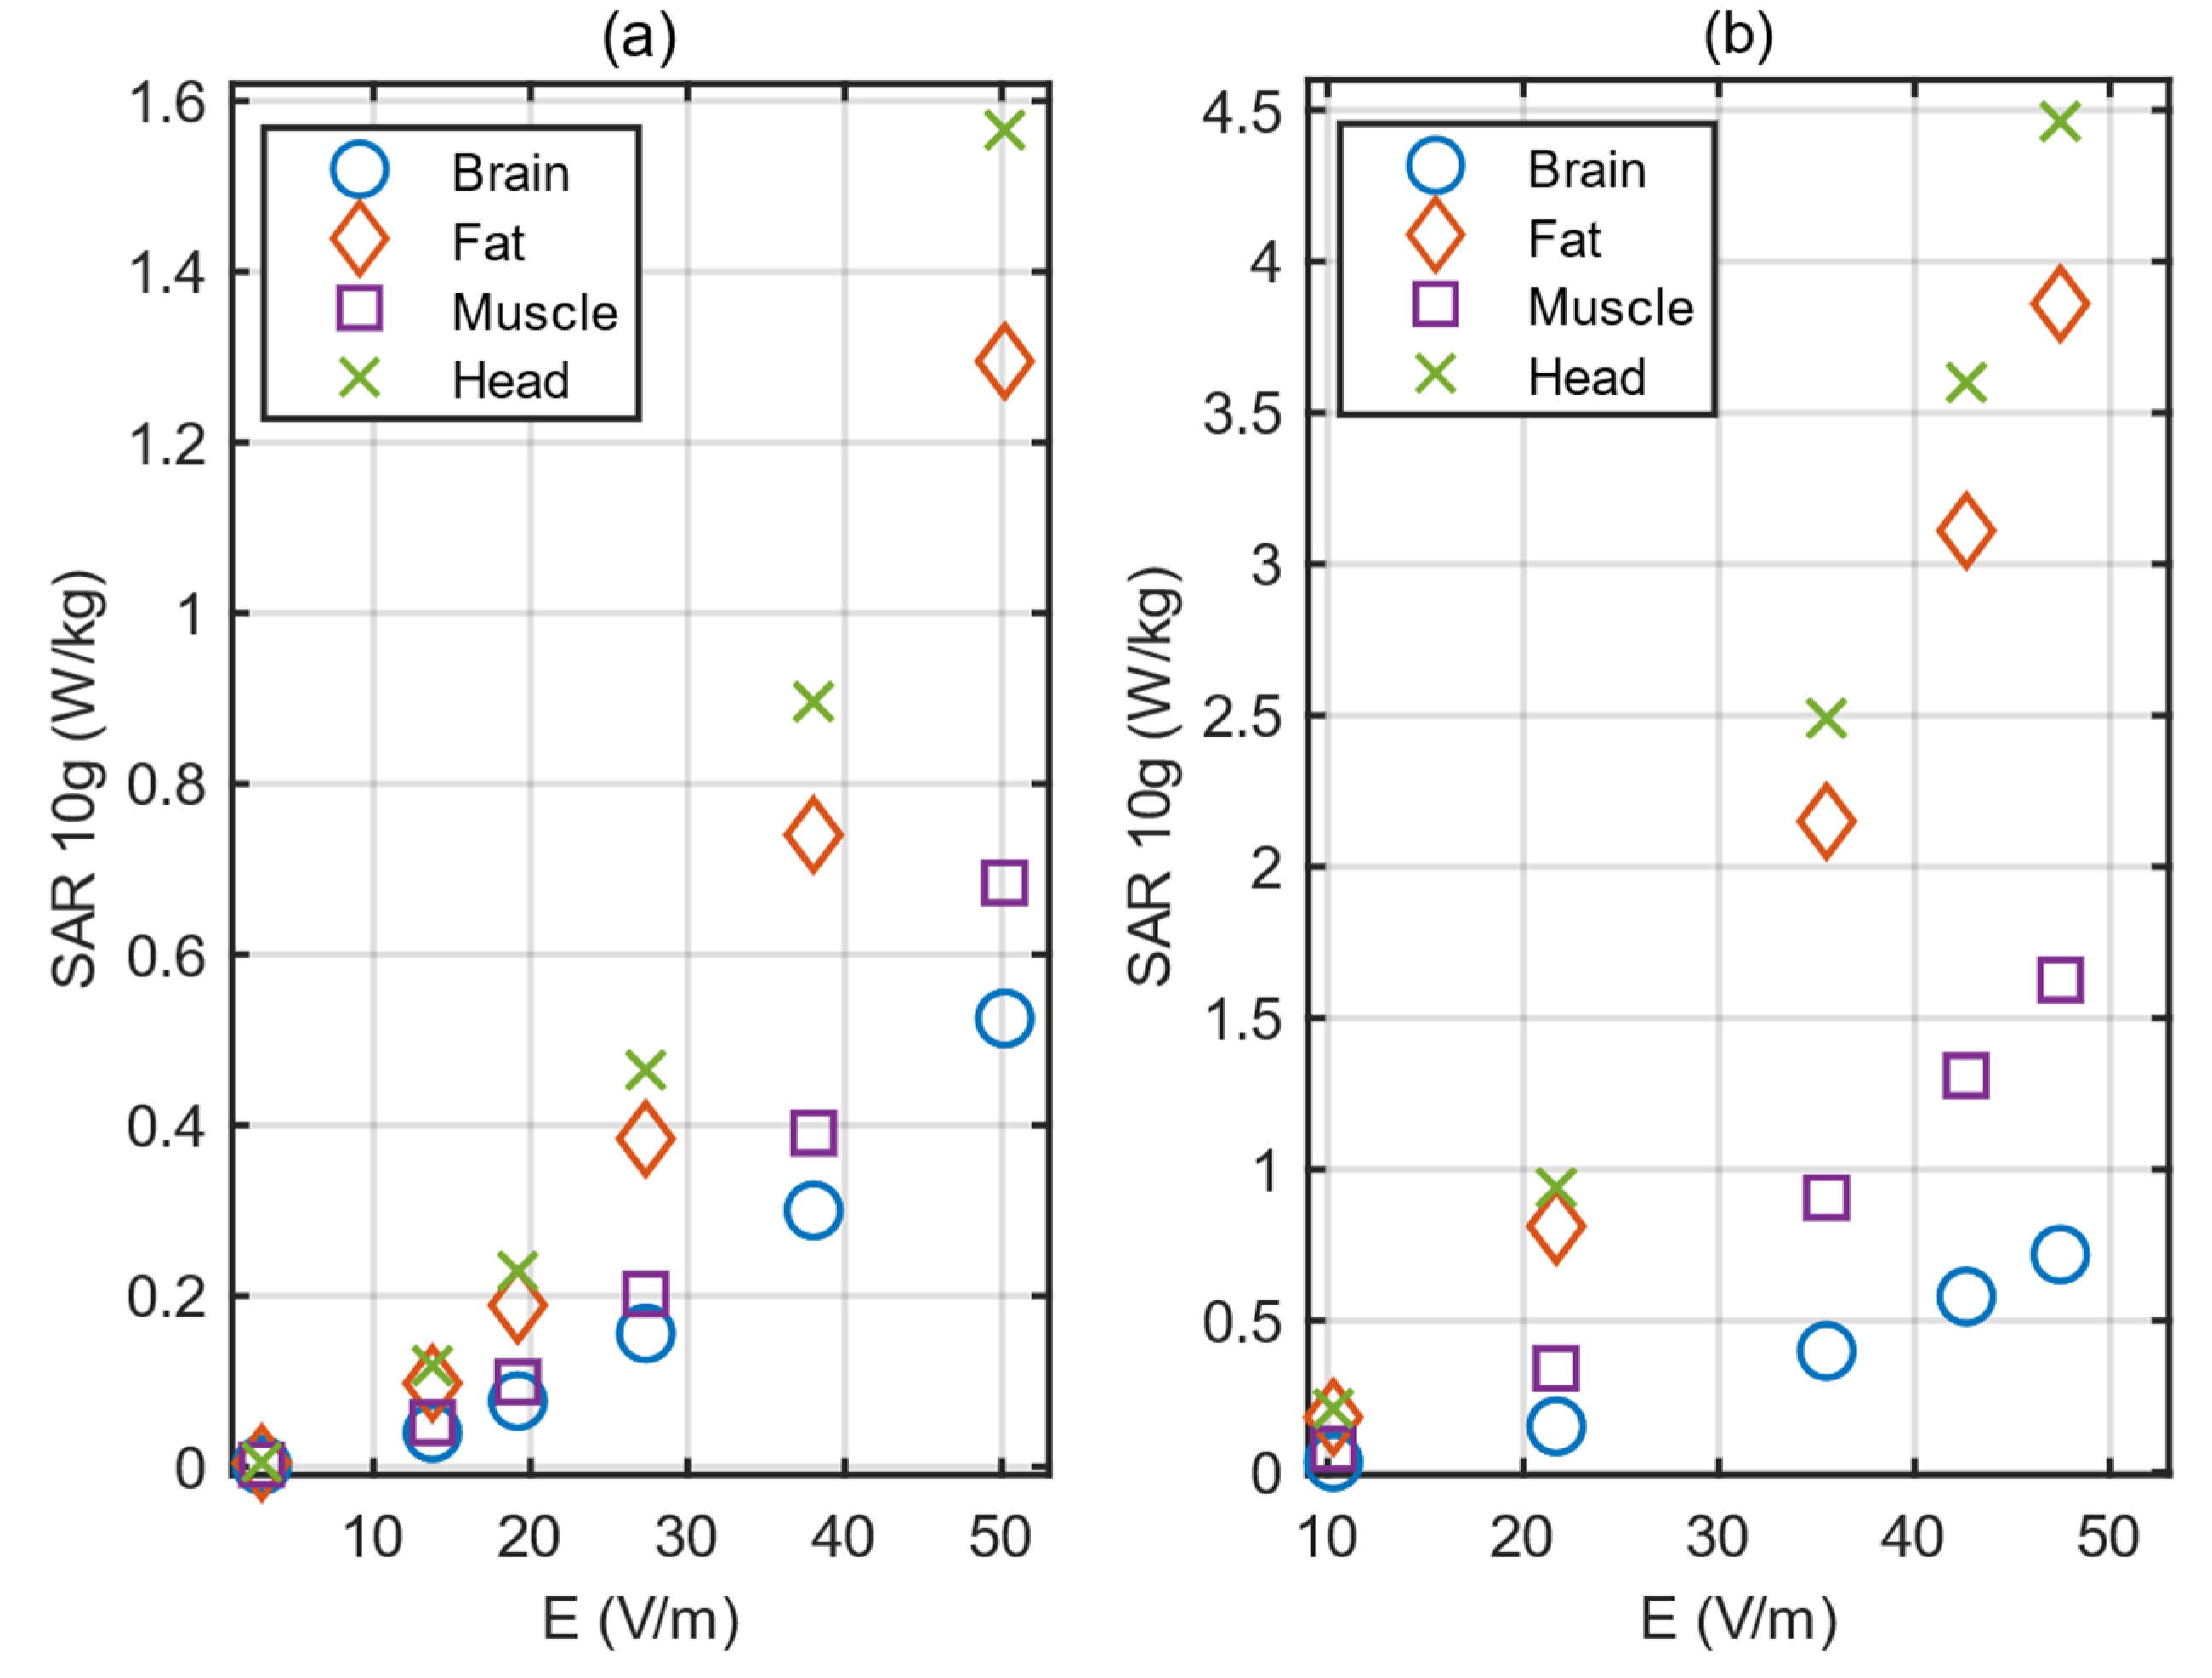
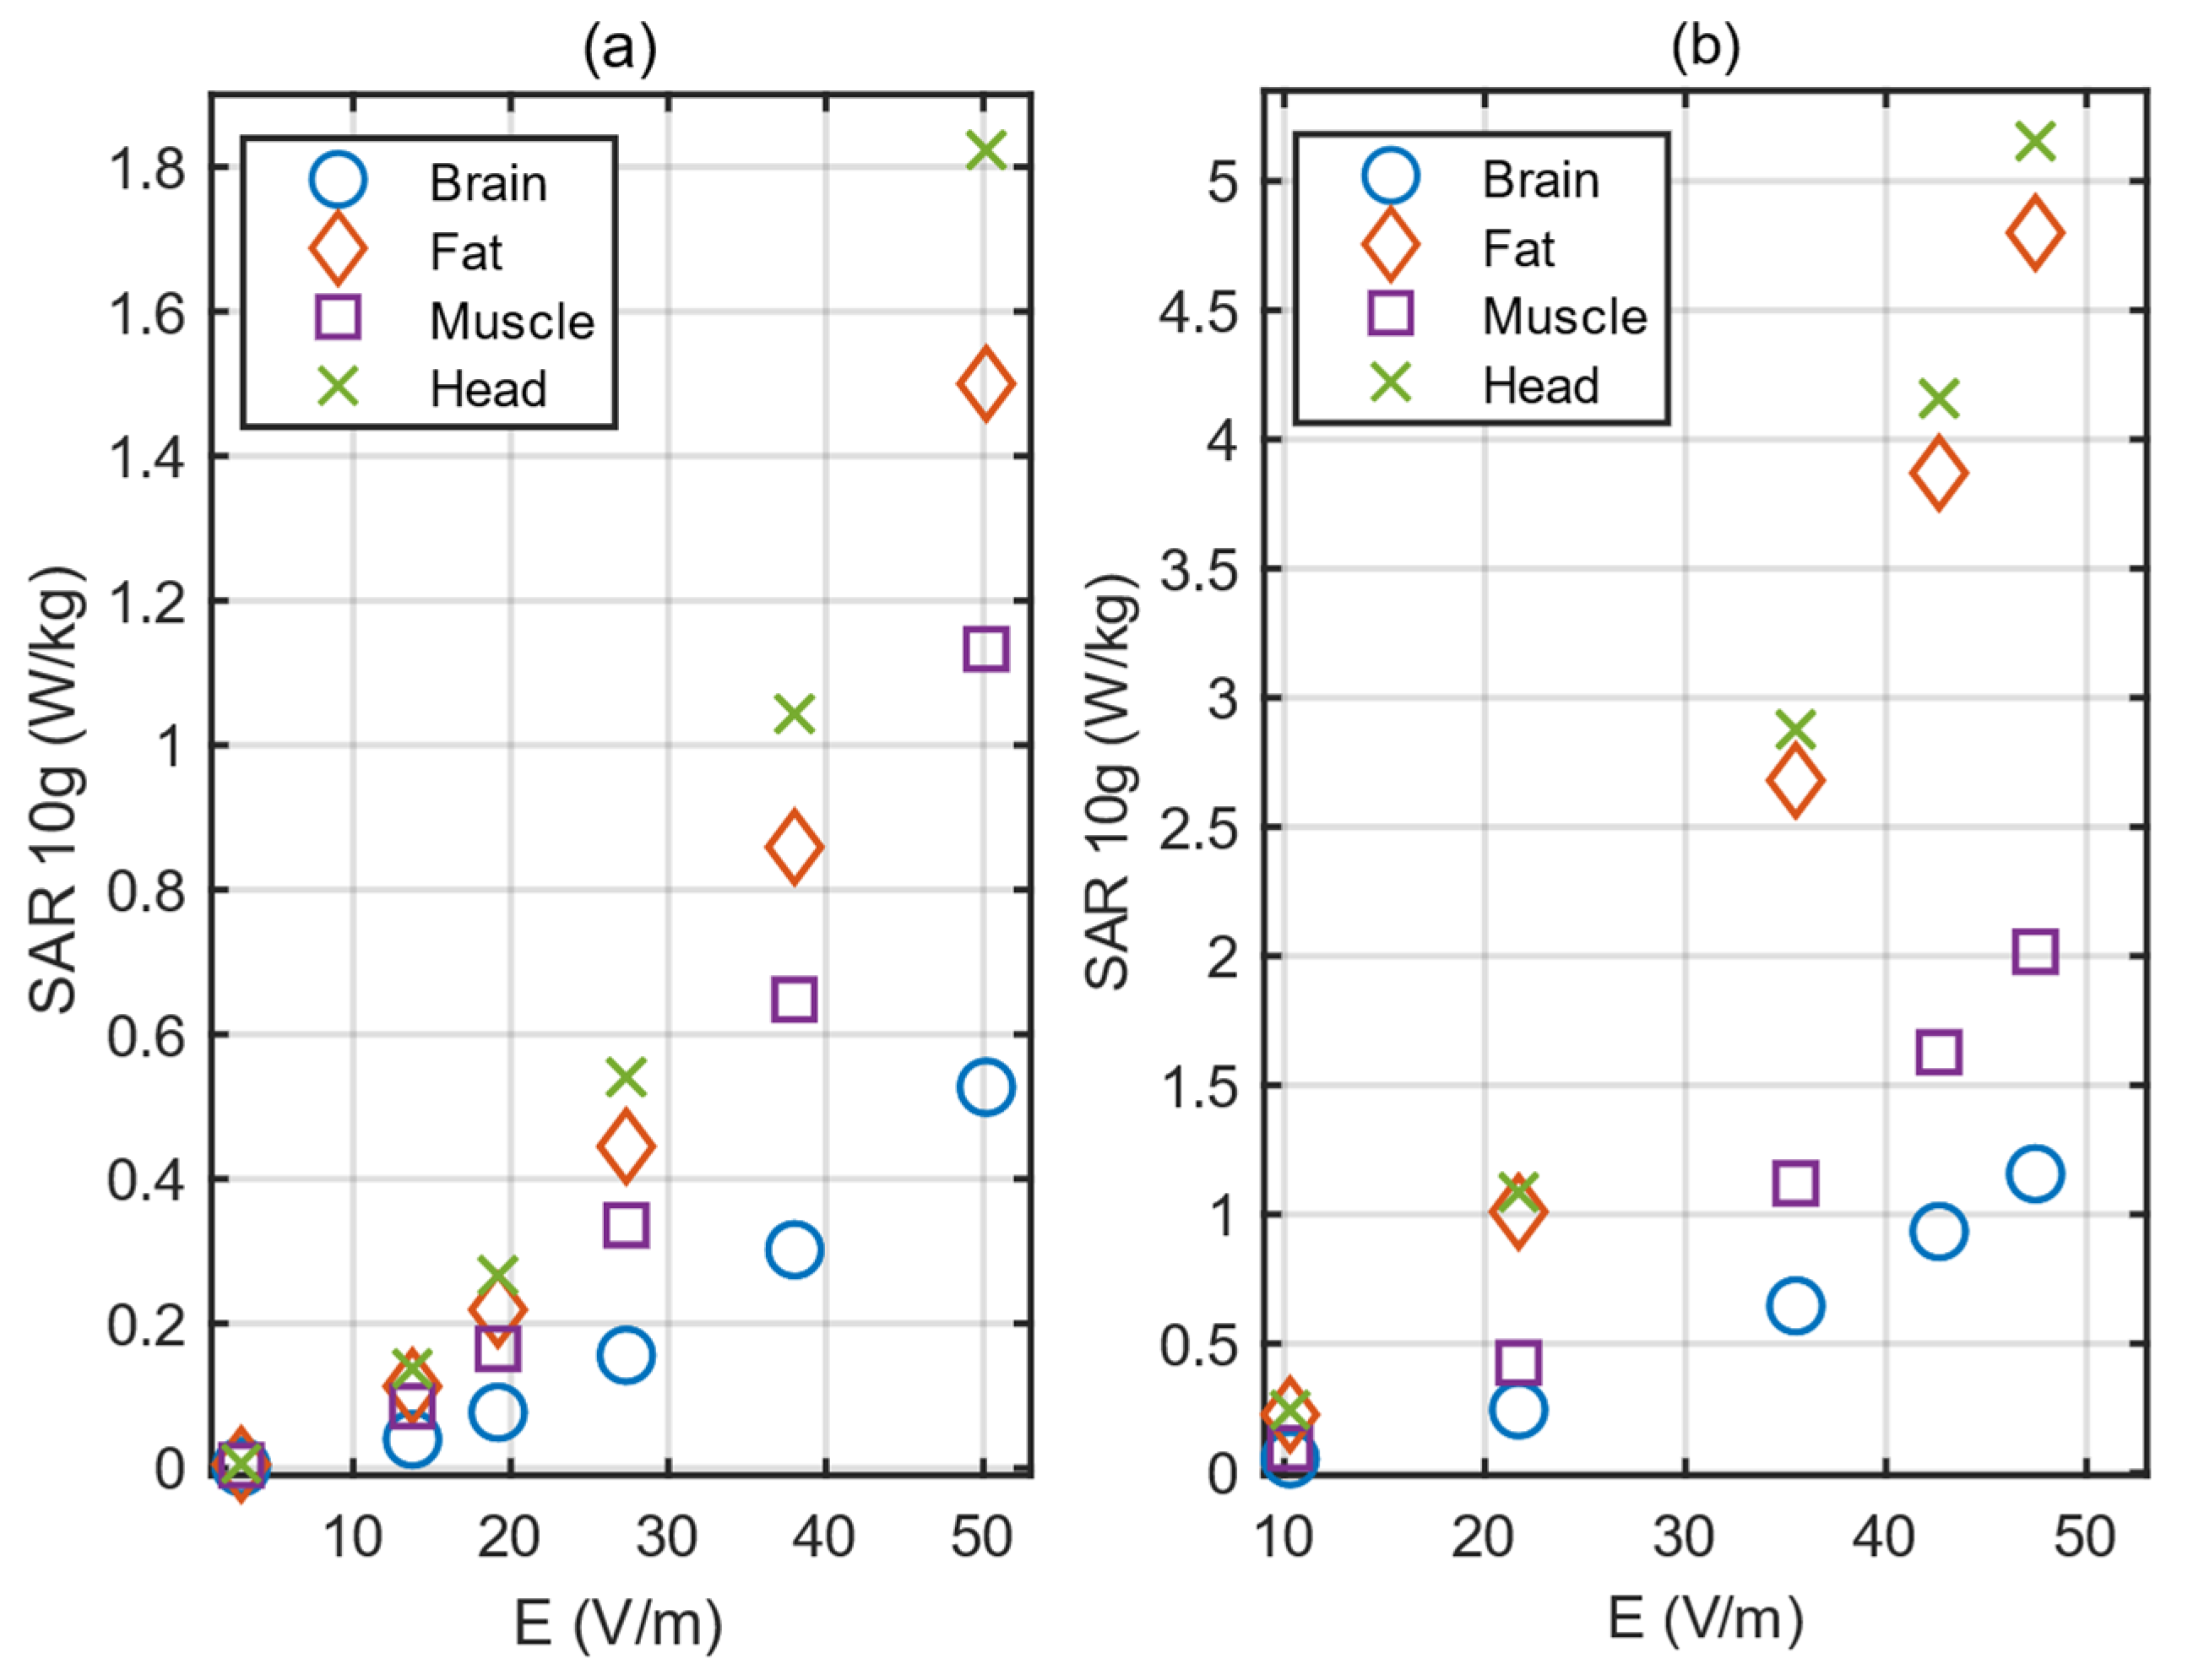
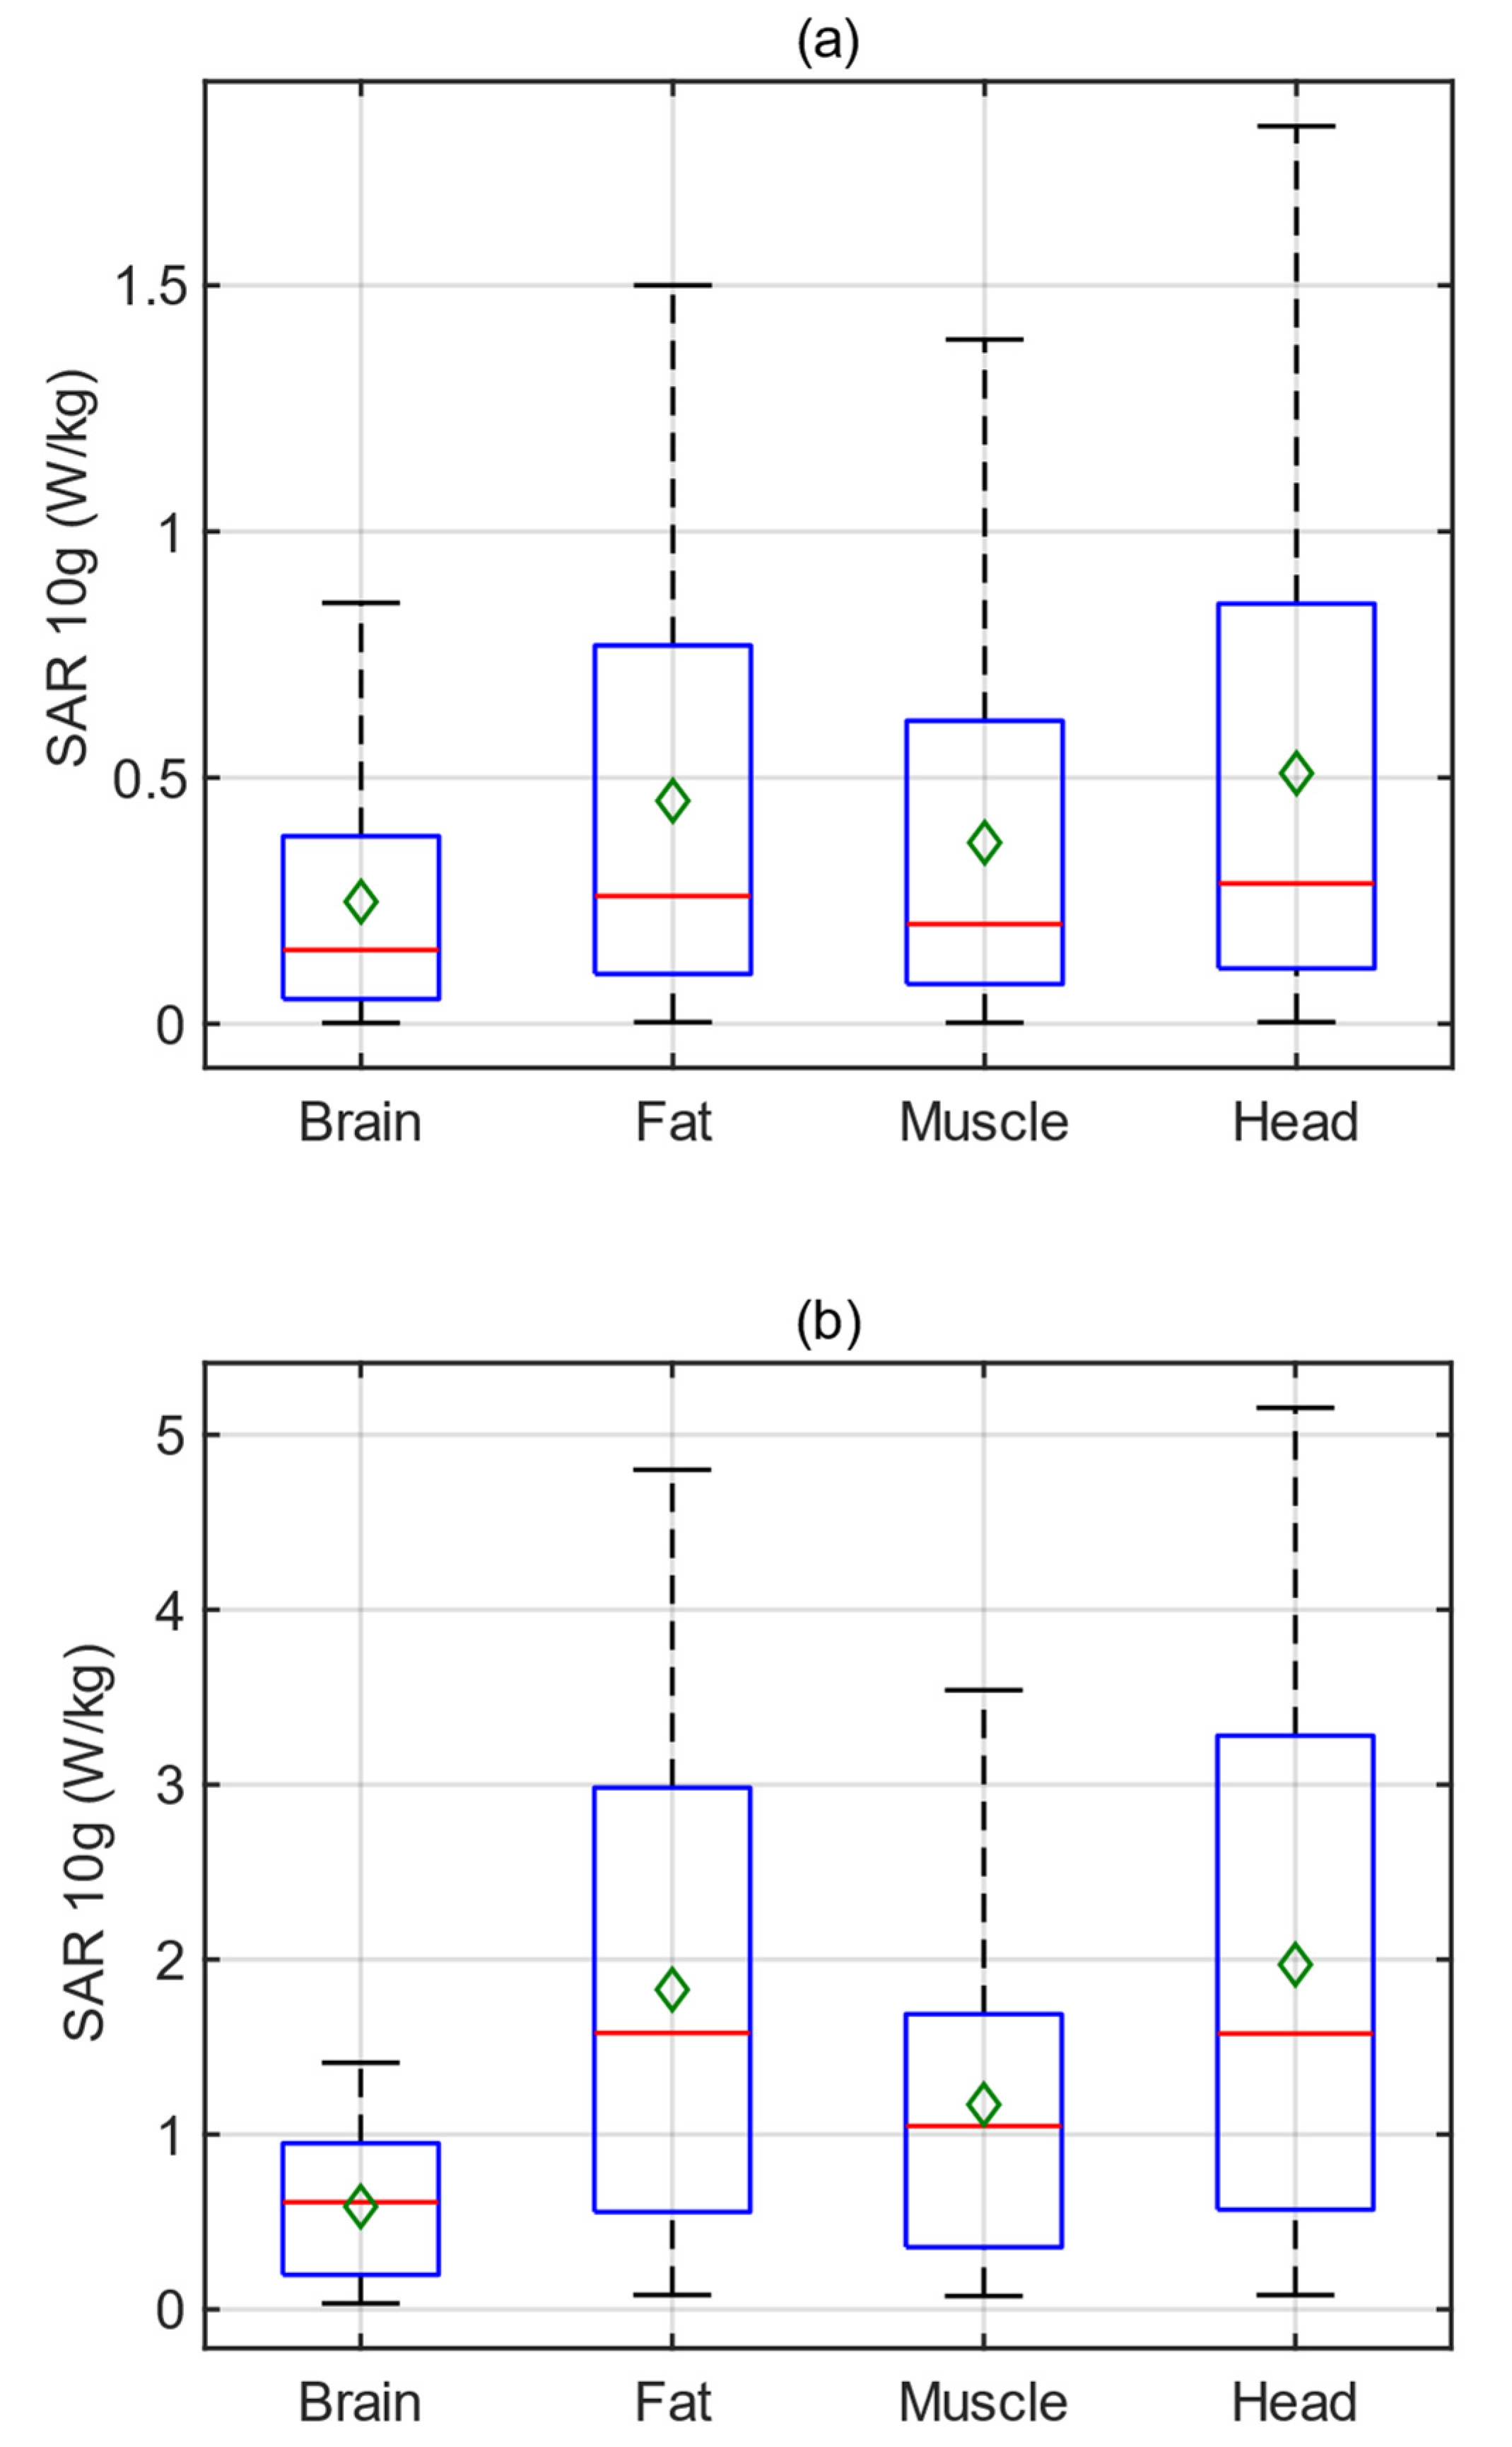
3.3. Simulation Results for Computational Human Models
3.4. Comparison of Results with Existing Studies
3.5. Limitations and Further Studies
4. Conclusions
Author Contributions
Funding
Institutional Review Board Statement
Informed Consent Statement
Data Availability Statement
Acknowledgments
Conflicts of Interest
References
- ICNIRP. Guidelines for limiting exposure to electromagnetic fields (100 kHz to 300 GHz). Health Phys. 2020, 118, 483–524. [Google Scholar] [CrossRef]
- IEEE Std C95.1-2019; Standard for Safety Levels with Respect to Human Exposure to Electric, Magnetic, and Electromagnetic Fields, 0 Hz to 300 GHz. IEEE: Piscataway, NJ, USA, 2019; pp. 1–312.
- Sánchez-Montero, R.; Alén-Cordero, C.; López-Espí, P.L.; Rigelsford, J.M.; Aguilera-Benavente, F.; Alpuente-Hermosilla, J. Long term variations measurement of electromagnetic field exposures in Alcalá de Henares (Spain). Sci. Total Environ. 2017, 598, 657–668. [Google Scholar] [CrossRef]
- Mazloum, T.; Aerts, S.; Joseph, W.; Wiart, J. RF-EMF exposure induced by mobile phones operating in LTE small cells in two different urban cities. Ann. Telecommun. 2018, 74, 35–42. [Google Scholar] [CrossRef]
- Iyare, R.N.; Volskiy, V.; Vandenbosch, G.A.E. Study of the correlation between outdoor and indoor electromagnetic exposure near cellular base stations in Leuven, Belgium. Environ. Res. 2019, 168, 428–438. [Google Scholar] [CrossRef] [PubMed]
- Liu, J.; Wei, M.; Li, H.; Wang, X.; Wang, X.; Shi, S. Measurement and mapping of the electromagnetic radiation in the urban environment. Electromagn. Biol. Med. 2019, 39, 38–43. [Google Scholar] [CrossRef] [PubMed]
- Kurnaz, C.; Mutlu, M. Comprehensive radiofrequency electromagnetic field measurements and assessments: A city center example. Environ. Monit. Assess. 2020, 192, 334. [Google Scholar] [CrossRef]
- Kurnaz, C.; Engiz, B.K. Measurement and Evaluation of Electric Field Strength in Samsun City Center. Int. J. Appl. Math. Elec. (IJAMEC) 2016, 2016, 24–29. [Google Scholar] [CrossRef]
- Stankovic, V.; Jovanovic, D.; Krstic, D.; Cvetkovic, N. Electric Field Distribution and SAR in Human Head from Mobile Phones. In Proceedings of the 2015 9th International Symposium on Advanced Topics in Electrical Engineering (ATEE), Bucharest, Romania, 7–9 May 2015; pp. 392–397. [Google Scholar]
- Stanković, V.; Jovanović, D.; Krstić, D.; Marković, V.; Cvetković, N. Temperature distribution and Specific Absorption Rate inside a child’s head. Int. J. Heat Mass Transf. 2017, 104, 559–565. [Google Scholar] [CrossRef]
- Martínez-Búrdalo, M.; Martín, A.; Anguiano, M.; Villar, R. Comparison of FDTD-calculated specific absorption rate in adults and children when using a mobile phone at 900 and 1800 MHz. Phys. Med. Biol. 2004, 49, 345–354. [Google Scholar] [CrossRef]
- Christ, A.; Gosselin, M.C.; Christopoulou, M.; Kühn, S.; Kuster, N. Age-dependent tissue-specific exposure of cell phone users. Phys. Med. Biol. 2010, 55, 1767–1783. [Google Scholar] [CrossRef]
- Wiart, J.; Hadjem, A.; Wong, M.F.; Bloch, I. Analysis of RF exposure in the head tissues of children and adults. Phys. Med. Biol. 2008, 53, 3681–3695. [Google Scholar] [CrossRef]
- Bhargava, D.; Leeprechanon, N.; Rattanadecho, P.; Wessapan, T. Specific absorption rate and temperature elevation in the human head due to overexposure to mobile phone radiation with different usage patterns. Int. J. Heat Mass Transf. 2019, 130, 1178–1188. [Google Scholar] [CrossRef]
- Birks, L.E.; van Wel, L.; Liorni, I.; Pierotti, L.; Guxens, M.; Huss, A.; Foerster, M.; Capstick, M.; Eeftens, M.; El Marroun, H.; et al. Radiofrequency electromagnetic fields from mobile communication: Description of modeled dose in brain regions and the body in European children and adolescents. Environ. Res. 2021, 193, 110505. [Google Scholar] [CrossRef] [PubMed]
- Keshvari, J.; Heikkilä, T. Volume-averaged SAR in adult and child head models when using mobile phones: A computational study with detailed CAD-based models of commercial mobile phones. Prog. Biophys. Mol. Biol. 2011, 107, 439–442. [Google Scholar] [CrossRef]
- Conil, E.; Hadjem, A.; Lacroux, F.; Wong, M.; Wiart, J. Variability analysis of SAR from 20 MHz to 2.4 GHz for different adult and child models using finite-difference time-domain. Phys. Med. Biol. 2008, 53, 1511–1525. [Google Scholar] [CrossRef] [PubMed]
- Turgut, A.; Engiz, B.K. SAR Evaluation Due to Exposure from Base Stations Operating at 900 MHz and 1800 MHz. In Proceedings of the 2018 26th Telecommunications Forum (TELFOR), Belgrade, Serbia, 20–21 November 2018; pp. 420–425. [Google Scholar]
- Psenakova, Z.; Benova, M.; Laukova, T. Investigation of Specific Absorption Rate (SAR) Near Model of Fetus in Uterus. In Proceedings of the 2020 ELEKTRO, Taormina, Italy, 25–28 May 2020; pp. 1–6. [Google Scholar]
- Iyama, T.; Onishi, T.; Sasaki, K.; Nagaoka, T.; Hamada, L.; Watanabe, S. Whole-body average SAR measurement using flat phantoms for radio base station antennas and its applicability to adult and child human models. Ann. Telecommun. 2018, 74, 93–102. [Google Scholar] [CrossRef]
- Foster, K.R.; Chou, C.K. Are children more exposed to radio frequency energy from mobile phones than adults? IEEE Access 2014, 2, 1497–1509. [Google Scholar] [CrossRef]
- Gandhi, O.P. Yes the children are more exposed to radiofrequency energy from mobile telephones than adults. IEEE Access 2015, 3, 985–988. [Google Scholar] [CrossRef]
- Gryz, K.; Zradziński, P.; Karpowicz, J. The role of the location of personal exposimeters on the human body in their use for assessing exposure to the electromagnetic field in the radiofrequency range 98–2450 MHz and compliance analysis: Evaluation by virtual measurements. BioMed Res. Int. 2015, 2015, 272460. [Google Scholar] [CrossRef]
- Rashid, T.B.; Song, H.H. Analysis of biological effects of cell phone radiation on human body using specific absorption rate and thermoregulatory response. Microw. Opt. Technol. Lett. 2019, 61, 1482–1490. [Google Scholar] [CrossRef]
- Zhang, H.H.; Gong, L.F.; Wang, J.; Sha, W.E.; Li, L.; Wang, J.X.; Wang, C. Specific absorption rate assessment of fifth generation mobile phones with specific anthropomorphic mannequin model and high-resolution anatomical head model. Int. J. RF Microw. Comput. Aided Eng. 2022, 32, e23158. [Google Scholar] [CrossRef]
- Christopher, B.; Khandaker, M.U.; Jojo, P.J. Empirical study on specific absorption rate of head tissues due to induced heating of 4G cell phone radiation. Radiat. Phys. Chem. 2021, 178, 108910. [Google Scholar] [CrossRef]
- Seif, F.; Omidi, M.; Bayatiani, M.R.; Ghorbani, M. Measurement and calculation of SAR due to 900 MHz electromagnetic waves. Front. Biomed. Technol. 2021, 9, 38–44. [Google Scholar] [CrossRef]
- Seetharaman, R.; Tharun, M.; Gayathri, S.; Mole, S.S.; Anandan, K. Analysis of specific absorption rate and heat transfer in human head due to mobile phones. Mater. Today Proc. 2022, 51, 2365–2374. [Google Scholar] [CrossRef]
- Seckin, E.; Basar, F.S.; Atmaca, S.; Kaymaz, F.; Suzer, A.; Akar, A.; Sunan, E.; Koyuncu, M. The effect of radiofrequency radiation generated by a Global System for Mobile Communications source on cochlear development in a rat model. J. Laryngol. Otol. 2014, 128, 400–405. [Google Scholar] [CrossRef]
- Information and Communication Technologies Authority, Market Surveillance Laboratory Directorate, SAR Laboratory. Available online: https://pgm.btk.gov.tr/en/laboratory.html (accessed on 28 May 2023).
- IEEE Std 1528-2013 (Revision of IEEE Std 1528-2003); Recommended Practice for Determining the Peak Spatial-Average SPECIFIC Absorption Rate (SAR) in the Human Head from Wireless Communications Devices: Measurement Techniques. IEEE: New York, NY, USA, 2013; pp. 1–500.
- Zankl, M.; Petoussi-Henss, N.; Fill, U.; Regulla, D. The application of voxel phantoms to the internal dosimetry of radionuclides. Radiat. Prot. Dosim. 2003, 105, 539–547. [Google Scholar] [CrossRef]
- Gabriel, S.; Lau, R.W.; Gabriel, C. The dielectric properties of biological tissues: II. Measurements in the frequency range 10 Hz to 20 GHz. Phys. Med. Biol. 1996, 41, 2251–2269. [Google Scholar] [CrossRef]
- Clemens, M.; Weil, T. Discrete electromagnetism with the finite integration technique. Prog. Electromagn. Res. (PIER) 2001, 32, 65–87. [Google Scholar] [CrossRef]
- Wessapan, T.; Rattanadecho, P. Numerical analysis of specific absorption rate and heat transfer in human head subjected to mobile phone radiation: Effects of user age and radiated power. J. Heat Transf. 2012, 134, 121101. [Google Scholar] [CrossRef]
- IEC/IEEE 2017 International Standard 62704-1™; Determining the Peak Spatial-Average Specific Absorption Rate (SAR) in the Human Body from Wireless Communications Devices, 30 MHz to 6 GHz—Part 1: General Requirements for Using the Finite-Difference Time-Domain (FDTD) Method for SAR Calculations. IEEE: Piscataway, NJ, USA, 2017.


| Ref. | Human Model | Parts/Organs/Tissues | Frequency (MHz) | Key Highlights |
|---|---|---|---|---|
| [9] | Adult | Head | 900 | SAR and radiation source distance relation |
| [10] | Child | Head | 900 | Relation between SAR and distance from the source of radiation |
| [11] | Adult, child | Head/eye | 900, 1800 | Head size and SAR relation |
| [12] | Adult (male), child (boy, girl) | Head/brain/eye | 900, 1800 | Age dependent-tissue specific exposure differences |
| [13] | Adult (male, female), child | Head/brain | 900, 1800, 2100, 2400 | Comparisons between adults’ and childrens’ SAR distributions |
| [14] | Adult, child | Head/fat/skin/bone/brain/eye | 900 | Effect of overexposure as well as age and radiated power on the SAR |
| [15] | Adult, child | Head/whole body | 800, 900, 1800, 2100 | Modeling daily RF dose in brain regions and the whole body in children and adolescents |
| [16] | Adult, child | Head | 900, 1747, 1950 | Investigates the SAR difference in the heads of children and adults using realistic EMF sources |
| [17] | Adult, child | Whole body/head/torso | 20 to 2400 | Variability analysis of SAR for different body models used in numerical dosimetry studies |
| [18] | Adult | Head | 900, 1800 | SAR evaluation in case of overexposure |
| [19] | Pregnant woman/fetus in uterus | Torso/whole body | 900, 2100, 2450, 2600 | SAR differences of fetus and pregnant woman |
| [20] | Adult, child | Whole body | 788, 3500 | Comparison of SAR measurement procedure results with numerical simulations |
| [23] | Adult | Whole body | 98 to 2450 | Location-based exposure assessment |
| [24] | Adult | Head/torso | 850, 900, 2100, 2600, 5100 | SAR values in different human tissues by varying source-to-antenna distance and radiated powers |
| [25] | Adult/SAM | Head/brain/muscle | 900, 2500, 3500 | SAR assessment for 5G mobile phones through numerical simulations |
| [26] | Adult phantom | Brain/eye/skin | 2300 to 2400 | SAR and thermal change analyses in case of prolonged exposure to mobile phone radiation |
| [27] | Adult | Brain/skin/fat/bone | 900 | SAR and electric field strength assessment in a hospital |
| [28] | Adult | Head/skin/bone | 900, 1800 | SAR comparison for different antenna types and services (e.g., Bluetooth, Wi-Fi) |
| Exposure Scenario | Frequency | Whole Body Average SAR (W/kg) | Local Head/Torso SAR (W/kg) | Local Limb SAR (W/kg) |
|---|---|---|---|---|
| General Public | 100 kHz–6 GHz | 0.08 | 2 | 4 |
| Frequency (MHz) | Relative Permittivity (Real Part) | Relative Permittivity (Imaginary Part) | Conductivity (S/m) | |
|---|---|---|---|---|
| SAR Lab. | 901.95 | 39.77 | 18.53 | 0.93 |
| 1803.20 | 38.30 | 13.87 | 1.39 | |
| CST | 900 | 41.50 | 19.37 | 0.97 |
| 1800 | 40.00 | 13.98 | 1.40 |
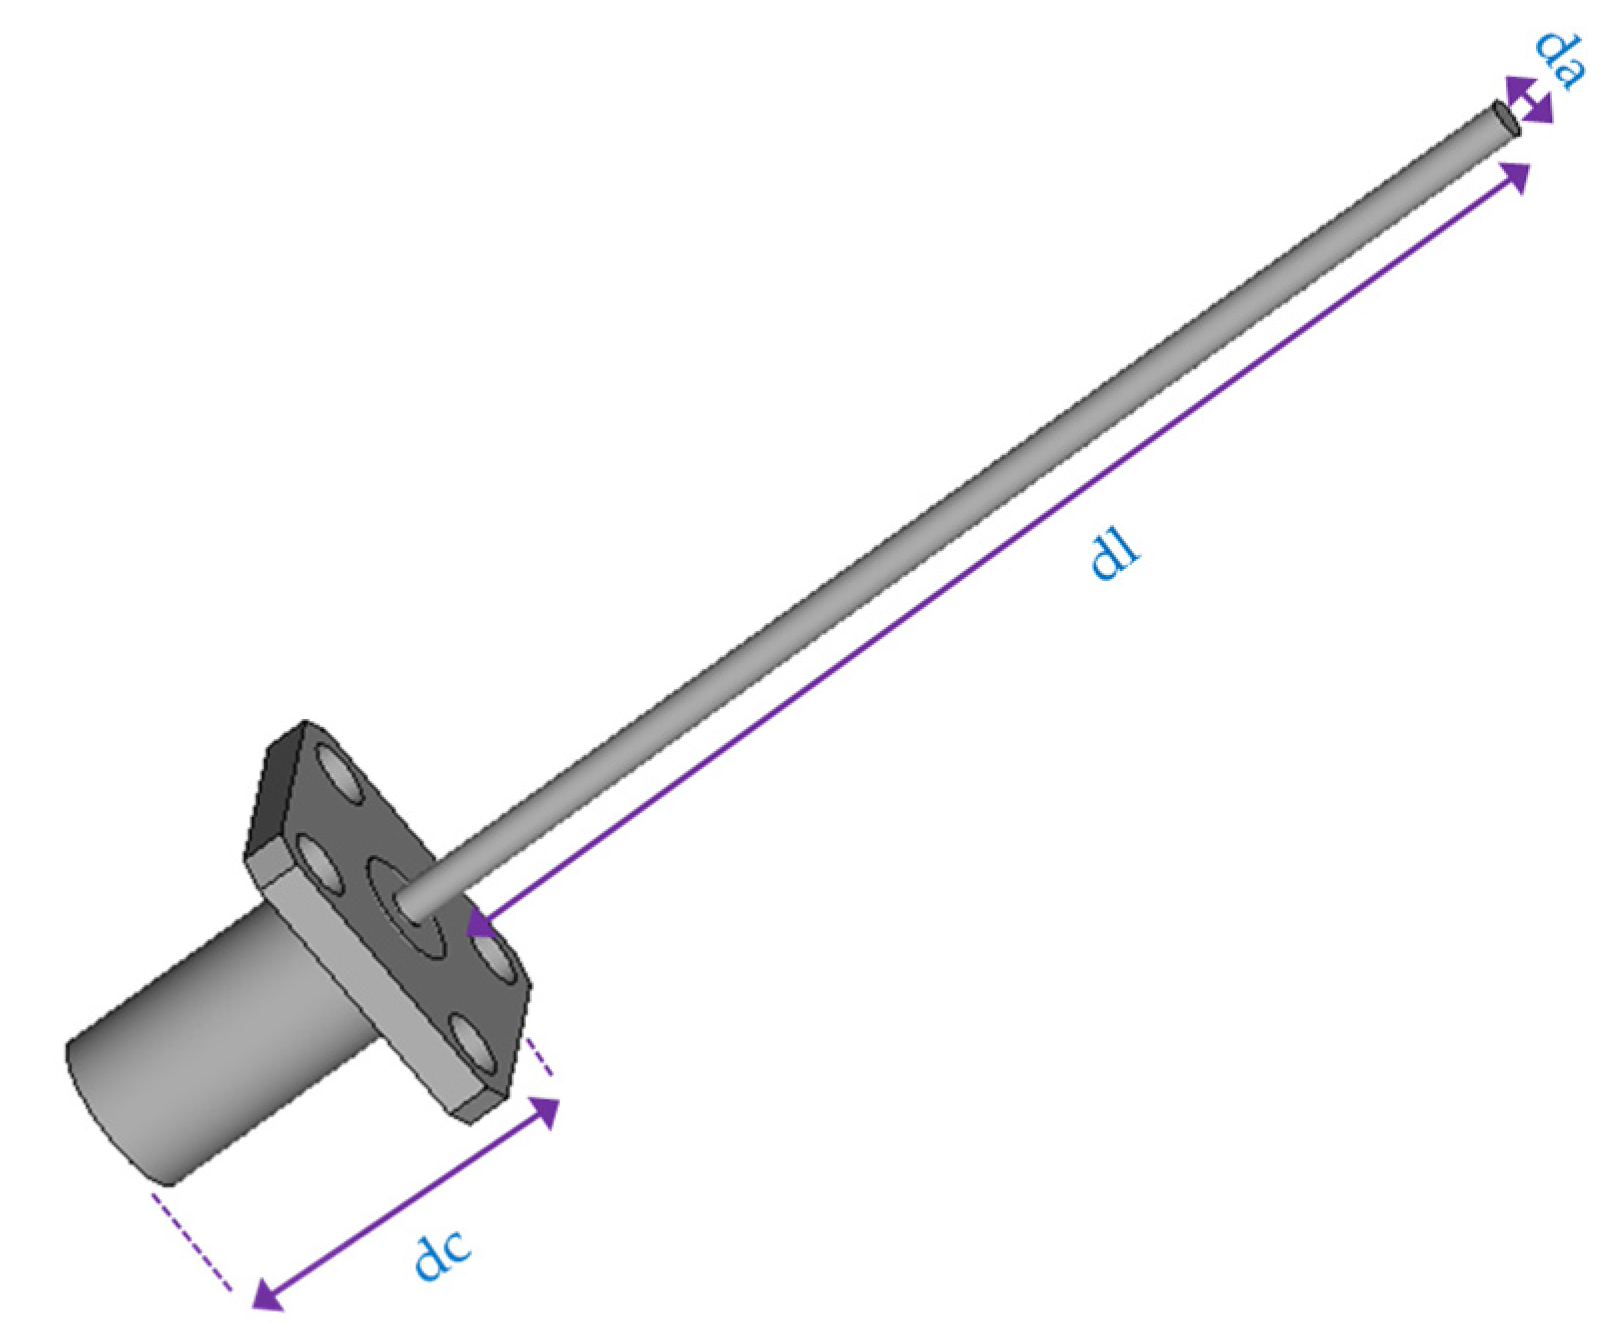
| Frequency (MHz) | Antenna Dimensions (mm) | ||
|---|---|---|---|
| da | dl | dc | |
| 900 | 1.5 | 117 | 12.9 |
| 1800 | 1.5 | 50 | 12.9 |
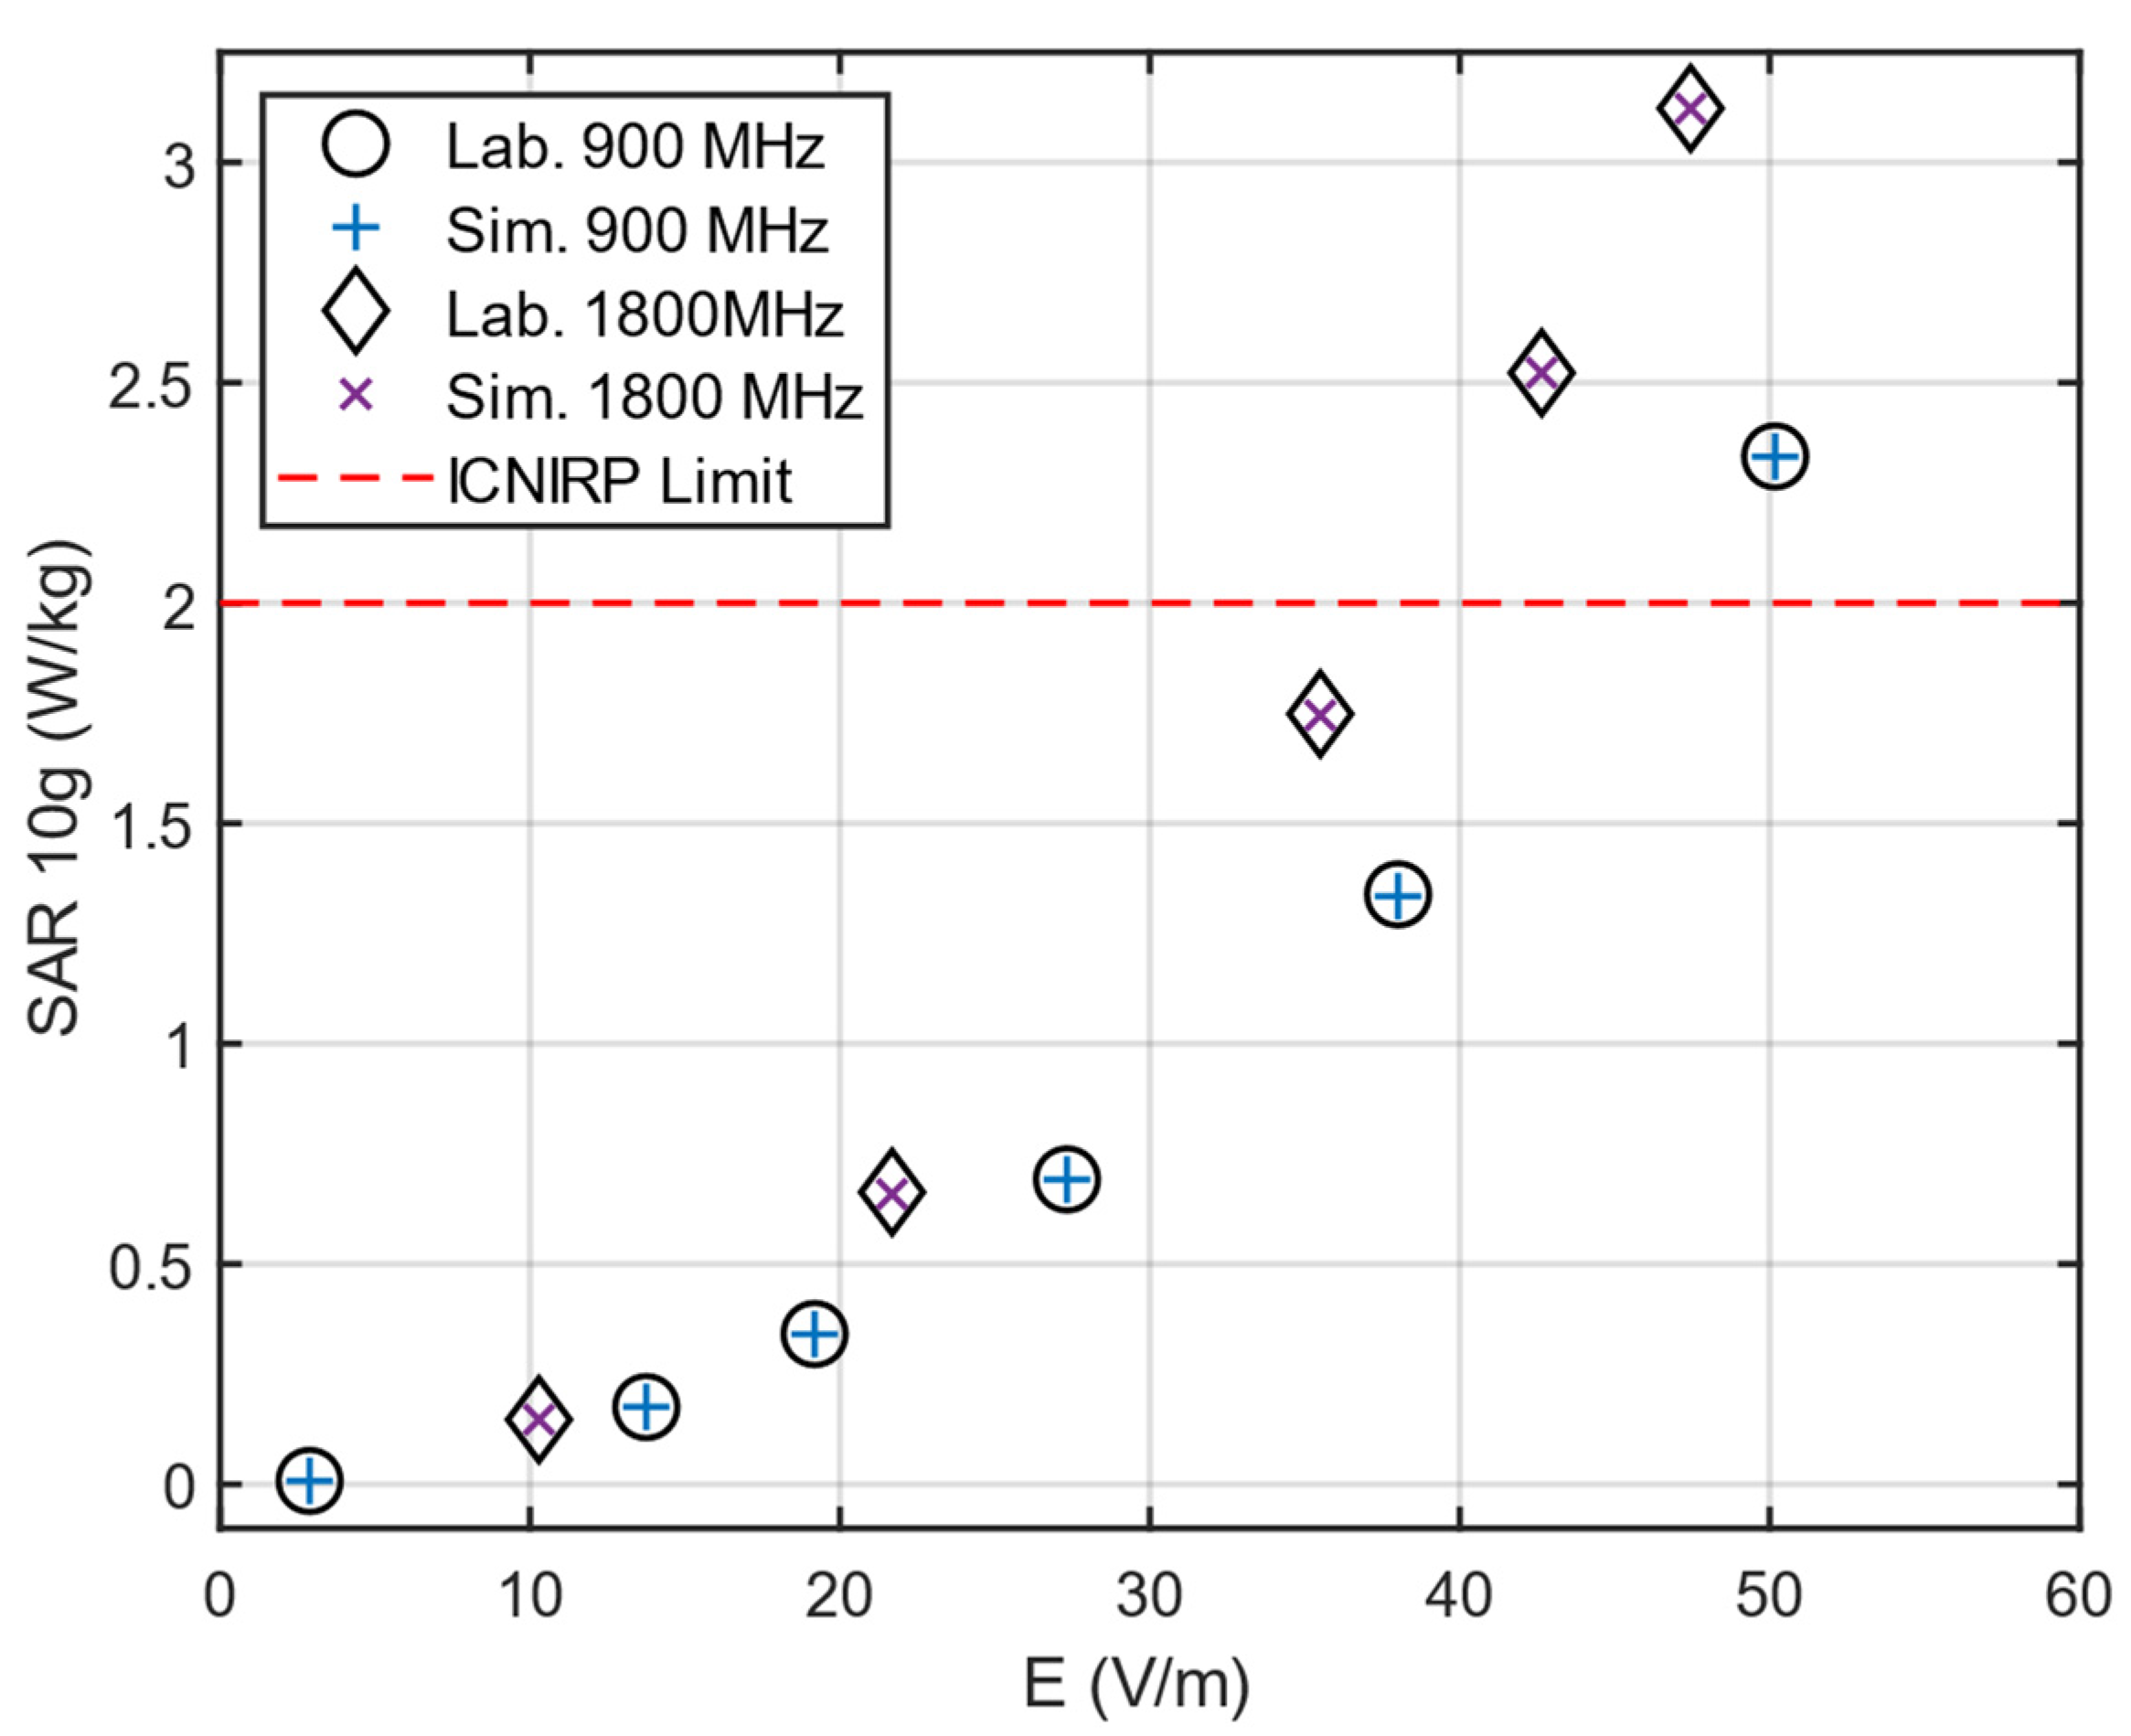
| Frequency (MHz) | 900 | Power (W) | 0.5 | 1 | 1.5 | 2 | 3 | 4 |
| E (V/m) | 2.89 | 13.75 | 19.18 | 27.33 | 38.01 | 50.18 | ||
| SAR 10g (W/kg) | 0.0077 | 0.1752 | 0.3410 | 0.6919 | 1.3386 | 2.3327 | ||
| 1800 | Power (W) | 0.25 | 0.5 | 1 | 1.25 | 1.5 | - | |
| E (V/m) | 10.29 | 21.68 | 35.50 | 42.64 | 47.45 | - | ||
| SAR 10g (W/kg) | 0.1468 | 0.6629 | 1.7483 | 2.5222 | 3.1227 | - |
| Ref. | Year | Frequency (MHz) | Different Ages | Different Tissues | Results |
|---|---|---|---|---|---|
| [11] | 2004 | 900, 1800 | Yes | Yes | The peak SAR decreases with decreasing head size but percentage of the energy absorbed in the brain increases. |
| [13] | 2008 | 900, 1800, 2100, 2400 | Yes | Yes | The maximum SAR 10g in the head models of the adults and children are almost the same, while SAR of brain tissues of child models is higher than that it adults. |
| [17] | 2008 | 20 to 2400 | Yes | Yes | The standard deviation of whole-body averaged SAR of adult models can reach 40%, which proves the variability of adult models. Additionally, the whole-body average SAR of children is over the relevant limits. |
| [12] | 2010 | 900, 1800 | Yes | Yes | Age dependences of dielectric tissue properties do not lead to systematic changes of the peak spatial. However, major age-dependent changes were observed for the exposure of particular tissues. |
| [24] | 2019 | 850, 900, 2100, 2600, 5100 | No | Yes | Regardless of the frequency, if the antenna radiated power is low, temperature increase within the human tissues is low, and hence the SAR. However with the increase in radiated power, SAR also increases, and in the same cases, exceeds the limit in all head tissues. |
| [19] | 2020 | 900, 2100, 2450, 2600 | Yes | No | Based on the near-field exposure results, the SAR values vary for the antenna type and pregnant model type, and for some scenarios the SAR values are not within the limits. |
| [15] | 2021 | 800, 900, 1800, 2100 | Yes | Yes | Adolescents experience higher modeled RF doses in the whole-brain compared with children, while children are exposed to higher RF doses in the whole body. |
| This Study | 2023 | 900, 1800 | Yes | Yes | Frequency, radiated power, gender, age, and tissue type each have an effect on induced SAR levels. Local SAR values exceed the limits under some exposure scenarios. |
Disclaimer/Publisher’s Note: The statements, opinions and data contained in all publications are solely those of the individual author(s) and contributor(s) and not of MDPI and/or the editor(s). MDPI and/or the editor(s) disclaim responsibility for any injury to people or property resulting from any ideas, methods, instructions or products referred to in the content. |
© 2023 by the authors. Licensee MDPI, Basel, Switzerland. This article is an open access article distributed under the terms and conditions of the Creative Commons Attribution (CC BY) license (https://creativecommons.org/licenses/by/4.0/).
Share and Cite
Turgut, A.; Engiz, B.K. Analyzing the SAR in Human Head Tissues under Different Exposure Scenarios. Appl. Sci. 2023, 13, 6971. https://doi.org/10.3390/app13126971
Turgut A, Engiz BK. Analyzing the SAR in Human Head Tissues under Different Exposure Scenarios. Applied Sciences. 2023; 13(12):6971. https://doi.org/10.3390/app13126971
Chicago/Turabian StyleTurgut, Ahmet, and Begum Korunur Engiz. 2023. "Analyzing the SAR in Human Head Tissues under Different Exposure Scenarios" Applied Sciences 13, no. 12: 6971. https://doi.org/10.3390/app13126971
APA StyleTurgut, A., & Engiz, B. K. (2023). Analyzing the SAR in Human Head Tissues under Different Exposure Scenarios. Applied Sciences, 13(12), 6971. https://doi.org/10.3390/app13126971