Article

Cataclastic Characteristics and Formation Mechanism of Dolomite Rock Mass in Yunnan, China

1
Faculty of Civil Engineering and Mechanics, Kunming University of Science and Technology, Kunming 650504, China
2
Kunming Prospecting Design Institute of China Nonferrous Metals Industry Co., Ltd., Kunming 650051, China
*
Author to whom correspondence should be addressed.
Appl. Sci. 2023, 13(12), 6970; https://doi.org/10.3390/app13126970
Submission received: 10 May 2023 / Revised: 6 June 2023 / Accepted: 7 June 2023 / Published: 9 June 2023

Abstract

:
The dolomite rock mass on the slope of the Yanhe domestic waste incineration power plant was used as the research object. The macro- and micro-structural characteristics of intact rock blocks and rock discontinuities were analyzed qualitatively and quantitatively using in-hole television, wave velocity testing, three-dimensional laser scanning techniques, photogrammetry, image processing techniques, and scanning electron microscopy (SEM). The study shows that the degree of fracturing generally decreases with depth over the exposed borehole depth range, and the rock masses are generally very fractured. The wave velocity of dolomite generally increases with the depth of the borehole, and the integrity of the dolomite is either broken or extremely broken. The excavation profile reveals six sets of discontinuities and joints that are straight, smooth, interconnected, and largely unfilled. The angles of the structural bodies of different grain sizes are sharp, with roundness being angular and sharp-angled. The smaller the blocks, the more complex the surface morphology. SEM observations show that the ultramicroscopic fractures are not flat and smooth, and the fractures are folded. Fracturing mainly occurs along intercrystalline and crystal interfaces. These fracture features suggest that the fracturing of dolomite is mainly related to the original sedimentary construction and tectonism.

1. Introduction

Rock structure refers to the nature and distribution of structural features within the rock mass, reflecting the combined arrangement of rock blocks. Rock structure types are generally classified into five categories: monolithic structure, block structure, laminated structure, fractured structure, and loosened structure [1] (pp. 15–16). The fractured structure has poor engineering geological properties, and it will affect slope stability, the safety of foundations of large hydropower stations, and tunnel supporting effect (e.g., Costamagna described induced damage for detachment of small pieces due to preexisting closed joints in a mine drift excavation [2]). This paper focuses on the cataclastic characteristics and formation mechanism of rock mass on a high slope and tries to provide insights into the formation mechanism of dolomite rock mass with dense muddied intercalations and joints. The fracture characteristics are the focus of research on rock structure. It is of great practical engineering significance to evaluate the structural characteristics of the fractured rock mass and the degree of fracturing. Some results have been obtained, most of which have mainly analyzed the structural surface. Ruiz-Carulla et al. [3] analyzed rock fragmentation induced by rock avalanche impacts by comparing the size distribution of in situ blocks on rock wall faces with the size distribution of rock avalanche-broken blocks on slopes. The proposed fractal model can provide a reference for example studies. Some researchers have also used a rock discontinuity mapping method that relies on high-resolution measurement techniques and segmentation algorithms to identify and measure discontinuities under challenging environments. They also investigated the differential technique to calculate their yield [4]. Based on digital borehole camera technology, Han et al. [5] developed a method and principle of calculating the fracture parameters of rock mass using borehole images. They analyzed the calculated dominant strike-dip direction, fracture, hole diameter, and depth distribution. With the development of measurement technology, three-dimensional (3D) laser scanning technology has been widely used to investigate the roughness of joint surfaces [6], strike-dip direction, spacing, trace length, and other parameters [7,8,9,10]. Riquelme et al. [11] also compared the differences between 3D laser scanner and rock structure from motion (SFM) data in investigating the trace length, spacing, strike-dip direction, and joint surface roughness. Liu et al. [12] used numerical simulation to reproduce the progressive process of rock fragmentation in single and double indentations. They concluded that the method would help improve the understanding of rock fragmentation in indentations. Hatzor et al. [13] studied the dynamic stability of fractured rock slopes based on the discontinuous deformation analysis method. Ortlepp [14] and Zhuang et al. [15] studied fractured rock bodies using scanning electron microscopy (SEM), revealing some significant rock fracture features.
The Yanhe domestic waste incineration power plant (YPP) project is located in the southeastern area of Yuxi City, Yunnan Province. The main service area of the power plant is Hongta District, Tonghai County, and Eshan County. According to the initial design plan, the YPP project site forms an excavation slope of approximately 244 m in length and 42.5 m in maximum height on its north side and an excavation slope of approximately 60 m in length and 24 m in maximum height on its east side after grading (Figure 1). During the excavation construction, the slope was destabilized three times. Site investigation concluded that the dolomite rock fragmentation is one of the reasons for the instability of the high slope of the YPP. The structural characteristics of the fractured rock mass affect the design and anchoring effect of anchor rods’ and anchor cables’ slope support. Therefore, this paper uses intra-hole television, wave velocity testing, 3D laser scanning techniques, photogrammetry, image processing techniques, and SEM to investigate the structural characteristics of the rock mass of fractured dolomite qualitatively and quantitatively on this high slope and to explore the mechanism of fracturing to provide a basis for subsequent research.

2. Methods

To comprehensively understand the macroscopic and microscopic structural characteristics of the fractured rock mass of the engineering slope, this study integrates intra-hole television, wave velocity test, 3D laser scanning technology, photogrammetry, image processing technology, and SEM to comprehensively analyze the structural characteristics of the rock mass from both blocks and discontinuities (Figure 2).
The samples used for 3D laser scanning, microscopic and ultramicroscopic observation, and bulk chemical analysis were taken from the studied slope (Figure 1b). A total of 10 bags of samples from 4 sites were collected, each weighing about 30 kg. Five blocks with an equivalent diameter of about 10 cm were prepared for SEM observation. After laboratory sieving, blocks with a size above 20 mm were selected for 3D laser scanning, the particles in the fraction 5–0.16 mm were used for microscopic observation, and the particles in the fraction 60–0.63 mm were used for bulk chemical analysis.

2.1. In-Hole Television

The in-hole television uses special optical imaging technology to mount a camera and a wide-angle lens with automatic aperture adjustment into a waterproof pressure-bearing chamber which is then placed in the hole for 360° observation. The observed images are transmitted via cable to a ground monitor for display. The entire borehole can be observed continuously, and the video images are automatically saved while the measurement is carried out.

2.2. Wave Velocity Test

Wave velocity testing methods include the single-hole, cross-hole, and Rayleigh wave methods. The undulating wave velocity curve of the single-hole method is more evident than that of the cross-hole method. It is more reflective of geological phenomena such as the degree of fracture development and thin interbedded layers in the rock [16]. Therefore, the ground percussion method in the single-hole method was used in this study, and the shear wave source was selected as the vibration source. The shear wave velocity was calculated for each stratum by dividing the stratum from top to bottom (or bottom to top) and the three-component geophone signal received in a vertical borehole.

2.3. 3D Laser Scanning Technology

Various intersecting discontinuities (structural surfaces) widely distributed in the rock mass usually divide the rock mass to form structural bodies of different sizes and shapes [17,18]. These discontinuities within the rock mass, especially the joints within the rock mass, play a crucial and essential role in rock destruction (geometry and distribution of structural bodies) [19]. However, due to the complexity of geological conditions, structural surface exposure is very limited, and one cannot accurately measure the characteristic parameters of structural bodies inside the rock mass often. Bazarnik [20] evaluated the possibility of determining geometrical features using the 3D laser scanning technique. Therefore, in this paper, 20 blocks with a minimum diameter above 20 mm were selected for 3D laser scanning to obtain the point cloud data of the blocks. The point cloud data were imported into Geomagic Wrap 2015 software (2015.0.0.1007) for point cloud data stitching and noise removal processing to obtain the complete point cloud data of the blocks. Then, a series of processes, such as wrapping and mesh doctor or accurate surface, are used to build the 3D surface model. We can obtain the morphological parameters of blocks, such as volume (V), surface area (S), and the lengths of the long axis (la), middle axis (lb), and short axis (lc), from the model. Based on the surface model of the blocks, the best externally cut sphere of the blocks was simulated using Geomagic Wrap 2015 software, and the volume (V2) of the simulated sphere was measured. The blocks’ surface area to volume ratio (S/V), sphericity degree (SD), shape factor (SF), and block volume to simulated volume ratio (V/V2) were calculated based on the above measurements.
(1)
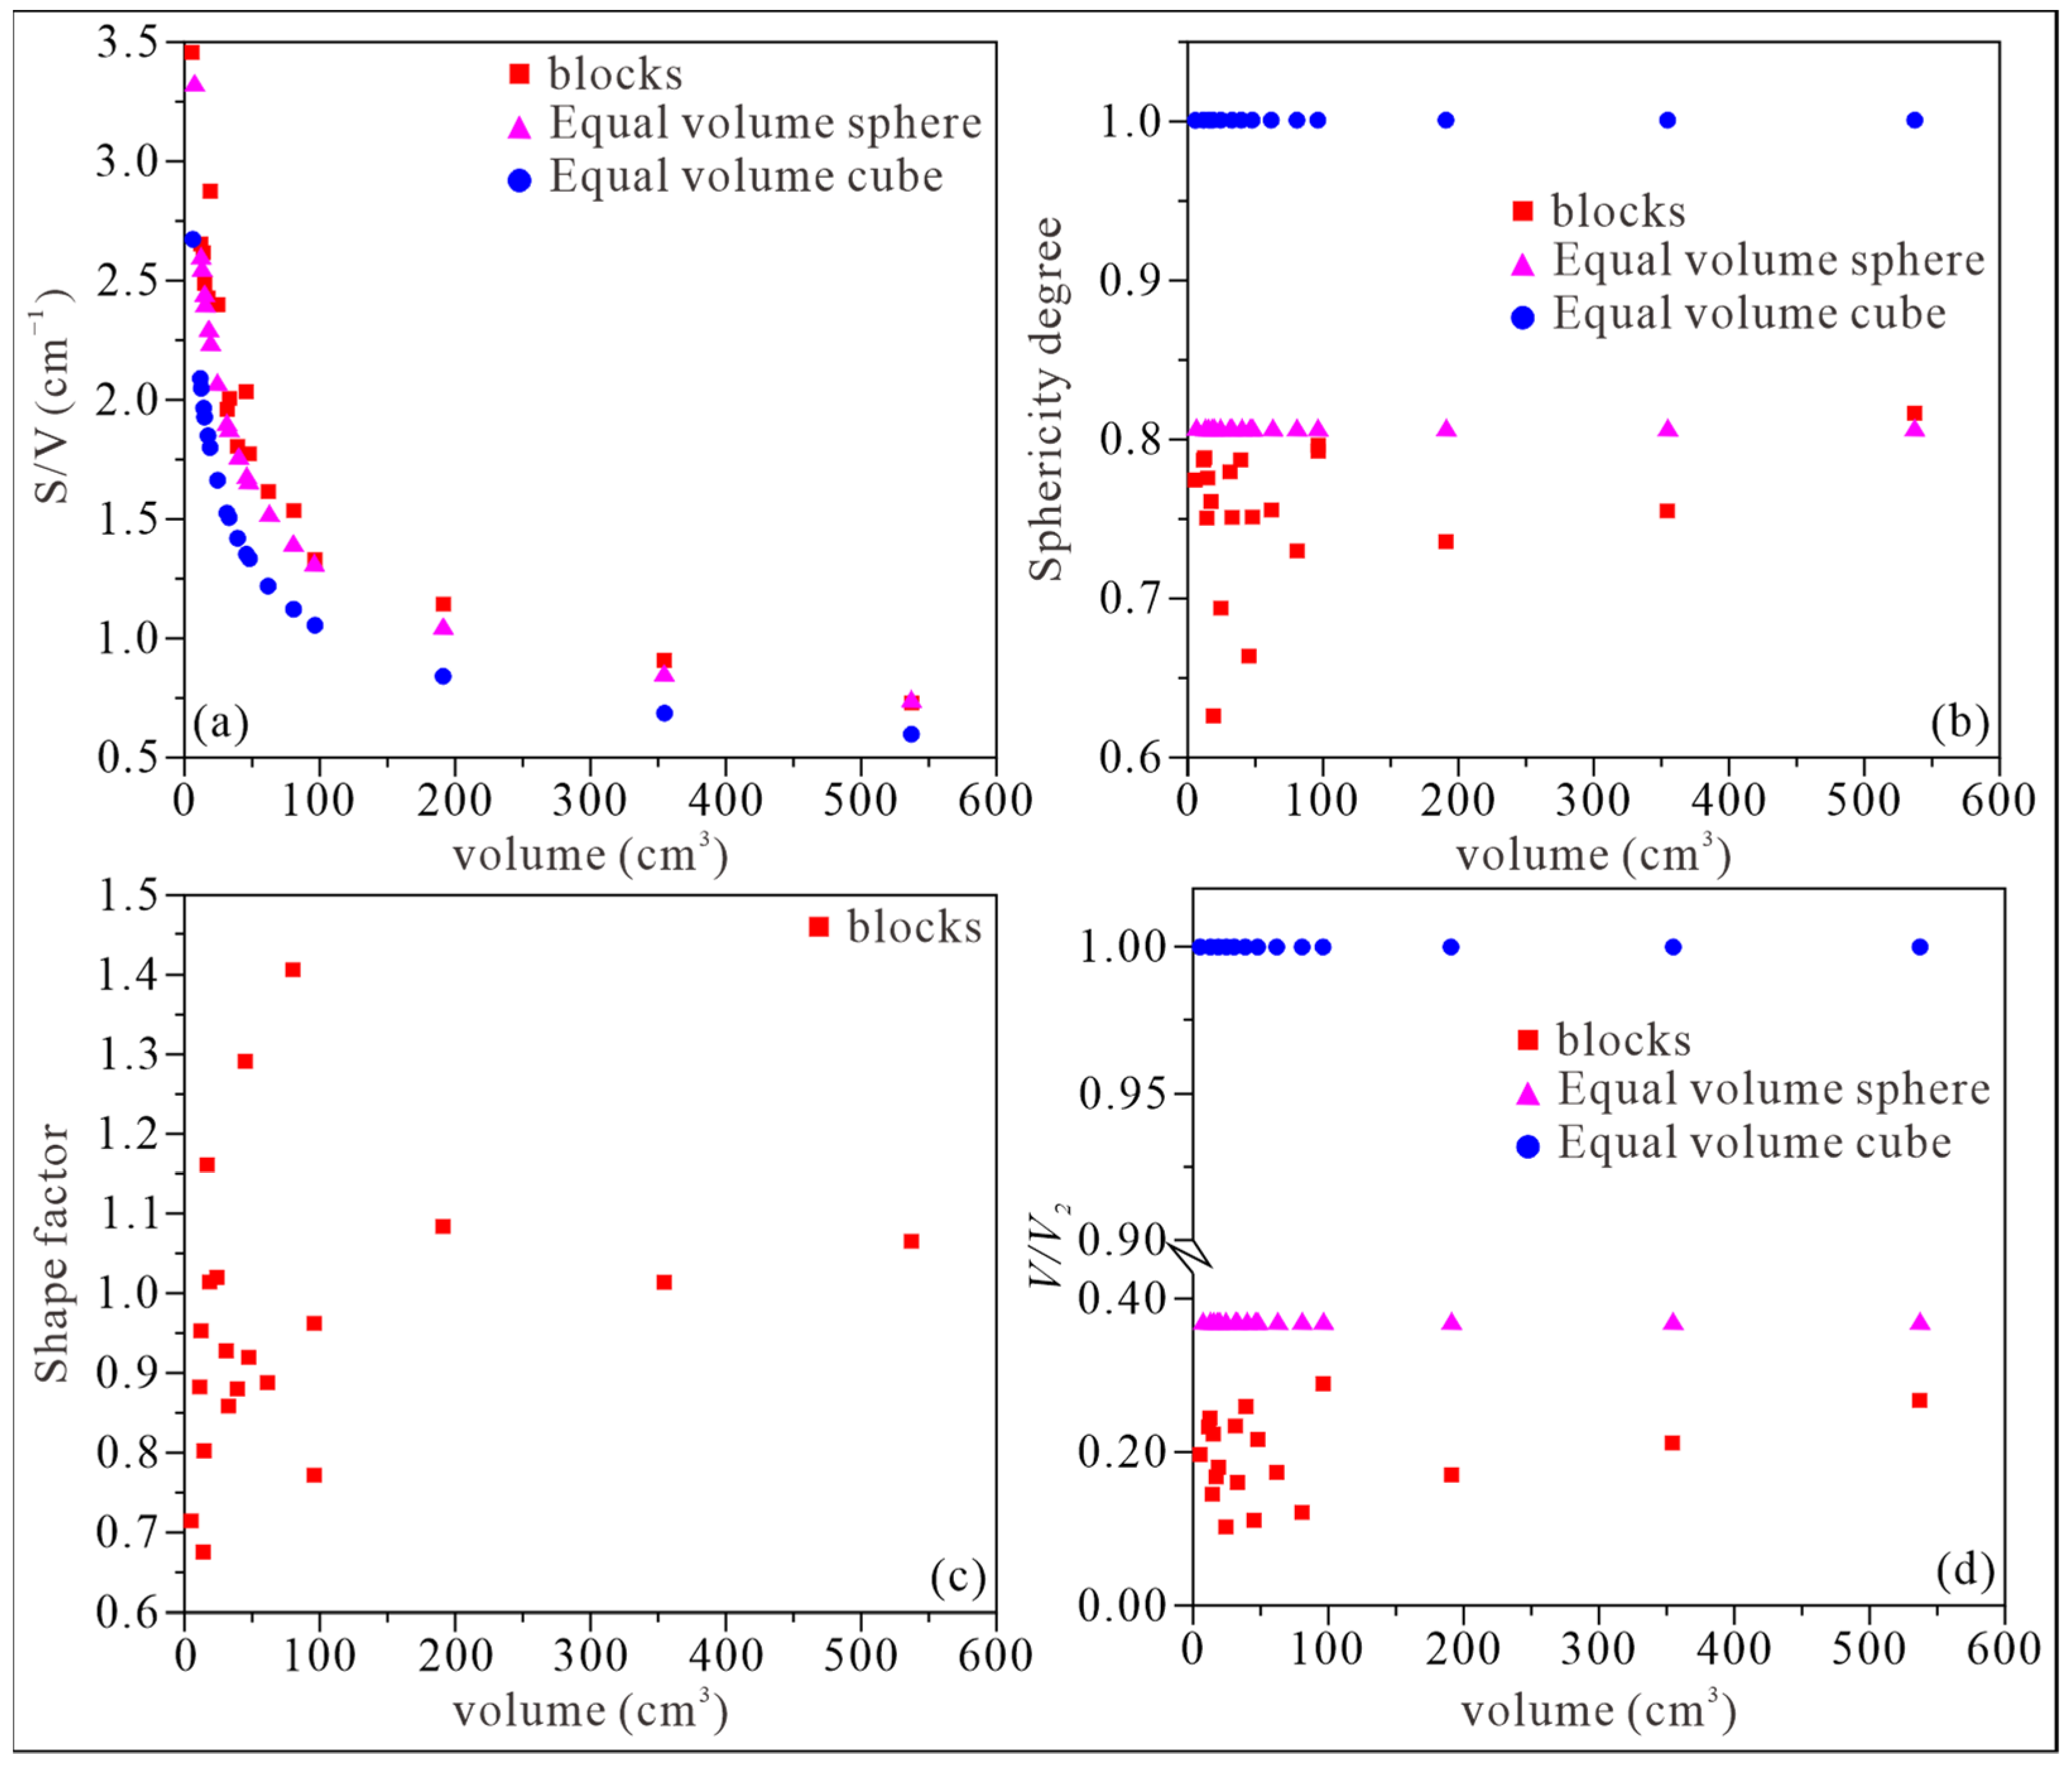
S/V, where S and V are the block’s surface area and volume, respectively. S/V is used to evaluate the complexity of the surface morphology of the blocks; the larger the S/V, the more complex the surface morphology.
(2)
SD is used to evaluate the overall shape characteristics of the blocks, and it is given by:
S D = S 1 S ,
where S is the surface area of the block and S1 is the surface area of the same volume of the sphere of the blocks ( S 1 = 36 π V 2 3 ).
(3)
SF is used to evaluate the pin-like properties of the blocks, reflecting the near pin-like, lamellar, or sub-rectangular shape of the blocks, and it is given by:
S F = l a l c / l b 2 ,
where la, lb, and lc are the lengths of the long axis, middle axis, and short axis, respectively.
(4)
V/V2, where V is the block volume, and V2 is the simulated volume of the best externally cut sphere of the blocks. V/V2 is used to evaluate the overall angular characteristics of the blocks; the smaller the V/V2, the more significant the block’s angularity.
(5)
Flatness ratio (FR) and elongation ratio (ER): FR is defined as the ratio of the shortest dimension to the intermediate dimension (dS/dI). ER is defined as the ratio of the intermediate dimension to the largest dimension (dI/dL) [21,22,23].

2.4. Photogrammetry

A scale bar is placed on the slope excavation profile, and a photograph is taken of the vertical profile with a digital camera. Then, a sketch of the discontinuities is made on the photograph, and the discontinuities’ features are analyzed.

2.5. Image Processing Technology

This paper used the Particles (Pores) and Cracks Analysis System (PCAS) for image processing of blocks with particle sizes ranging from 5 to 60 mm. The processing process was as follows: (1) randomly place the blocks on a background plate of known size with the blocks separated from each other; then, take a picture with a digital camera with a vertical background plate (lens parallel to the background plate), and use Adobe Photoshop CS6 to geometrically correct, distort, and crop the image to obtain a corrected image; (2) use the magic wand tool of Adobe Photoshop CS6 to adjust the image background plate to white; (3) binarize and de-clutter the image with PCAS to obtain the binarized image; (4) perform block identification to obtain the basic and statistical parameters of the two-dimensional geometric form of the blocks.
This study focused on the analysis of the following geometric parameters of the blocks: area (S), perimeter (C), length (L), width (W), form factor (ff), and fractal dimension of the morphology (D). The length and width are the maximum and minimum Feret diameters, respectively.
The form factor (ff) can be calculated from the perimeter and area as follows:
f f = 4 π S t / C t 2 ,
where St and Ct are the area and perimeter of blocks, respectively.
To essentially reveal the complexity of rock block features, the correlation between the area and perimeter of a block was used to quantitatively evaluate the self-similar fractal structural features of the block. The fitted relationship between the area (St) and the perimeter (Ct) of the block is given by:
lg C t = D / 2 × lg S t + A ,
where A is a constant and D is the fractal dimension of the morphology. The value of D ranges from 1 to 2. The larger the D, the more complex the block and the greater the degree of deviation of the morphology of the block from the smooth surface.

2.6. SEM

To further investigate the fracture characteristics of the dolomite rock mass, the microscopic and ultramicroscopic fracture characteristics of the rock mass were observed by SEM.

3. Results and Discussion

3.1. Macroscopic Fracture Characteristics of Rock Mass

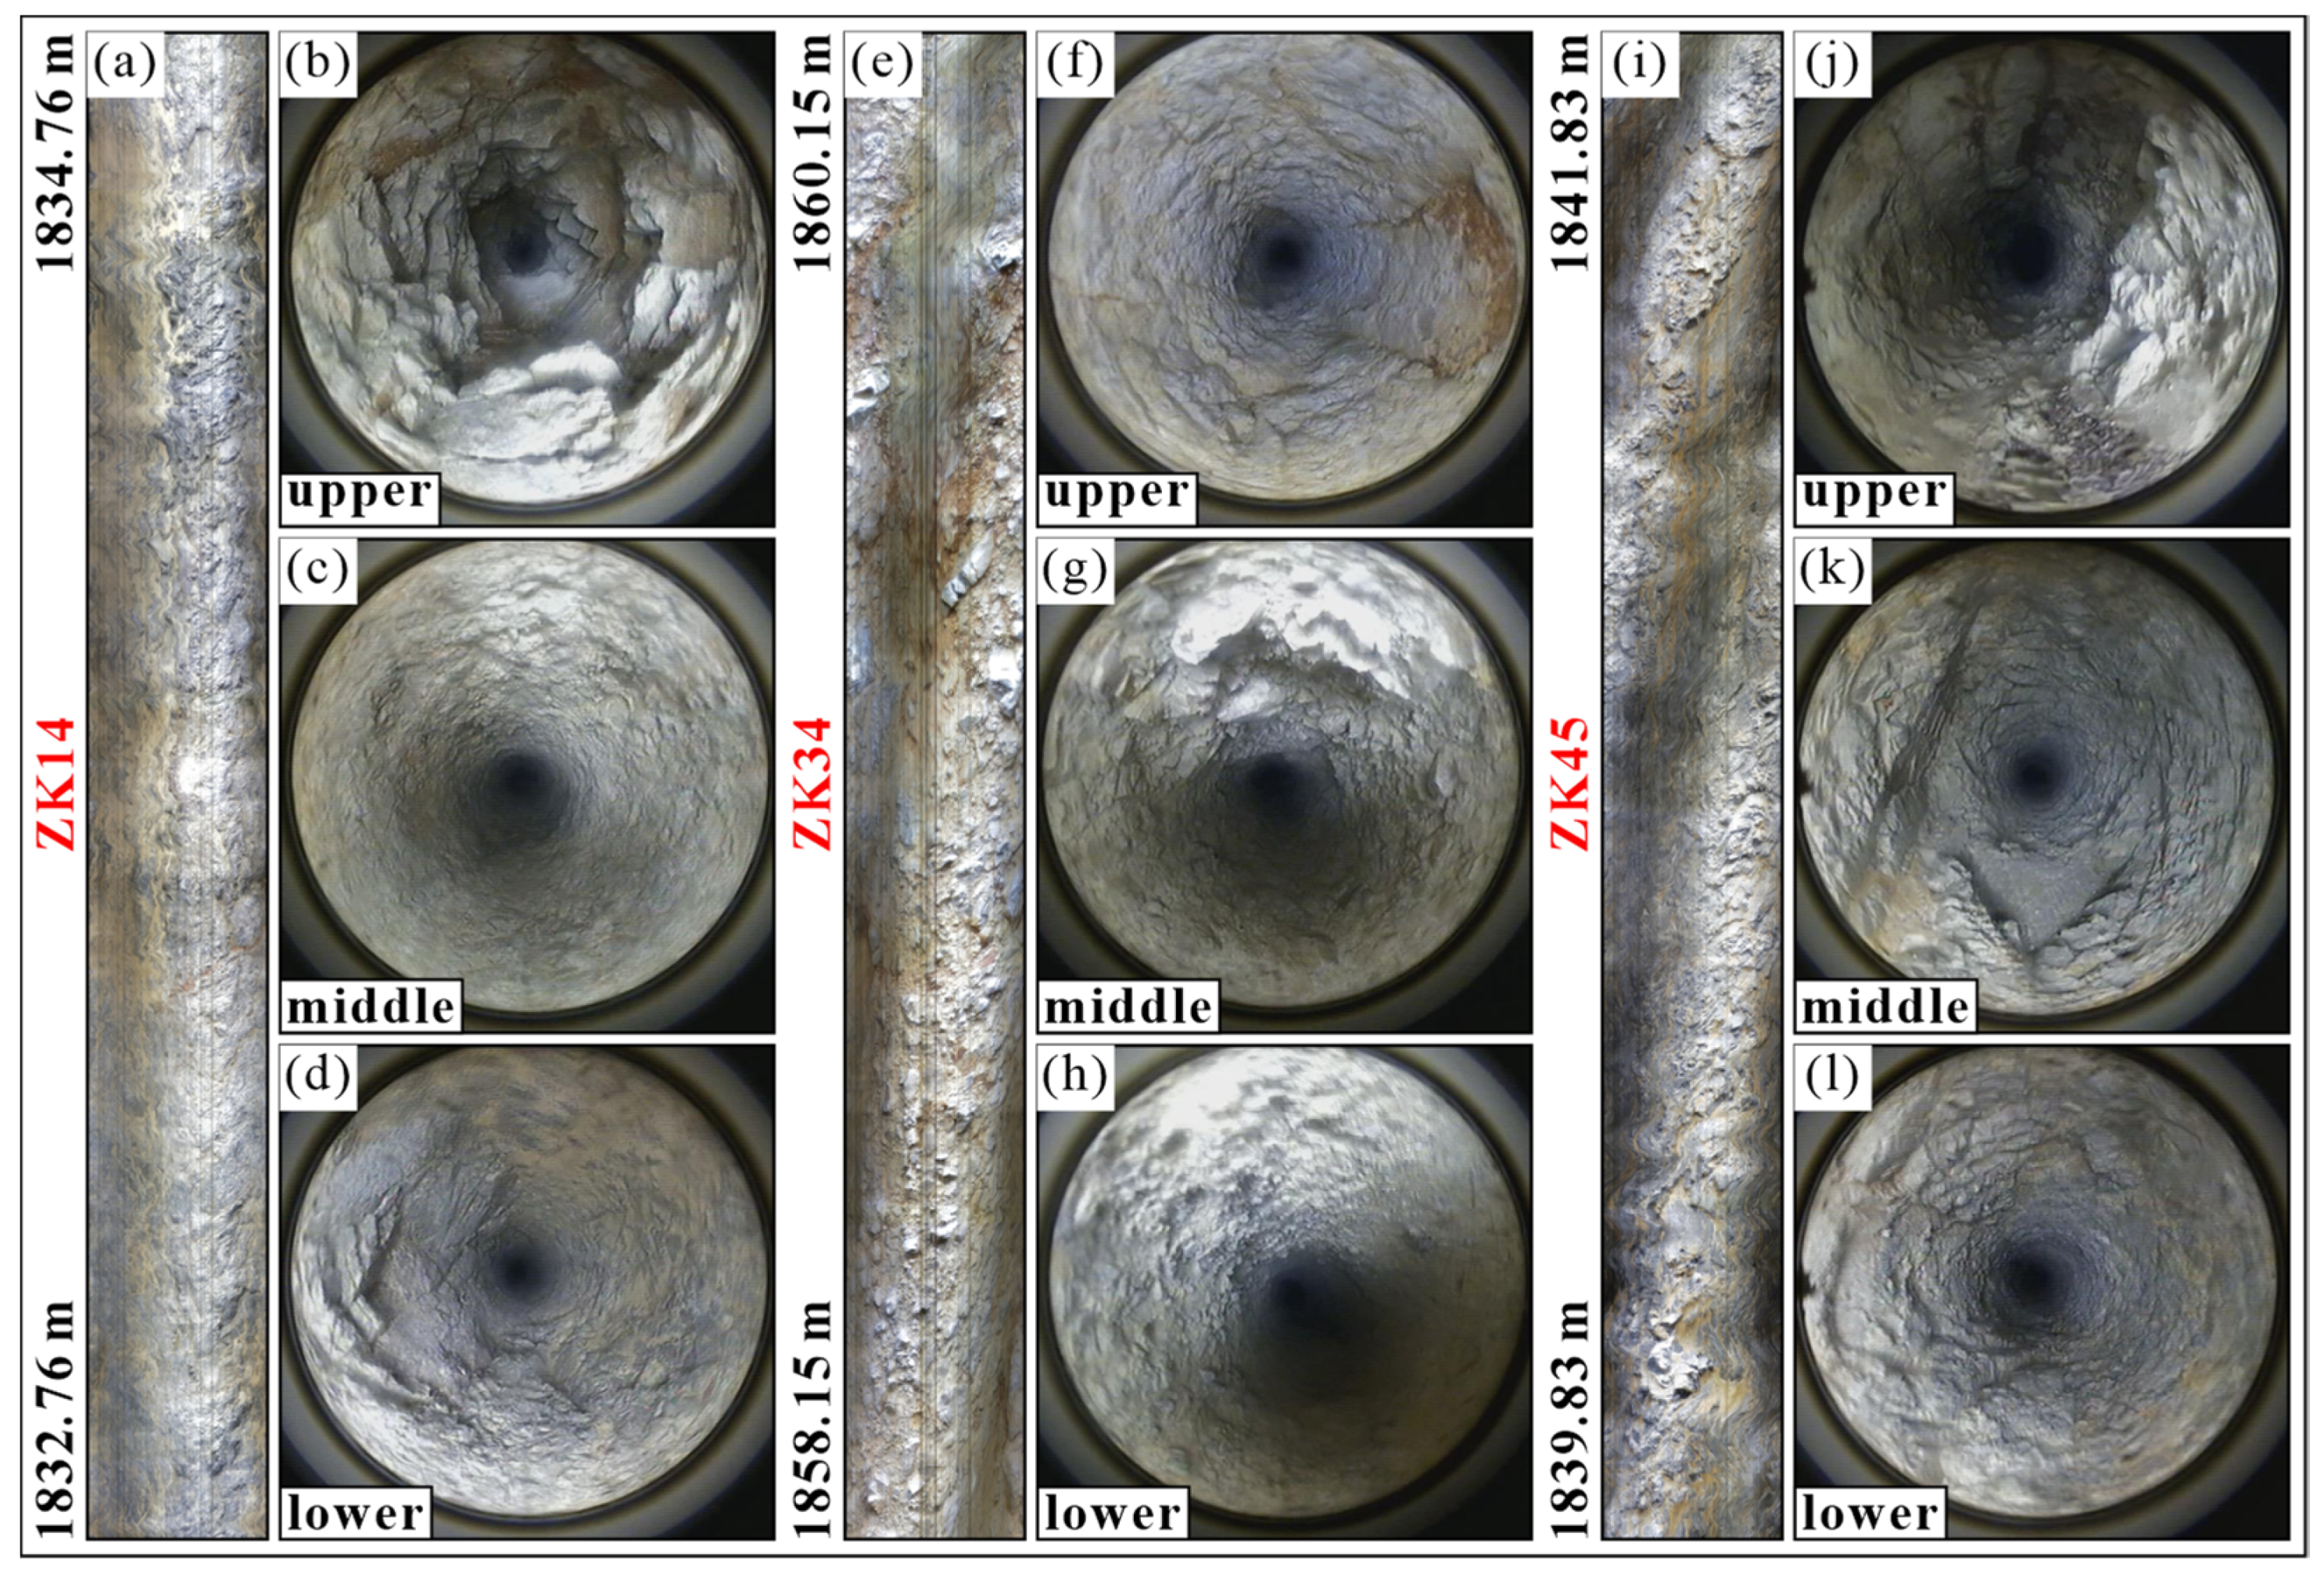
3.1.1. In-Hole Television Image Analysis

The borehole walls are very rough and the rock masses are very fractured (Figure 3), a stark difference from the borehole walls of monolithic, massive, and laminated rock masses. In-hole television images of the upper, middle, and lower portions of the borehole (Figure 1) more clearly demonstrate the fragmentation of the rock mass, indicating that the rock mass is very fractured throughout the depth range of the borehole exposures. According to GB 50287 (2016) [24], fractured rock masses are classified as block-fractured structures, fractured structures, fragmented structures, and clastic structures (sandy structures) according to the degree of fragmentation. The degree of fragmentation decreases with increasing depth, but localized differential fragmentation also occurs. The upper wall of most boreholes is significantly rougher than the lower wall, which should be related to the degree of fracturing and relaxation of the rock mass. Excavation unloading increases the degree of relaxation of the near-surface fractured rock mass which disturbs the rock mass near the hole wall more strongly during the drilling process and makes the hole prone to local collapse, resulting in a rougher wall surface.
Most of the drilling cores are fragmented and fractured (Figure 4), with rock quality designation (RQD) values essentially zero and a basic rock quality grade of V. At the same time, some are block fractured, with RQD values less than 10% and a basic rock quality grade of IV.

3.1.2. Analysis of Borehole Shear Wave Velocity

The shear wave velocity of the filled soil was 126 m/s, and the wave velocity of the dolomite ranged from 333 m/s to 352 m/s in borehole ZK01 (Figure 5a). In comparison, the shear wave velocity of the filled soil was 119 m/s, and the wave velocity of the dolomite ranged from 339 m/s to 411 m/s in borehole ZK13 (Figure 5b). The wave velocity increased with depth. The wave velocities of the dolomite ranged from 385 m/s to 415 m/s in borehole ZK28, with wave velocities generally increasing with depth and locally decreasing (Figure 5c). In general, the wave velocity of the dolomite body increases with depth, but the increase is very small, with a local tendency to decrease.
The shear wave velocities of dolomite rocks on the high slopes of the YPP range from 333 m/s to 415 m/s. A reference to the types of soils and their shear wave velocity range values is provided in the GB 50011 (2010) [25] (broken and more broken rocks or soft and softer rocks; dense gravelly soils with shear wave velocities between 500 m/s and 800 m/s; medium-dense and slightly dense gravelly soils, dense, medium-dense gravel, coarse and medium sands with shear wave velocity between 250 m/s and 500 m/s). The reference values are provided in the Geological Engineering Handbook [1] (p. 315) (shear wave velocity greater than 500 m/s for rocks, 350–500 m/s for weathered rocks, 300–600 m/s for coarse gravel, and 240–350 m/s for gravel sands). Considering the borehole cores (Figure 4) and the shear wave velocity of dolomite on the YPP’s high slopes, the degree of integrity of the dolomite rock mass on the high slope of the waste incineration power plant is considered to be broken and very broken according to the reference values in the GB 50011 (2010) [25] and Geological Engineering Handbook [1] (p. 315).

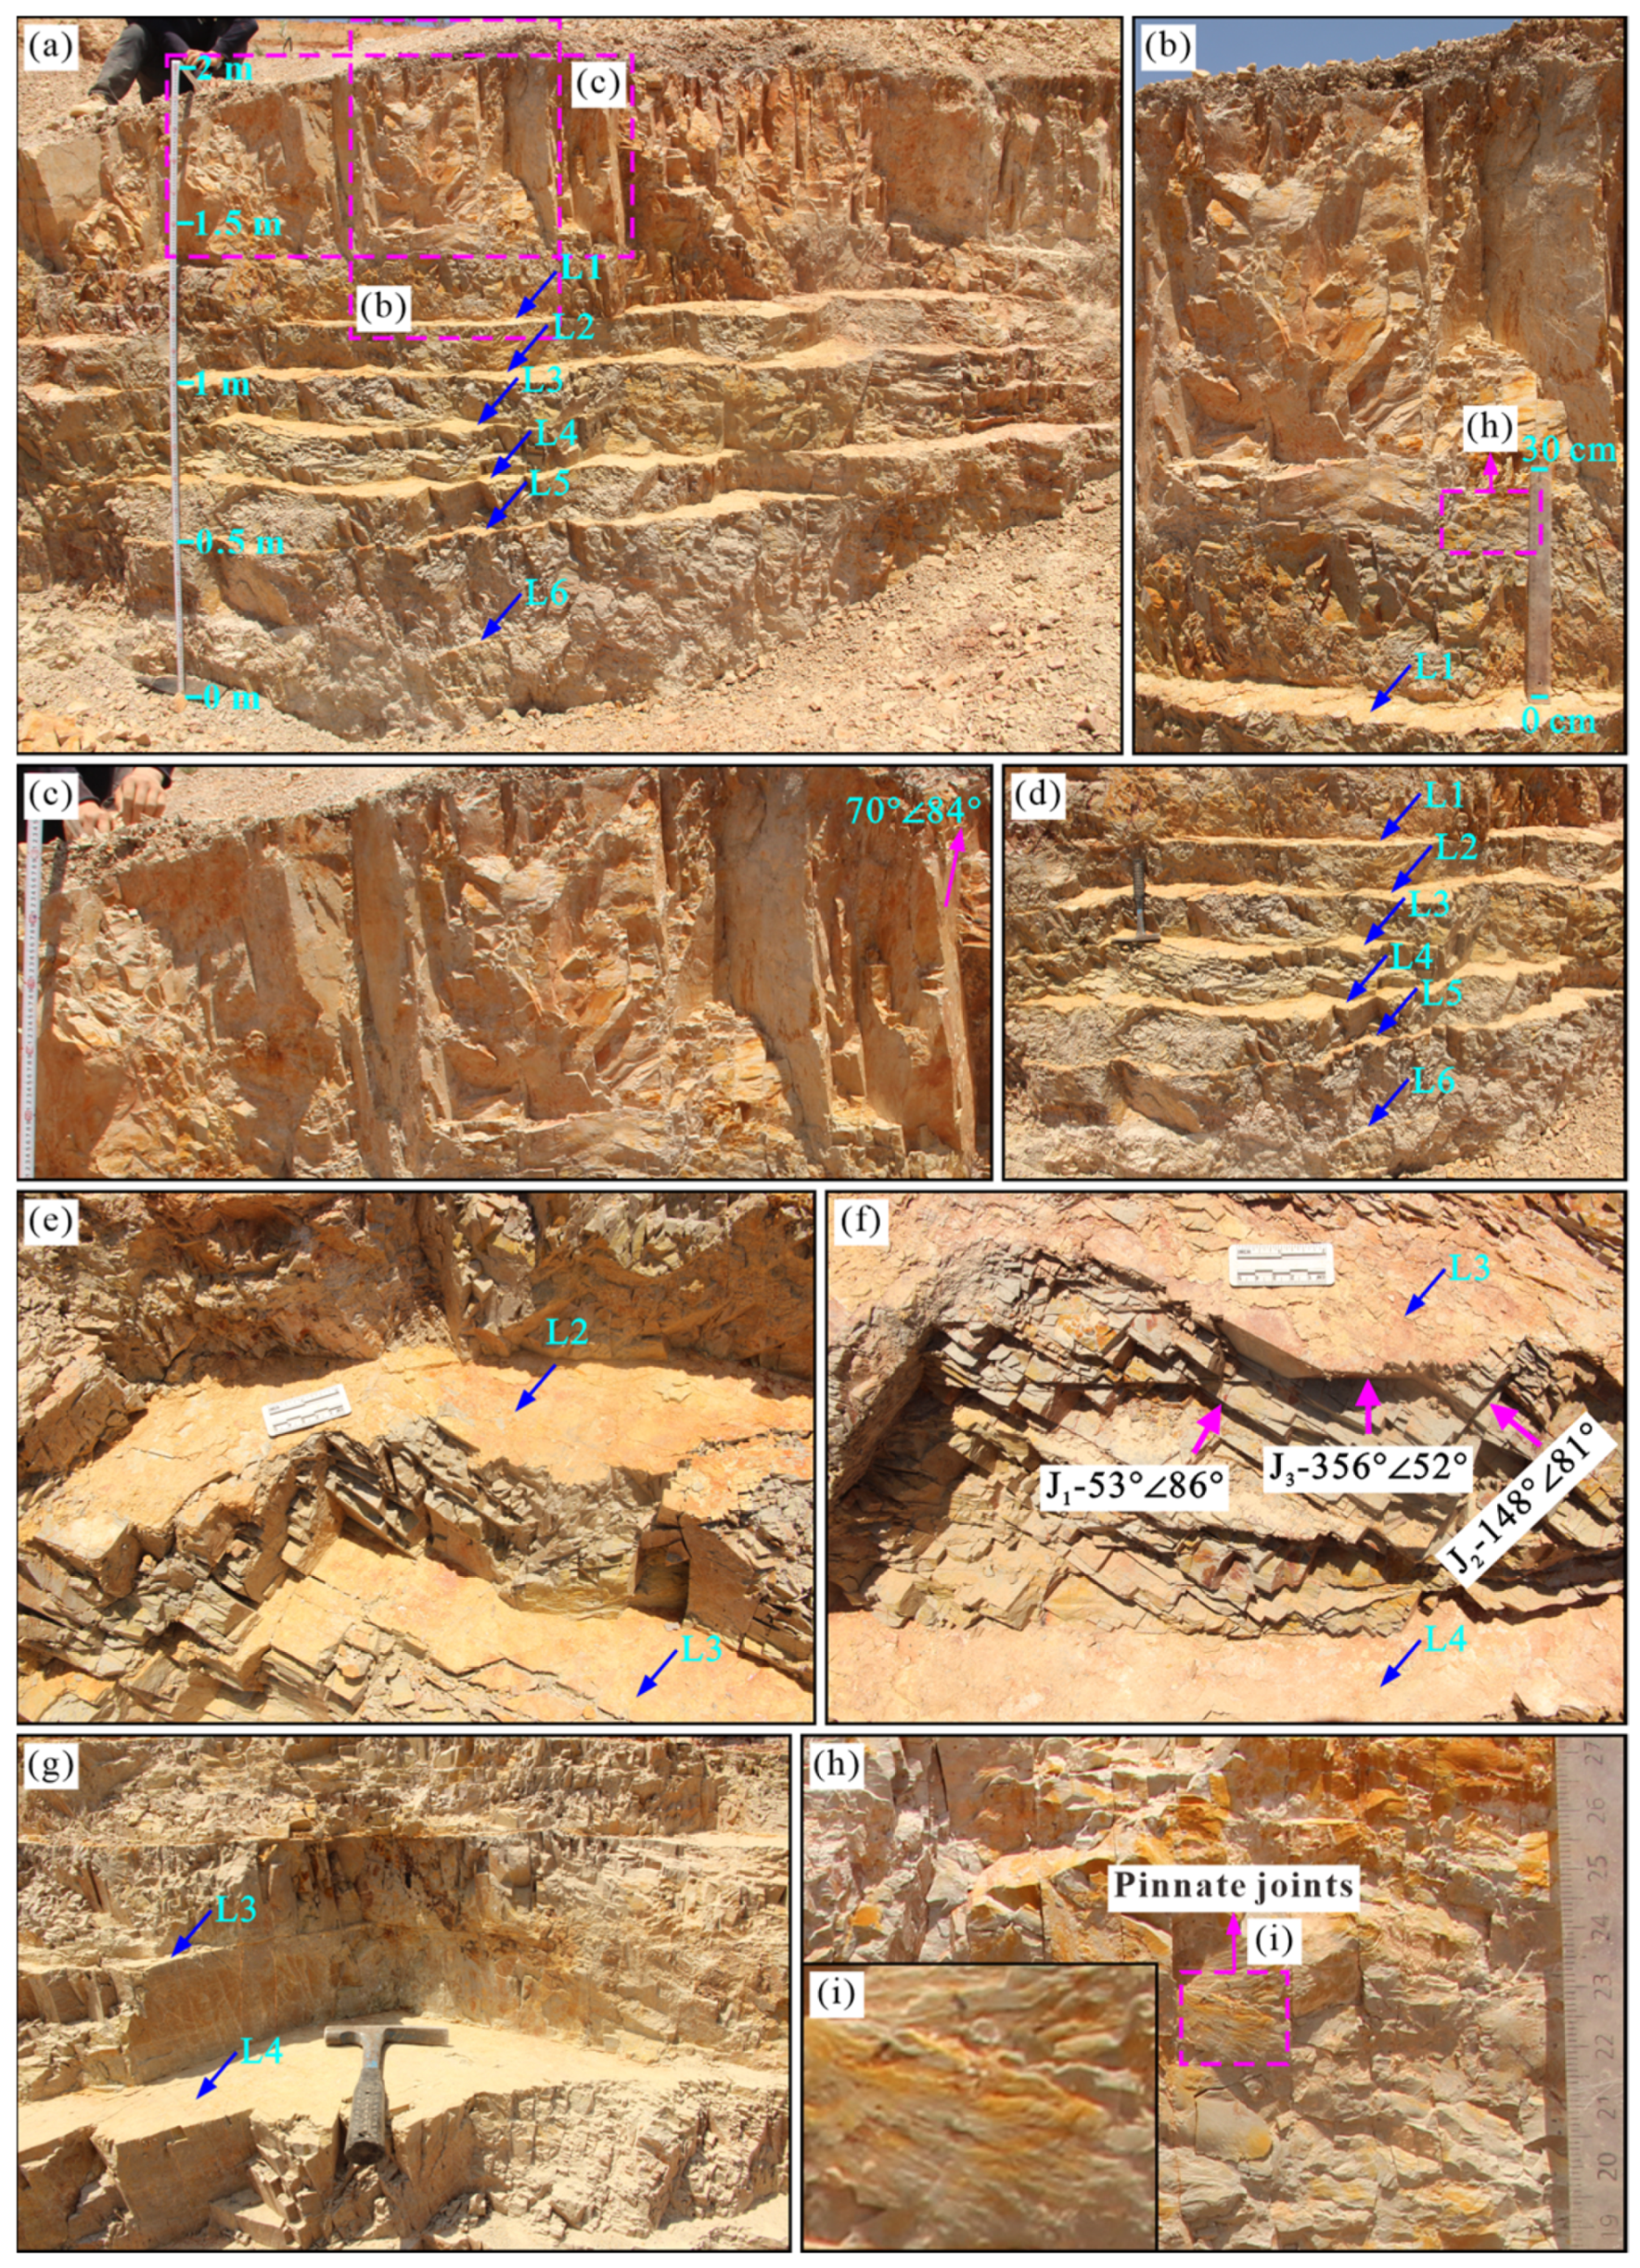
3.1.3. Analysis of Typical Excavation Profile

The dolomite exposed in the excavation profile is generally very fractured (Figure 6). Consistent with the results of in-hole television images and borehole shear wave velocity analysis, the excavation profile also shows the presence of localized differential fracturing. The profile exposes six layers of muddied interbeds with small interbed spacing between 9.3 cm and 16.7 cm. The rock masses between the interbeds are all very fractured, while the thicker dolomite rock masses (up to 0.8 m thick or more) above interbed L1 are more intact than those in the lower part (Figure 6a,c). However, the closer the proximity to interbed L1, the more fractured the rock masses become (Figure 6b). The degree of fragmentation is also inconsistent between interlayers L1 and L6, and the most fragmented rock is between L4 and L5 (Figure 6d), which may be related to the fact that the spacing between L4 and L5 is the smallest.
The rock discontinuities are well-developed and dominated by facies or muddied intercalations and shear joints. Figure 6c shows two significant sets of shear joints which are flat, smooth, and interconnected. The rock between interlayers L2 and L3 is mainly cut by two sets of subvertical joints (Figure 6e), straight, smooth, spaced about 1 cm apart, and interconnected. The rock between interlayers L3 and L4 is mainly cut by three sets of joints (Figure 6f). The first set of joints (J1) has an NW-SE strike. The second set of joints (J2) has an NE-SW strike. The third set of joints (J3) has an E-W strike. All three sets of joints are flat, smooth, and interconnected, each parallel to the other, and spaced at the centimeter level, with J3 being less dense than J1 and J2. Figure 6g shows the two main shear joints with smooth, flat nodal surfaces. Figure 6h shows a set of suberect shear joints. The joints are straight, smooth, parallel to each other, unfilled, and spaced less than 2 cm apart in addition to the feather-decorated tensor nodules.
A geological compass and a 3D laser scanner were used to measure 40 sets of the strike-dip directions of discontinuities in three sections of the observation site, of which 8 were muddied interlayers and 32 were shear joints. According to Figure 7, the discontinuities at the observation site can be divided into six sets. The first set comprises muddied interlayers with an average dip at 23° and an average dip direction at 200°. The second set comprises bedding joints with a dip and dip direction similar to the muddied interlayers. The third set comprises shear joints with an NE-SW strike and a dip of 85°. The fourth set comprises shear joints, with an average dip at 81° and an average dip direction at 67°. The fifth set comprises shear joints with an average dip at 66° and an average dip direction at 34°. The sixth set comprises shear joints with an average dip at 52° and an average dip direction at 356°. During excavation construction, the high slope was destabilized three times. The retrogressive rockslide occurred along the bedding planes and the mudded interbeds, which were nearly paralleled to the slope face. Materials in the mudded interbeds were extruded during the slide.
In summary, the rock structure at the observation site is very fragmented. The degree of fragmentation varies from one formation to another. The thinner the formation or the closer it is to the muddied interlayer, the more fragmented the rock is. The discontinuities are mainly muddied intercalations and shear joints, which are flat, smooth, parallel, connected, and unfilled and can be divided into six sets with extremely developed discontinuities. The degree of rock integrity is fractured, and the structural type is fractured.

3.1.4. Block Geometry Analysis

The 3D surface morphology of 20 blocks is shown in Figure 8. The lengths of the long, medium, and short axes of the blocks with different grain sizes do not differ significantly; the angles are sharp, and the discontinuities are straight and smooth. Each block has multiple sets of parallel discontinuities.
The surface area to volume (S/V) ratio of blocks ranged from 0.73 to 3.45 cm−1, with S/V decreasing with increasing volume. The S/V of blocks was larger than that of equal volume spheres and cubes (Figure 9a). This indicates that the surface morphology of the blocks is more complex than that of the sphere and cube, and the smaller the blocks, the more complex the surface morphology.
The SD of the blocks ranged from 0.77 to 0.82, increasing overall with increasing block volume, with an average value of 0.75 compared to 0.81 for an equal volume cube (Figure 9b). This indicates that the smaller the volume of blocks, the more it deviates from a sphere, and as the volume increases, the closer the block is to a cube.
When the volume of the blocks is less than 100 cm3, the dispersion of the SF is relatively large, ranging from 0.71 to 1.41, and the block behaves as a short column and square; however, when the volume is greater than 100 cm3, the SF is more concentrated, with a mean value of 1.05, and the block is a square (Figure 9c).
The blocks’ V/V2 ranged from 0.1 to 0.29, increasing with increasing volume. However, the equal volume sphere’s V/V2 was 0.37 (Figure 9d). This indicates that the blocks’ overall angularity is more pronounced than that of the cube, and the blocks’ roundness is angular and sharp-edged. According to the classification of particle shape with the sedimentological method [26], the blocks are predominantly spherical, followed by disc-shaped, with bladed and rod-like being the least common (Figure 10).
The results of the two-dimensional geometric morphological analysis of 1355 blocks with particle sizes ranging from 5 to 60 mm showed that the ff of the blocks ranged from 0.03 to 0.90, with an average value of 0.76. The smaller the cross-sectional area of blocks, the greater the dispersion of the ff (Figure 11a). The ff of circles and squares was 1.0 and 0.785, respectively. The average ff ranged from 0.72 to 0.80 and generally decreased with the increase of the cross-sectional area of the block, but the decrease was small, and the shape of the blocks was nearly square (Figure 11c).
The blocks’ aspect ratios (L/W) ranged from 1.07 to 7.95, with a mean value of 1.59, and the smaller the cross-sectional area of blocks, the greater the dispersion of the aspect ratio. The aspect ratio generally decreases as the cross-sectional area increases (Figure 11b). The fractal dimension varies between 0.97 and 1.12 and generally decreases with increasing cross-sectional area, indicating that as the area increases, the block becomes simpler. The surface morphology of the block becomes increasingly smooth (Figure 11c). This is because the dense discontinuities cut into each other. The individual discontinuities are small, and as the block gets larger, the number of discontinuities increases accordingly, and the block is closer to a sphere.

3.2. Microfracture Characteristics of Rock Masses

To further investigate the fracture characteristics of the dolomite rock mass, samples of the fractured rock mass were taken for microscopic observation. The microscopic morphology of the blocks in the particle size range of 0.16–5 mm is shown in Figure 12. The angles of the blocks in the different size classes of particles are sharp, and the roundness is of the sharp-edged type.
In the images acquired via SEM (Figure 13), the arrows point to ultramicroscopic fissures, which are not flat and smooth but folded. The fissures do not break the crystals but advance mainly along the intercrystalline and crystal interfaces. The fissure surface is not a smooth plane. The crystal structure on both sides of the fissure is intact, and the maximum spacing of the fissure is about 2.5 μm (Figure 13k).

3.3. Analysis of Rock Fracture Formation Mechanisms

The essence of the problem of rock fracture genesis mechanism is the mechanism of discontinuity generation. The facies between the dolomite and interbedded layers of the YPP high slope is one of the important discontinuities of this high slope (Figure 6), and the small interbedded spacing and dense facies exacerbate the dolomite rock fragmentation. The original depositional environment controls the interbedded structure of the dolomite and intercalated layers. Therefore, it is considered that the fragmentation of the dolomite rock mass on this high slope is related to the original sedimentary deposition and geomorphology.
In addition, the dolomite rock mass of the high slope of the YPP also develops four dense sets of shear joints (Figure 7), which should be related to tectonics. This is because the geological age of the project slope strata is very old. The dolomite belongs to the Ediacaran strata, and the project area is located at the southeastern end of the Sichuan-Yunnan rhombic active block. There are four main fault zones near the project area: the Puduhe Fault Zone (approximately N-S strike), Qujiang Fault Zone (NW-SE strike), Yujiang Fault Zone (NW-SE strike), and Mingxing Erjie Fault Zone (NE-SW strike). These linear structures were active in the Quaternary. The old strata, formed first, are influenced by multi-phase tectonic action, and the rock mass develops multiple groups of discontinuities. The degree of fracturing of the rock masses generally decreases with depth within the depth range of the borehole exposures. The decrease is not significant, and the rock masses are generally very fragmented, with local differential fracturing (Figure 3). The wave velocity of the dolomite rock in the borehole generally increases with increasing depth. However, the increase is very small and decreases locally (Figure 5). The above analysis shows that the fractured dolomite is distributed over a large depth range, exceeding the borehole depth, and that the degree of fragmentation and shear wave velocity of the fractured dolomite are generally stable over the borehole depth range. However, there is also local differential fracturing, which should be related to tectonic action and may not be the result of weathering. In addition, the excavation section shows flat, smooth discontinuities (Figure 6), a clear dominant strike-dip direction of four sets of shear joints (Figure 7), and sharp angles of the blocks (Figure 8). These indicate that the dense rock discontinuities should be the product of tectonics.
Scanning electron microscopy shows that the fissures do not dissect the crystals but split mainly along the intercrystalline interfaces. This indicates that the shear joints of the dolomite rock mass in the project area were formed under slow tectonic shear.
Xu and Huang [27,28] proposed the chemical weathering indices FF and OX. FF and OX are calculated from the molar ratio of rock oxides. Increased weathering increases FF values and decreases OX values. To evaluate the effect of chemical weathering on the dolomite rock mass fragmentation in the project area, eight size classes of dolomite blocks (Figure 14) were selected for total chemical analysis, and then, the chemical weathering indices FF and OX were calculated for each group of blocks. The results are shown in Figure 15. The grain size of the blocks decreased in order from By1 to By8, and the angles of the blocks of each grain group were sharp without blunting (Figure 14). The results of the chemical allometric analysis were not very different, with FF ranging from 2.3 to 9.9 (Figure 15a). It did not show a regular variation with decreasing grain size of the blocks. OX ranged from 0.09 to 0.31 (Figure 15b), which also did not show a regular variation with decreasing grain size of the blocks. Therefore, it is concluded that chemical weathering is not the main mechanism of fragmentation of dolomite rock masses.

4. Conclusions

This paper uses in-hole television, borehole shear wave velocity tests, borehole cores, 3D laser scanning techniques, image processing techniques, and SEM to analyze the macroscopic and microscopic structural characteristics of the fractured rock masses from both rock blocks and rock discontinuities qualitatively and quantitatively and draws the following conclusions.
(1)
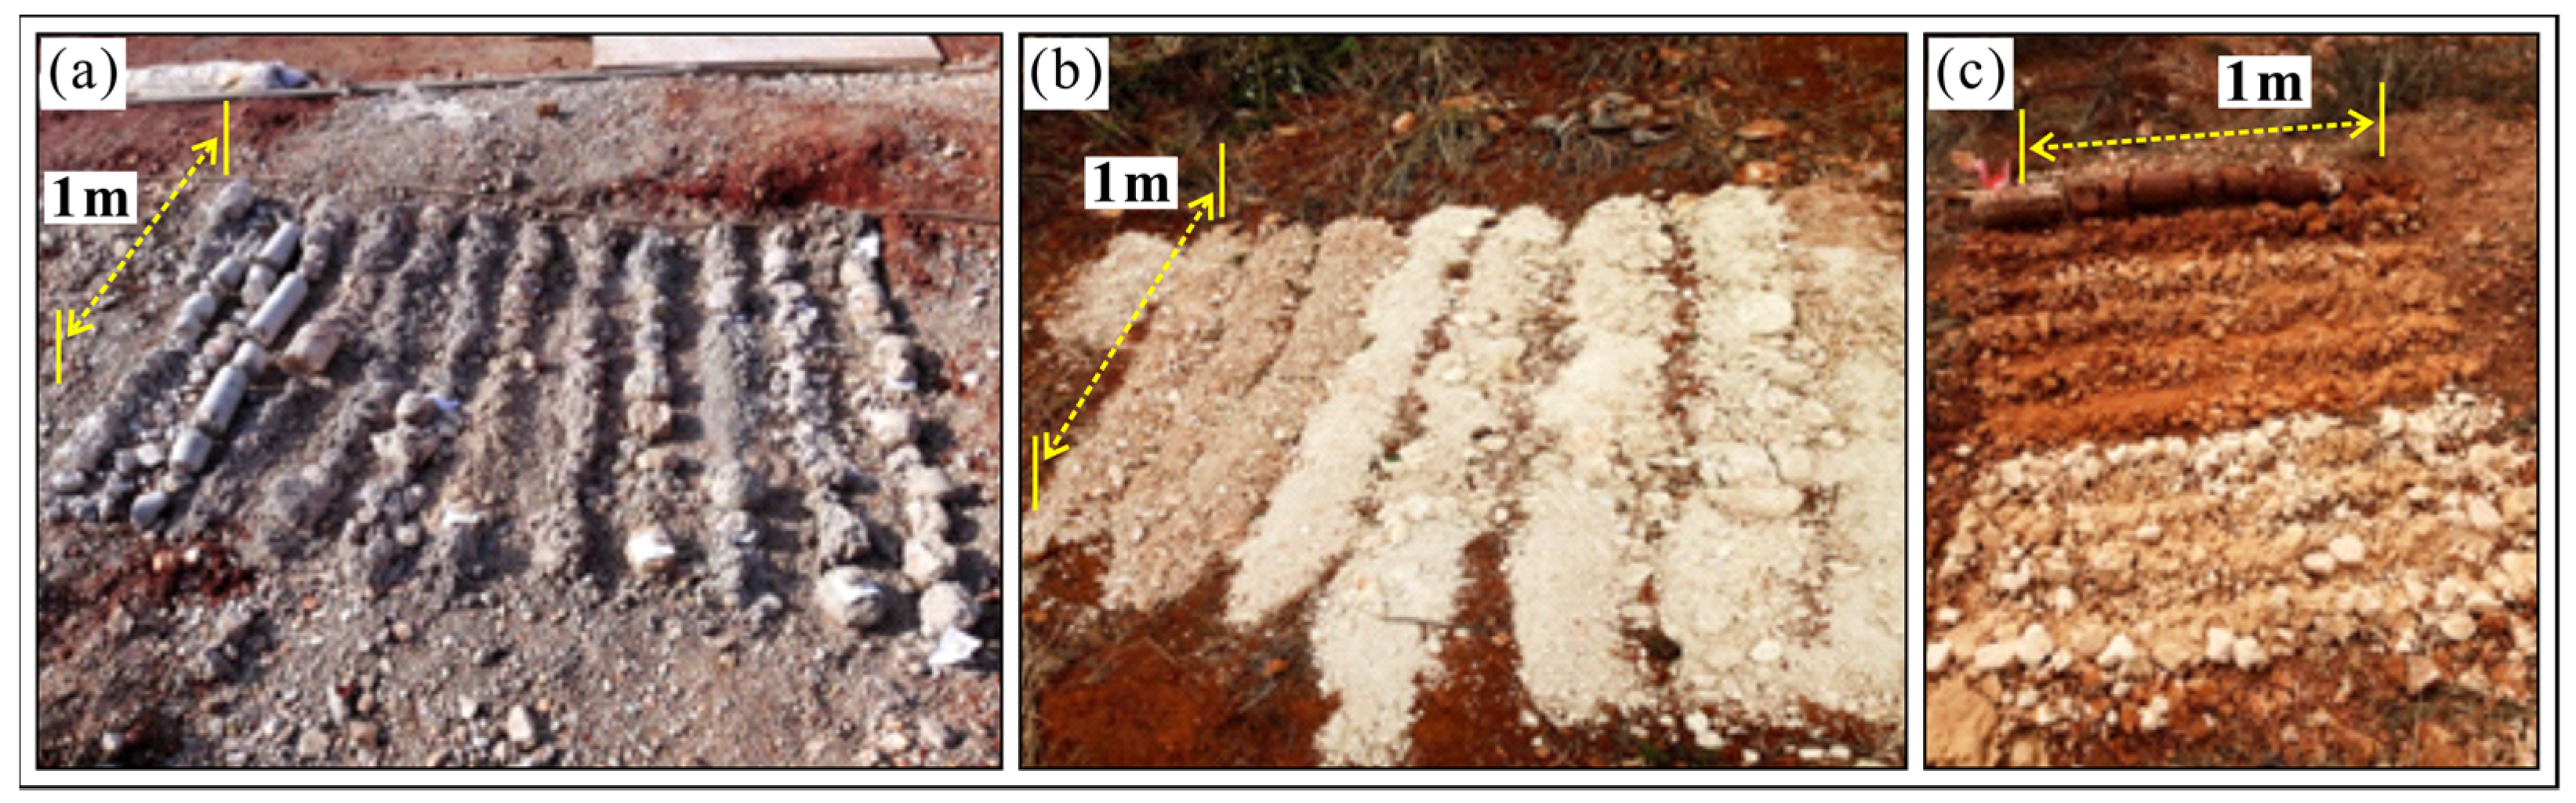
Within the depth range of the borehole exposures, the degree of fragmentation of the rock mass generally decreases with increasing depth, the decrease is not significant, and differential fragmentation occurs locally, but the rock mass is generally fragmented. Most borehole cores are fragmented and fractured, with a basic RQD value of 0 and a basic rock quality grade of V. Part of the borehole cores are block fractured, with an RQD value of less than 10% and a basic rock quality grade of IV. These can provide a basis for rock mass classification. According to the Geological Engineering Handbook [1], the rock quality designation is very poor.
(2)
The shear wave velocity can be used to estimate the integrity of the rock mass and determine the site classifications. The shear wave velocity of the dolomite on the high slope generally increases with the depth of the borehole, but the increase is very small. Part of the shear wave velocity has a tendency to decrease, and the integrity of the rock mass should be broken or very broken. According to GB 50011 (2010) [25], the site classification of YPP is Level I1.
(3)
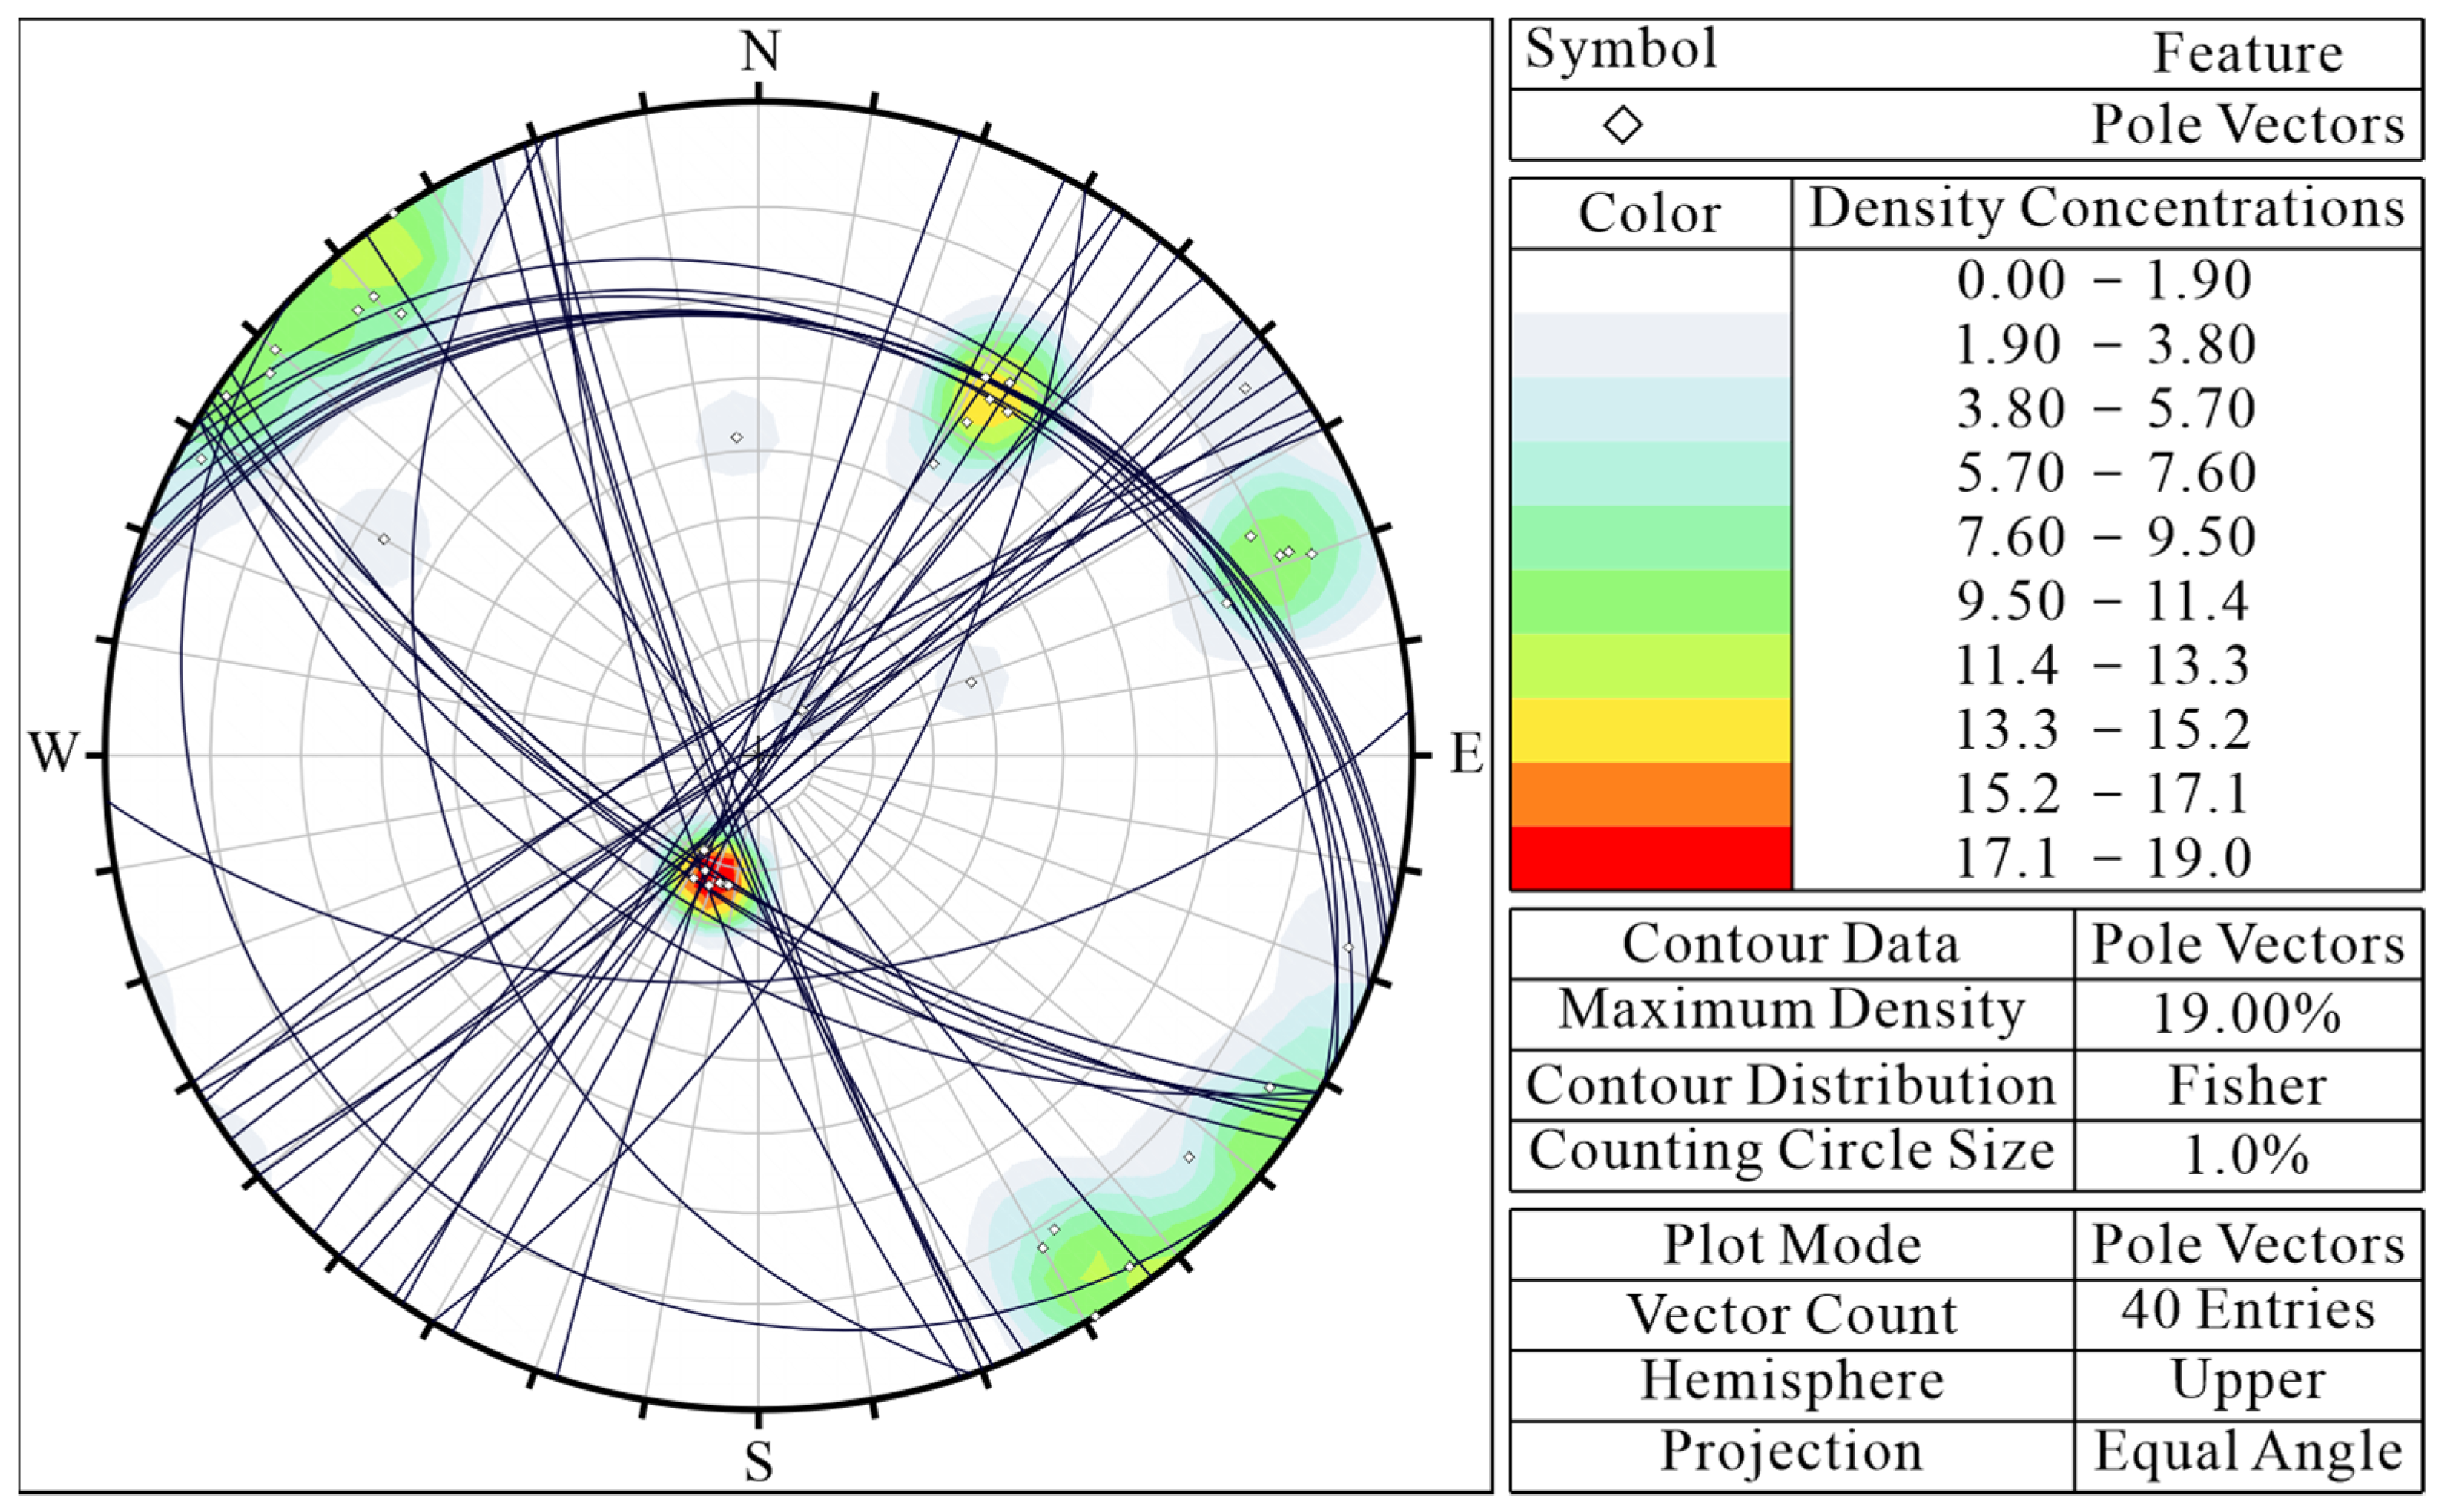
The rock structure revealed by the excavation section is fragmented, the degree of rock mass integrity is fragmented, and the rock structural type is mainly fractured. The degree of fragmentation varies from one rock layer to another. The thinner the rock layer is, the smaller the spacing of the muddied interlayer is; that is, the closer it is to the muddied interlayer, the more fragmented the rock mass is. The discontinuities are mainly facies, muddied inclusions, bedding joints, and shear joints, some of which are slightly staggered along the bedding joints. The joints are straight, smooth, interconnected, and largely unfilled, with each set of joints parallel to each other. The discontinuities are extremely well developed, with fracture spacing at the centimeter level, some even less than 1 cm. The discontinuities can be divided into six sets, the first set being muddied interlayer, the second set being bedding joints, and the remaining four sets being shear joints. The unloading effect generated by excavation causes the slope to slide along the bedding joints and muddied interlayer, leading to the failure of the support systems.
(4)
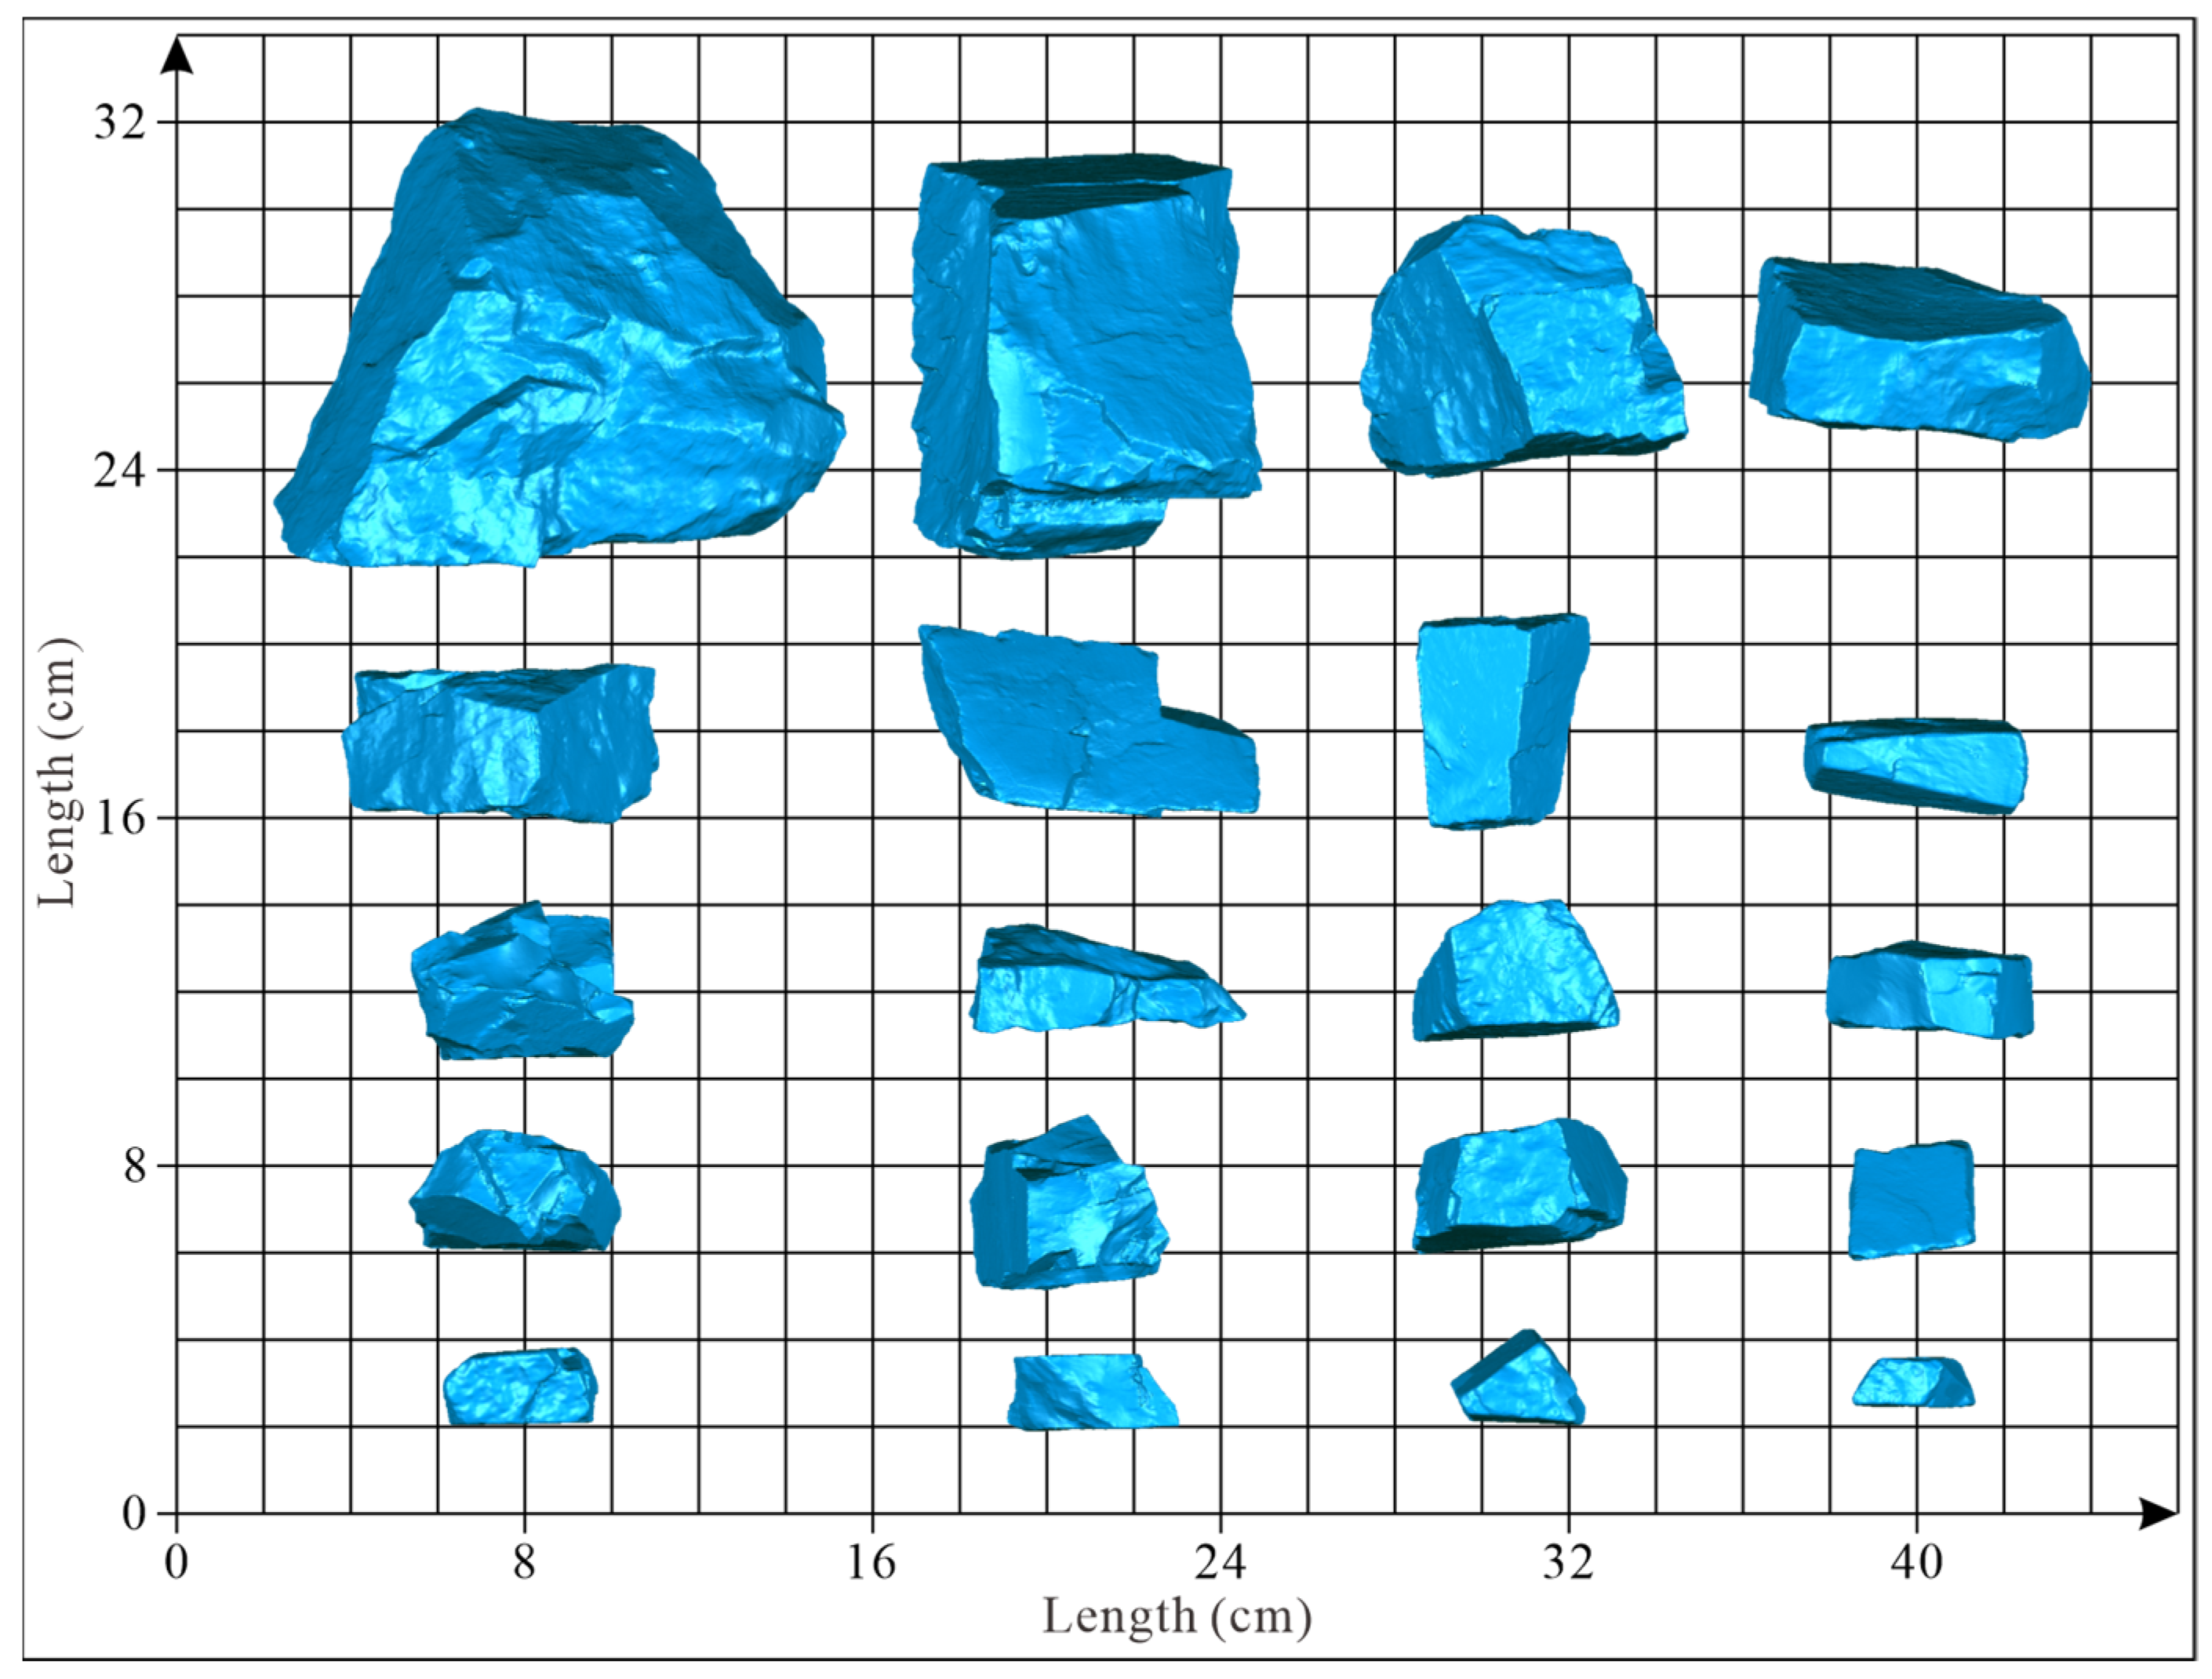
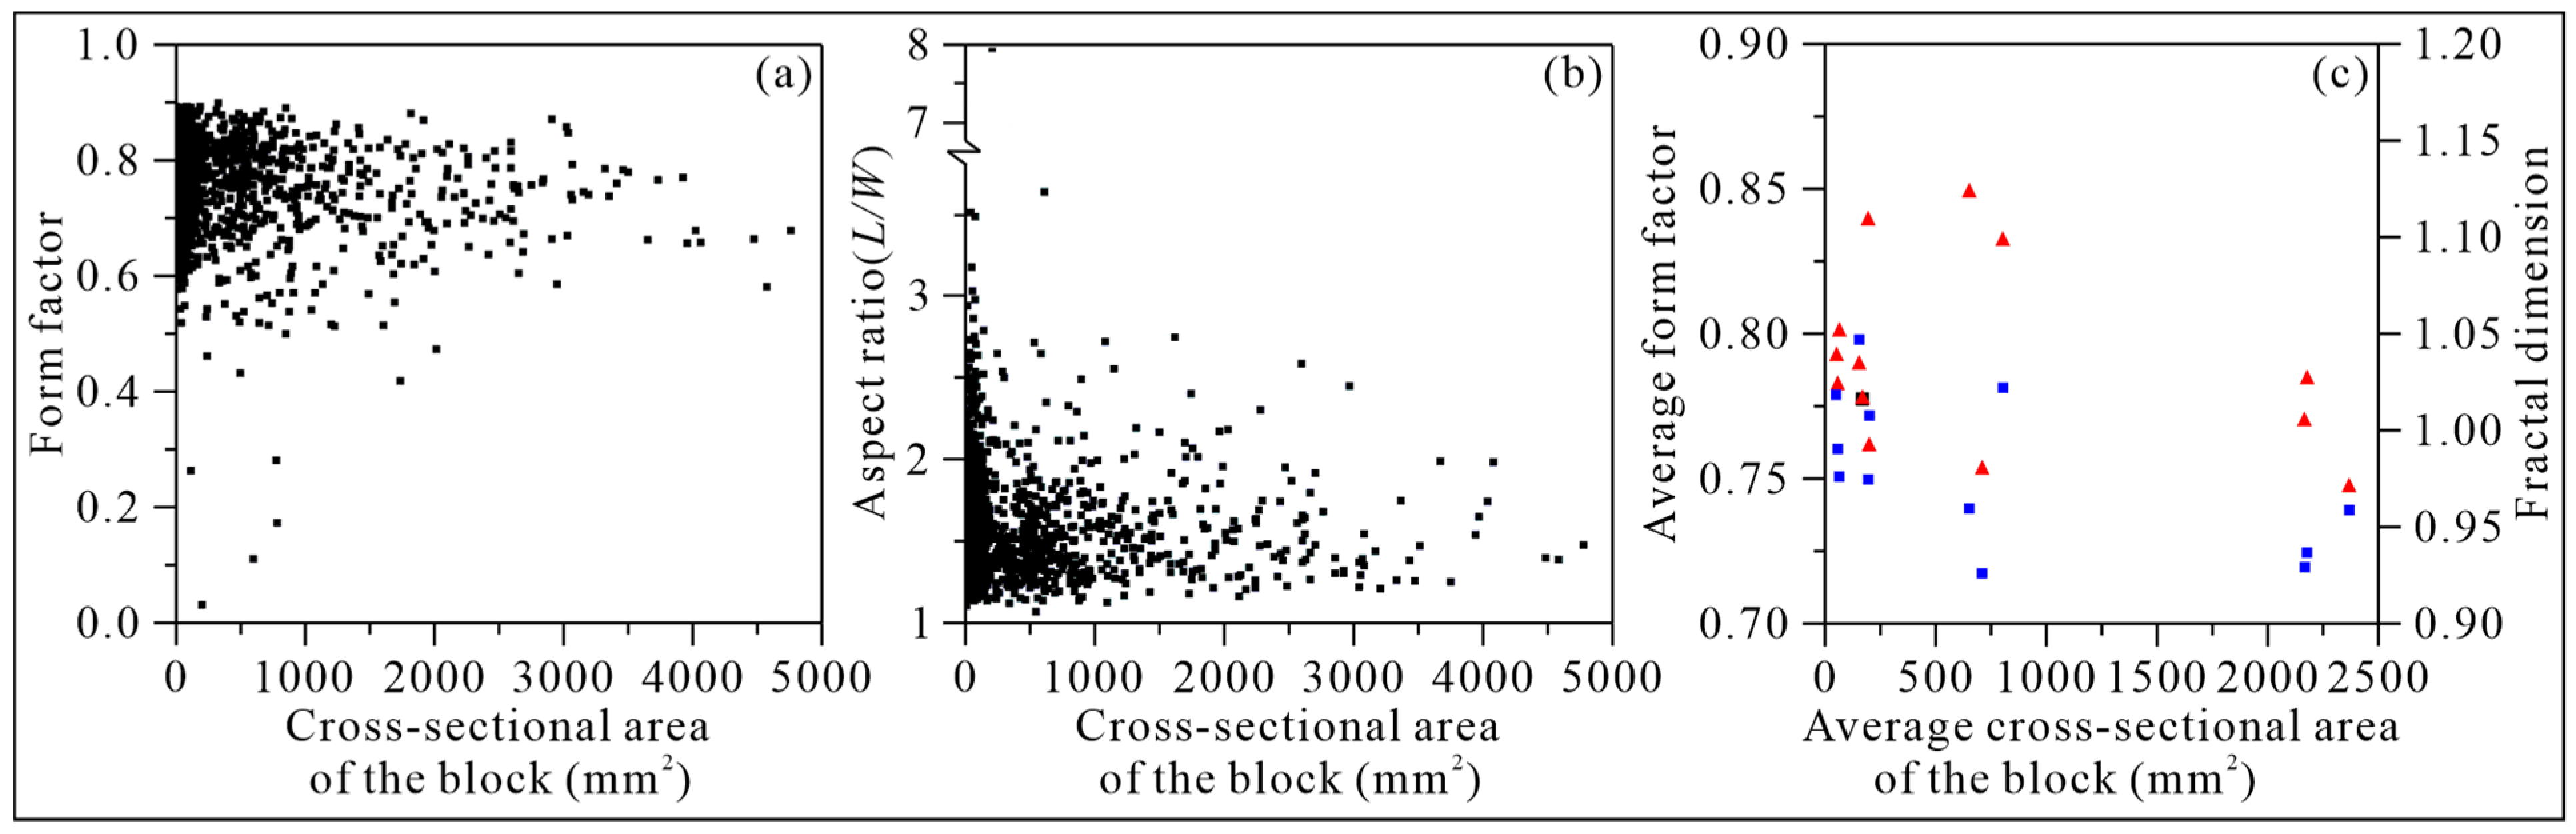
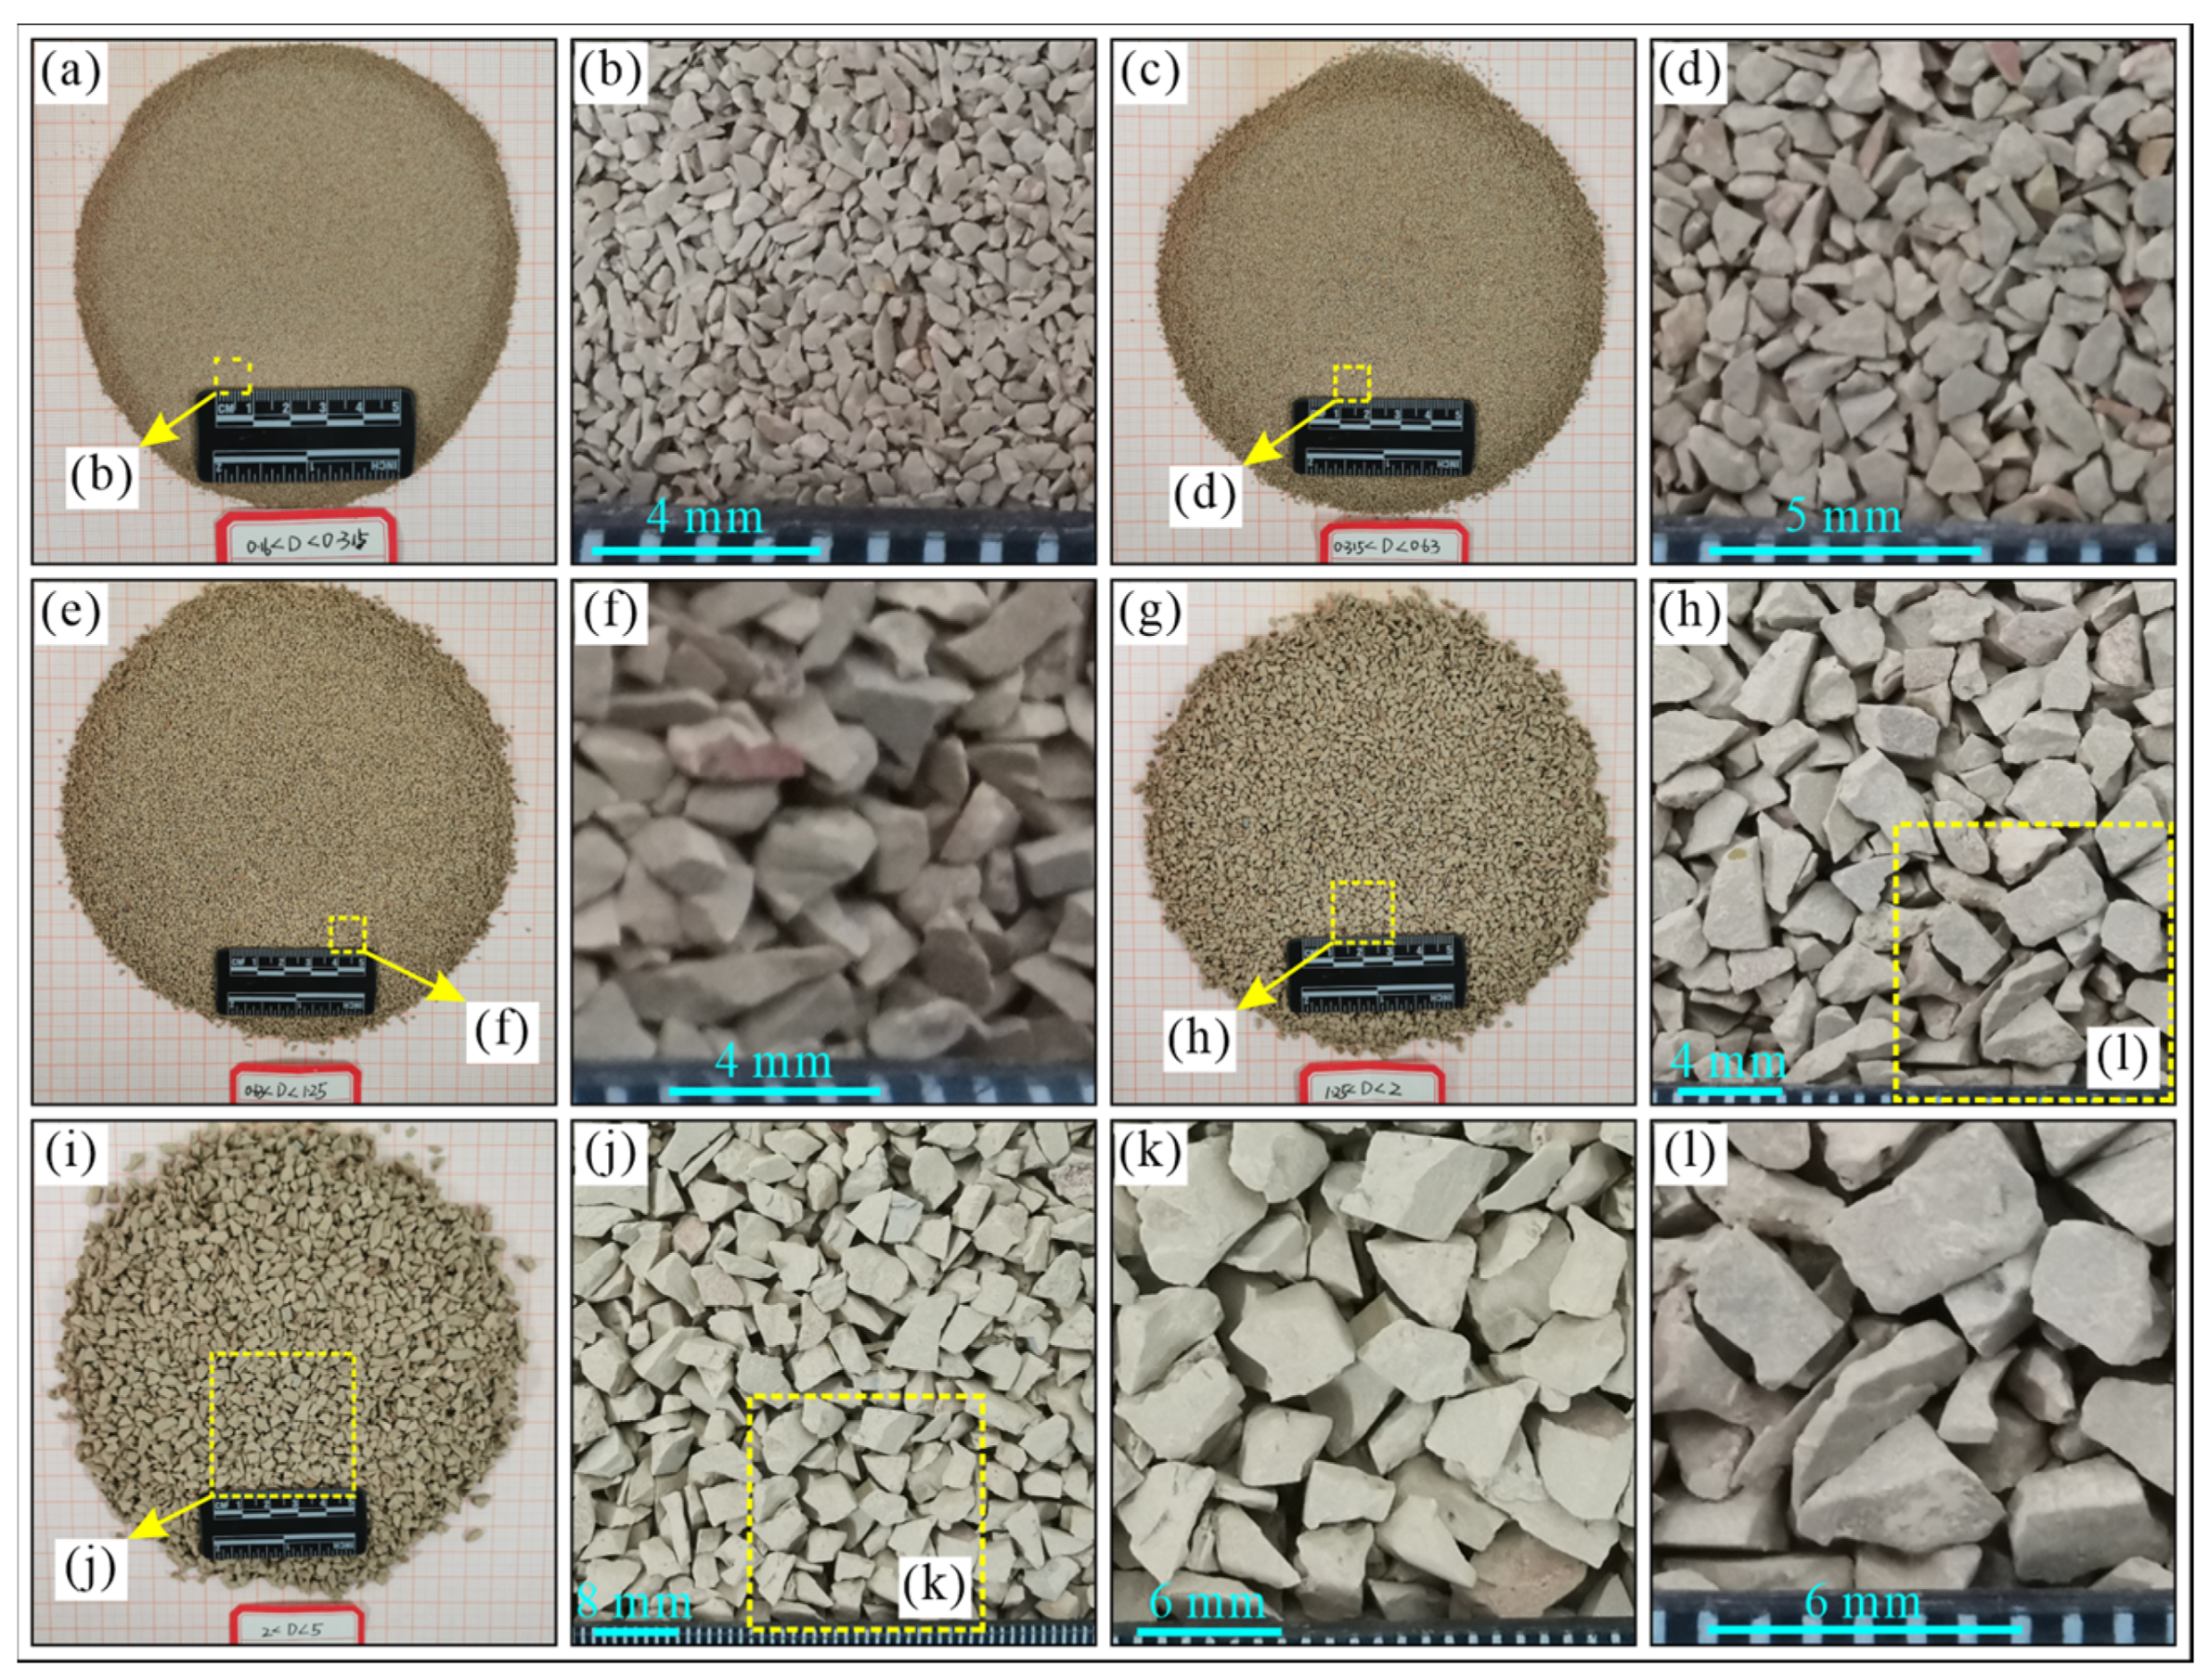
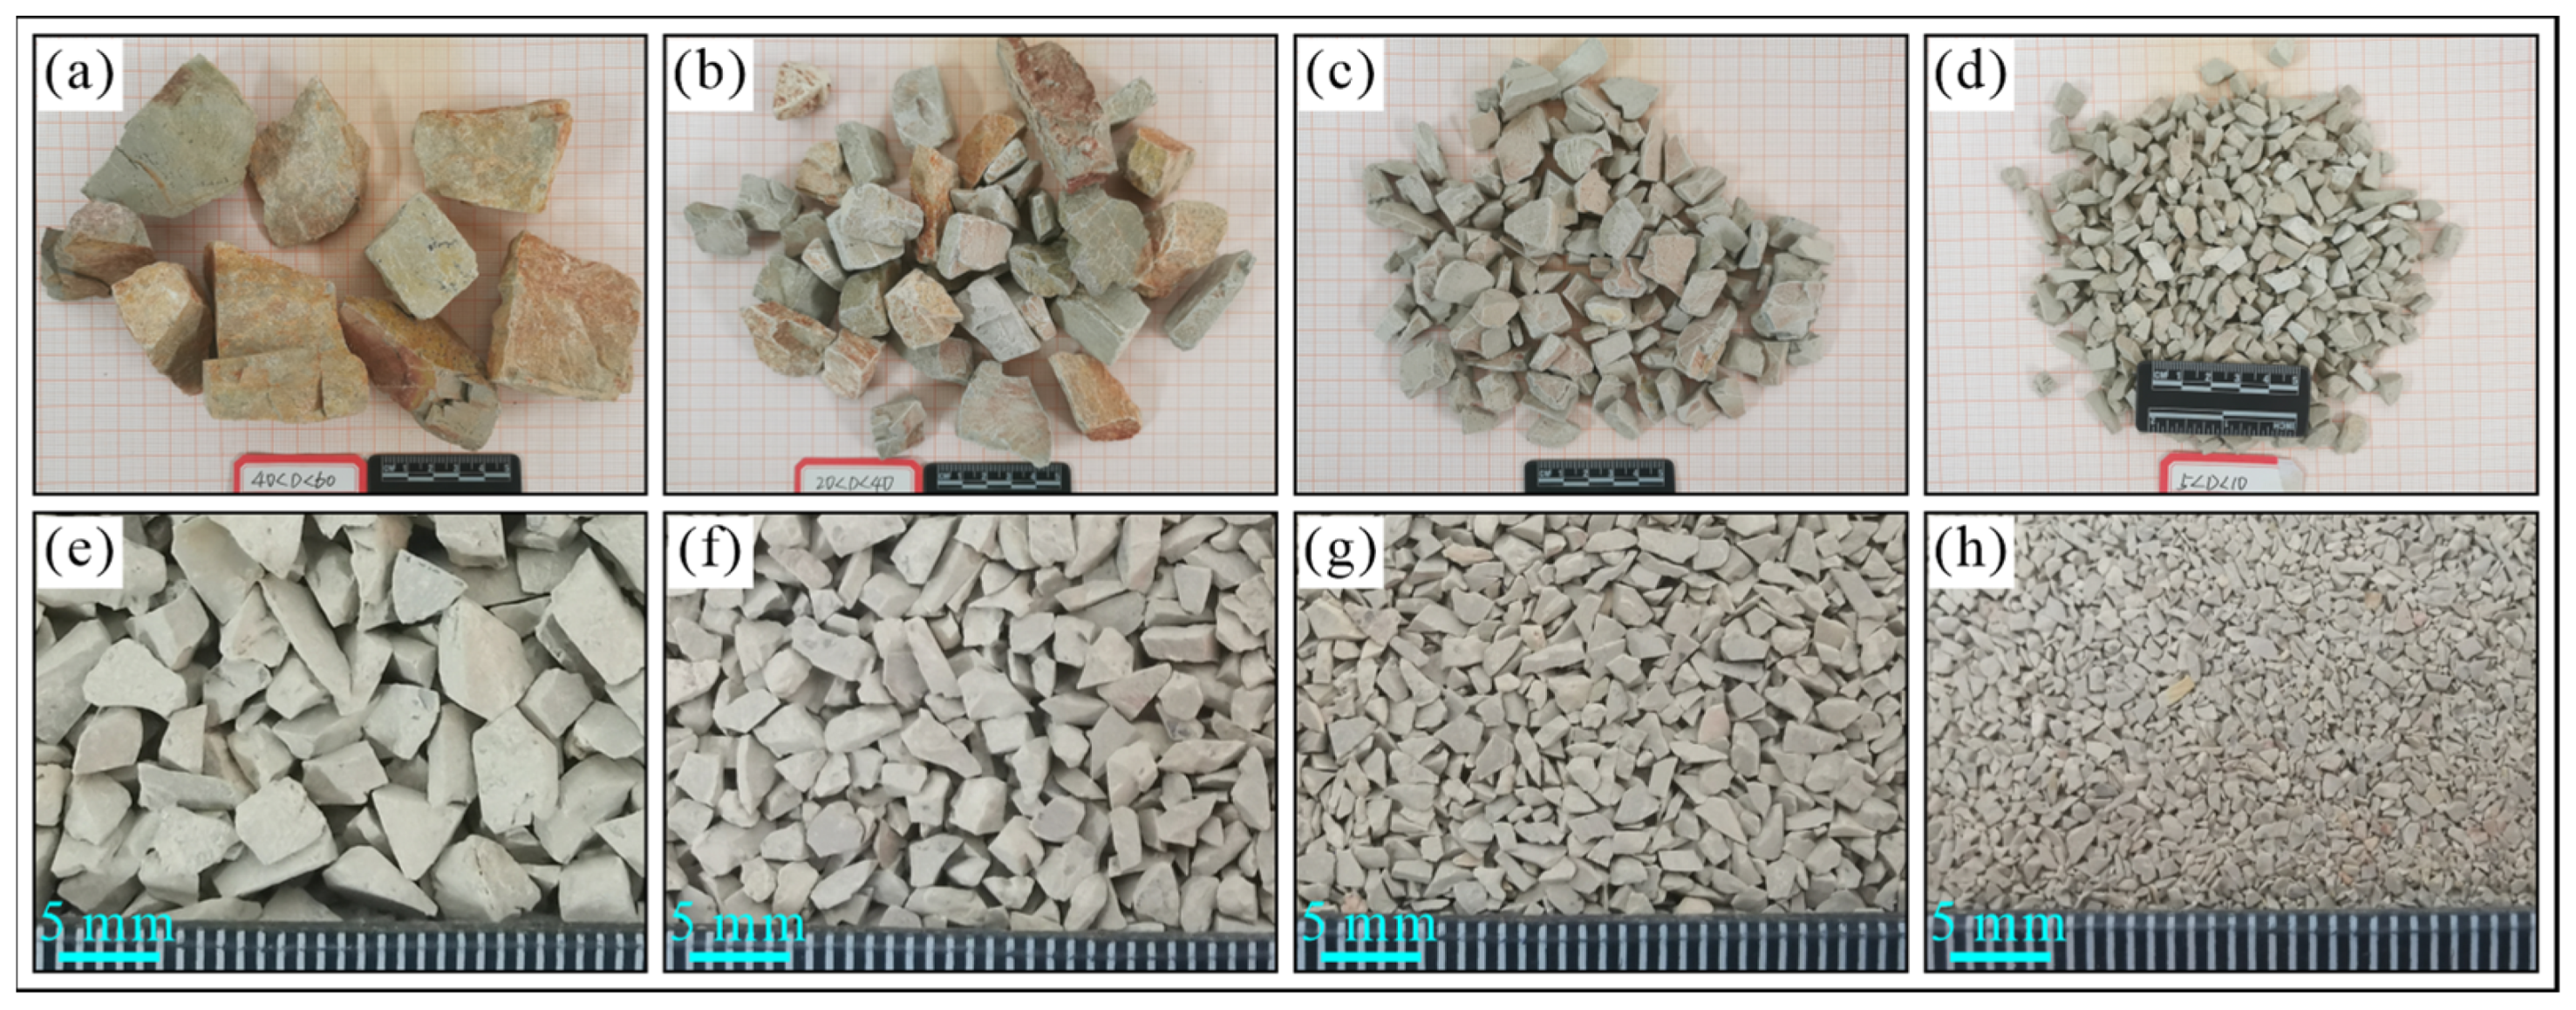
The angles of the blocks of different grain sizes are sharp, and the overall angularity of the blocks is more evident than that of the cubes, with roundness being angular and sharp-angled. The discontinuities are flat and smooth; each block has multiple sets of mutually parallel discontinuities. The smaller the blocks, the more complex the surface morphology. The angular and sharp-angled blocks indicate that tectonics mainly control dolomite fracturing.
(5)
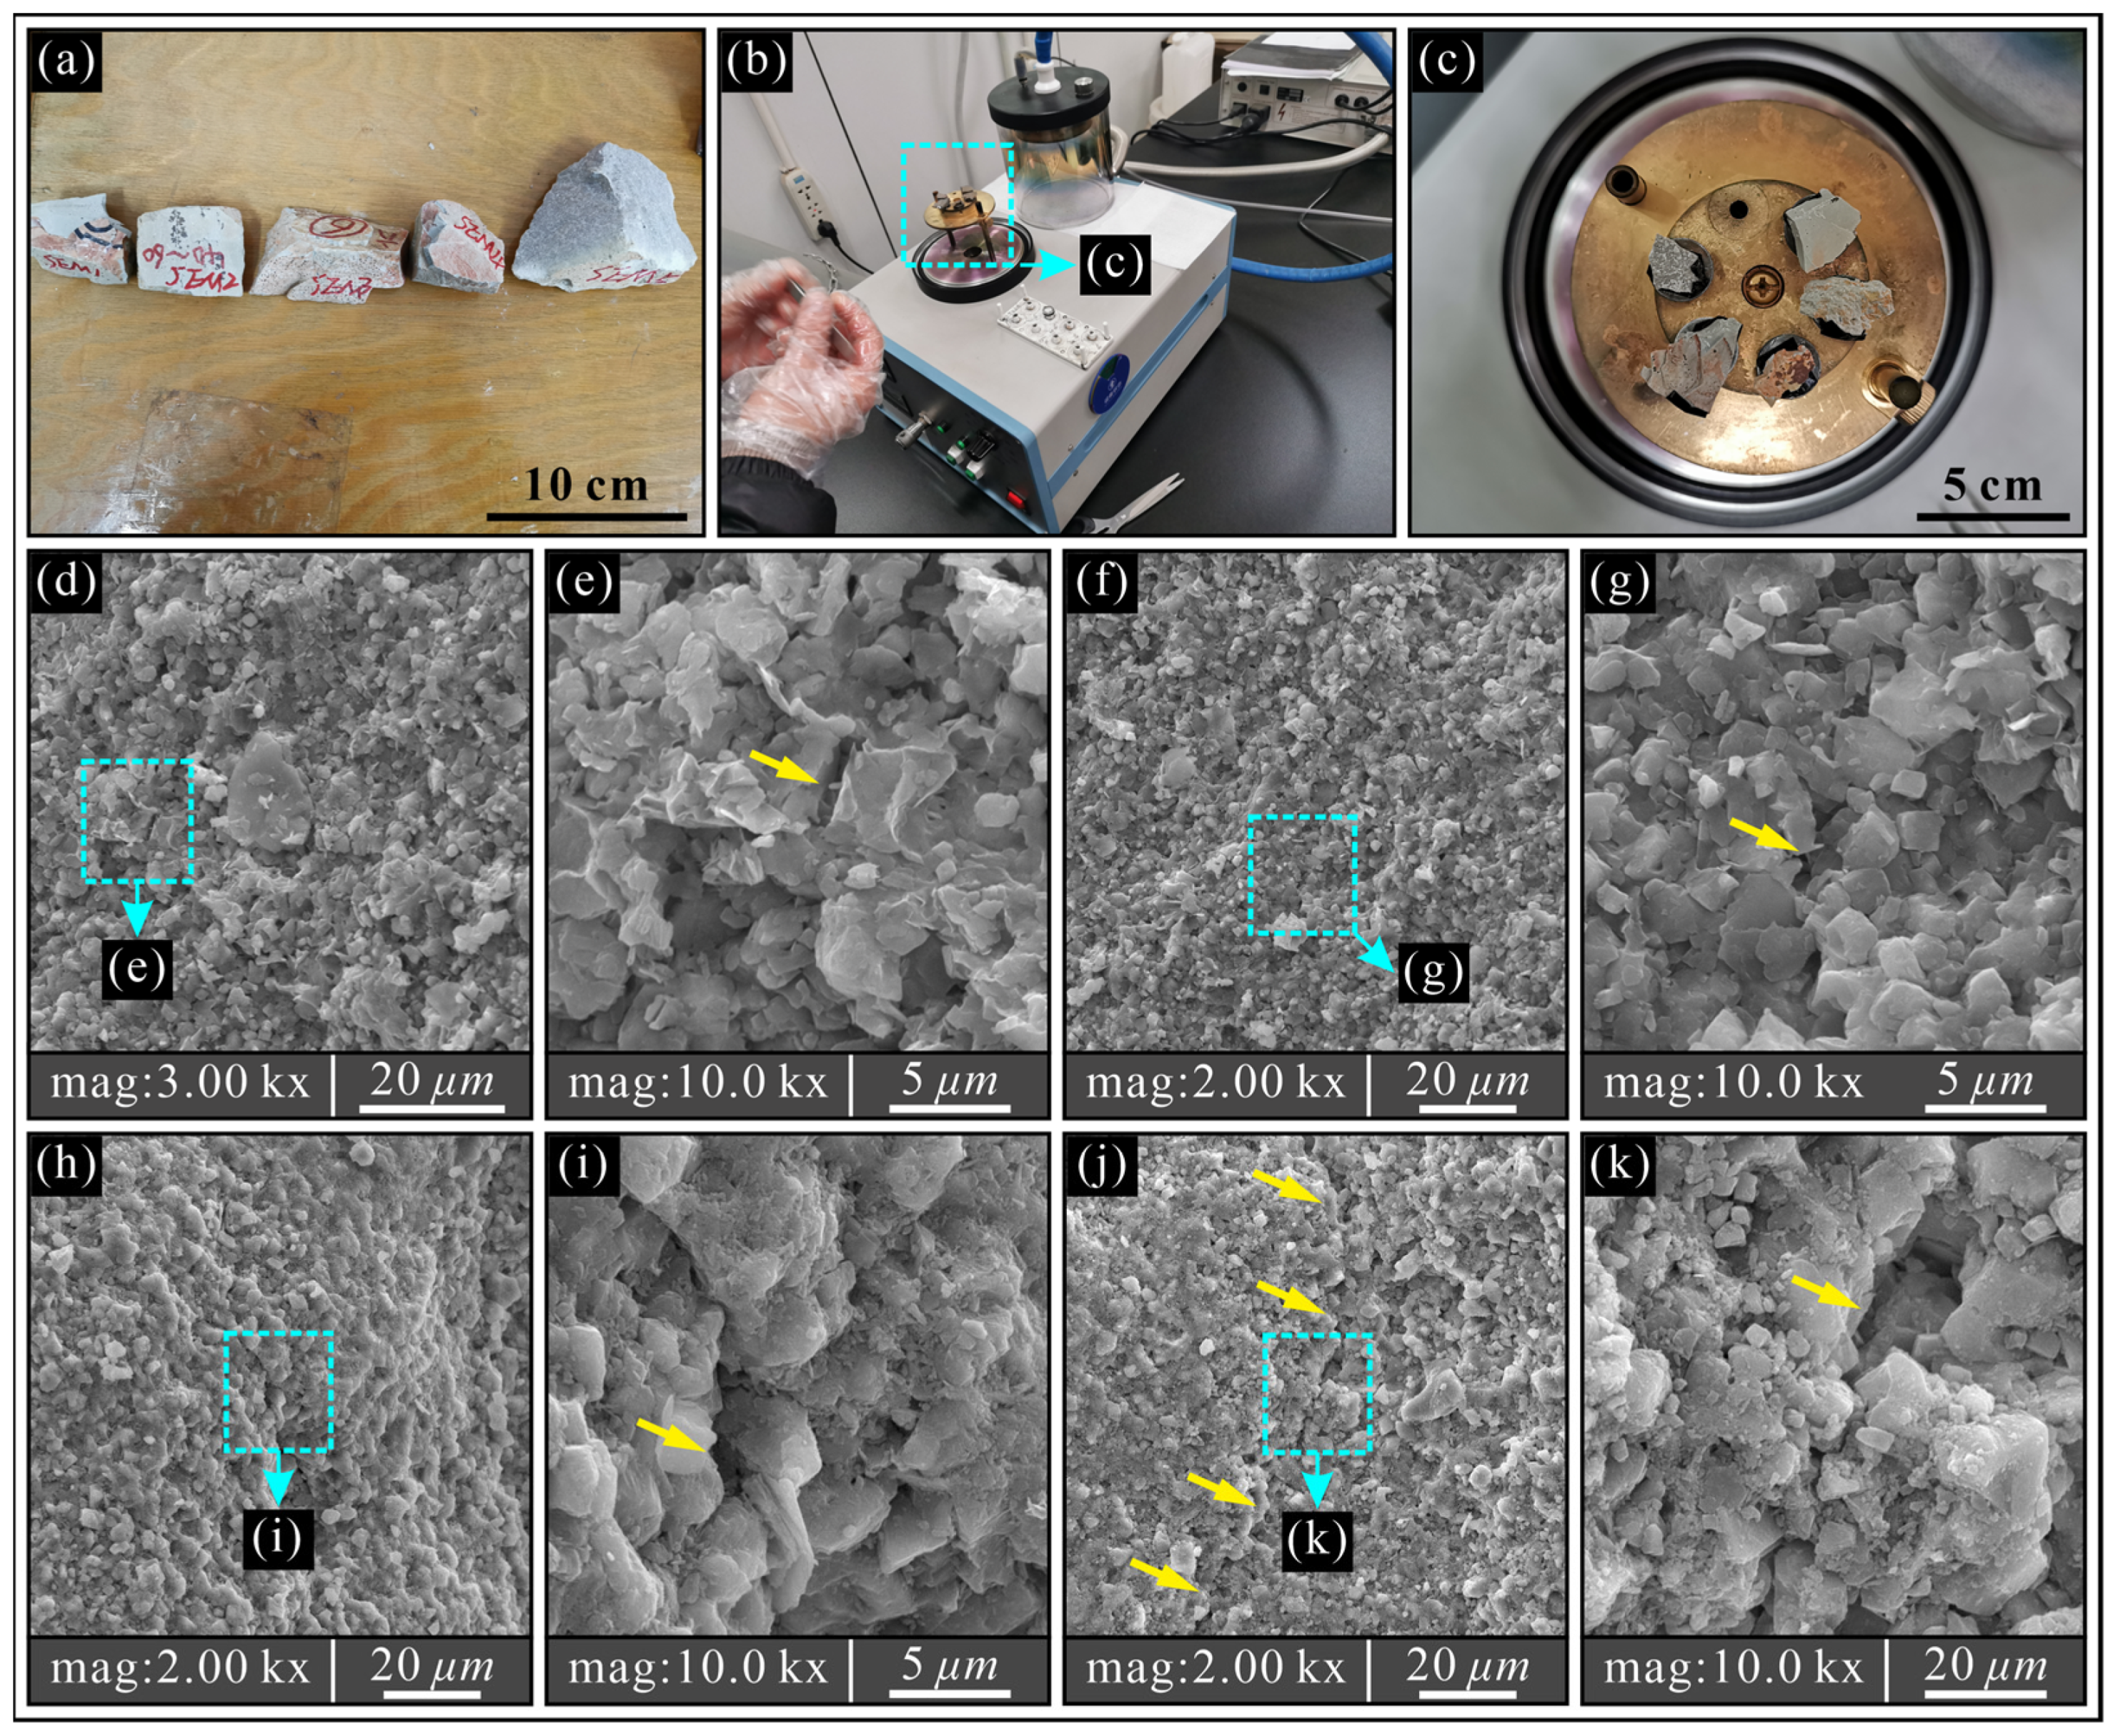
Scanning electron microscope observations show that the ultra-micro fractures are not flat and smooth, the fractures are folded, and the fracture opening is mainly on the micron scale. The fractures do not cut through the crystals but mainly split along the intercrystalline and crystal interfaces, and the crystal structure on both sides of the fracture is intact. These ultra-micro fracture features also indicate that the fracturing of dolomite is mainly controlled by tectonics and almost unaffected by surface weathering.
(6)
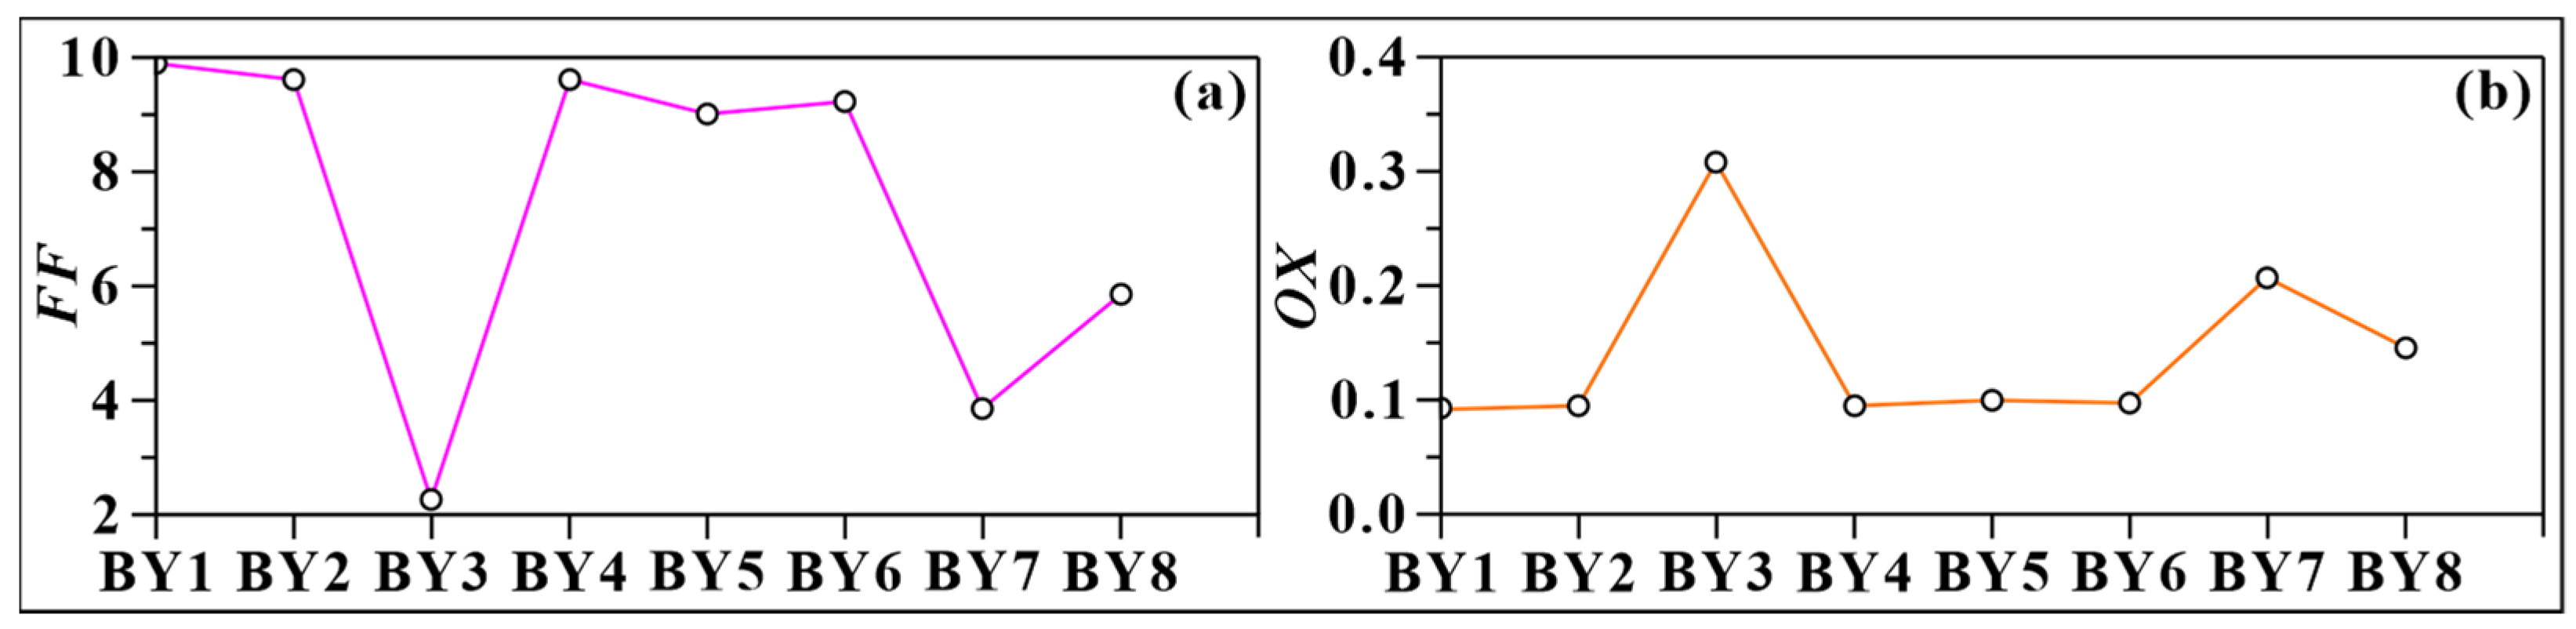
Chemical weathering is not the main mechanism of dolomite fragmentation. The fracturing of dolomite is mainly related to the original sedimentary construction and tectonics.

Author Contributions

Conceptualization, L.T., W.L. and J.Z.; methodology, J.Z.; software, H.G.; validation, L.T. and H.G.; formal analysis, L.T.; investigation, L.T. and J.Z.; resources, W.L.; writing—original draft preparation, L.T. and J.Z.; writing—review and editing, L.T. and J.Z.; visualization, H.G.; supervision, W.L.; project administration, W.L.; funding acquisition, J.Z. All authors have read and agreed to the published version of the manuscript.

Funding

This research was funded by National Nature Science Foundation of China, grant number 41807258.

Institutional Review Board Statement

Not applicable.

Informed Consent Statement

Not applicable.

Data Availability Statement

All data included in this study are available upon request by contact with the corresponding author.

Acknowledgments

The authors thank Zhiqiang Wang for his invaluable assistance in formal analysis and investigation. The authors thank Chao Yang and Qiming Zhou for their invaluable assistance in plotting figures. The authors are grateful for the technical support of Analytic & Testing Research Center of Yunnan during the SEM observations.

Conflicts of Interest

The authors declare no conflict of interest.

References

  1. Editorial Board of Geological Engineering Handbook. Geological Engineering Handbook, 5th ed.; China Construction Industry Press: Beijing, China, 2018; pp. 15–16. (In Chinese) [Google Scholar]
  2. Costamagna, E.; Oggeri, C.; Vinai, R. Damage and contour quality in rock excavations for quarrying and tunnelling: Assessment for properties and solutions for stability. IOP Conf. Ser. Earth Environ. Sci. 2021, 883, 012137. [Google Scholar] [CrossRef]
  3. Ruiz-Carulla, R.; Corominas, J.; Mavrouli, O. A fractal fragmentation model for rockfalls. Landslides 2017, 14, 875–889. [Google Scholar] [CrossRef]
  4. Ferrero, A.M.; Forlani, G.; Roncella, R.; Voyat, H.I. Advanced geostructural survey methods applied to rock mass characterization. Rock Mech. Rock Eng. 2009, 42, 631–665. [Google Scholar] [CrossRef]
  5. Han, Z.; Wang, C.; Hu, S.; Wang, Y. Application of borehole camera technology in fractured rock mass investigation of a submarine tunnel. J. Coast. Res. 2019, 83, 609–614. [Google Scholar] [CrossRef]
  6. Hong, E.S.; Lee, I.M.; Lee, J.S. Measurement of rock joint roughness by 3D scanner. Geotech. Test. J. 2006, 29, 482–489. [Google Scholar] [CrossRef]
  7. Feng, Q.H.; Röshoff, K. In-situ mapping and documentation of rock faces using a full-coverage 3d laser scanning technique. Int. J. Rock Mech. Min. Sci. 2004, 41, 139–144. [Google Scholar] [CrossRef]
  8. Ismail, A.; Safuan, A.R.A.; Sa’ari, R.; Rasib, A.W.; Mustaffar, M.; Abdullah, R.A.; Kassim, A.; Yusof, N.M.; Rahaman, N.A.; Kalatehjari, R.; et al. Application of combined terrestrial laser scanning and unmanned aerial vehicle digital photogrammetry method in high rock slope stability analysis: A case study. Measurement 2022, 195, 111161. [Google Scholar] [CrossRef]
  9. Chen, S.; Walske, M.L.; Davies, I.J. Rapid mapping and analysing rock mass discontinuities with 3D terrestrial laser scanning in the underground excavation. Int. J. Rock Mech. Min. Sci. 2018, 110, 28–35. [Google Scholar] [CrossRef]
  10. Hudson, R.; Faraj, F.; Fotopoulos, G. Review of close-range three-dimensional laser scanning of geological hand samples. Earth-Sci. Rev. 2020, 210, 103321. [Google Scholar] [CrossRef]
  11. Riquelme, A.; Cano, M.; Tomás, R.; Abellán, A. Identification of rock slope discontinuity sets from laser scanner and photogrammetric point clouds: A comparative analysis. Procedia Eng. 2017, 191, 838–845. [Google Scholar] [CrossRef]
  12. Liu, H.Y.; Kou, S.Q.; Lindqvist, P.A.; Tang, C. Numerical simulation of the rock fragmentation process induced by indenters. Int. J. Rock Mech. Min. Sci. 2002, 39, 491–505. [Google Scholar] [CrossRef]
  13. Hatzor, Y.H.; Arzi, A.A.; Zaslavsky, Y.; Shapira, A. Dynamic stability analysis of jointed rock slopes using the DDA method: King Herod’s Palace, Masada, Israel. Int. J. Rock Mech. Min. Sci. 2004, 41, 813–832. [Google Scholar] [CrossRef]
  14. Ortlepp, W.D. Observation of mining-induced faults in an intact rock mass at depth. Int. J. Rock Mech. Min. Sci. 2000, 37, 423–436. [Google Scholar] [CrossRef]
  15. Zhuang, Y.; Xing, A.; Leng, Y.; Bilal, M.; Zhang, Y.; Jin, K.; He, J. Investigation of characteristics of long runout landslides based on the multi-source data collaboration: A case study of the Shuicheng Basalt landslide in Guizhou, China. Rock Mech. Rock Eng. 2021, 54, 3783–3798. [Google Scholar] [CrossRef]
  16. Chen, Z.; Zhang, Z.L.; Wu, K. Application of single-hole and inter-hole velocity test in engineering construction. J. Geol. 2010, 34, 192–195, (In Chinese with English Abstract). [Google Scholar] [CrossRef]
  17. Warburton, P.M. Vector stability analysis of an arbitrary polyhedral rock block with any number of free faces. Int. J. Rock Mech. Min. Sci. Geomech. Abstr. 1981, 18, 415–427. [Google Scholar] [CrossRef]
  18. Yarahmadi, R.; Bagherpour, R.; Sousa, L.M.O.; Taherian, S.-G. How to determine the appropriate methods to identify the geometry of in situ rock blocks in dimension stones. Environ. Earth Sci. 2015, 74, 6779–6790. [Google Scholar] [CrossRef]
  19. Segall, P.; Pollard, D.D. Joint formation in granitic rock of the Sierra Nevada. GSA Bull. 1983, 94, 563–575. [Google Scholar] [CrossRef]
  20. Bazarnil, M. Slope stability monitoring in open pit mines using 3D terrestrial laser scanning. E3S Web Conf. 2018, 66, 01020. [Google Scholar] [CrossRef]
  21. Zingg, T. Beitrag zur Schotteranalyse. Ph.D. Thesis, ETH Zürich, Zurich, Switzerland, 1935. (In Schweizer Deutsch). [Google Scholar] [CrossRef]
  22. Masad, E.; Button, J.W. Unified imaging approach for measuring aggregate angularity and texture. Comput.-Aided Civ. Infrastruct. Eng. 2000, 15, 273–280. [Google Scholar] [CrossRef]
  23. Anochie-Boateng, J.K.; Komba, J.J.; Mvelase, G.M. Three-dimensional laser scanning technique to quantify aggregate and ballast shape properties. Constr. Build. Mater. 2013, 43, 389–398. [Google Scholar] [CrossRef]
  24. GB 50287; Code for Hydropower Engineering Geological Investigation. Ministry of Housing and Urban-Rural Construction of the People’s Republic of China: Beijing, China, 2016. (In Chinese)
  25. GB 50011; Code for Seismic Design of Buildings. Ministry of Housing and Urban-Rural Construction of the People’s Republic of China: Beijing, China, 2010. (In Chinese)
  26. Zhao, C.L.; Zhu, X.M. Sedimentary Petrology, 3rd ed.; Petroleum Industry Press: Beijing, China, 2001; pp. 50–53. (In Chinese) [Google Scholar]
  27. Xu, Z.M.; Huang, R.Q. The assessment of the weathering intensity of Emeishan basalt based on rock blocks (III): Assessment of existing chemical weathering indices. Geol. China 2013, 40, 1655–1665, (In Chinese with English Abstract). [Google Scholar] [CrossRef]
  28. Xu, Z.M.; Huang, R.Q. The assessment of the weathering intensity of Emeishan basalt based on rock blocks (IV): A proposed weathering index (FF). Geol. China 2013, 40, 1942–1948, (In Chinese with English Abstract). [Google Scholar] [CrossRef]
Figure 1. UAV photos of Yanhe domestic waste incineration power plant (YPP). The high slope lies to the north of YPP. (a) Overall photo of YPP and the slope. (b) The red circles indicate the sampling site for the test. (c) The blue arrows point to the crown and the main scarp.
Applsci 13 06970 g001
Figure 2. Flow chart shows the methods in investigation of the structural characteristics of fractured rock mass.
Applsci 13 06970 g002
Figure 3. Borehole television images of three typical borehole sections and the upper, middle, and lower parts. (ad) represent borehole ZK14, and (a) is the profile image from 1832.76 to 1834.76 m a.s.l. (eh) represents borehole ZK34 and (e) is the profile image from 1858.15 to 1860.15 m a.s.l. (il) represent borehole ZK45, and (i) is the profile image from 1839.83 to 1841.83 m a.s.l.
Applsci 13 06970 g003
Figure 4. Typical photos of drilling cores. (ac) Most of the drilling cores are highly clastic.
Applsci 13 06970 g004
Figure 5. Shear wave velocity histogram of three boreholes. (a) ZK01. (b) ZK13. (c) ZK28. The velocity is different in filled soil and dolomite.
Applsci 13 06970 g005
Figure 6. Photos showing the macro fragmentation characteristics of dolomite in an excavation profile. (a) Overall photo of dolomite and discontinuities. (bi) Detailed photos. L1–L6: six layers of muddied interbeds. J1–J3: three sets of joints. 53° ∠ 86°: dip direction ∠ dip.
Applsci 13 06970 g006
Figure 7. Pole figures and stereographic projection of discontinuities. They are divided into six sets, and the predominant direction of the dip direction is NE-SW.
Applsci 13 06970 g007
Figure 8. 3D laser scanning images of 20 blocks. They are arranged in descending order of volume, and the equivalent particle size of the largest block is about 12 cm.
Applsci 13 06970 g008
Figure 9. Changes of the morphometric variables of the blocks with volume. (a) Ratio of surface area to volume (S/V). (b) Sphericity degree (SD). (c) Shape factor (SF). (d) Ratio of block volume to the simulated volume of the best externally cut sphere of the blocks (V/V2).
Applsci 13 06970 g009
Figure 10. Zingg diagram for the scanned blocks. Subpanels I, II, III, and IV denote disc-shaped, spherical, bladed, and rod-like shapes, respectively.
Applsci 13 06970 g010
Figure 11. Changes of the 2D morphometric variables of the blocks with the cross-sectional area. (a) Form factor (ff). (b) Aspect ratio (L/W). (c) Average form factor and fractal dimension. Blue squares represent the average form factor and red triangles represent the fractal dimension.
Applsci 13 06970 g011
Figure 12. Photographs of five size classes of particles (5–0.16 mm). Their local close-up photograph was taken with a digital single-lens reflex camera equipped with macro lenses. (a,b) 0.315–0.16 mm. (c,d) 0.63–0.315 mm. (e,f) 1.25–0.63 mm. (g,h,l) 2–l.25 mm. (ik) 5–2 mm.
Applsci 13 06970 g012
Figure 13. Morphometric characteristics of blocks, as observed via scanning electron microscopy (SEM). (a) Five blocks with an equivalent diameter of about 10 cm were prepared for SEM observation. (b,c) Preparatory processes for SEM observation. The small pieces were broken from the blocks in Figure (a). (dk) Images showing the morphometric characteristics of blocks. The yellow arrows point to the trace of microfissuring.
Applsci 13 06970 g013
Figure 14. Photographs of eight size classes of particles (60–0.63 mm) used for bulk chemical analysis. (a) BY1, 60–40 mm. (b) BY2, 40–20 mm. (c) BY3, 20–10 mm. (d) BY4, 10–5 mm. (e) BY5, 5–2 mm. (f) BY6, 2–1.25 mm. (g) BY7, 1.25–0.63 mm. (h) BY8, 0.63–0.16 mm. The scale line on the black comparing rule is 5 cm in length.
Applsci 13 06970 g014
Figure 15. Irregular variation with decreasing grain size of the blocks in chemical weathering indices. (a) FF values in different size classes of particles. (b) OX values in different size classes of particles. BY1, 60–40 mm. BY2, 40–20 mm. BY3, 20–10 mm. BY4, 10–5 mm. BY5, 5–2 mm. BY6, 2–1.25 mm. BY7, 1.25–0.63 mm. BY8, 0.63–0.16 mm.
Applsci 13 06970 g015
Disclaimer/Publisher’s Note: The statements, opinions and data contained in all publications are solely those of the individual author(s) and contributor(s) and not of MDPI and/or the editor(s). MDPI and/or the editor(s) disclaim responsibility for any injury to people or property resulting from any ideas, methods, instructions or products referred to in the content.

