Article

Two-Stage Short-Term Power Load Forecasting Based on SSA–VMD and Feature Selection

School of Information and Electrical Engineering, Hebei University of Engineering, Handan 056038, China
*
Author to whom correspondence should be addressed.
Appl. Sci. 2023, 13(11), 6845; https://doi.org/10.3390/app13116845
Submission received: 21 April 2023 / Revised: 1 June 2023 / Accepted: 2 June 2023 / Published: 5 June 2023
(This article belongs to the Special Issue Advances in AI-Based (AI+) Energy and Resource Research)

Abstract

:
Short-term power load forecasting is of great significance for the reliable and safe operation of power systems. In order to improve the accuracy of short-term load forecasting, for the problems of random fluctuation in load and the complexity of load-influencing factors, this paper proposes a two-stage short-term load forecasting method, SSA–VMD-LSTM-MLR-FE (SVLM–FE) based on sparrow search algorithm (SSA), to optimize variational mode decomposition (VMD) and feature engineering (FE). Firstly, an evaluation criterion on the loss of VMD decomposition is proposed, and SSA is used to find the optimal combination of parameters for VMD under this criterion. Secondly, the first stage of forecasting is carried out, and the different components obtained from SSA–VMD are predicted separately, with the high-frequency components input to a long short-term memory network (LSTM) for forecasting and the low-frequency components input to a multiple linear regression model (MLR) for forecasting. Finally, the forecasting values of the components obtained in the first stage are input to the second stage for error correction; factors with a high degree of influence on the load are selected using the Pearson correlation coefficient (PCC) and maximal information coefficient (MIC), and the load value at the moment that has a great influence on the load value at the time to be predicted is selected using autocorrelation function (ACF). The forecasting values of the components are fused with the selected feature values to construct a vector, which is fed into the fully connected layer for forecasting. In this paper, the performance of SVLM–FE is evaluated experimentally on two datasets from two places in China. In Place 1, the RMSE, MAE, and MAPE are 128.169 MW, 102.525 MW, and 1.562%, respectively; in Place 2, the RMSE, MAE, and MAPE are 111.636 MW, 92.291 MW, and 1.426%, respectively. The experimental results show that SVLM–FE has high accuracy and stability.

1. Introduction

As a key industry to economic development, power provides a basic guarantee for social production and life. With the advantages of low pollution, high efficiency, low distribution costs and a wide range of applications, power will remain an irreplaceable source of energy for a considerable period of time in the future. With the rapid development of the electricity market, the electricity demand for social production and life is increasing, which places high demands on the production planning and scheduling of the power system. Therefore, the accuracy of short-term electricity load forecasting is very important [1], as it will enable us to ensure the reliable and economic operation of the power system [2]. However, the electricity load is a random and non-stationary series that is affected by various influencing factors, such as the time of day, weather conditions, economic indicators, etc., presenting many challenges to load forecasting [3]. With the constant development of smart grids, various distributed smart meters have been installed and configured in the power system, collecting a large amount of accurate and reliable load data, which provide the basis for short-term power load forecasting.
For the purpose of improving the accuracy of short-term load prediction, many experts have done research work on the subject. These methods mainly include traditional forecasting methods, artificial intelligence forecasting methods and hybrid forecasting methods. The traditional forecasting methods include regression analysis [4], autoregressive integrated sliding average model (ARMIA) [5,6], seasonal exponential smoothing [7], and Kalman filter [8], which are all implemented based on statistics and have the advantages of being simple and fast, with good fitting and forecasting effects on smooth curves. However, as a typical time-series forecasting problem, short-term power load prediction usually entails strong volatility in the load data, and the factors affecting the load are numerous and complex, so it is difficult to guarantee the accuracy of forecasting using traditional statistics-based forecasting methods. Experts and scholars from various countries have applied machine learning and deep neural networks (DNN) in short-term load prediction. Typical algorithms for forecasting using machine learning approaches include expert systems [9,10] and support vector regression [11,12], but expert systems do not have self-learning capabilities, and support vector regression has difficulties in handling large-scale data. In addition, random forests [13] and regression trees [14] have been used in short-term load prediction. With the development of artificial intelligence technology, artificial neural network (ANN) forecasting methods [15], deep learning methods [16] and deep belief networks (DBN) [17] have also been used in short-term load prediction in large numbers, and have achieved better forecasting results.
Aiming to more fully tap the information within the historical data of power loads and to fully consider the relevant influencing factors affecting integration within the forecasting model, many experts have proposed hybrid forecasting methods to make full use of the advantages of various forecasting methods, forming a complementary effect and further improving the accuracy of short-term load prediction. Among the hybrid prediction methods used for short-term electricity load, the combined use of convolutional neural networks (CNN) and recurrent neural networks (RNN) is a classical approach. The references [18,19] used CNNs to extract feature vectors, the reference [18] fed the processed feature vectors into a long short-term memory network (LSTM) for forecasting, and the reference [19] fed the feature vectors constructed from CNN extraction into a gated recurrent unit (GRU) for forecasting, and both models obtained high accuracy forecasting values. Both GRU and LSTM are RNN networks, and are designed to solve the problem of gradient disappearance in RNN networks. Additionally, to solve the vanishing gradient problem when predicting long sequences, reference [20] introduced an attention mechanism into RNNs. In addition, short-term load models were constructed in references [21,22] using a combination of CNN and BiLSTM, and CNN and BiGRU, respectively. In reference [23], a residual convolutional neural network (R-CNN) is used to extract the basic features of power consumption data, which is input into a multilayer long- and short-term memory network (ML-LSTM) to learn the sequence information, and finally, a fully connected layer is used for prediction. These methods are effective in improving the accuracy of short-term load prediction, but the interpretability of the forecasting models constructed based on such ideas is not strong.
Another way of thinking about hybrid models is to build a short-term forecasting model by decomposing the original load data in order to reduce their volatility, and the different components obtained from the decomposition are predicted using their own approaches, with the various methods forming complementary strengths. Wavelet decomposition is used in reference [24], but different basis functions and orders have different effects when using wavelet decomposition to deal with unstable sequences, which makes it a priori and increases the complexity of its use. The empirical mode decomposition (EMD) approach is used in references [3,25], but EMD suffers from mode confounding problems. The references [26,27,28] use an ensemble empirical mode decomposition (EEMD) approach to obtain multiple intrinsic mode functions (IMFs), with separate predictions for different IMFs. Based on this, EEMD has been improved to obtain a complete ensemble empirical mode decomposition algorithm (CEEMD), which has been used to decompose the raw load sequence and construct prediction models [29,30,31]. An EMD–mRMR–FOA–GRNN model was constructed in reference [3], where EMD was first used to decompose the raw load series into several IMFs and a residual with different frequencies, and then the correlation analysis of each IMF with features such as day type, temperature and meteorological conditions was performed using the minimal redundancy maximal relevance (mRMR). This resulted in the best feature set. Finally, the fruit fly optimization algorithm (FOA) was used to optimize the smoothing factor in the generalized regression neural network (GRNN), and the final forecast load was obtained by summing the results of all IMF forecasting values. The prediction accuracy of this model was significantly improved. In reference [27], the original load data were decomposed and reconstructed with components with similar entropy values, and the reconstructed components were fed into the LSTM for forecasting, while the hyperparameters in the LSTM were optimized using the Bayesian Optimization Algorithm (BOA).
Variational mode decomposition (VMD) is also a commonly used decomposition approach for short-term load forecasting [32,33,34], which is a completely non-recursive model that avoids the mode-confounding problems present in EMD, and has the advantage that the number of mode decompositions can be artificially determined. In reference [32], VMD decomposes the original sequence into multiple subsequences, which reduces the volatility of the raw load. CNN is used to solve the problem whereby it is difficult for GRU to extract high-dimensional characteristics of the power load, and an attention mechanism is introduced to solve the problem whereby important information cannot be emphatically weighted when the series is too long. A hybrid model based on the cuckoo search algorithm (CSA), optimizing VMD, seasonal autoregressive integrated moving average (SARIMA) and a deep belief network (DBM), is proposed in reference [33]. Firstly, VMD–CSA decomposes the original load into a number of regular and random sub-series. Secondly, SARIMA is used to forecast the regular subsequence and DBN is used to forecast the random subsequence, and finally, the prediction values of each sub-sequence are summed to result in the final prediction value. In reference [34], a hybrid prediction model based on VMD, BOA and LSTM was constructed and achieved excellent forecasting results. In view of the above advantages of VMD, VMD was chosen to be used to decompose the original load data in this paper.
In hybrid forecasting models, the artificial setting of some parameters requires a lot of experience, and makes the parameter setting task difficult, so using a swarm intelligence optimization algorithm to find the optimal parameters for the forecasting model can improve the performance of the forecasting model [35]. Reference [21] used the Grey Wolf Optimization algorithm (GWO) to obtain optimal parameter sets for CNN and BiLSTM. In reference [29], quantum dragonfly algorithm (QDA) was used in combination with SVR. In reference [36], the optimal parameters for SVR are determined using the particle swarm optimization algorithm (PSO). In reference [37], a paper manufacturer was used as the research object to collect tertiary electricity consumption data and establish a hybrid prediction model based on production information back propagation neural network (BPNN) in combination with genetic algorithm (GA) and PSO, in order to obtain more accurate forecasting values and reduce the unit power consumption of paper products. The setting of VMD parameters directly affects the subsequent forecasting effect, so this paper uses SSA to seek the optimal key parameters of VMD.
In addition, the light weight of the model is also an issue that should be considered in short-term load forecasting. A forecasting model using GRU and Random Forest (RF) is proposed in reference [38], where GRU is used to predict the electric load, while RF is used to decrease the input dimensionality of the model. The prediction model is constructed with guaranteed accuracy to achieve a lightweight model. Due to the complexity of the various factors that influence the load, directly entering all of them into the prediction model would unnecessarily increase the dimensionality of the feature vector, and would not be conducive to the accuracy of the model. Reference [39] proposes a conditional mutual information-based feature selection method to select a more effective set of input variables for the prediction model. In order to filter out most of the unrelated and redundant features, reference [40] uses the Partial Mutual Information-based filtering method. In reference [41], the Spearman rank correlation coefficient is used to quantitatively analyze the correlation between the building heating load and various variables. By feature selection engineering, the constructed forecasting model is simplified to ensure high forecasting accuracy and forecasting rate. To achieve this goal, this paper takes full consideration of the dimensionality of the feature vector when constructing the feature vector to ensure the light weight of the model. Pearson correlation analysis (PCC) and maximal information coefficient (MIC) are used to select the factors with a high degree of influence on short-term load as feature values and construct the feature vector; the autocorrelation function (ACF) is used to select the node load values that have the greatest influence on the load values of the nodes to be predicted.
The various forecasting methods mentioned above are summarized in Table 1 below.
This paper proposes a two-stage hybrid forecasting model to fully mine the information in non-linear load data, and to integrate the influencing factors into the forecasting model to improve the accuracy of short-term load forecasting. The main contributions of this paper are as follows:
(1) This paper analyses the power load characteristics and influencing factors, and summarizes the function expression of the current load with which to construct a two-stage hybrid forecasting model, which improves the interpretability of the model;
(2) An evaluation criterion for VMD decomposition applicable to the field of time-series forecasting is proposed, and SSA is used to optimize the parameters of VMD under this criterion, which reduces the randomness of setting VMD parameters by artificial experience, reduces the loss of original load data decomposition, and improves the decomposition effect;
(3) Using the optimized VMD to decompose the original load data, the high- and low-frequency components from decomposition are fed into different models for forecasting—the low-frequency components are fed into MLR for forecasting and the high-frequency components are fed into LSTM for forecasting. The trend load values over different time spans are obtained, and the first stage of forecasting is completed;
(4) Different from previous models in which the component load forecasting values were directly summed up, this paper makes error corrections to the trend load values in the second stage. PCC and MIC are used to select the relevant factors with a high degree of influence; ACF is used to select the node load values with a high influence on the load values of the nodes to be predicted. The fusion of the forecasting values in the first stage and the selected feature values by feature engineering is used to construct feature vectors, which are input into the fully connected layer for forecasting and complete the error correction in the second stage. The accuracy of the final load forecasting value obtained is effectively improved.
The rest of this paper is organized as follows. Section 2 presents the analysis of power load characteristics and influencing factors. Section 3 presents the sparrow search algorithm optimizing variational mode decomposition. Section 4 explores the proposed method. Section 5 provides an analysis and discussion of the experimental results. Section 6 concludes this paper.

2. Analysis of Power Load Characteristics and Influencing Factors

In short-term load forecasting, the current load is influenced by many complex factors in addition to its own load trend, including temperature, rainfall and relative humidity, as well as the current month, day of the week and current moment, which can be generalized as the meteorological and temporal factors. In this paper, the load of power at the current moment is summarized as Equation (1).
L ( t ) = L T ( t ) + L C ( t ) + L S ( t )
where L ( t ) is the load value at moment t ; L T ( t ) is the trend load influencing the load at moment t ; L C ( t ) is the meteorological influence on load at moment t ; and L S ( t ) is the temporal influence on load at moment t .
Load trends can be divided by time span into long-term trends, medium–long-term trends, medium–short-term trends and short-term trends. The individual trends are hidden in different load components: the longer the time reflected in the trend, the smoother the load component, which is regarded as a low-frequency component; the shorter the time reflected in the trend, the more volatile the load component is, which is regarded as a high-frequency component. In this paper, the load trend is summarized in Equation (2).
L T ( t ) = L T 1 ( t ) + L T 2 ( t ) + + L T n ( t )
where L T ( t ) is the trend load influencing the load at moment t ; L T 1 ( t ) , L T 2 ( t ) , …, L T n ( t ) are the individual trend loads; and n is the number of load components obtained by decomposition, with different components corresponding to different time spans of load trends.

3. Sparrow Search Algorithm Optimizes Variational Mode Decomposition

Due to the complexity of factors influencing power loads, the original load curve is usually highly unstable, which makes direct forecasting difficult, so that it is difficult to obtain highly accurate forecast values. Figure 1 shows the load dataset from Place 1 used in this paper, and it can be seen that the random fluctuation of the original load data is relatively strong. Therefore, the method proposed in this paper first decomposes the original load using Variational Mode Decomposition into several intrinsic mode components, and then performs forecasting.

3.1. Variational Mode Decomposition

Variational mode decomposition (VMD) is a signal decomposition algorithm, proposed by Konstantin Dragomiretskiy [42] in 2014, which was first applied in the field of communication. The algorithm uses a controlled bandwidth to avoid the problem of mode mixing. Unlike the principle of empirical mode decomposition (EMD), VMD is a completely non-recursive model, which uses iterative searching to obtain the optimal solution of the variable model to determine the center frequency and bandwidth of each component. The VMD method achieves a more robust performance in terms of sampling and noise handling compared to the EMD method.
The decomposition process of the VMD can be divided into the following steps:
Step 1—The objective of the VMD is to minimize the sum of the estimated bandwidths of each mode, with the constraint that the sum of all modes is equal to the original signal, whereby the constrained variational expression can be expressed as Equation (3).
{ min { u k } , { ω k } { k = 1 K t [ ( δ ( t ) + j π t ) * u k ( t ) ] e j ω k t 2 2 } s . t . k = 1 K u k ( t ) = f ( t )
where { u k } is the set of intrinsic mode functions obtained by decomposing the original signal f ( t ) ; { ω k } is the set of central frequencies corresponding to { u k } ; δ ( t ) is the pulse signal; K is the number of IMFs obtained by decomposing, which can be set artificially, which is one of the advantages of variational mode decomposition; ∗ is the convolution operation; f ( t ) is the original signal sequence, which in this paper represents the original electrical load data; t is the sampling moment.
Step 2—Lagrangian transformation. Introducing λ , α , the constrained problem of the constrained variational model is transformed into an unconstrained problem, which can be expressed as Equation (4).
L ( { u k } , { ω k } , λ ) = α k t [ ( δ ( t ) + j π t ) u k ( t ) ] e j ω k t 2 2 + f ( t ) k u k ( t ) 2 2 + λ ( t ) , f ( t ) k u k ( t )
where λ is the Lagrange multiplication operator, λ ( t ) is used to maintain the stringency of the constraints, and α is the quadratic penalty factor used to ensure the accuracy of signal reconstruction.
Step 3—Alternating update. Using the alternating direction multiplier method, the “saddle point” of the extended Lagrange is sought in the iterative optimization sequence to achieve effective signal separation. The formulae for its cyclic update and the termination conditions are shown in Equations (5)–(7):
k u ^ k n + 1 u ^ k n 2 2 u ^ k n 2 2 < ε , n < N
The updated formula for the IMF:
u ^ k n + 1 ( ω ) = f ^ ( ω ) i k u ^ i ( ω ) + λ ^ ( ω ) 2 1 + 2 α ( ω ω k ) 2
Update formula for central frequency:
ω k n + 1 = 0 ω | u ^ k ( ω ) | 2 d ω 0 | u ^ k ( ω ) | 2 d ω
where u ^ k n + 1 ( ω ) is the Navier filtering corresponding to each mode function; n is the number of iterations and N is the maximum number of iterations; ω is the frequency value; f ^ ( ω ) and λ ^ ( ω ) represent the Fourier transforms of f ( t ) and λ ( t ) , respectively; ω k n + 1 is the central frequency of each mode function.
VMD has the advantage that the number of IMFs can be determined, while the setting of important parameters such as the number of mode decompositions K directly determines the decomposition effectiveness of the VMD. When dealing with time series data, the parameters are selected mainly through the experimenters’ experience and spectral analysis. Setting parameters through experience is more random, and lacks sufficient theoretical support. In addition, because of the complex types of power consumption of various customers in the grid and the factors influencing the load quantity at the same time, the power load value itself has strong volatility, and the results of setting parameters through spectrum analysis are often poor. Therefore, a solution is proposed in this paper using the sparrow search algorithm (SSA) to determine the optimal combination of the number of mode decompositions K and the penalty factor α .

3.2. Sparrow Search Algorithm

The swarm intelligence optimization algorithm is a computational model of optimization inspired by the behavioral patterns of biological populations and obtained through the artificial work of simulation and abstraction, which can be used for solving optimization problems, distributed problems, etc. It is often used in combination with machine learning and deep neural network models, and is a good way to improve the precision of time series prediction. SSA is a novel swarm intelligence optimization algorithm, proposed by Xue et al. [43] in 2020, and was mainly inspired by the foraging and anti-predatory behavior of sparrow populations. SSA is characterized by a strong merit-seeking ability, fast convergence and good robustness. As such, this paper proposes a method to find the optimal combination of parameters K and α for VMD using SSA.
In the simulation of sparrow foraging, the sparrows are divided into searchers and followers. As the leader of the group, the searchers have a larger foraging range than the followers, and are able to find better food; individuals outside the searchers are defined as followers; at the same time, an early warning mechanism is added to the foraging process, with a certain proportion of individuals selected to warn of danger and to give up food immediately if danger is detected.
Searcher location update formula:
x i , j t + 1 = { x i , j t   ·   exp ( i σ   ·   i t e r max ) , R 2 < S T x i , j t + β   ·   L , R 2 S T
where x i , j t + 1 is the position of the j dimension of the i individual in the t + 1 generation population; σ is a random number that follows a standard uniform distribution; β is a random number that follows a standard normal distribution; R 2 is a safety value and follows a standard uniform distribution in the range of R 2 [ 0 , 1 ] ; S T is a warning threshold in the range of S T [ 0.5 , 1 ] . When R 2 S T , the searchers will move randomly around the current position according to the normal distribution such that their values converges to the optimal position.
Follower position update formula:
x i , j t + 1 = { Q   ·   exp ( x ω , j t x i , j t i 2 ) , i > n 2 X p t + 1 + | X i , j t X p t + 1 |   ·   A +   ·   L , i n 2
where X p t + 1 is the optimal position of the t + 1 generation of followers; x ω , j t is the worst position; A is a matrix of 1 × d with elements randomly assigned to 1 or −1, and A + = A T ( AA T ) 1 . The formula can be visualized as the follower finding a position near the current optimal position, and the variance from the optimal position will become smaller in each dimension.
Vigilantes’ location update formula:
x i , j t + 1 = { x b i , j t + β   ·   ( x i , j t x b i , j t ) , f i f g x i , j t + K   ·   ( x i , j t x w i , j t | f i f ω | + ε ) , f i = f g
where x b i , j t is the optimal position of the vigilantes in the t generation; x w i , j t is the worst position; f i is the adaptation of the current sparrow; f g and f ω are the global optimal adaptation and the worst adaptation, respectively; β is a random number that follows a standard normal distribution; K is a uniform random number of [ 1 , 1 ] . When the vigilante is at the current optimal position, it will change position, and the distance it moves depends on the ratio of the distance from the worst position to the difference in fitness; when the vigilante is not in the current optimal position, it will move to the vicinity of the current optimal position.
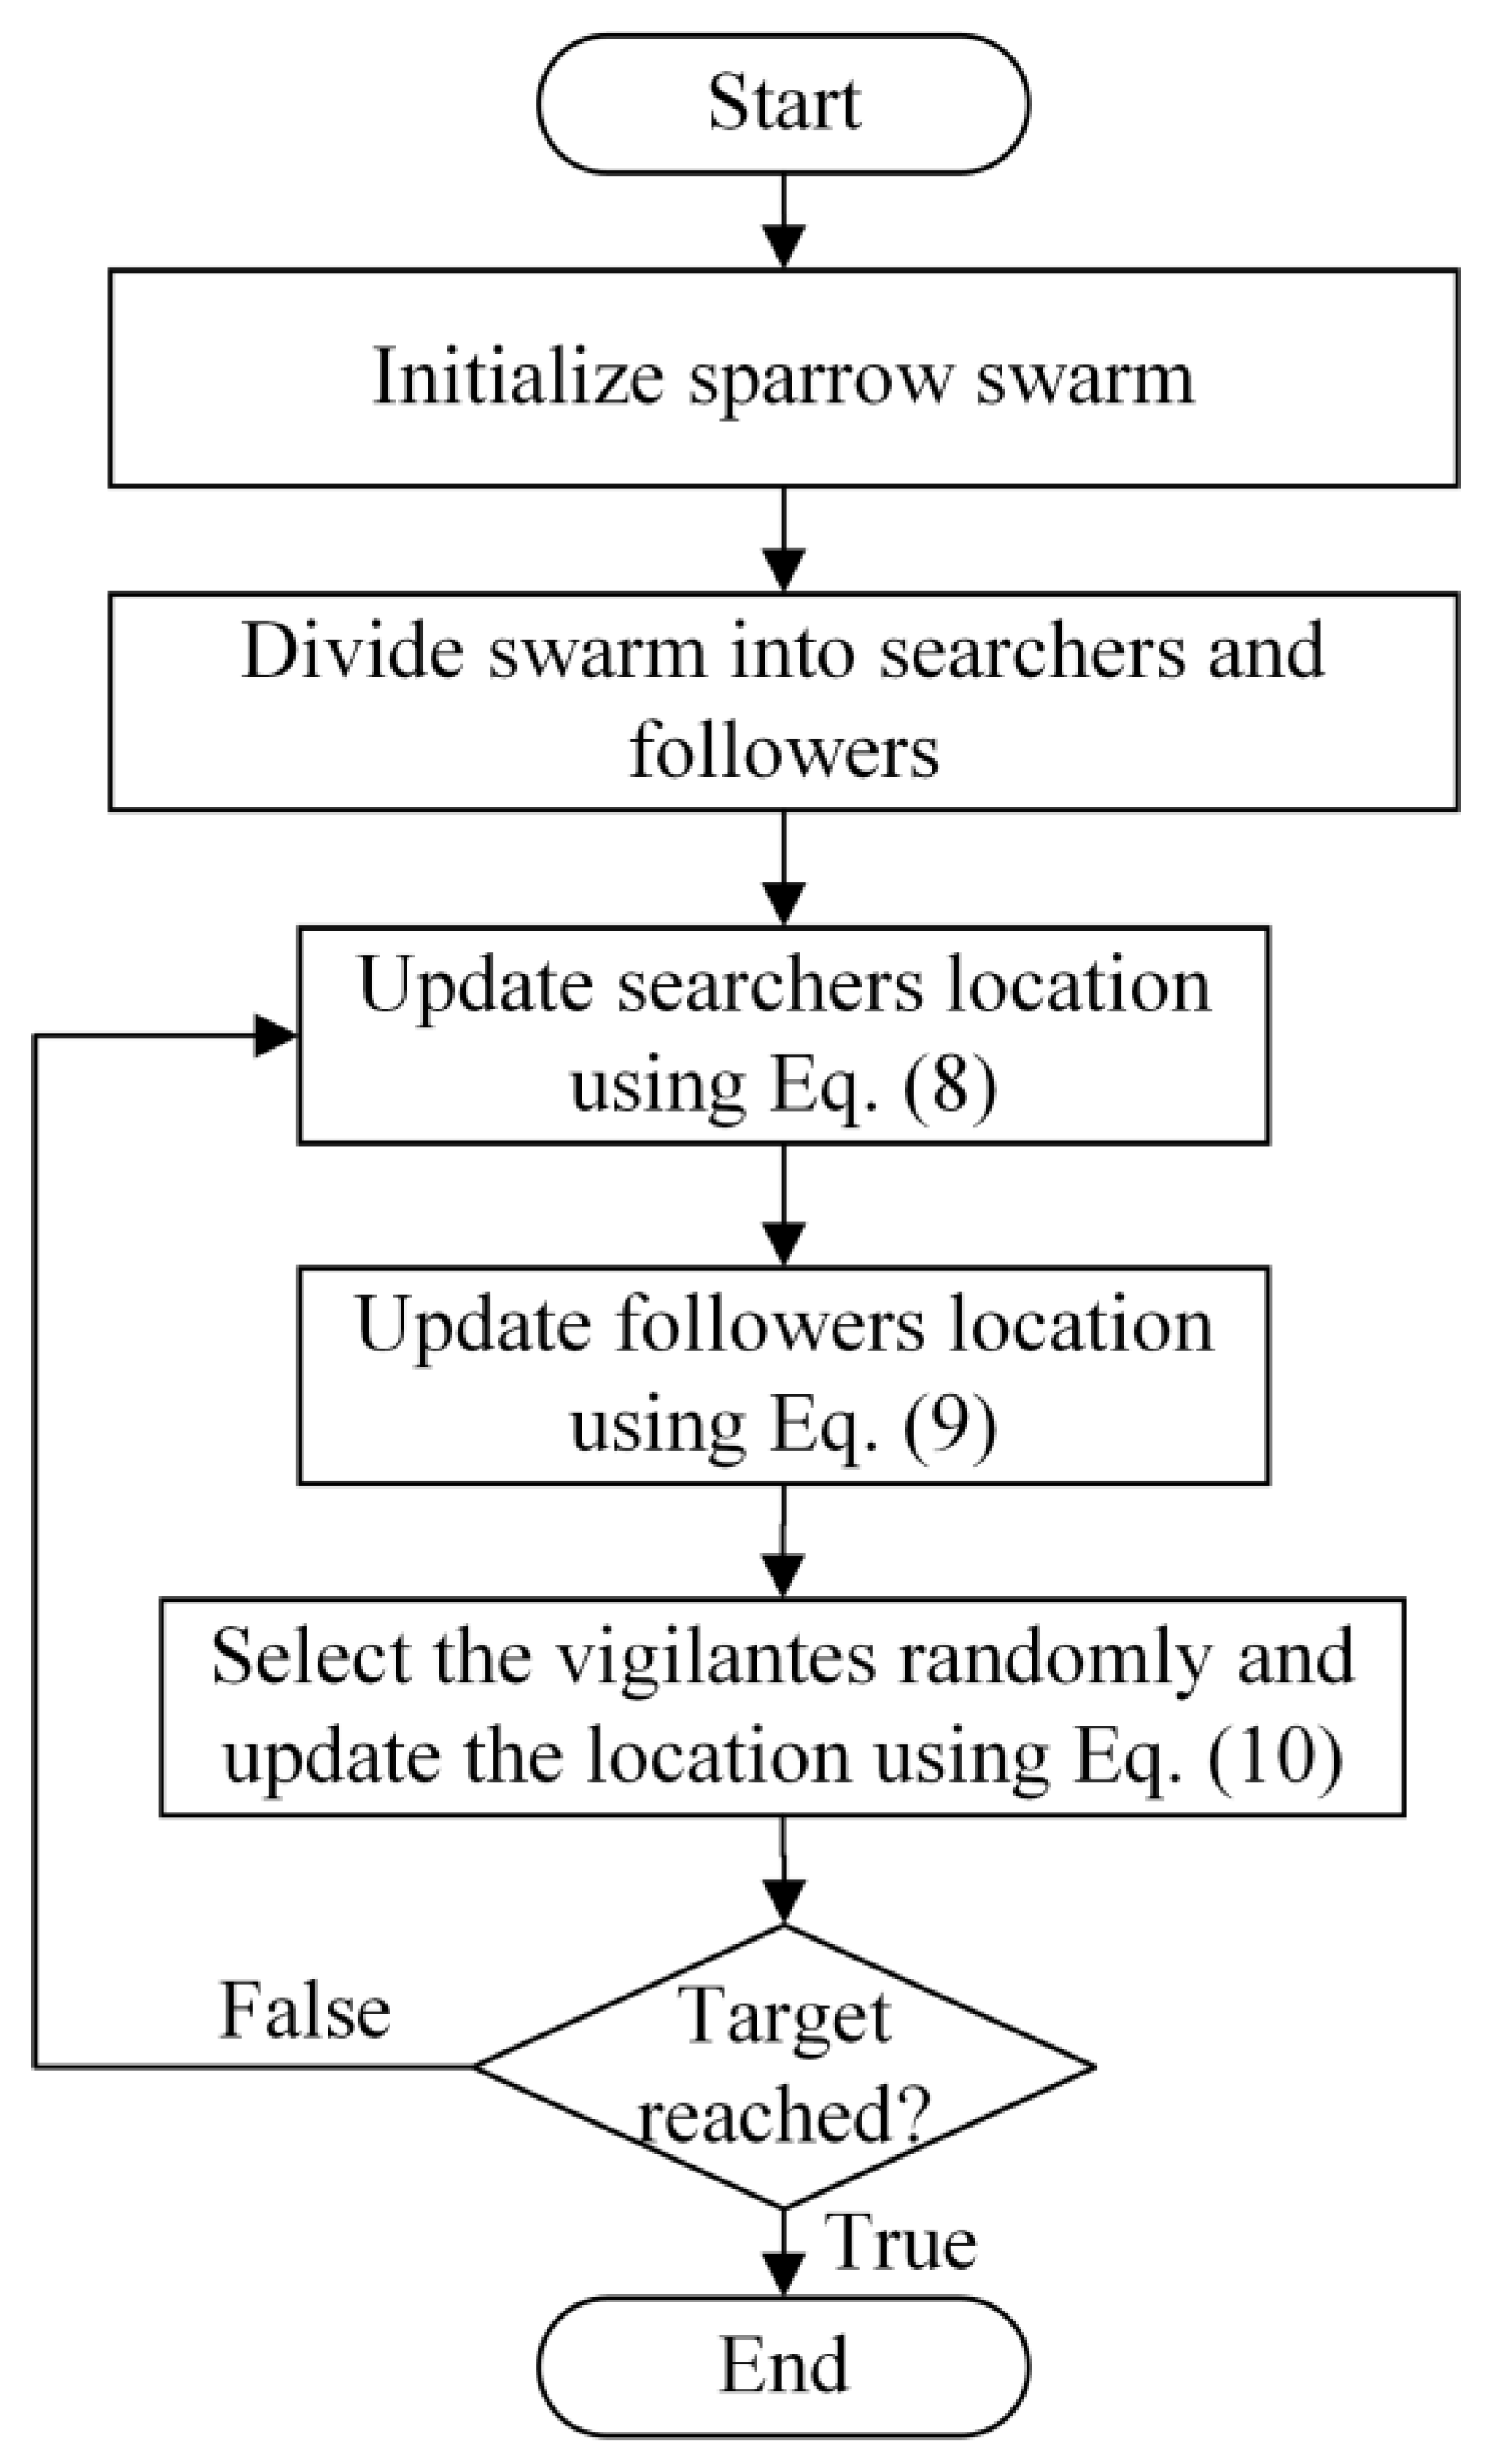
The flow chart of SSA is shown in Figure 2.

3.3. SSA Optimizes the Parameters of the VMD

3.3.1. Decomposition Evaluation Criteria for VMD

In this paper, the VMD algorithm is considered as a function f v m d ( ) , and the effect of decomposition mainly depends on the number of decomposition modes K and the quadratic penalty factor α , so the decomposition and reconstruction process of VMD is represented in this paper as Equations (11) and (12).
{ u k ( t ) | k = 1 , 2 , , K ;   t = 1 , 2 , , T } = f v m d ( f ( t ) , K , α )
f ( t ) = k = 1 K u k ( t )
where f ( t ) is the original power load value; f ( t ) is the reconstructed load value; T is the length of time; K is the number of decompositions modes; and α is the quadratic penalty factor.
It is obvious from the basic principles of VMD that a certain amount of decomposition loss is usually generated in the decomposition process. The decomposition loss comes from the residual signal that does not conform to the definition of the intrinsic mode function. It is characterized by small amplitude and fast fluctuation, making the forecasting work difficult. Hence, if the decomposition residual is large, it directly affects the precision of power load prediction. Therefore, in order to minimize the decomposition residuals, this paper proposes a decomposition evaluation criterion L o s s for VMD, which can be applied to the signal decomposition quality problem in the field of time series forecasting. L o s s is expressed as Equation (13).
L o s s = t = 1 T | f ( t ) f ( t ) | T
L o s s represents the mean absolute error between the VMD-reconstructed load values and the original load values. The smaller this value is, the smaller the decomposition loss is, so the more complete the information contained in each IMF is, and the more accurate the final forecasting value will be. At the same time, in order to minimize the loss of effective information, the decomposition residuals are also considered in the forecasting model in this paper, which is involved in the forecasting process as an IMF.

3.3.2. SSA–VMD

The detailed steps of the SSA-optimized VMD algorithm proposed in this paper are as follows:
Step 1—Input the original power load sequence f ( t ) ;
Step 2—Set the sparrow population size to n p , the maximum number of iterations to i t e r max , the number of searchers to d N u m and the number of vigilantes to g N u m ;
Step 3—Initialize the population. Set the optimality dimension as 2, which shows that each individual in the sparrow population contains a number of IMF K and a penalty factor α . Different individuals contain different combinations [ K , α ] . The goal of the optimality search is to obtain the optimal combination of parameters [ K 0 , α 0 ] ;
Step 4—According to the fitness function, according to Equations (8) and (9), update the positions of searchers and followers; select a random portion of sparrows and update the positions according to Equation (10). The global optimal individual and the optimal fitness under the current population are retained. The fitness is L o s s and is calculated as in Equation (13). At the end of the iteration, the fitness values are calculated for the individuals in different positions.
Step 5—Determine whether the preset maximum number of iterations i t e r max is reached—if not, repeat Step 4. If it is satisfied, the global optimal individual and the optimal fitness are output. At this point, the global optimal individual is the optimal decomposition parameter of VMD decomposition, and the optimal fitness is the minimum decomposition loss.

4. Load Forecasting Methodology

4.1. Long Short-Term Memory

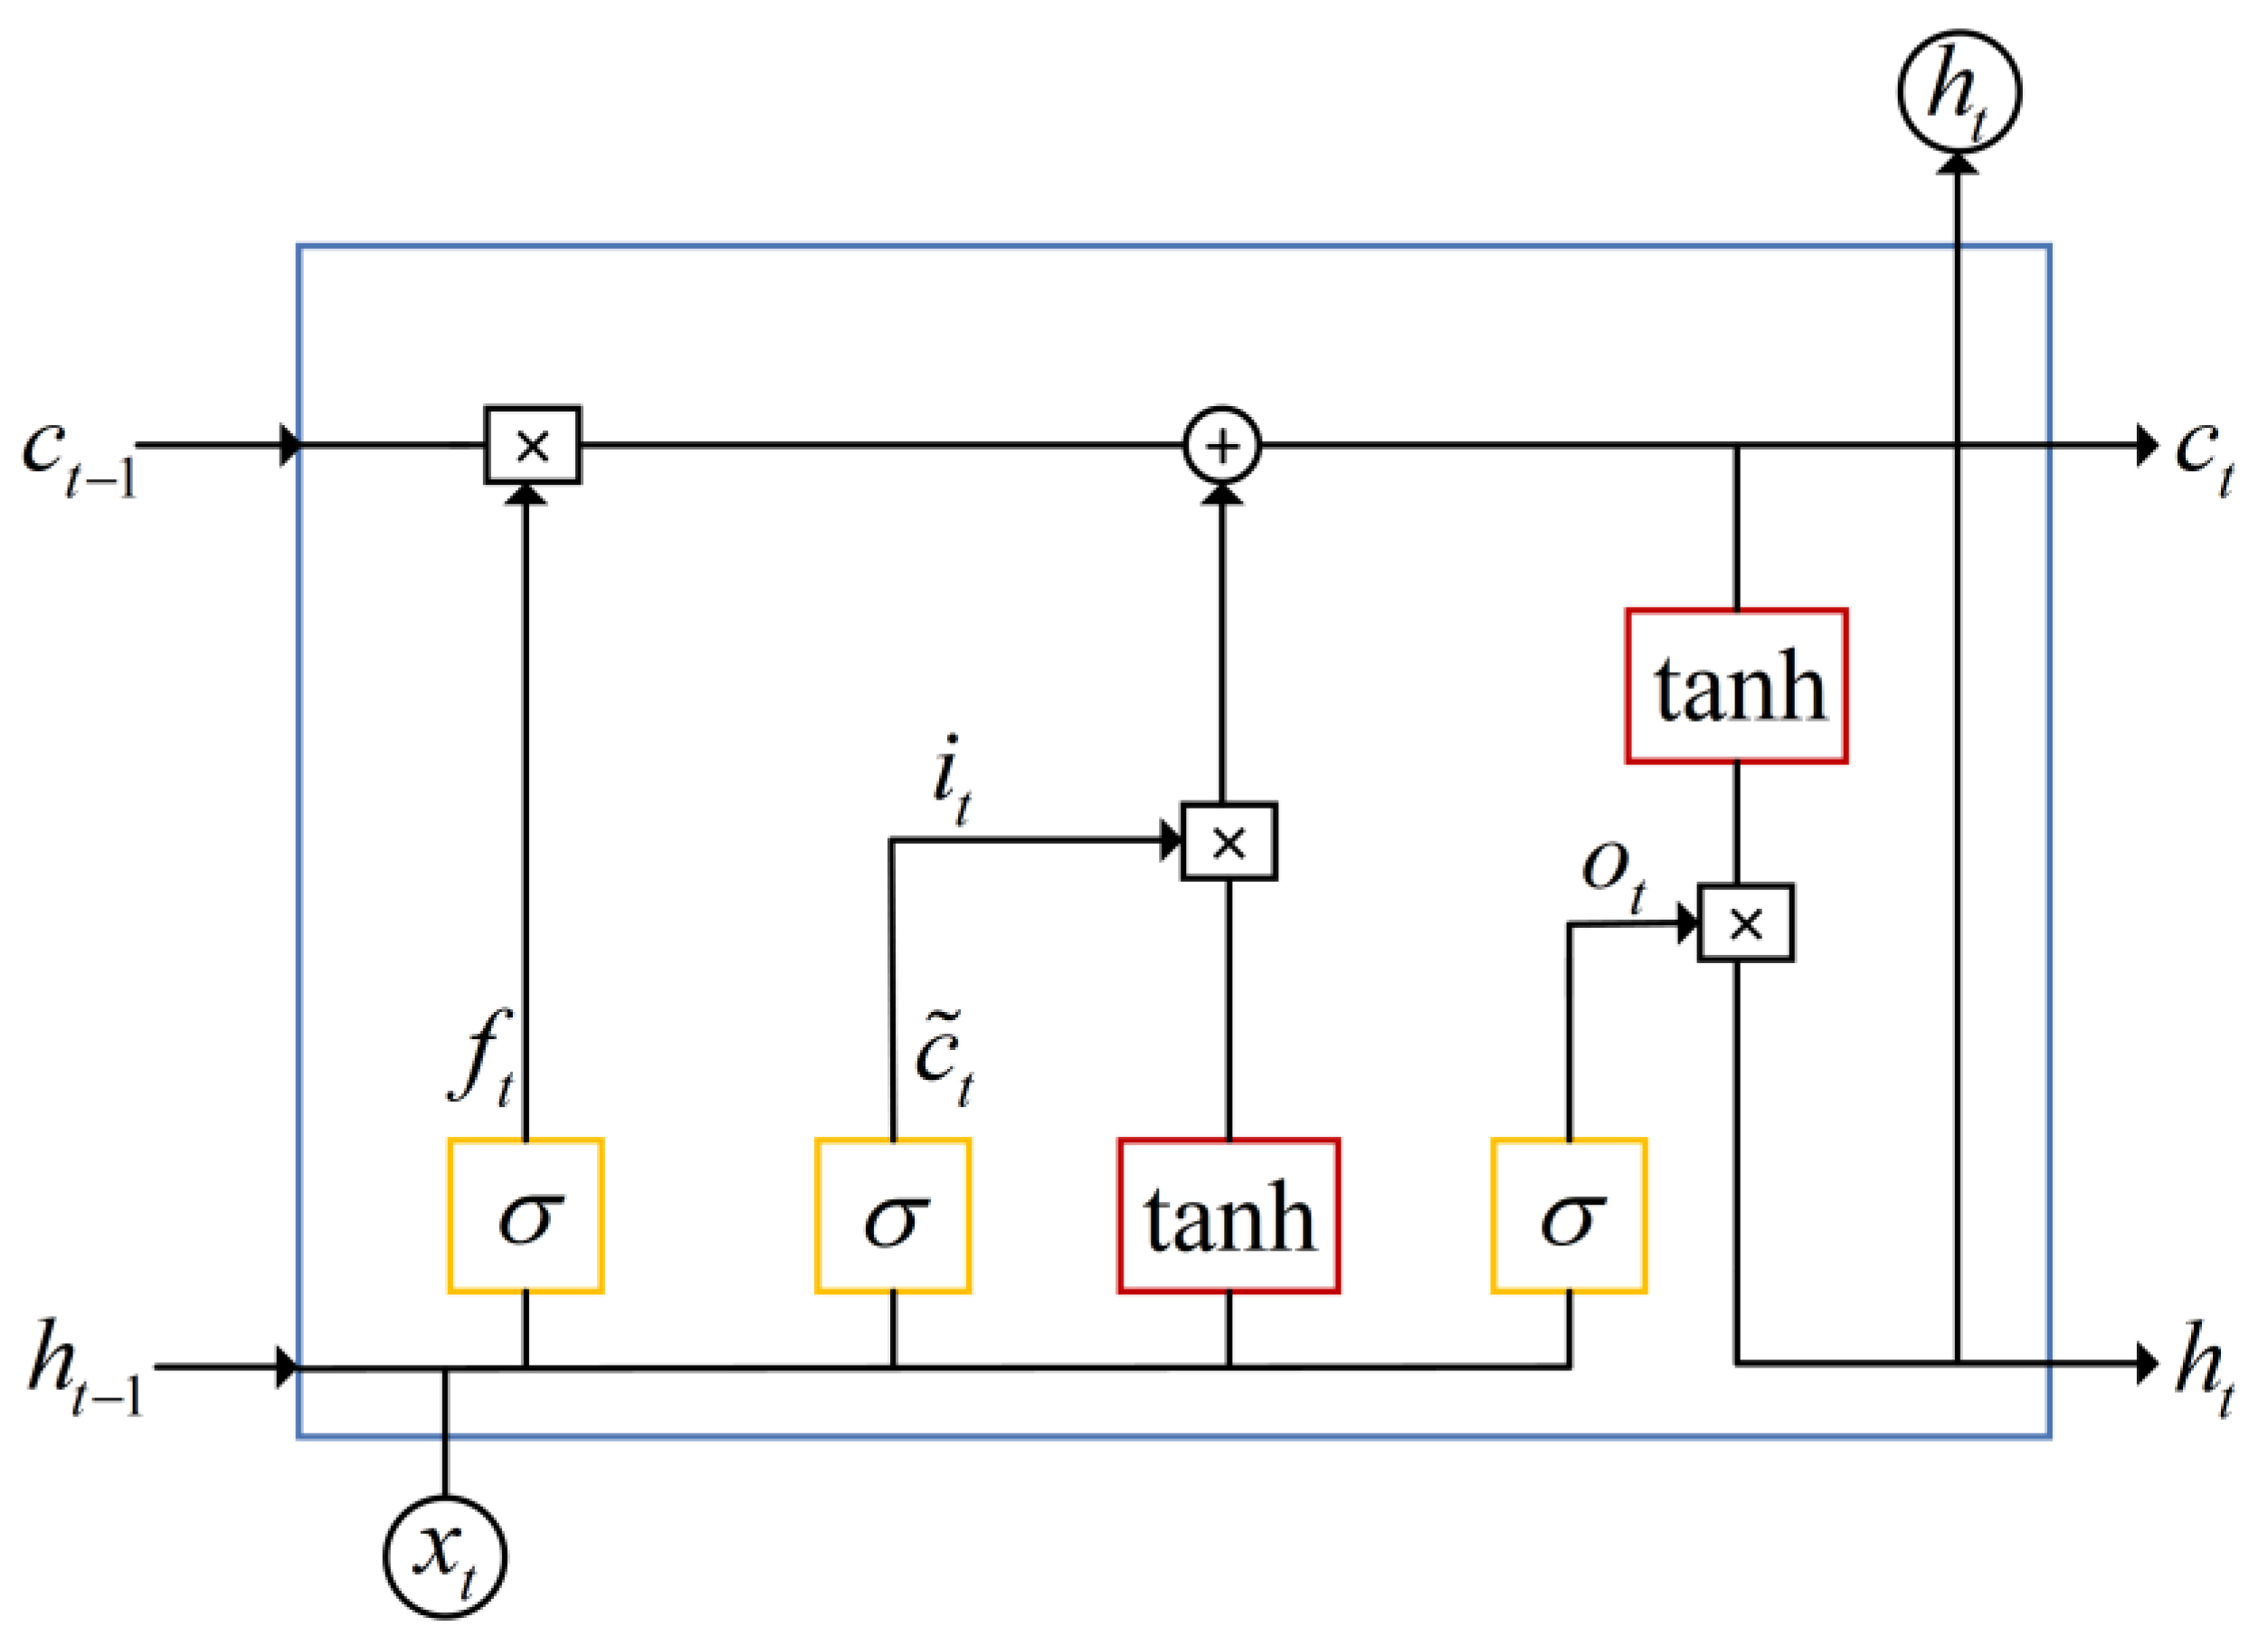
The forecasting method proposed in this paper uses a long short-term memory neural network [44]. LSTM networks are commonly used to deal with time series problems. Compared to the traditional Recurrent Neural Network, LSTM adds the gating mechanism to the RNN. There are three gates in the LSTM, the forgetting gate, the input gate and the output gate. The forgetting gate is used to control how much information needs to be forgotten about the internal state at the last moment, the input gate is used to control how much information needs to be saved about the candidate state at the current moment, and the output gate is used to control how much information has to be output from the current cellular memory to the external state (the current hidden layer state). The internal structure is shown in Figure 3.
In the internal structure of the LSTM, f t is the forgetting gate, which uses the s i g m o i d activation function to control the value between ( 0 , 1 ) by controlling the size of the gate to determine how much previous information is forgotten.
f t = σ ( W f · [ h t 1 , x t ] + b f )
i t is the input gate, which also uses the s i g m o i d activation function. It is used to filter the information about the current candidate state and keep the useful information.
i t = σ ( W i · [ h t 1 , x t ] + b i )
o t is the output gate, which also uses the s i g m o i d activation function. It is used to output the last retained information as the current moment in time of the hidden layer.
o t = σ ( W o · [ h t 1 , x t ] + b o )
c ˜ t is the candidate cell memory, determined by the last moment of the hidden layer transitions h t 1 and the current moment of the input x t , and the activation function is the tanh function.
c ˜ t = tanh ( W c · [ h t 1 , x t ] + b c )
c t is the current cellular memory, which is determined by the cell’s last moment of memory and candidate state, and is controlled by the forgetting gate and the input gate, which control what data is left behind.
c t = f t c t 1 + i t c ˜ t
h t is the output of the memory cell for the next moment, which is the cryptic state.
h t = o t tanh ( c t )
The LSTM network solves the long-range problems of gradient disappearance and gradient explosion in traditional RNNs through the design of three gates: the forgetting gate, the input gate and the output gate. In the forecasting method proposed in this paper, the high-frequency components obtained from VMD decomposition are fed into the LSTM network to obtain the components’ forecasting values, which provide the feature values for the later model fusion.

4.2. Multiple Linear Regression

The original power load is decomposed using a VMD optimized by SSA to obtain multiple IMFs, of which the low-frequency ones are fed into the MLR for forecasting to obtain the forecasting values for that component. MLR is a traditional statistical analytics-based forecasting method that, in contrast to back-propagation neural network (BPNN), does not require iterative training and parameter tuning. Compared with the back-propagation neural network (BPNN), it does not require iterative training and parameter adjustment, and thus has a fast execution speed. At the same time, MLR is able to accurately fit highly periodic and smooth load curves with high forecasting accuracy. Among the mode components obtained by the SSA–VMD algorithm, the low frequency component is relatively stable, which contains the periodic and long-term patterns in power load. Considering the accuracy and rapidity of MLR in forecasting smooth sequences, the method proposed in this paper uses MLR to forecast low-frequency components. However, for non-smooth sequences, the forecasting effect of MLR is poor. Therefore, for the high-frequency components obtained from VMD decomposition, this paper uses LSTM for forecasting. The MLR model is expressed as follows:
Y = X × β + μ
[ y 1 y 2 y n ] = [ 1 x 11 x 1 n 1 x 21 x 2 n 1 x n 1 x n n ] × [ β 0 β 1 β n ] + [ μ 1 μ 2 μ n ]
where y i represents the value of the electrical load; x i j represents the various factors influencing the load, which are the historical load values in the low-frequency component in this method; β 0 represents the constant term; β i ( i = 1 , 2 , , n ) represents the regression coefficient; and μ i represents the random fluctuations.
The regression parameters are evaluated using the least squares method to determine the regression parameters and obtain a forecasting model.
β ^ = ( X X ) 1 X Y

4.3. Feature Selection

4.3.1. Pearson Correlation Coefficient

Pearson correlation analysis is used in this method. The Pearson correlation coefficient captures the degree of correlation between the two variables X , Y and is calculated as follows:
ρ X , Y = E ( X Y ) E ( X ) E ( Y ) E ( X 2 ) ( E ( X ) ) 2 E ( Y 2 ) ( E ( Y ) ) 2
when the correlation coefficient is 0, the two variables X , Y are not correlated; when the correlation coefficient is ( 0 , 1 ] , the two variables X , Y are positively correlated; when the correlation coefficient is [ 1 , 0 ) , the two variables X , Y are negatively correlated. The stronger the correlation between A and B, the larger the absolute value of PCC, as shown in the range of coefficients and the degree of correlation in Table 2.
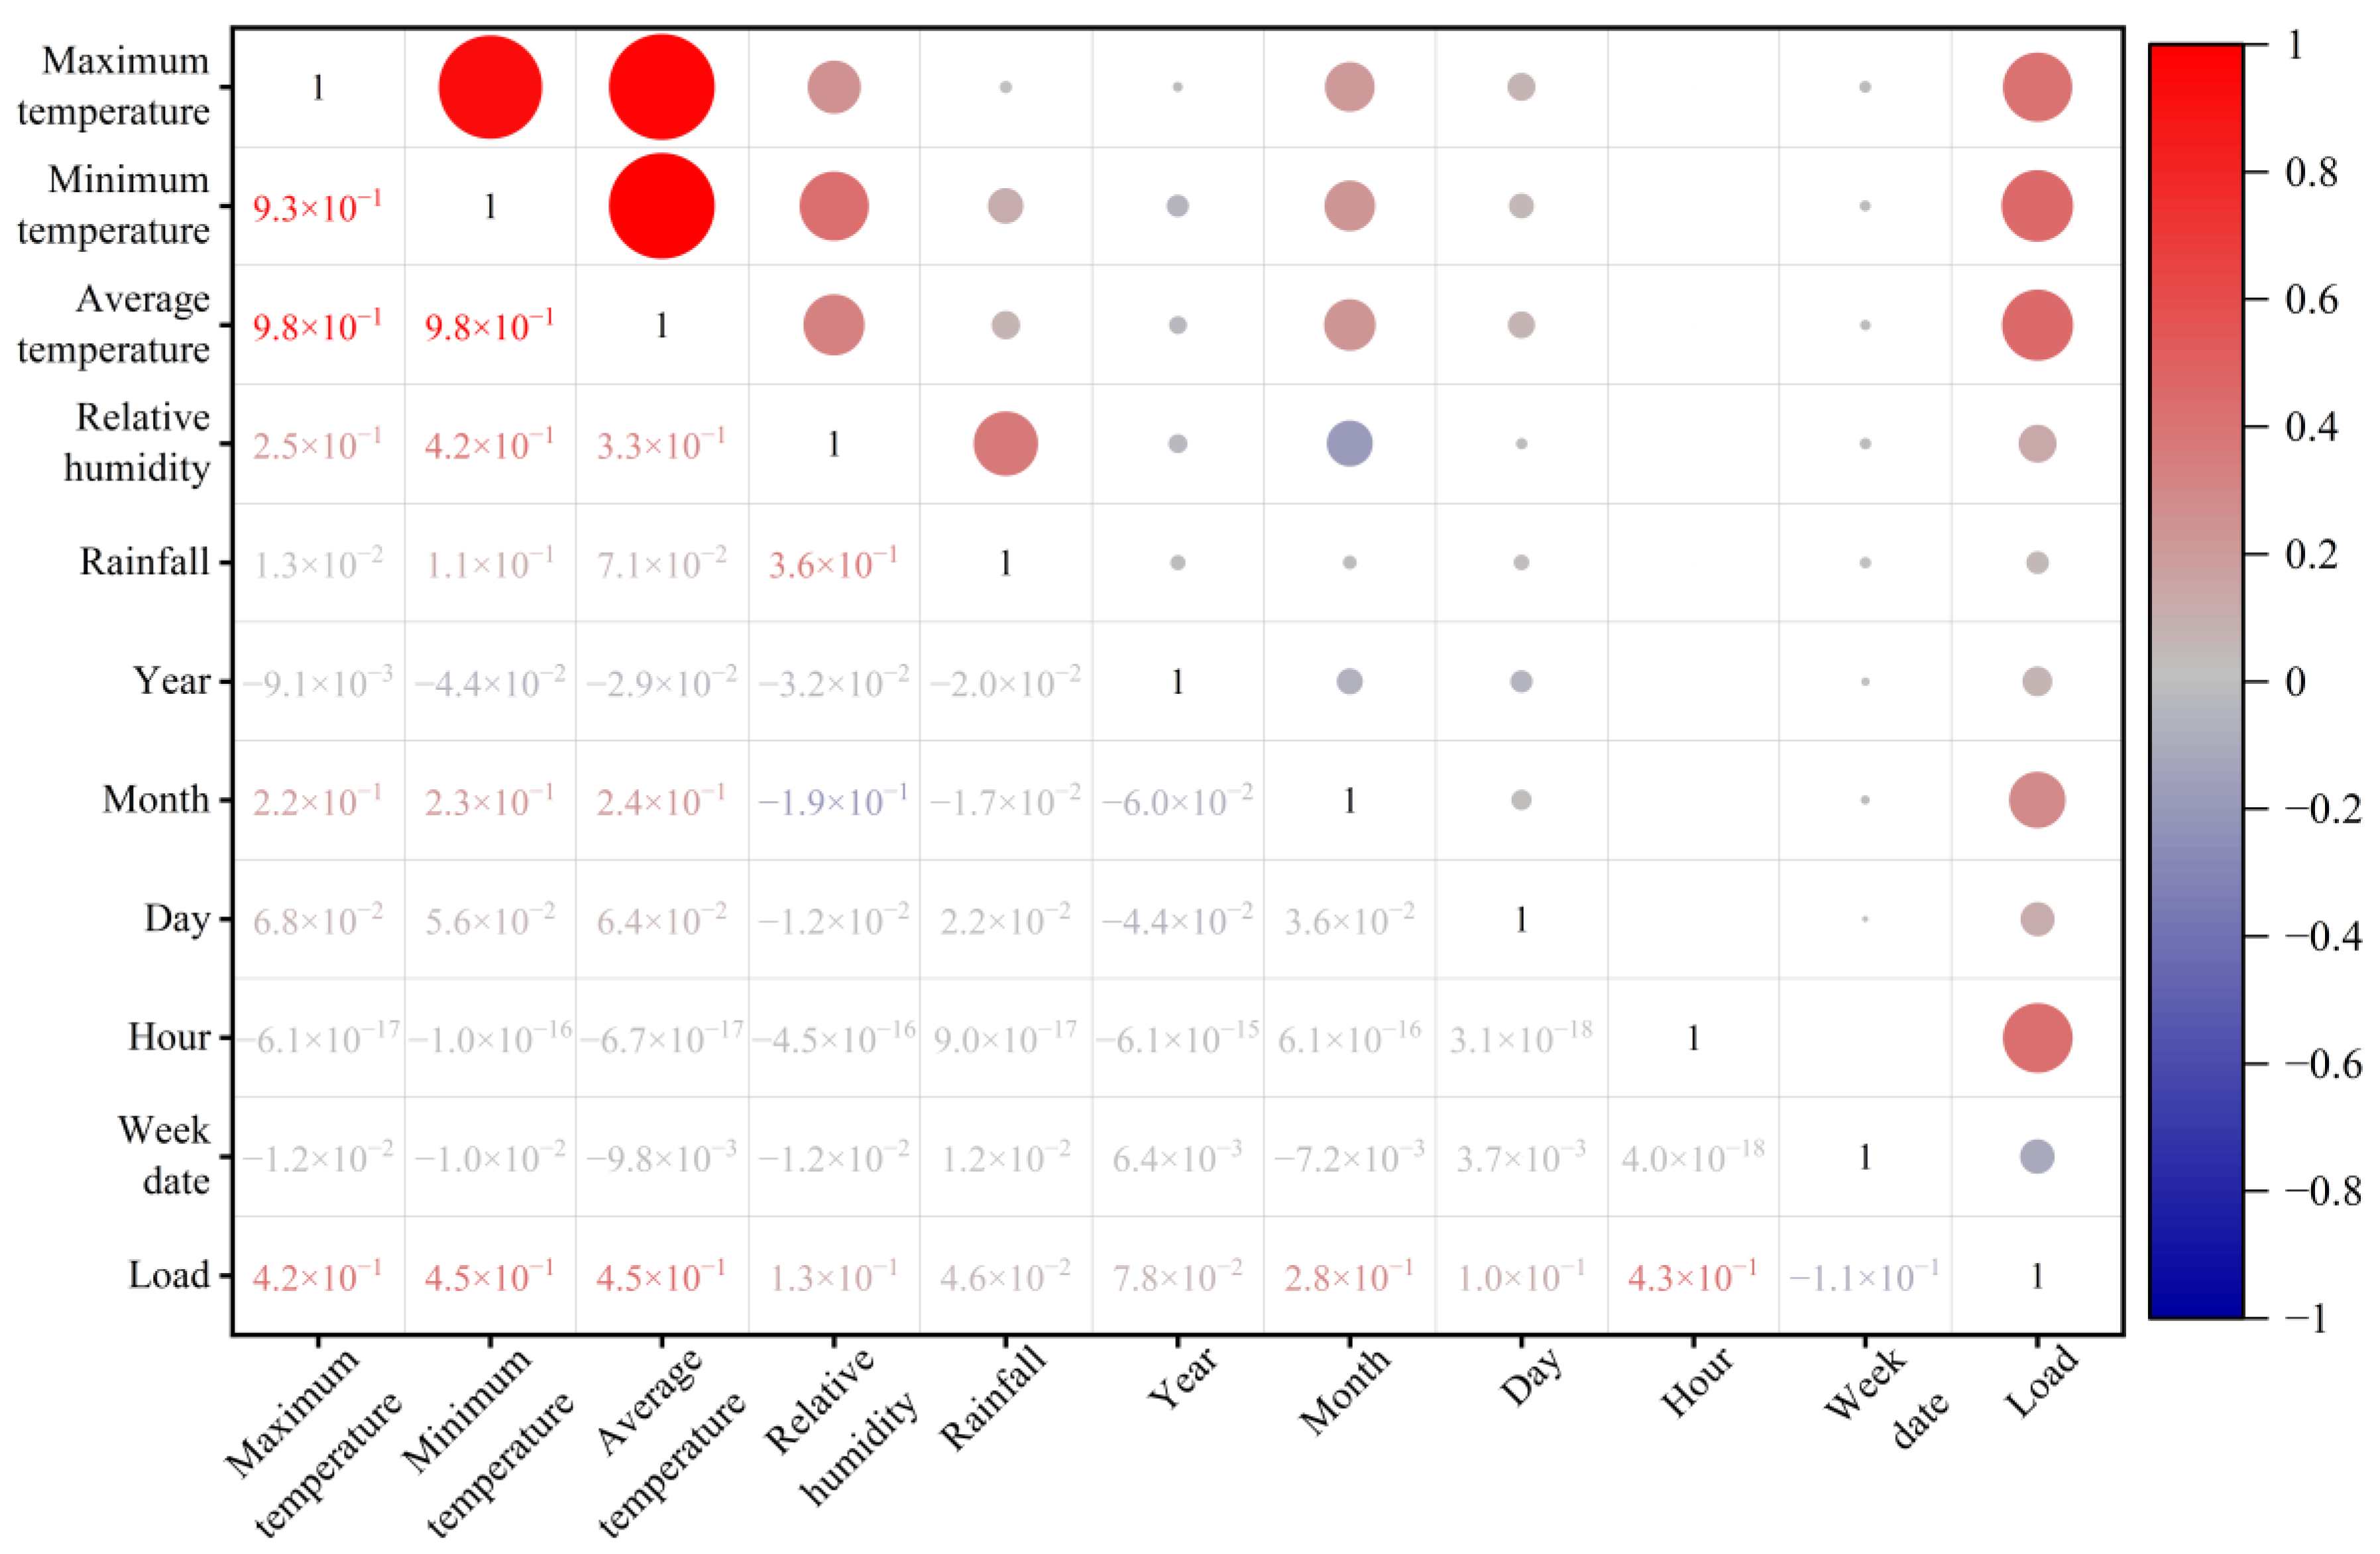
In this paper, PCC values between the characteristic sequences of influencing factors and the power load sequences are calculated, which indicates the degree of influence of these factors on the power load. The sequence of influencing factors with a high degree of correlation is used as the feature values and input into the second stage of the model in this paper for forecasting.
In the case of the calculations undertaken in this paper, the Pearson correlation analysis heat map of the power load and the influencing factors for Place 1 is shown in Figure 4.

4.3.2. Maximal Information Coefficient

The Maximal Information Coefficient [45] was first proposed in 2011; it can not only measure whether there is a linear relationship between two variables, but it can also observe whether there is a non-linear relationship between the variables, such as sinusoidal and periodicity. MIC also has better robustness for samples containing noise. MIC values range from 0 to 1, with larger MIC values indicating a higher degree of association between the two variables. MIC is developed upon Mutual Information (MI), and the MI between variables can be expressed as in Equation (24):
I ( x ; y ) = p ( x , y ) log 2 p ( x , y ) p ( x ) p ( y ) d x d y
where p ( x , y ) represents the joint probability density of X , Y ; p ( x ) and p ( y ) represent the edge probability density of X and Y , respectively.
A grid division is performed on the scatter plot of variables X , Y , and the mutual information between the grids is calculated to obtain the maximum MI value, which is normalized to obtain the final MIC value. The calculation is shown in Equation (25),
M I C ( x ; y ) = max a * b < B ( n ) I ( x ; y ) log 2 min ( a , b )
where a and b are the numbers of grids divided in the direction of X , Y , respectively. n is the amount of data, which represents the number of historical load nodes in this paper. B ( n ) is a function on n , and this paper set B ( n ) = n 0.6 .

4.3.3. Autocorrelation Function

Autocorrelation Function is a function that describes the degree of correlation between different moments in a random sequence. The formula for calculating the autocorrelation function is as follows:
R ( τ ) = + x ( t ) x ( t + τ ) d t
where t is the current moment; τ is the time lag.
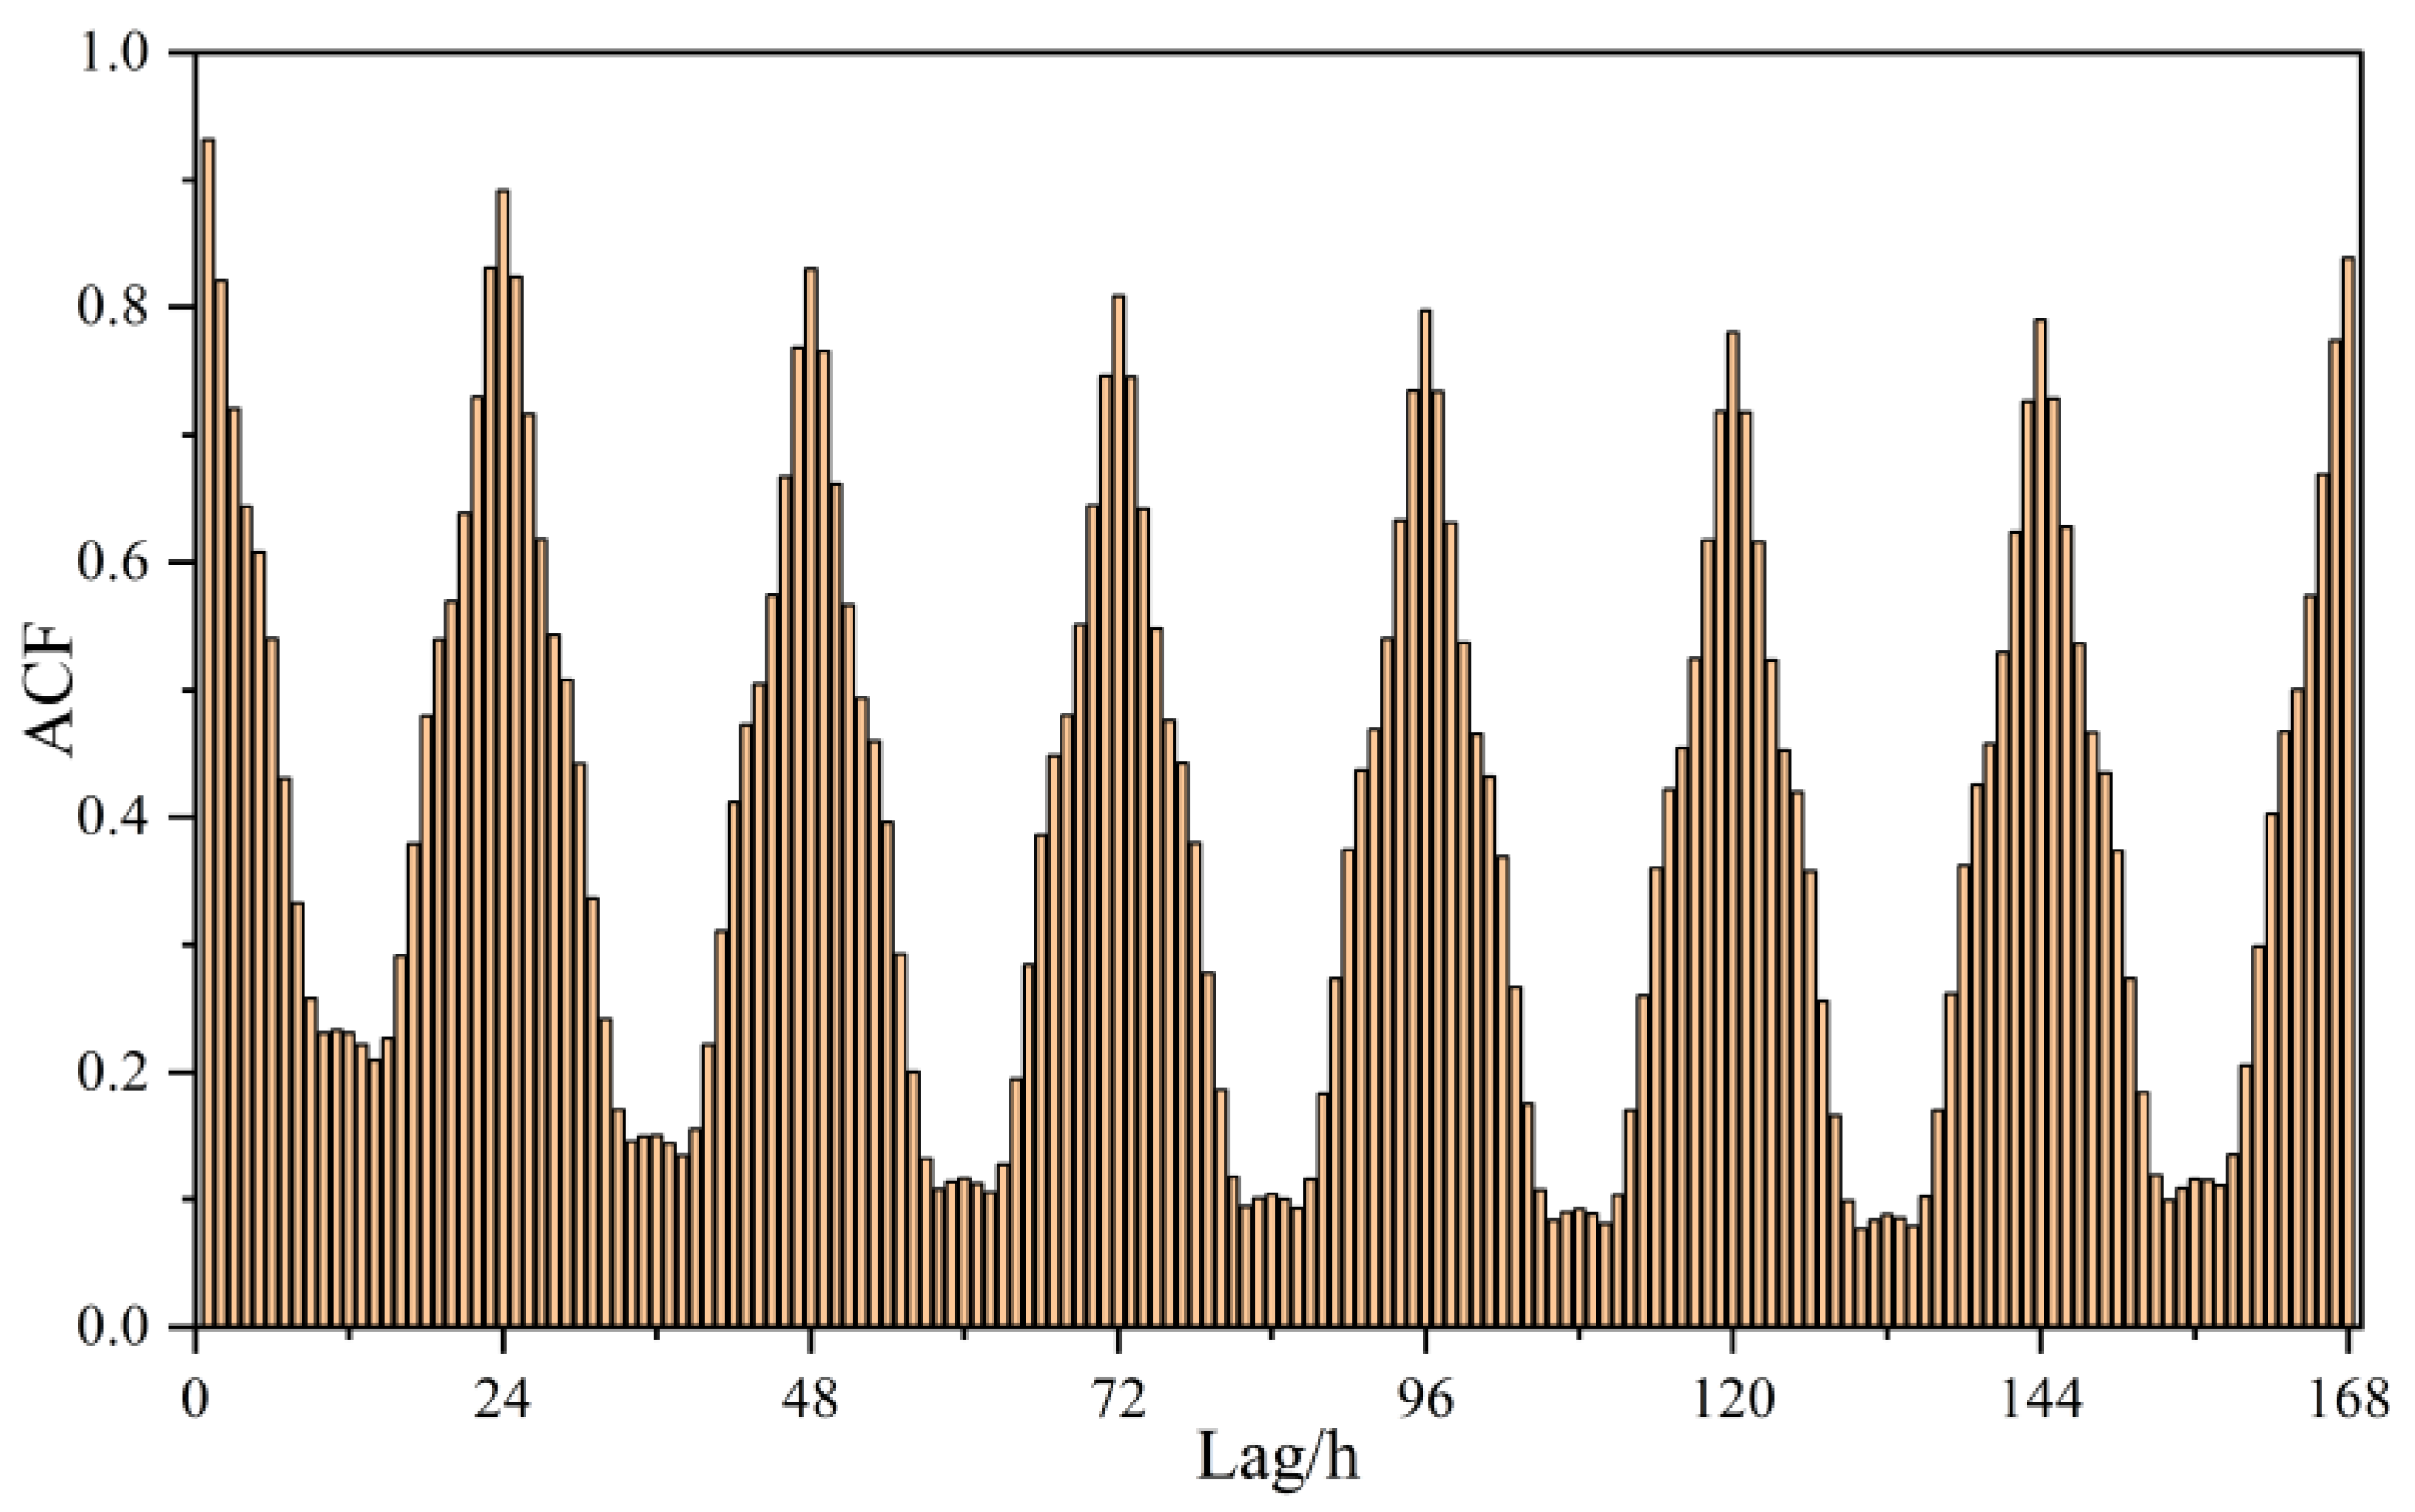
ACF is a time-shifted even function that can detect periodic components in non-stationary series. Therefore, in the short-term load forecasting undertaken in this paper, when performing the feature selection work, the load values of moments with high influence on the current moment are selected by calculating the ACF function, and these are involved in the construction of the feature vector as feature values.
The graph of the ACF analysis of Place 1 is shown in Figure 5. It can be seen from this graph of the power load that there are several moments with large ACF values. In order to ensure a more lightweight construction of the feature vectors, the top eight ACF values of Place 1 are listed in Table 3.
After the analyses of ACF shown in Figure 5 and Table 3, it is found that there are eight lag moments at time t, which have strong autocorrelation with the current load. At the same time, ACF is a time-shifted even function, which is axisymmetric. Therefore, the autocorrelation between the load values at moments t 1 , t 2 , t 23 , t 24 , t 25 , t 48 , t 72 and t 168 and the moment to be predicted is strong. In addition, considering that in the two-stage hybrid forecasting model of this paper, the load values of the four moments t 1 , t 2 , t 23 and t 24 have already been input into the first stage of forecasting, in order to avoid the duplication of data input (which would increase redundancy) and unnecessary increases in feature dimensions. The proposed method only inputs the load values of the four moments t 25 , t 48 , t 72 and t 168 into the fully connected layer as the feature values for the second stage of the model.

4.4. Fully Connected Layer

The PCC and MIC between the load values and the influencing factors of the used case were calculated, as shown in Table 4. The influencing factors with strong correlation were selected. The maximum temperature, minimum temperature and average temperature of the forecasting day were normalized as feature values. The month and time of day to be predicted have been processed by one-hot coding, which is used as feature value fusion to construct a feature vector. The feature values obtained from PCC and MIC selection, the feature values obtained from ACF analysis, and the component load forecasting values obtained in the first stage are connected to obtain the feature vector X , which is fed into the fully connected layer to output the final load forecasting values. In this paper, X = ( I M ^ F 1 , I M ^ F 2 , I M ^ F 3 , I M ^ F 4 , I M ^ F 5 , y ^ t 25 , y ^ t 48 , y ^ t 72 , y ^ t 168 , T max , T min , T ¯ , m o n t h , t i m e ) T .

4.5. SVLM–FE Short-Time Power Load Forecasting Model

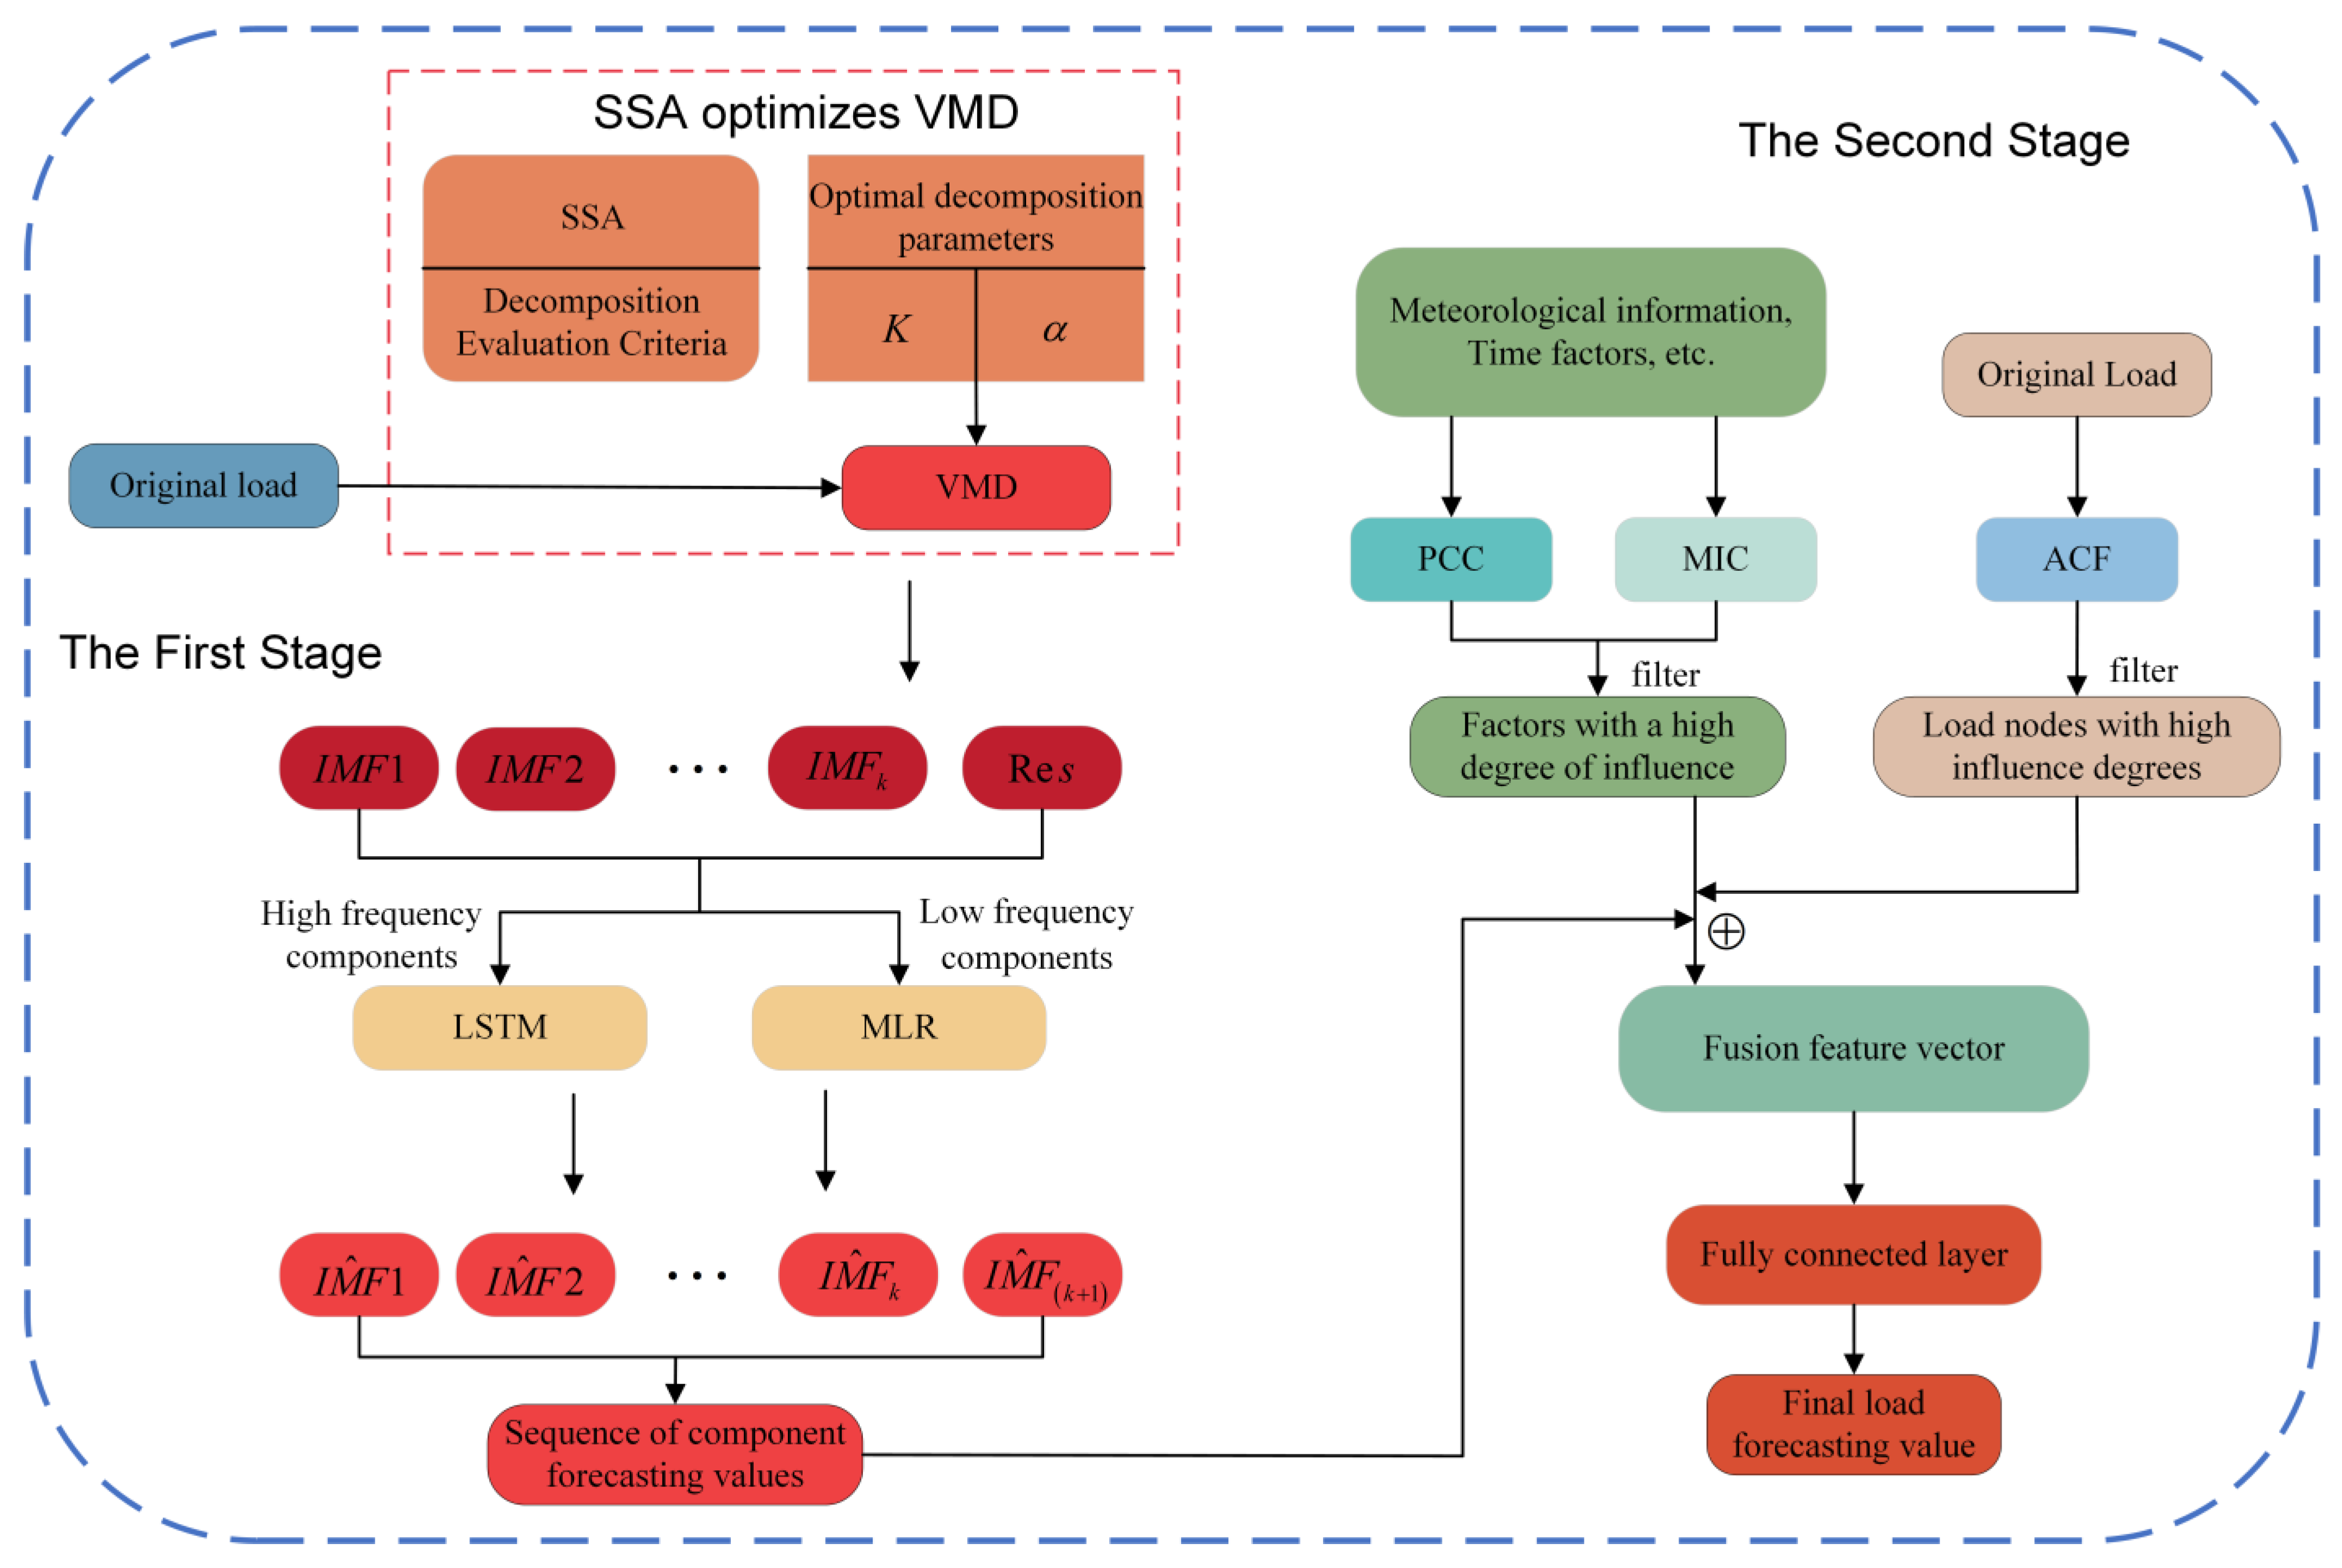
This paper proposes a two-stage short-time forecasting method SSA–VMD–LSTM– MLR–FE (SVLM–FE) based on SSA–VMD and feature engineering (FE), where the key parameter combination [ K , α ] of the VMD is optimized using SSA, and we propose Equation (13) as the fitness function for this optimization process. The K IMFs and Residual are obtained by the SSA–VMD algorithm. In order to minimize signal loss, Res is also input into the forecasting model as an IMF in this paper. The low-frequency component is predicted using MLR, and the high-frequency component is input into the LSTM network for prediction to obtain K + 1 component forecasting values. ACF analysis is used to obtain the load values of moments with a high influence on the moments to be predicted; PCC and MIC are calculated to select the factors with a high influence and the first-stage component forecasting values. These three parts of the connection are fed into the fully connected layer as feature vectors to obtain the final forecasting values. A graphic of the model in this paper is shown in Figure 6.
The SVLM–FE forecasting method proposed in this paper is divided into two parts: the original load data decomposition part and the forecasting part. Among these, the original load data decomposition uses the SSA–VMD algorithm. The forecasting part of this method is divided into two forecasting stages. In the first stage, the components obtained by SSA–VMD decomposition are predicted separately. In the second stage, the feature selection method is used to select the load-influencing factors, and the selected feature values are fused with the forecasting values of each load component from the first stage to construct a feature vector, which is input into the full connection layer for prediction, so as to complete the correction of the prediction error in the first stage. The output value of the full connection layer is the final forecasting value of the load.

5. Experiment and Results

The dataset of Place 1 used in this paper was from China, spanning the period from 1 January 2013 to 10 January 2015, with a sampling interval of 1 h and 24 sampling points per day, for a total of 17,760 pieces of data. In this paper, the first 17,736 points of load data are divided, with 85% assigned as the training set and 15% as the validation set, and the load data of 10 January 2015 were used as the test set. The trained model is used to forecast the load values of the 24 moment nodes on 10 January 2015, and the performance metrics of the method are analyzed.

5.1. Evaluation Criteria

In this paper, the following three items are used as the evaluation criteria for the accuracy of the forecasting model: root mean square error (RMSE), mean absolute percentage error (MAPE) and mean absolute error (MAE), which are calculated as Equations (27)–(29).
R M S E = i = 1 N ( y ^ i y i ) 2 N
M A P E = 1 N i = 1 N y ^ i y i y i × 100 %
M A E = 1 N i = 1 N | y ^ i y i |
where y ^ i is the forecasting load of the model; y i is the true value of the load; N is the number of predicted time nodes. In this paper the load value is predicted for the next 24 time nodes, so N = 24 .

5.2. Data Processing

The difference in magnitude between data with different indicators affects the convergence training speed of the neural network model, and also tends to cause the problems of gradient disappearance and gradient explosion. Therefore, in this paper, the data are normalized using the Min–Max normalization process. The formula is as follows.
x * = x x min x max x min
where x * is the normalized data, x * [ 0 , 1 ] ; x is the original data; x max is the maximum value in the data; and x min is the minimum value in the data.
In addition, for discontinuous data such as the time-type factors in this paper, one-hot coding is used.

5.3. Multi-Step and Iterative Forecasting Approach

Load forecasting can be classified by the output dimension of the forecasting model into single-step forecasting and multi-step forecasting, with single-step forecasting only outputting the forecasting value for one future time node and multi-step forecasting outputting a multi-dimensional vector containing the forecasting values for multiple time nodes future. The purpose of short-term load forecasting in this paper is to obtain the load values for the next 24 moments. There are direct and iterative forecasting approaches for short-term load forecasting, but considering that multi-step forecasting will cause a lag in the input sequence, there is a lag problem in the characteristics, and this will affect the accuracy of forecasting. Moreover, considering the application scenario of the forecasting model, the load values for the next 24 moments are predicted on the previous day. Therefore, the forecasting process uses an iterative forecasting approach, whereby the predicted value at each time t is obtained, and then the predicted value at time t is added to the feature vector for the next moment at time t + 1 to obtain the predicted value at time t + 1, and so on, to predict the values for the next 24 time points on the next day.

5.4. Results

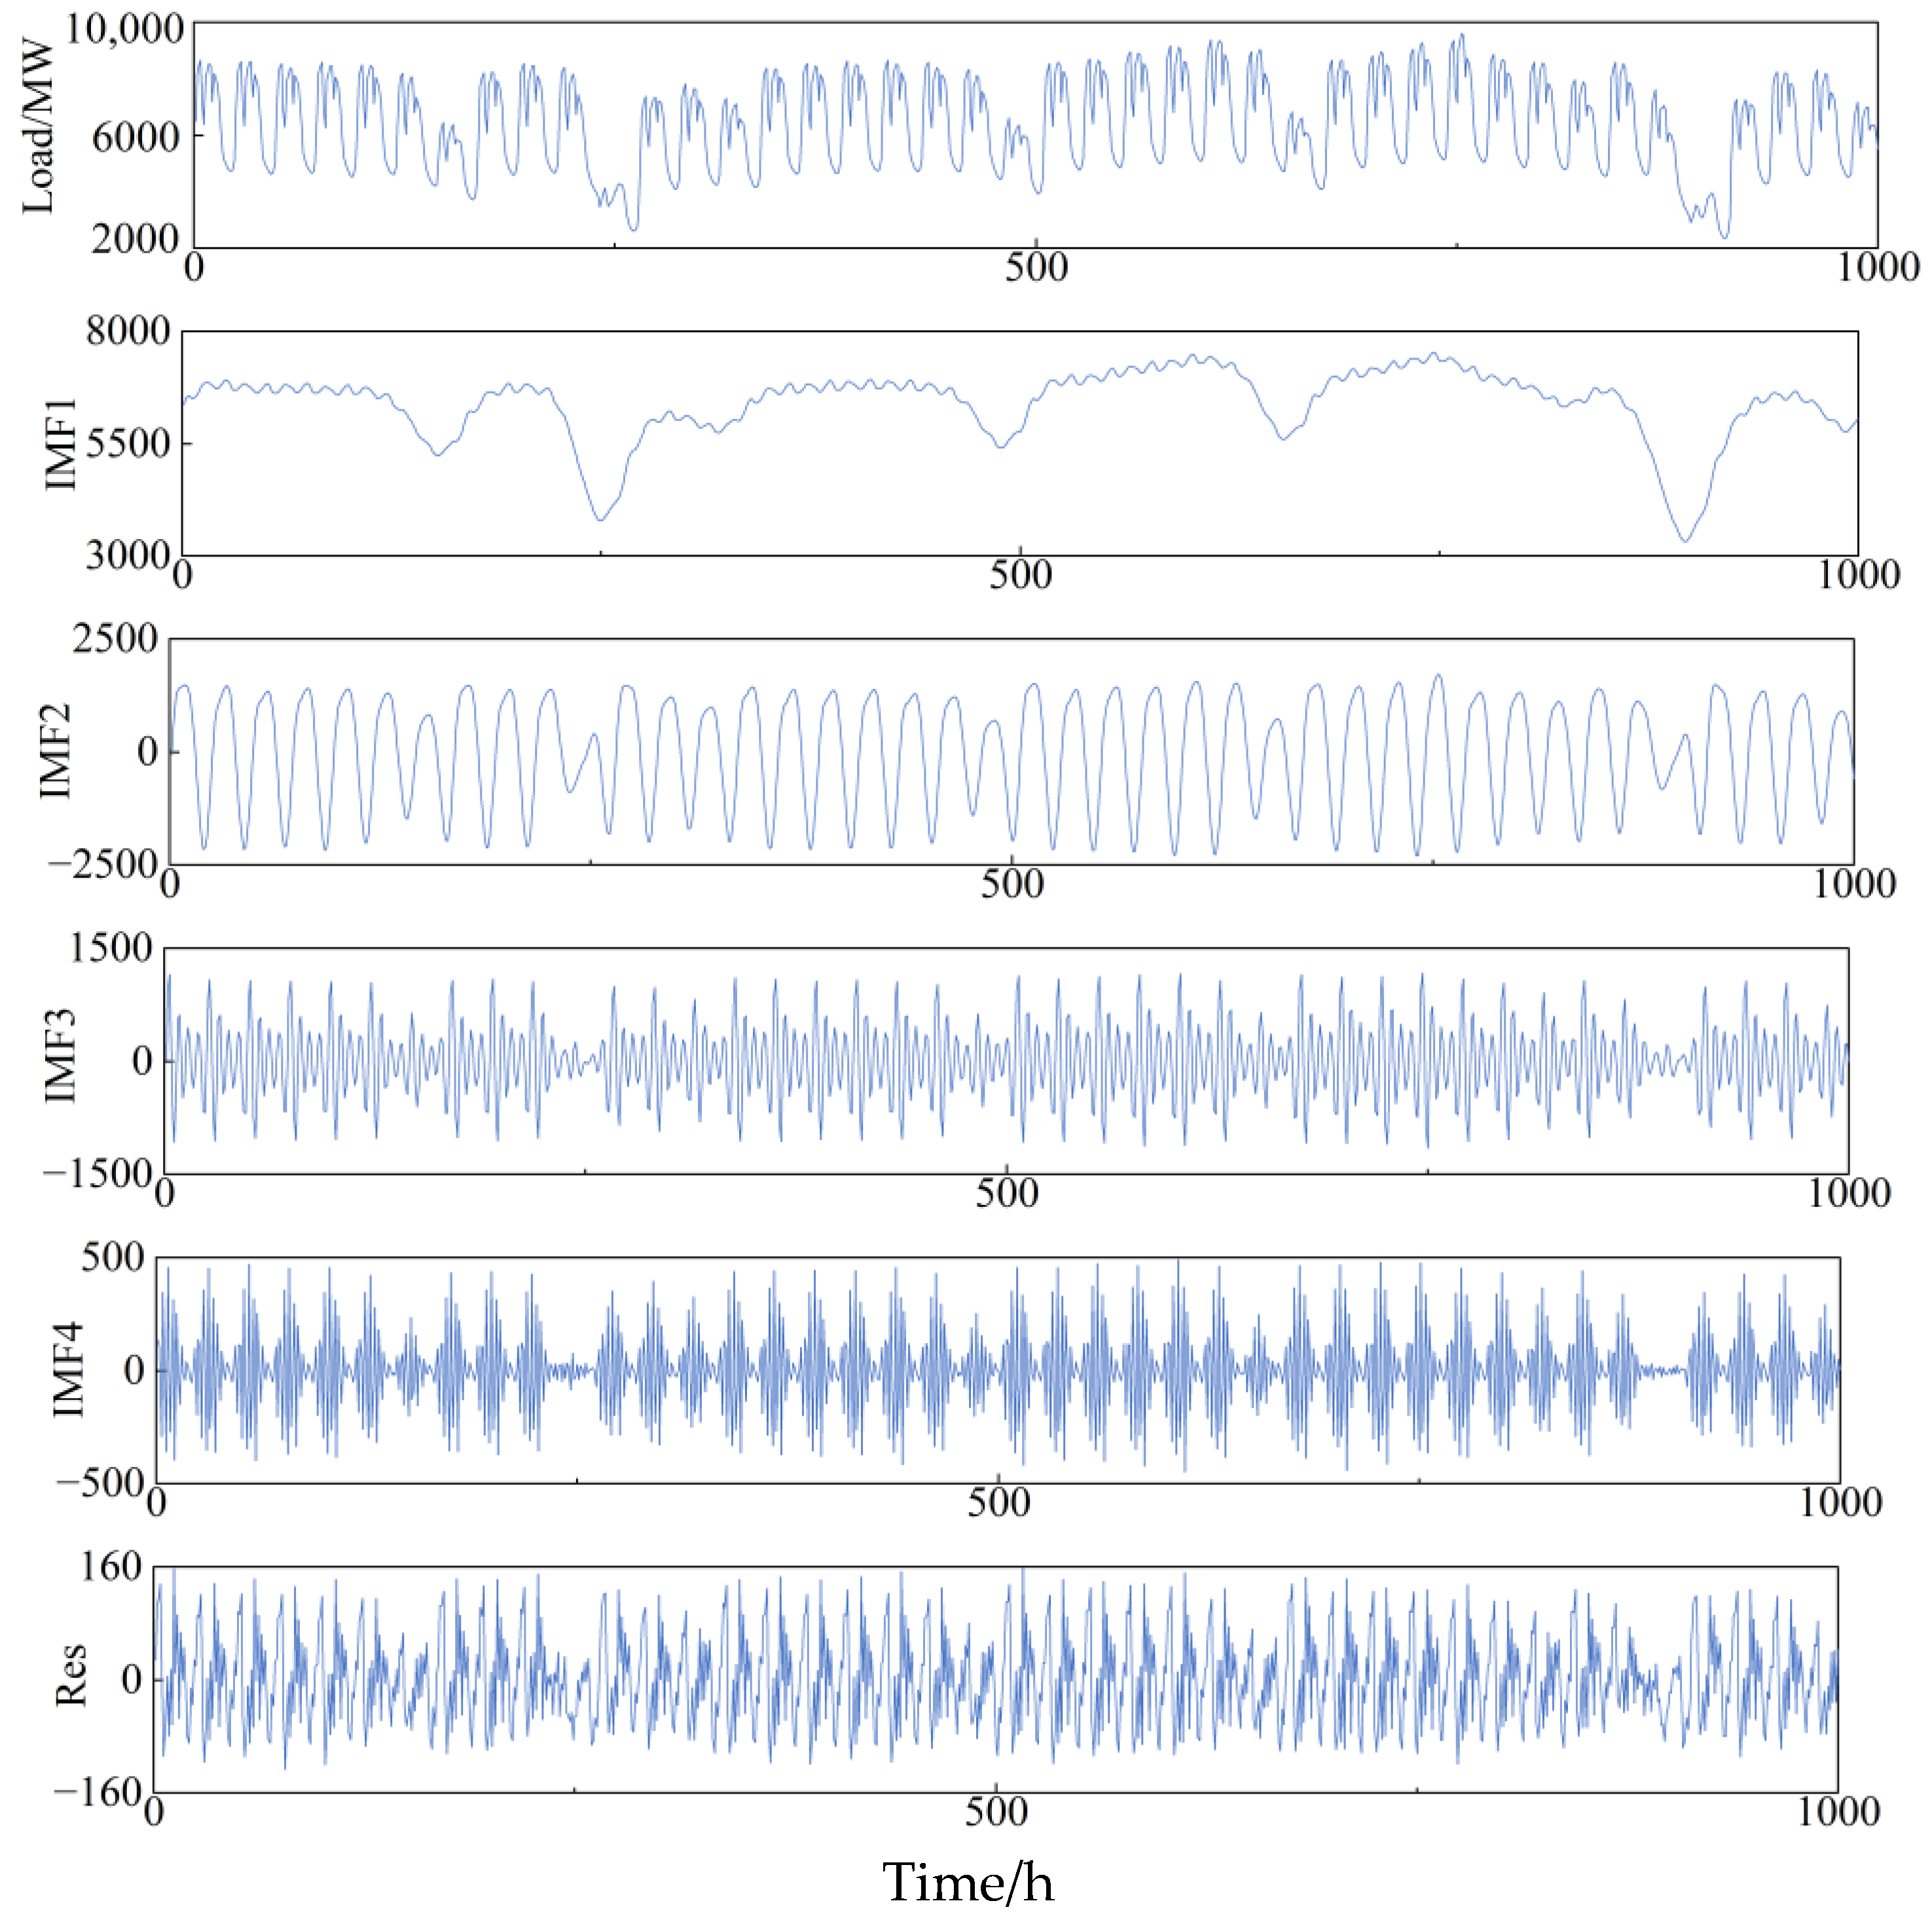
The parameter combination ( K = 4 , α = 93 ) was obtained by the SSA optimization of VMD. The original load data from Place 1 were decomposed using the optimized VMD parameter combination, and the decomposition effect is shown in Figure 7. The first bar in Figure 7 shows the original load data with strong random fluctuations. After the decomposition, four IMFs and Res are obtained, which realize the noise reduction of the original sequence, and the fluctuations of several components show a certain regularity. According to the oscillation frequency of each component curve used to distinguish the low-frequency component and high-frequency component, IMF1 is the low-frequency component (using MLR for forecasting), and the remaining several components and Res are the high-frequency components (using LSTM for forecasting), thus constructing a hybrid forecasting model to complete the first stage of forecasting.
This paper uses the training set to train the parameters of the first stage in the learning model. In order to avoid information leakage and overfitting problems caused by using the training set data again in the second stage of learning, the forecasting values of each component are obtained in the second stage using the validation set for prediction, and the component forecasting values are combined with the influencing factors selected by PCC and MIC and the loadings at the corresponding moment selected by the ACF function to construct the feature vector. We input the feature vector into the fully connected layer for the second stage of forecasting to obtain the final forecasting values. In this paper, the load values for the 24 moments on 10 January 2015 are predicted by the iterative forecasting approach.

5.4.1. Analysis of SVLM–FE Forecasting Results

Several classical forecasting models were chosen for comparison in the experiments of this paper to evaluate the performance of the SVLM–FE hybrid model proposed in this paper, using SVR, MLR, the LSTM network and the GRU network, respectively. Experiments have also been conducted using the SVLM model as a means of comparing the improvement in prediction accuracy before and after error correction in the SVLM–FE model. Their feature vectors were constructed in the same way as the feature vectors in the first stage of the SVLM–FE model, and iterative forecasting was used to predict the load values for 24 moments in the future day.
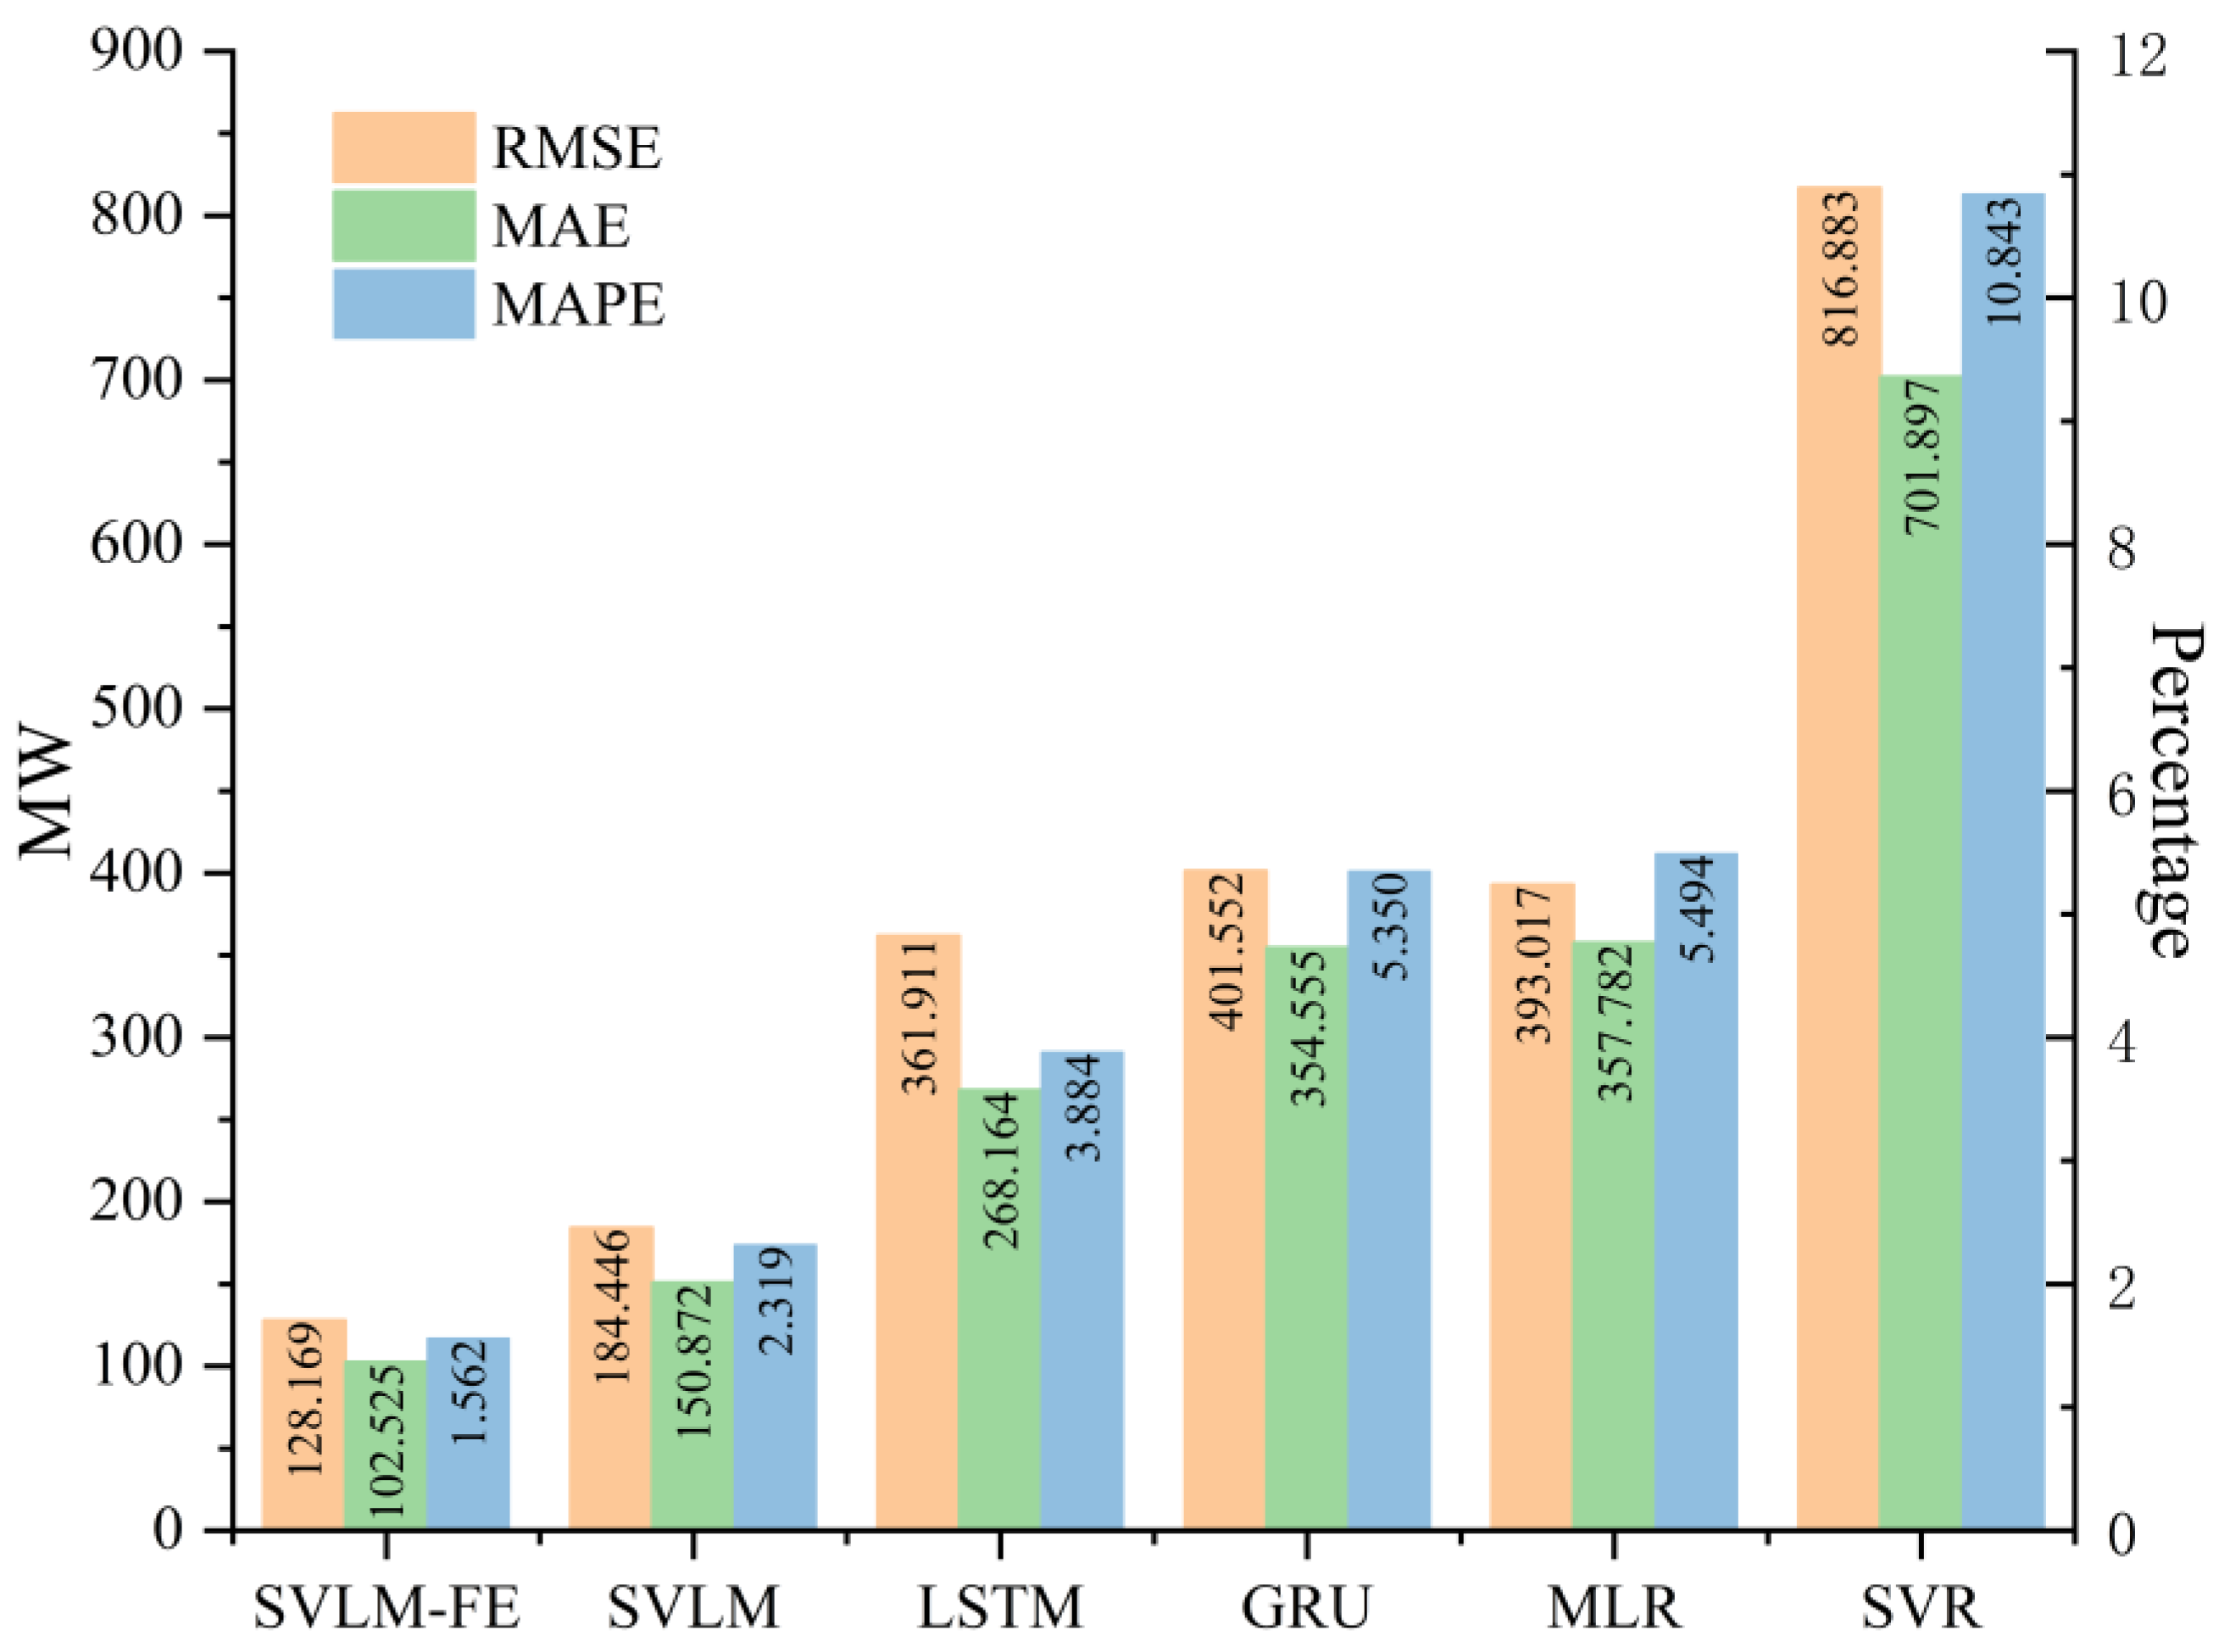
From the analysis of the data in Table 5 and Figure 8, we can conclude that the three criteria of RMSE, MAE and MAPE are optimal for SVLM–FE, and the three criteria of SVR are the worst. Compared to the SVLM model, the RMSE of SVLM–FE decreased by 56.277 MW (30.51 percentage points), MAE decreased by 48.347 MW (32.05 percentage points), and MAPE decreased by 32.64 percentage points. Compared to the classical LSTM model, the SVLM–FE showed a 233.742 MW (a 64.59 percentage point decrease in RMSE, a 165.639 MW (a 61.77 percentage point decrease in MAE) and a 59.78 percentage point decrease in MAPE. Compared to the single GRU model, SVLM–FE’s RMSE decreased by 273.383 MW (68.08 percentage points), the MAE decreased by 252.030 MW (71.08 percentage points) and MAPE decreased by 70.80 percentage points. The indicators for MLR and GRU are relatively similar: compared to MLR, SVLM–FE’s RMSE decreased by 264.848 MW (67.39 percentage points), the MAE decreased by 255.257 MW (71.34 percentage points) and the MAPE decreased by 71.57 percentage points. In all three metrics, both the comparison with the SSA–VMD-based hybrid model SVLM and the comparison with the single model showed higher forecasting accuracy.
In terms of computing time, MLR takes the shortest time of 1.621 s, and has higher forecasting accuracy than SVR, so MLR is used to forecast the low-frequency components in the method proposed in this paper. LSTM requires a longer computing time than GRU, but LSTM has higher forecasting accuracy, so LSTM is used to forecast the high-frequency components in the method proposed in this paper. The forecasting method SVLM–FE proposed in this paper has the longest computing time of 276.158 s, which is due to the fact that the SSA–VMD decomposes the original load data into multiple components, and each component is input into a separate model for forecasting, which increases the computing time. At the same time, the SVLM–FE adds the error correction work of the second fully connected layer to SVLM, so SVLM–FE takes more time than SVLM. Considering that, in practical applications, power plants and grids need more accurate short-term load forecasting to assist the dispatching work of various departments, the research purpose of this paper is to improve the accuracy of short-term power load forecasting, and the computing time of the proposed SVLM–FE model in this paper can meet the time demand in practical applications. Moreover, with the continuous improvement of hardware computing power, the computing time of the proposed model SVLM–FE will be further reduced.
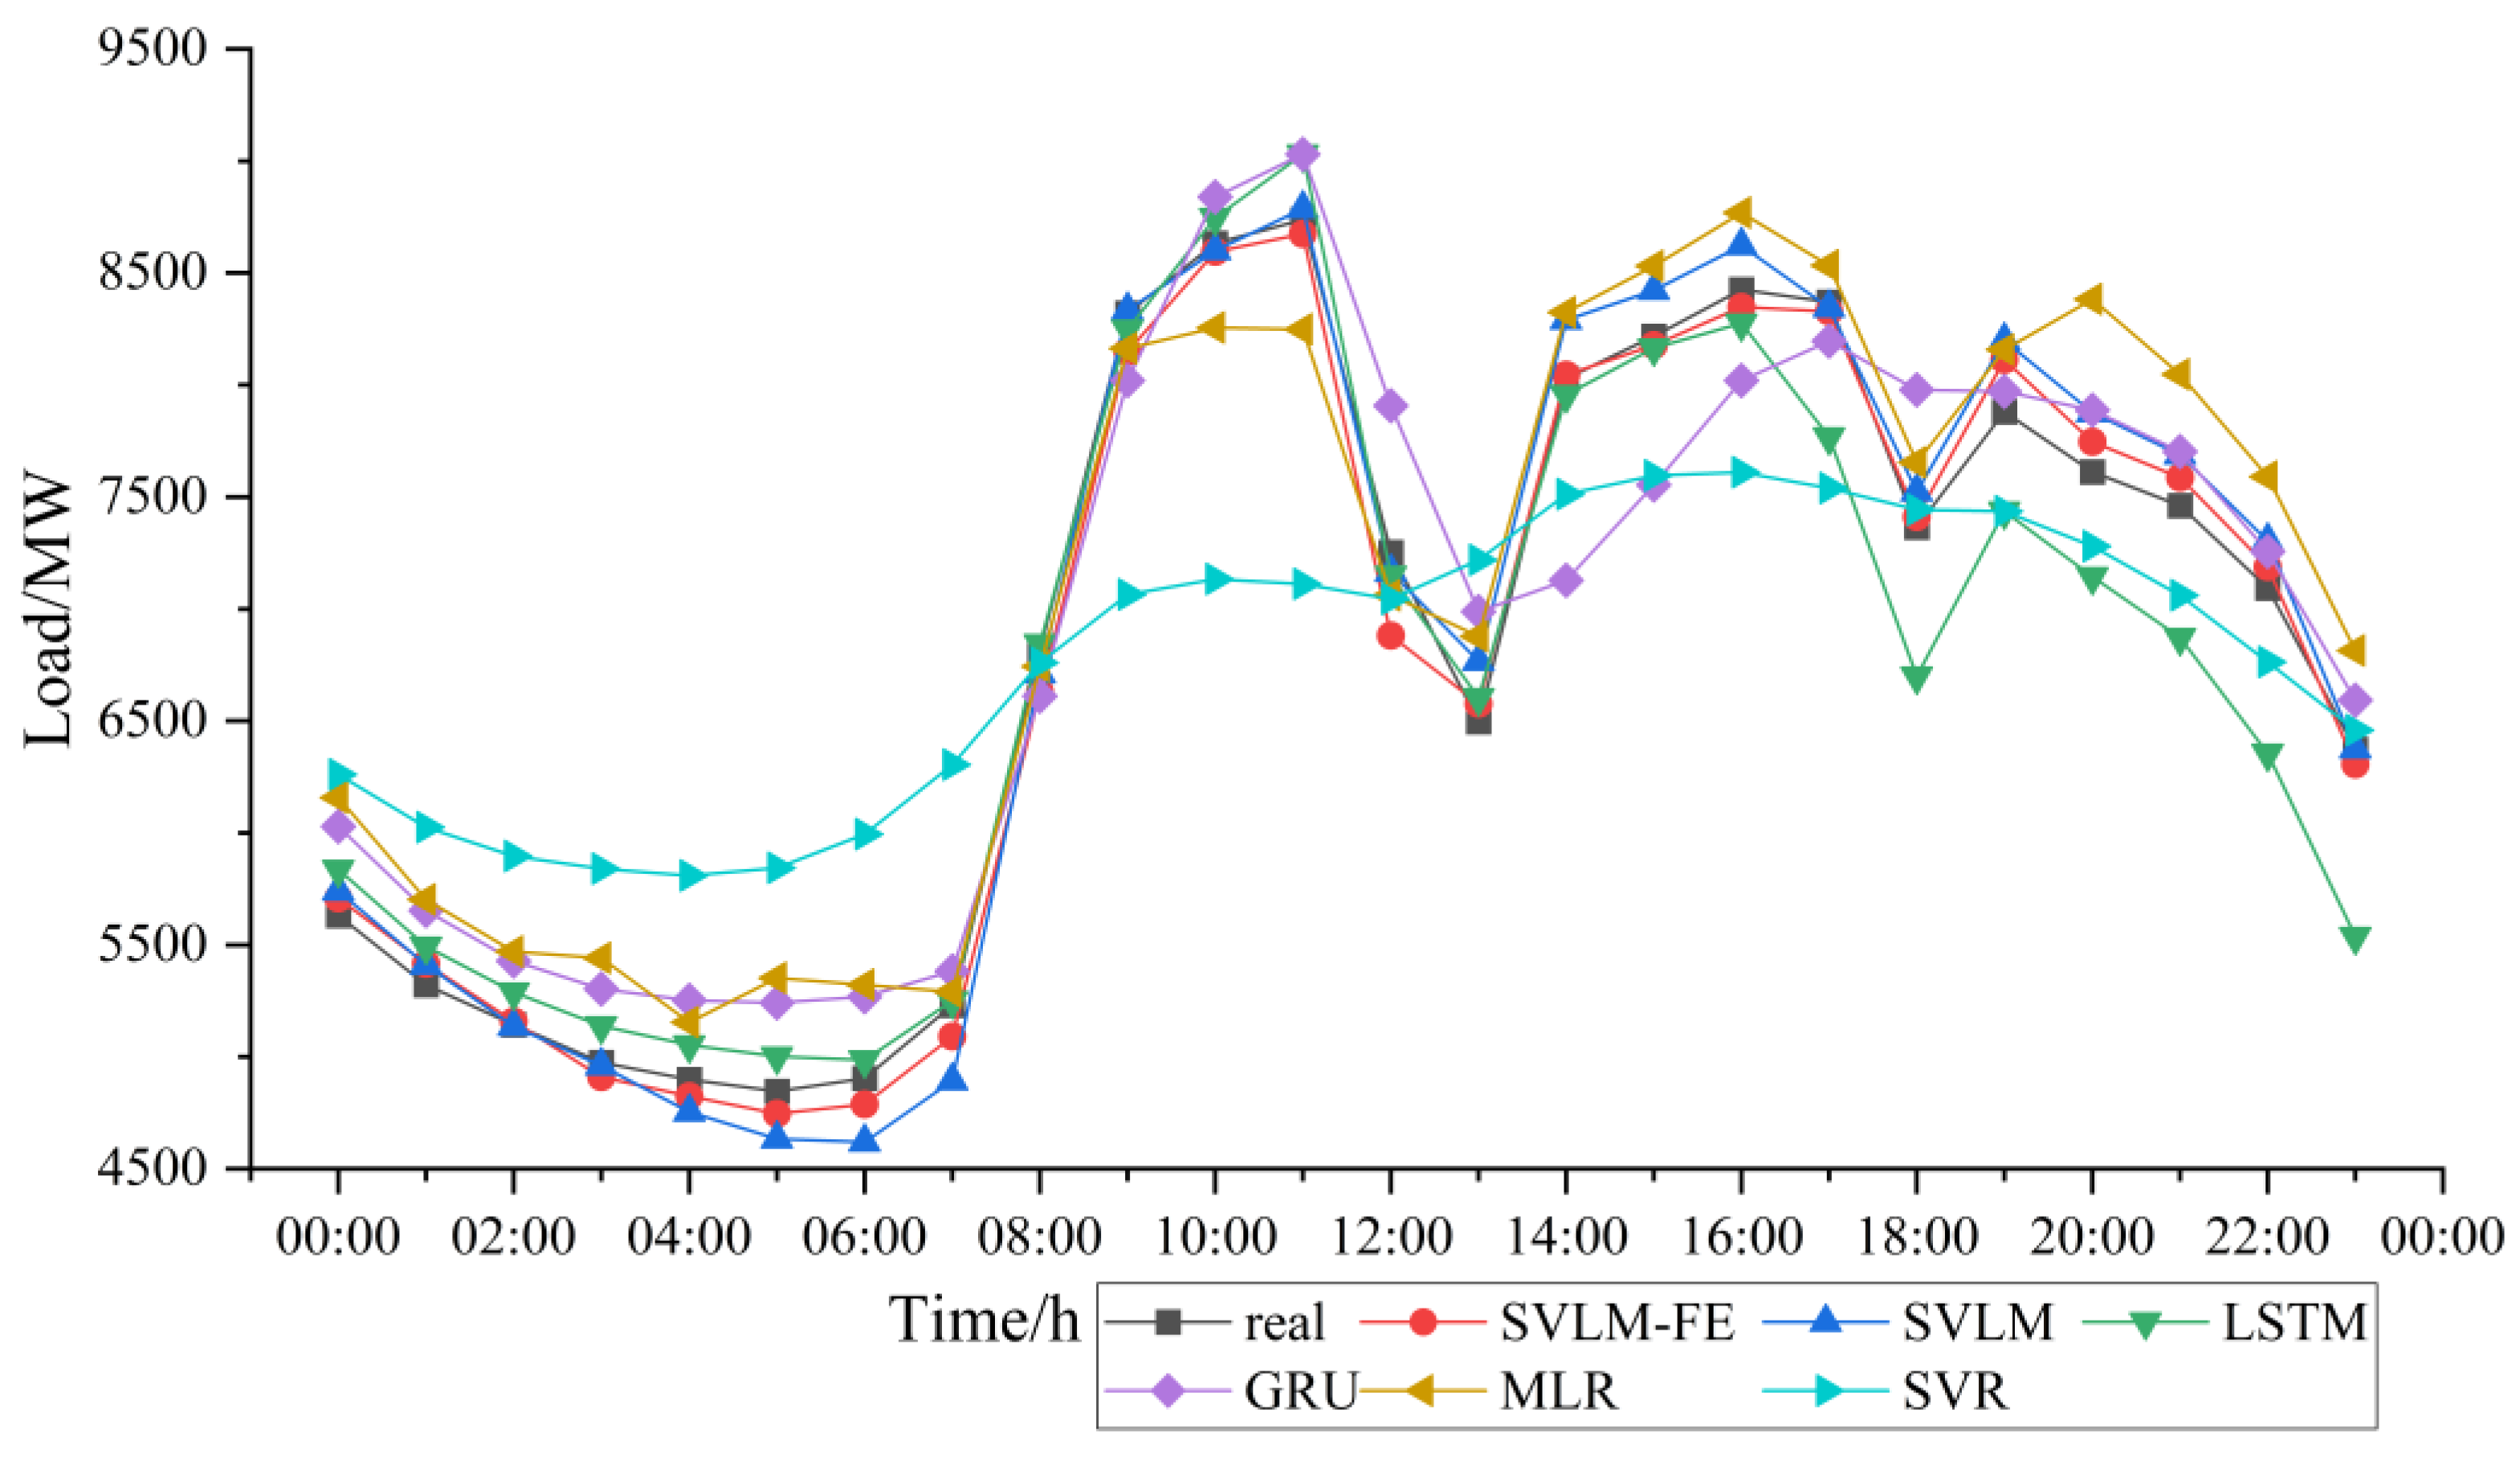
To verify the ability of the SVLM–FE model to fit the load curve, a load curve plot was drawn, as shown in Figure 9.
In Figure 9 it can be seen that the forecasting results of the SVLM–FE model are the closest to the true load values, thus successfully predicting key points in the day at all times. At 11 am, when the peak load is reached, the SVLM–FE model is the closest, and at 1 pm, when the load peaks, and 4 pm the model has the lowest error. The SVLM–FE accurately predicts this load path with less error at the peak and trough; the SVLM is also able to predict the load path for this time period, but with a larger error value than the SVLM–FE. Other models did not make good directional judgements in the face of this rapidly changing load, with flatter curves that did not fit the small peaks and troughs well.
Therefore, in the process of the SSA search for the key parameter set of VMD, the decomposition evaluation criteria proposed in this paper are used as the fitness function, which can effectively reduce the volatility of the load data and establish the foundation for the construction of a highly accurate short-term load forecasting model. At the same time, the component load forecasting values obtained in the first stage and the feature values obtained by feature selection are used to construct a feature vector, which is fed into the fully connected layer for forecasting. This completes the error correction for the first-stage forecasting, and the method is experimentally proven to be very effective.

5.4.2. Analysis of SVGM–FE Forecasting Results

In order to further verify the effectiveness of SSA–VMD for load data decomposition, the effectiveness of constructing hybrid forecasting models based on SSA–VMD, and the effectiveness of error correction in two-stage forecasting for load component forecast values, this paper builds the model SSA–VMD–GRU–MLR (SVGM) and a two-stage forecasting model SVGM–EF. The newly constructed models were used to forecast the load values on 10 January 2015.
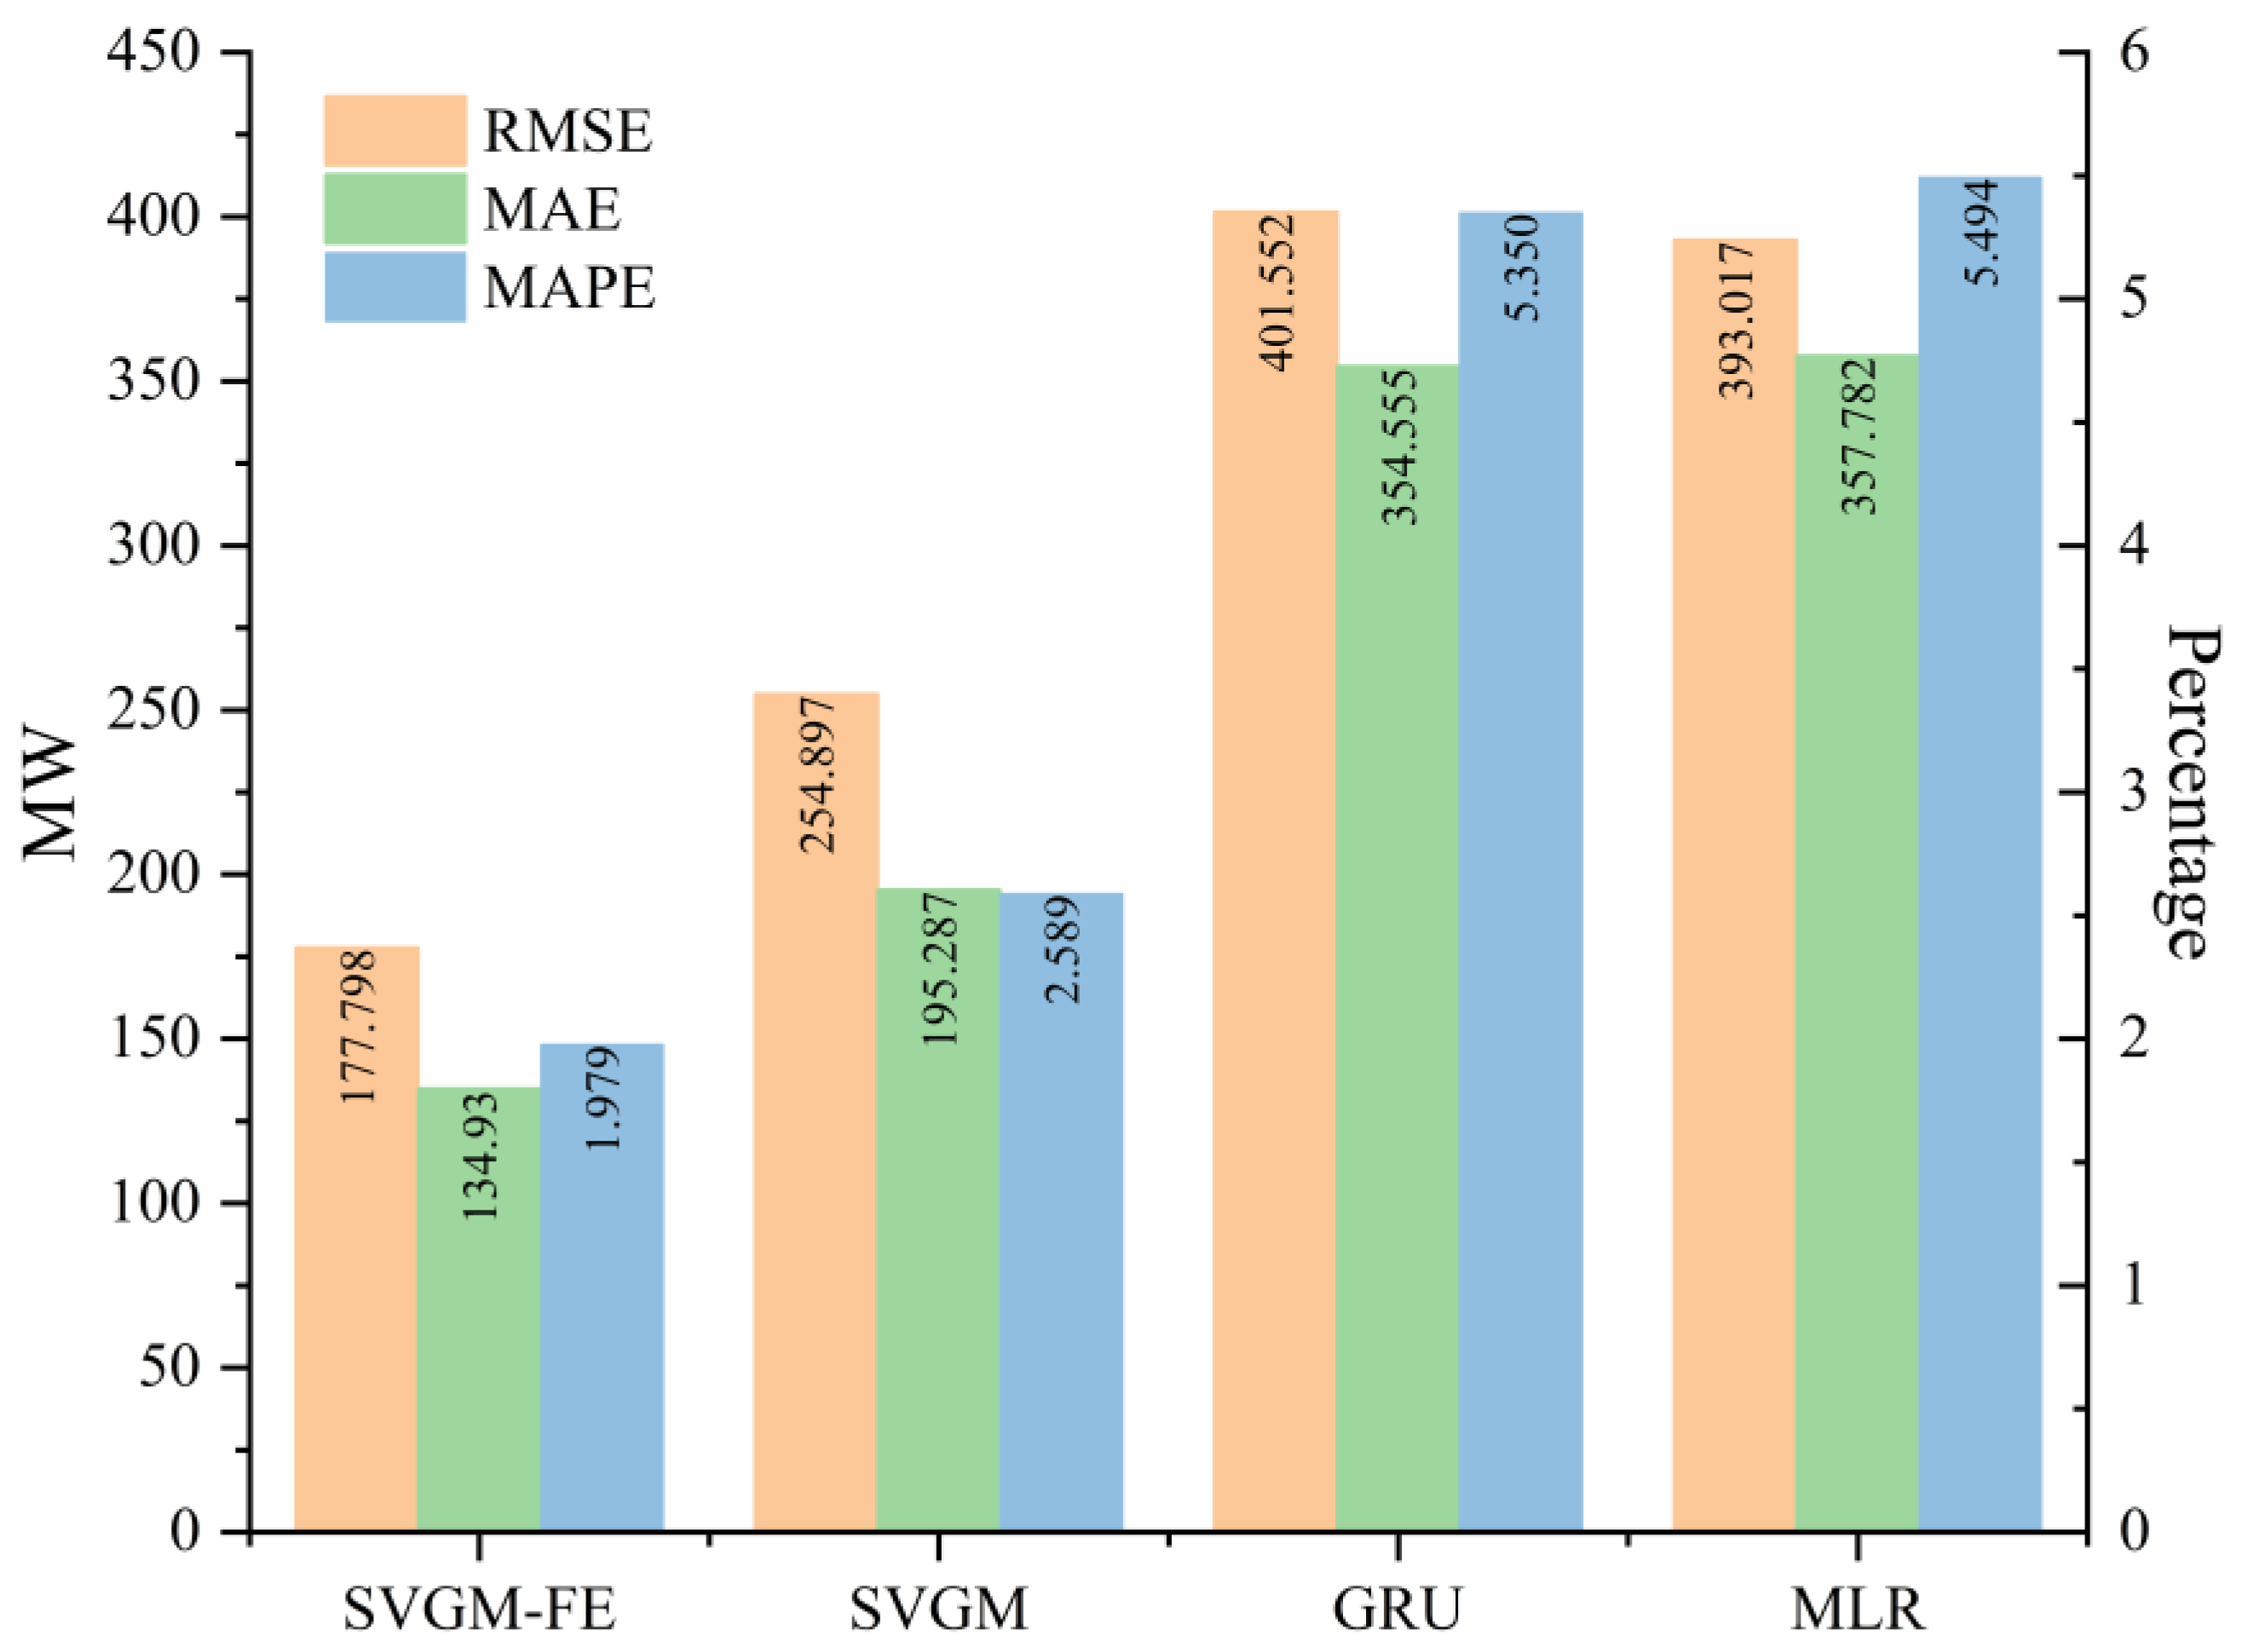
The statistical analysis in Table 6 and Figure 10 leads to the following conclusions. The hybrid forecasting models SVGM and SVGM–FE, constructed after SSA–VMD decomposition, have significantly improved forecasting accuracy compared to the GRU forecasting model and the MLR forecasting model. Compared to the GRU model, the RMSE of the SVGM model decreased by 146.665 MW (36.52 percentage points), the MAE decreased by 159.268 MW (44.92 percentage points), and the MAPE decreased by 51.61 percentage points. Compared to the MLR model, the RMSE of the SVGM model decreased by 138.120 MW (35.14 percentage points), MAE decreased by 162.495 MW (45.42 percentage points), and MAPE decreased by 52.88 percentage points. The experiments demonstrate the effectiveness of constructing a hybrid forecasting model based on SSA–VMD. Compared with the SVGM model, the RMSE of the SVGM–FE model decreased by 77.099 MW (30.25 percentage points), the MAE decreased by 60.357 MW (30.91 percentage points), and the MAPE decreased by 23.56 percentage points. In terms of computing time, the SVGM–FE has the longest computing time of 204.812 s, which means it is able to meet the time requirements in practical applications.
Table 5 and Table 6 show that the forecasting accuracy of SVLM–FE is the highest, followed by SVGM–FE, then SVLM, and SVGM ranks the fourth, thus further validating the effectiveness of the two-stage short-term load forecasting method constructed based on SSA–VMD. Due to the better forecasting performance of SVLM–FE than SVGM–FE, the LSTM was used in the forecasting method proposed in this paper for the high frequency component. In terms of computing time, although the computing time of SVLM–FE is 71.346 s longer than SVGM–FE, SVLM–FE has higher forecasting accuracy, and the computing time of SVLM–FE can meet the time requirements in realistic scenarios, which proves the superiority of the performance of the proposed forecasting method, SVLM–FE.
As shown in Figure 11, the forecasting values of the SVGM model are closer to the true values than the single GRU and MLR forecasting models; after the second stage of error correction, the errors in the forecasting values obtained by SVGM–FE are further reduced, and the best performance is achieved at both peak and trough load values, including at small peaks and troughs, where the SVGM–FE model forecasts values closest to the true values. SVGM–FE achieves a better forecasting performance for the details of the trend of load values over the next 24 moments. These experimental results further demonstrate the validity of the hybrid SSA–VMD-based model and the superiority of the second stage of forecasting with correction for error. Moreover, the forecasting accuracy of SVLM–FE is higher than that of SVGM–FE, so the final model proposed in this paper is SVLM–FE.

5.5. Experiment in Place 2

To further validate the high accuracy of the forecasting method SVLM–FE proposed in this paper, as well as its stability, experiments were conducted on another dataset and the forecasting results were analyzed. This dataset was from Place 2 in China and spanned the period from 1 January 2013 to 10 January 2015, with a sampling interval of 1 h, 24 sampling points per day and a total of 17,760 pieces of data. This experiment also divided the first 17,736 pieces of load data, with 85% assigned as the training set and 15% as the validation set, and the load data of 10 January 2015 were used as the test set. The trained model was used to predict the load values at 24 momentary points on 10 January 2015, again using single-step forecasting and iterative forecasting. The experimental results of the models on this dataset are analyzed below.
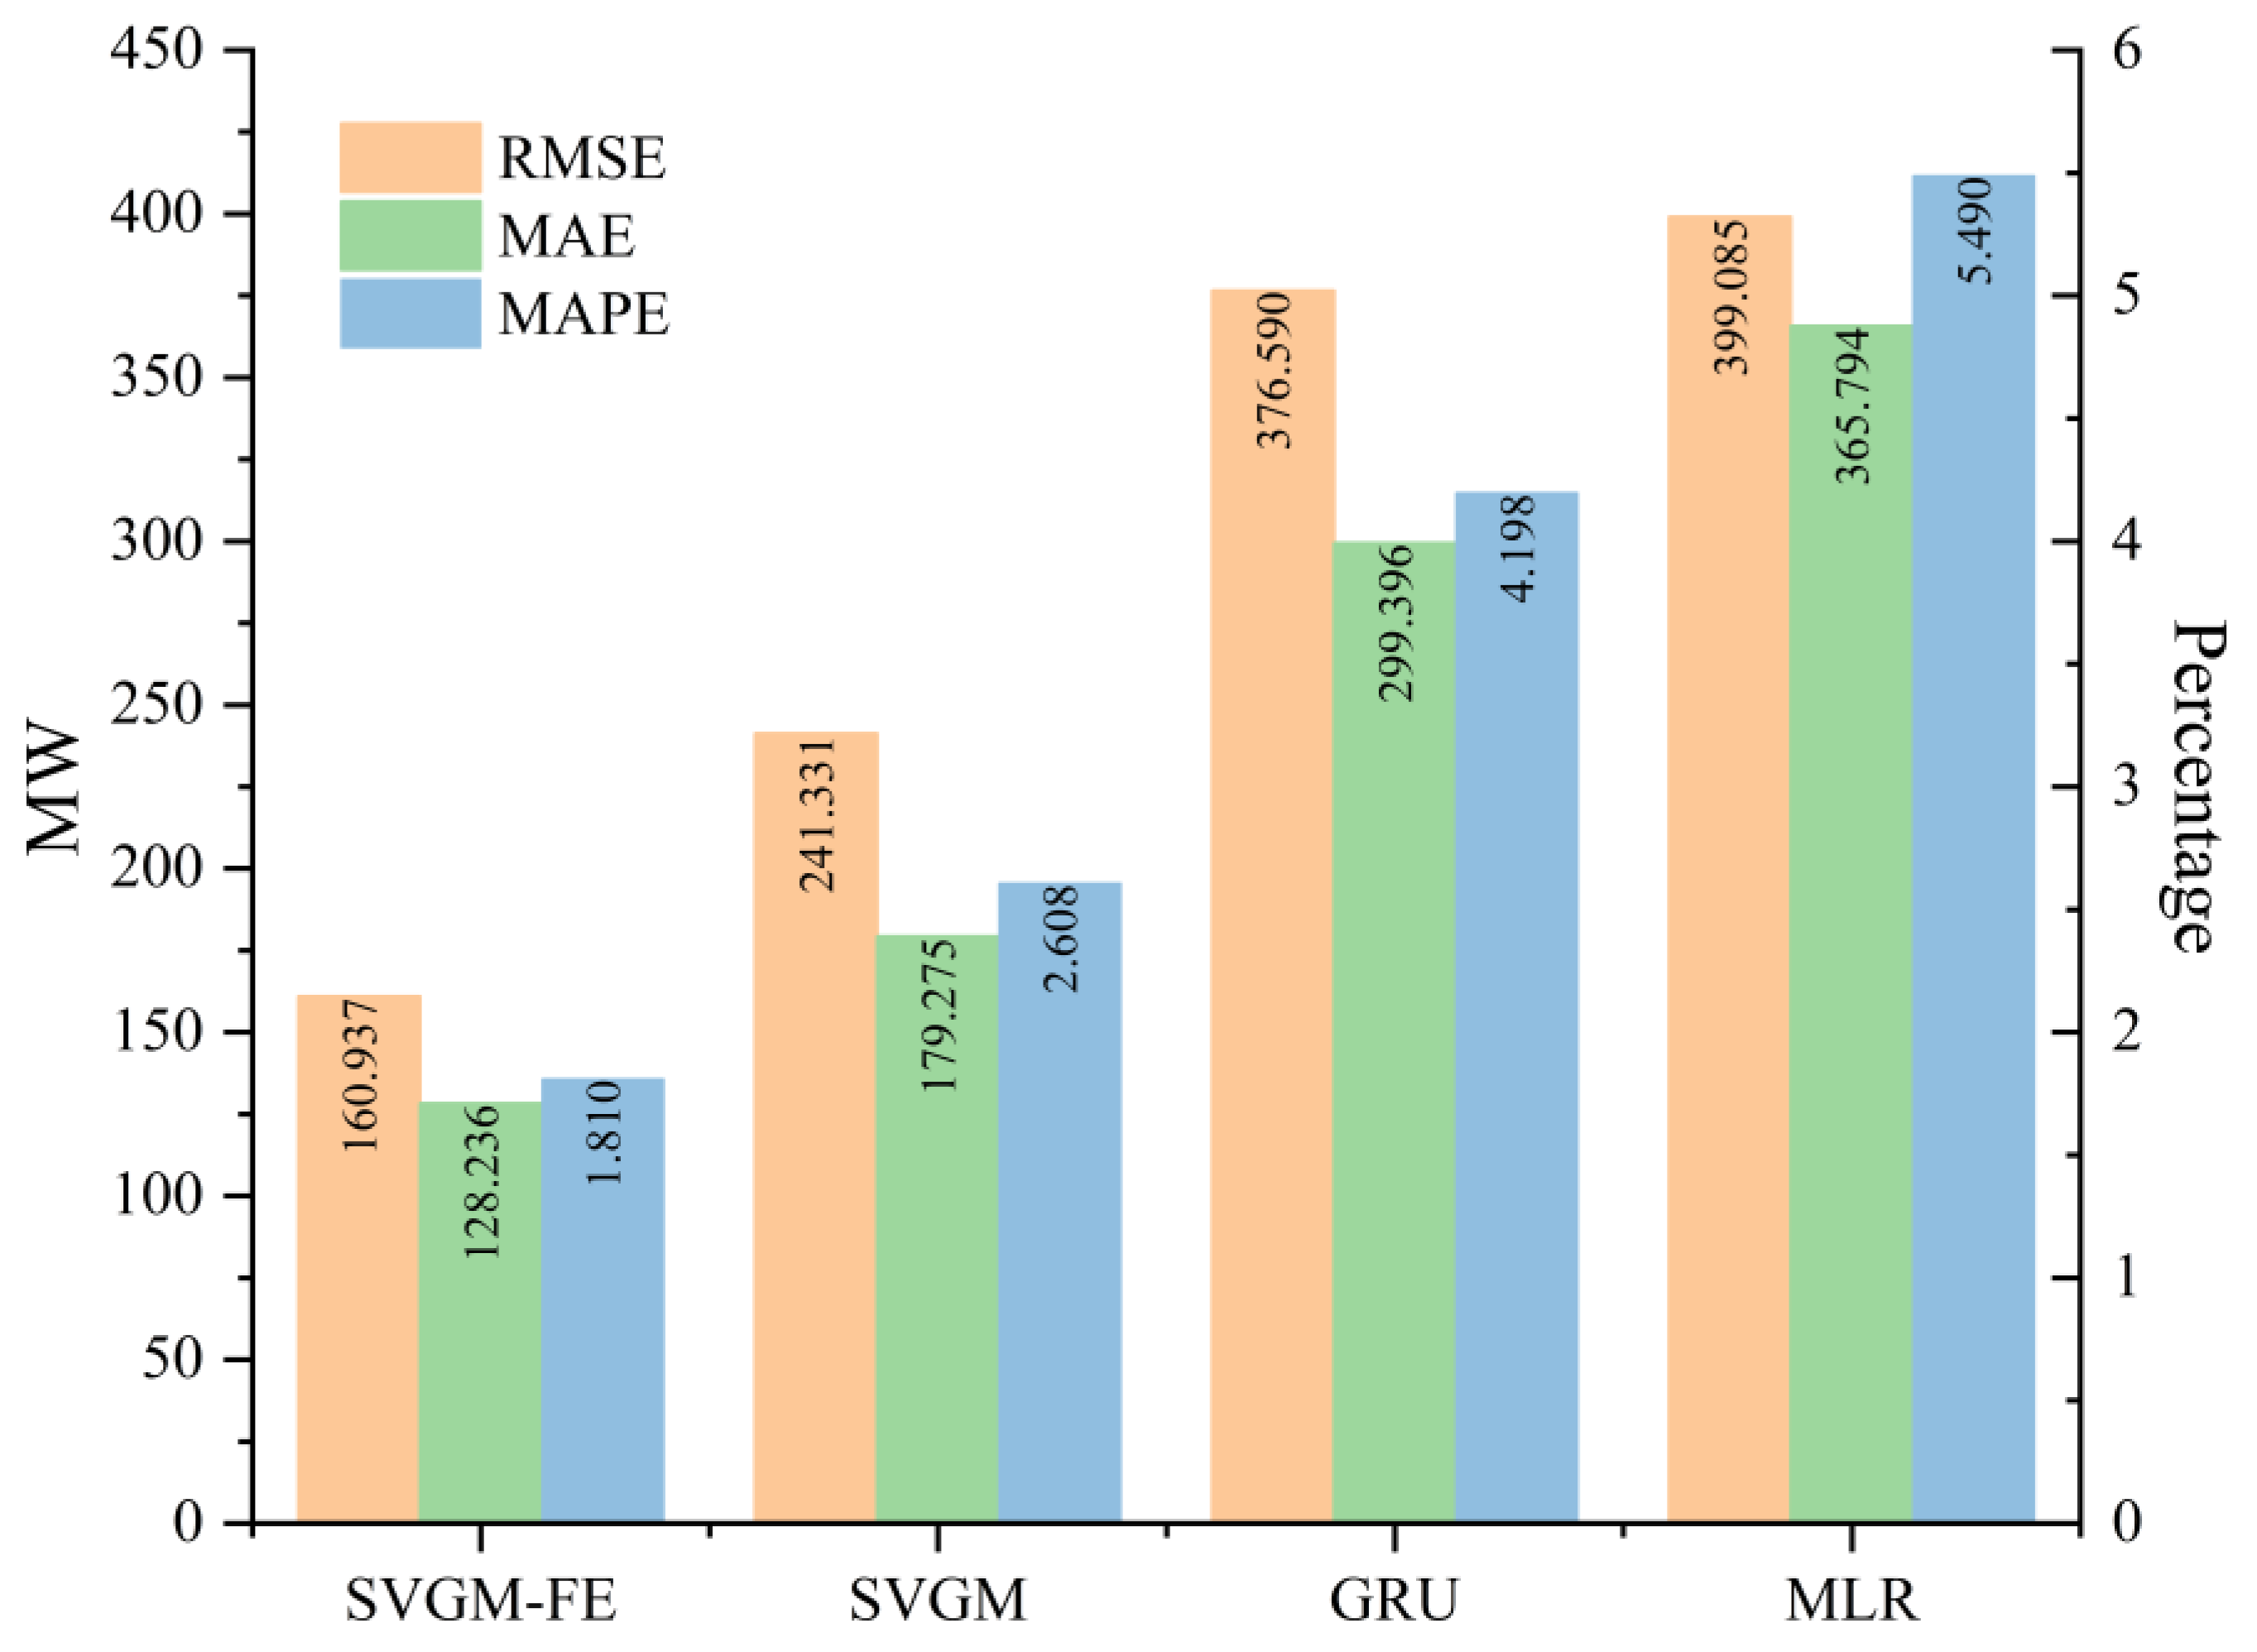
From the analysis of the evaluation criteria in Table 7 and Figure 12, we can draw the following conclusions. The three indexes RMSE, MAE and MAPE of SVLM–FE are the best, and the three indexes of SVR are the worst. Compared to the SVLM model, the RMSE of SVLM–FE decreased by 72.845 MW (39.49 percentage points), the MAE decreased by 62.645 MW (40.43 percentage points), and the MAPE decreased by 35.39 percentage points. Compared to the classical LSTM model, the SVLM–FE showed a decrease in RMSE of 259.448 MW (69.92 percentage points), a decrease in MAE of 186.862 MW (66.94 percentage points) and a decrease in MAPE of 62.37 percentage points. Compared to the single GRU model, SVLM–FE saw a decrease in RMSE of 264.594 MW (70.36 percentage points), a decrease in MAE of 207.105 MW (69.17 percentage points) and a decrease in MAPE of 66.03 percentage points. Compared to the MLR model, SVLM–FE’s RMSE decreased by 287.449 MW (72.03 percentage points), its MAE decreased by 273.503 MW (74.77 percentage points) and its MAPE decreased by 74.03 percentage points. In terms of computing time, SVLM–FE still requires the longest time of 273.897 s, which means it is able to meet the time requirements of practical applications.
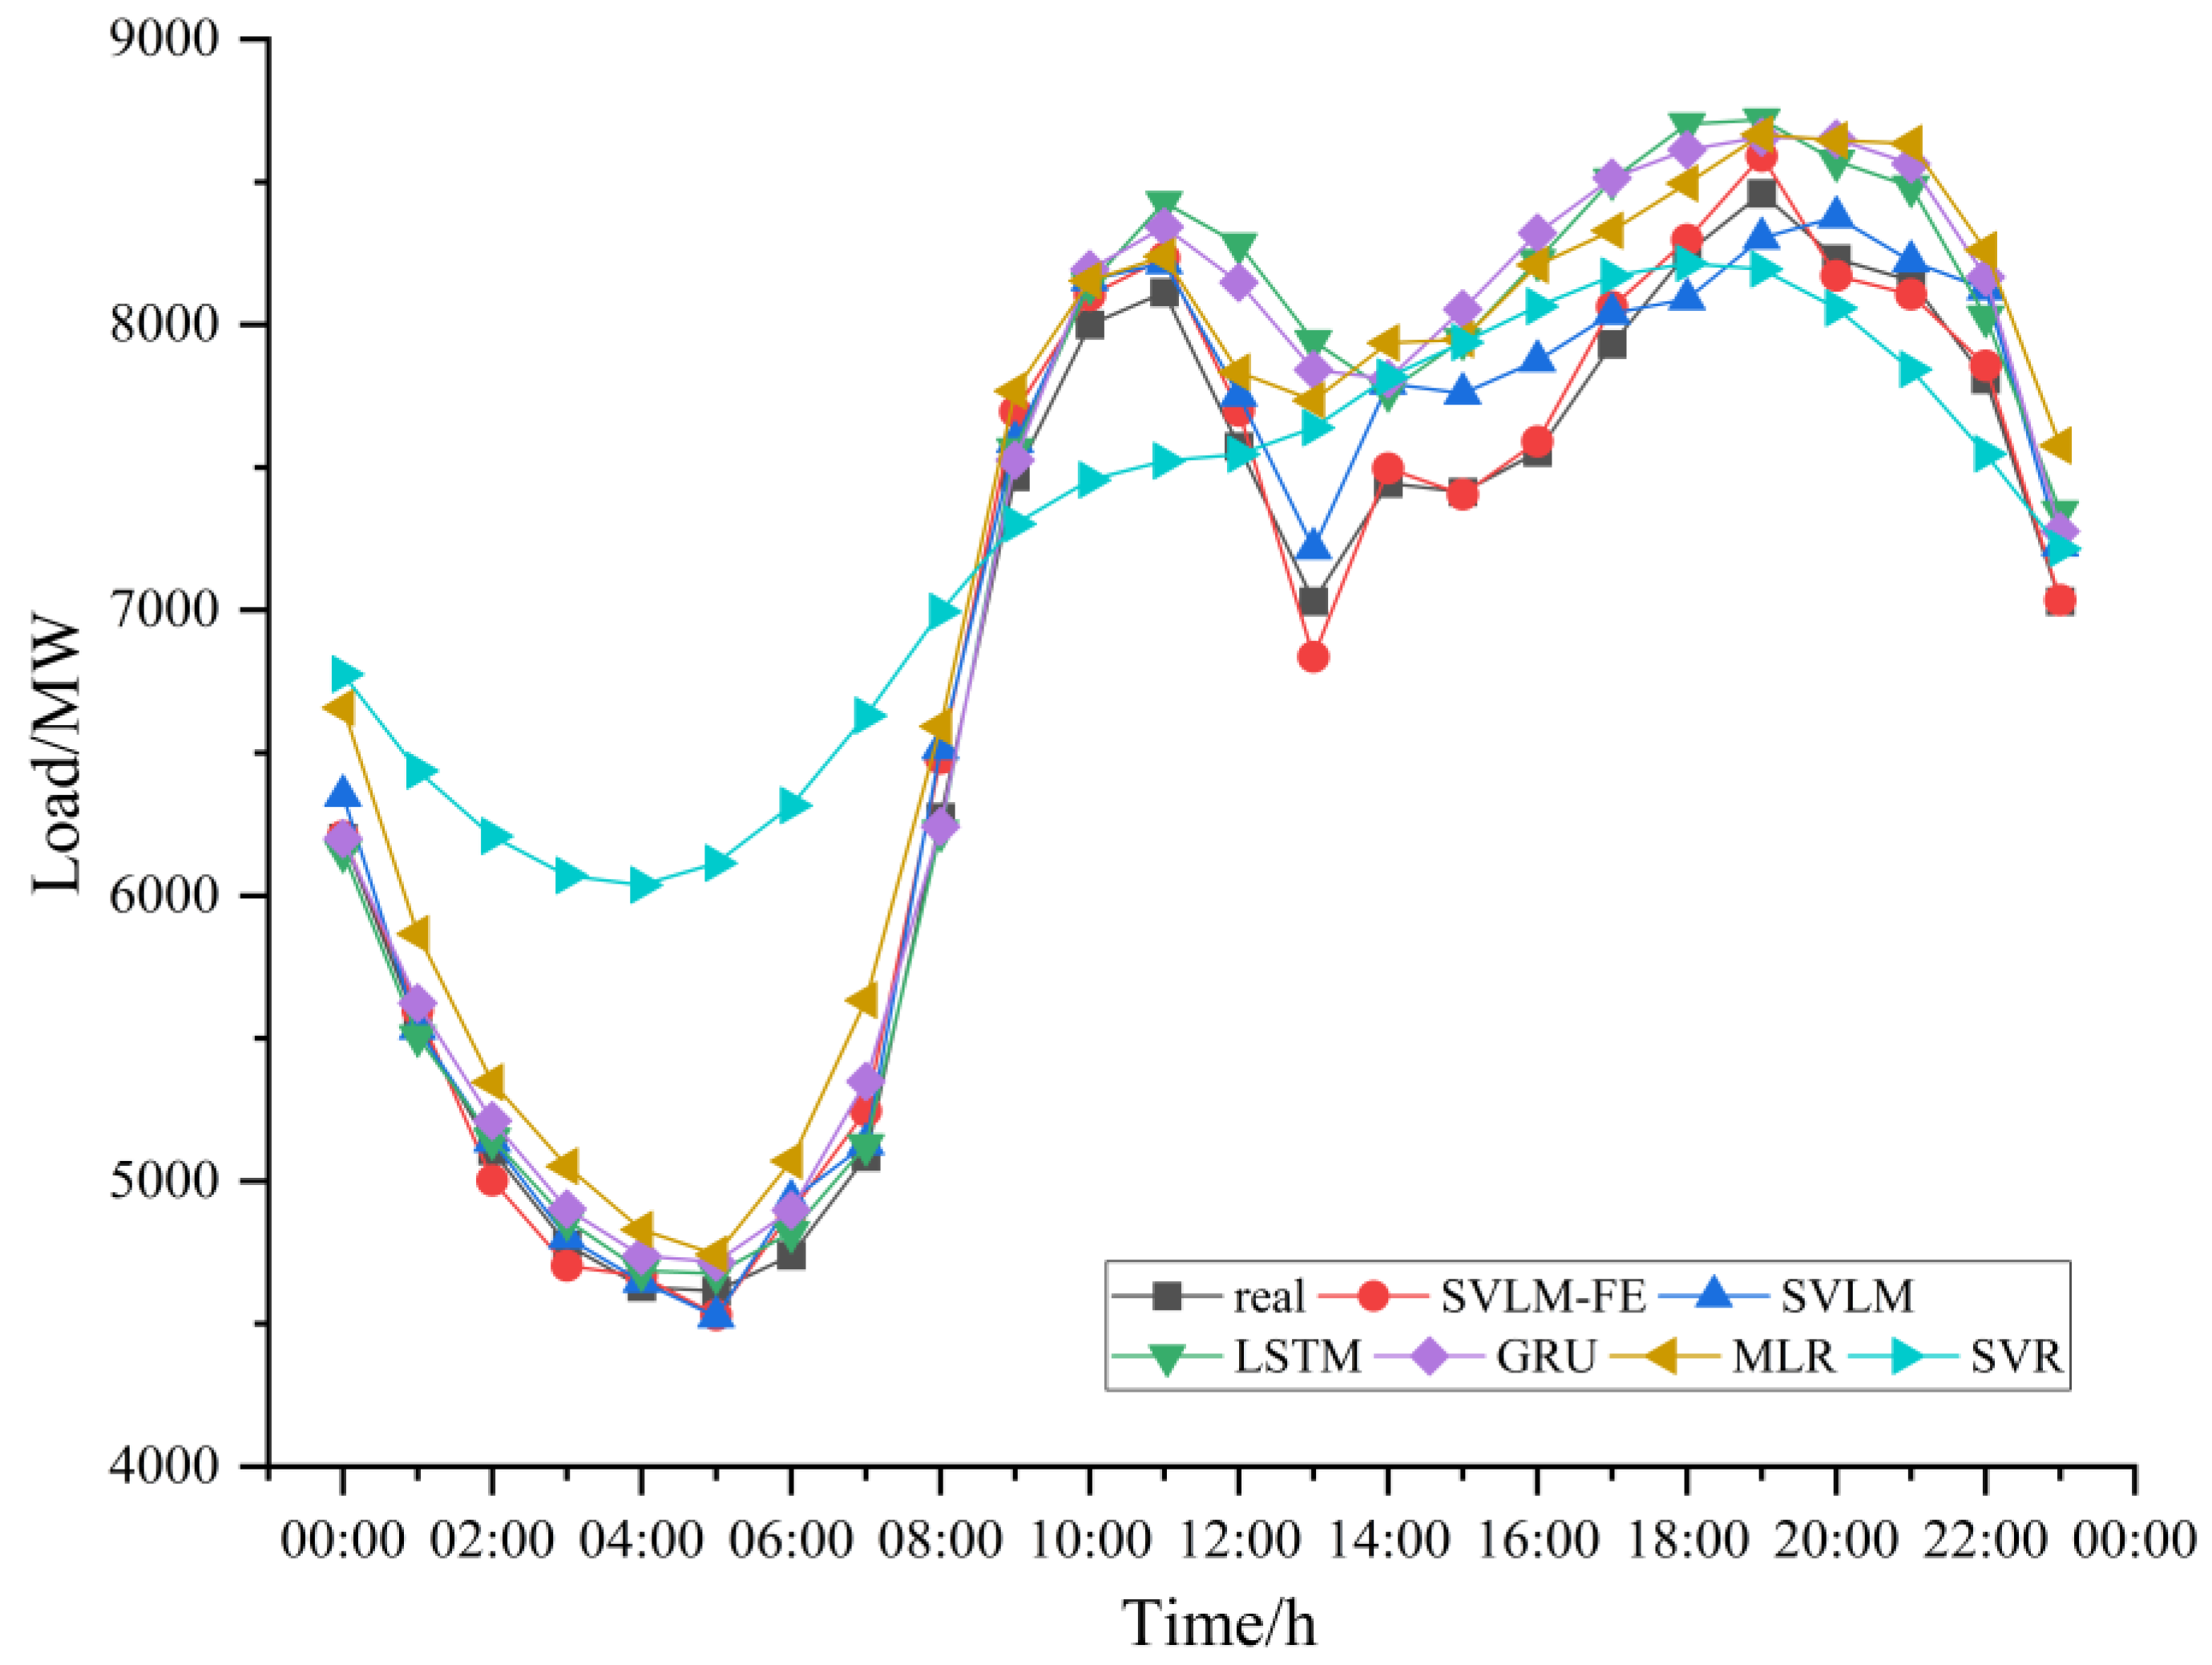
In Figure 13 it can be seen that the forecasting result of the SVLM–FE model is the closest to the real load value, and accurately predicts the key nodes in each moment of the day. The SVLM–FE model predicts the peak and trough values of the load, as well as the small peaks and troughs, with high accuracy. SVLM–FE accurately fits the load curve of the day, and gives a good judgment on the trend of the load and many details. Especially after 13:00 on the day, the SVLM–FE prediction model made an accurate judgment on the rapid change of load, while other models did not make an accurate judgment in the face of this rapid change.
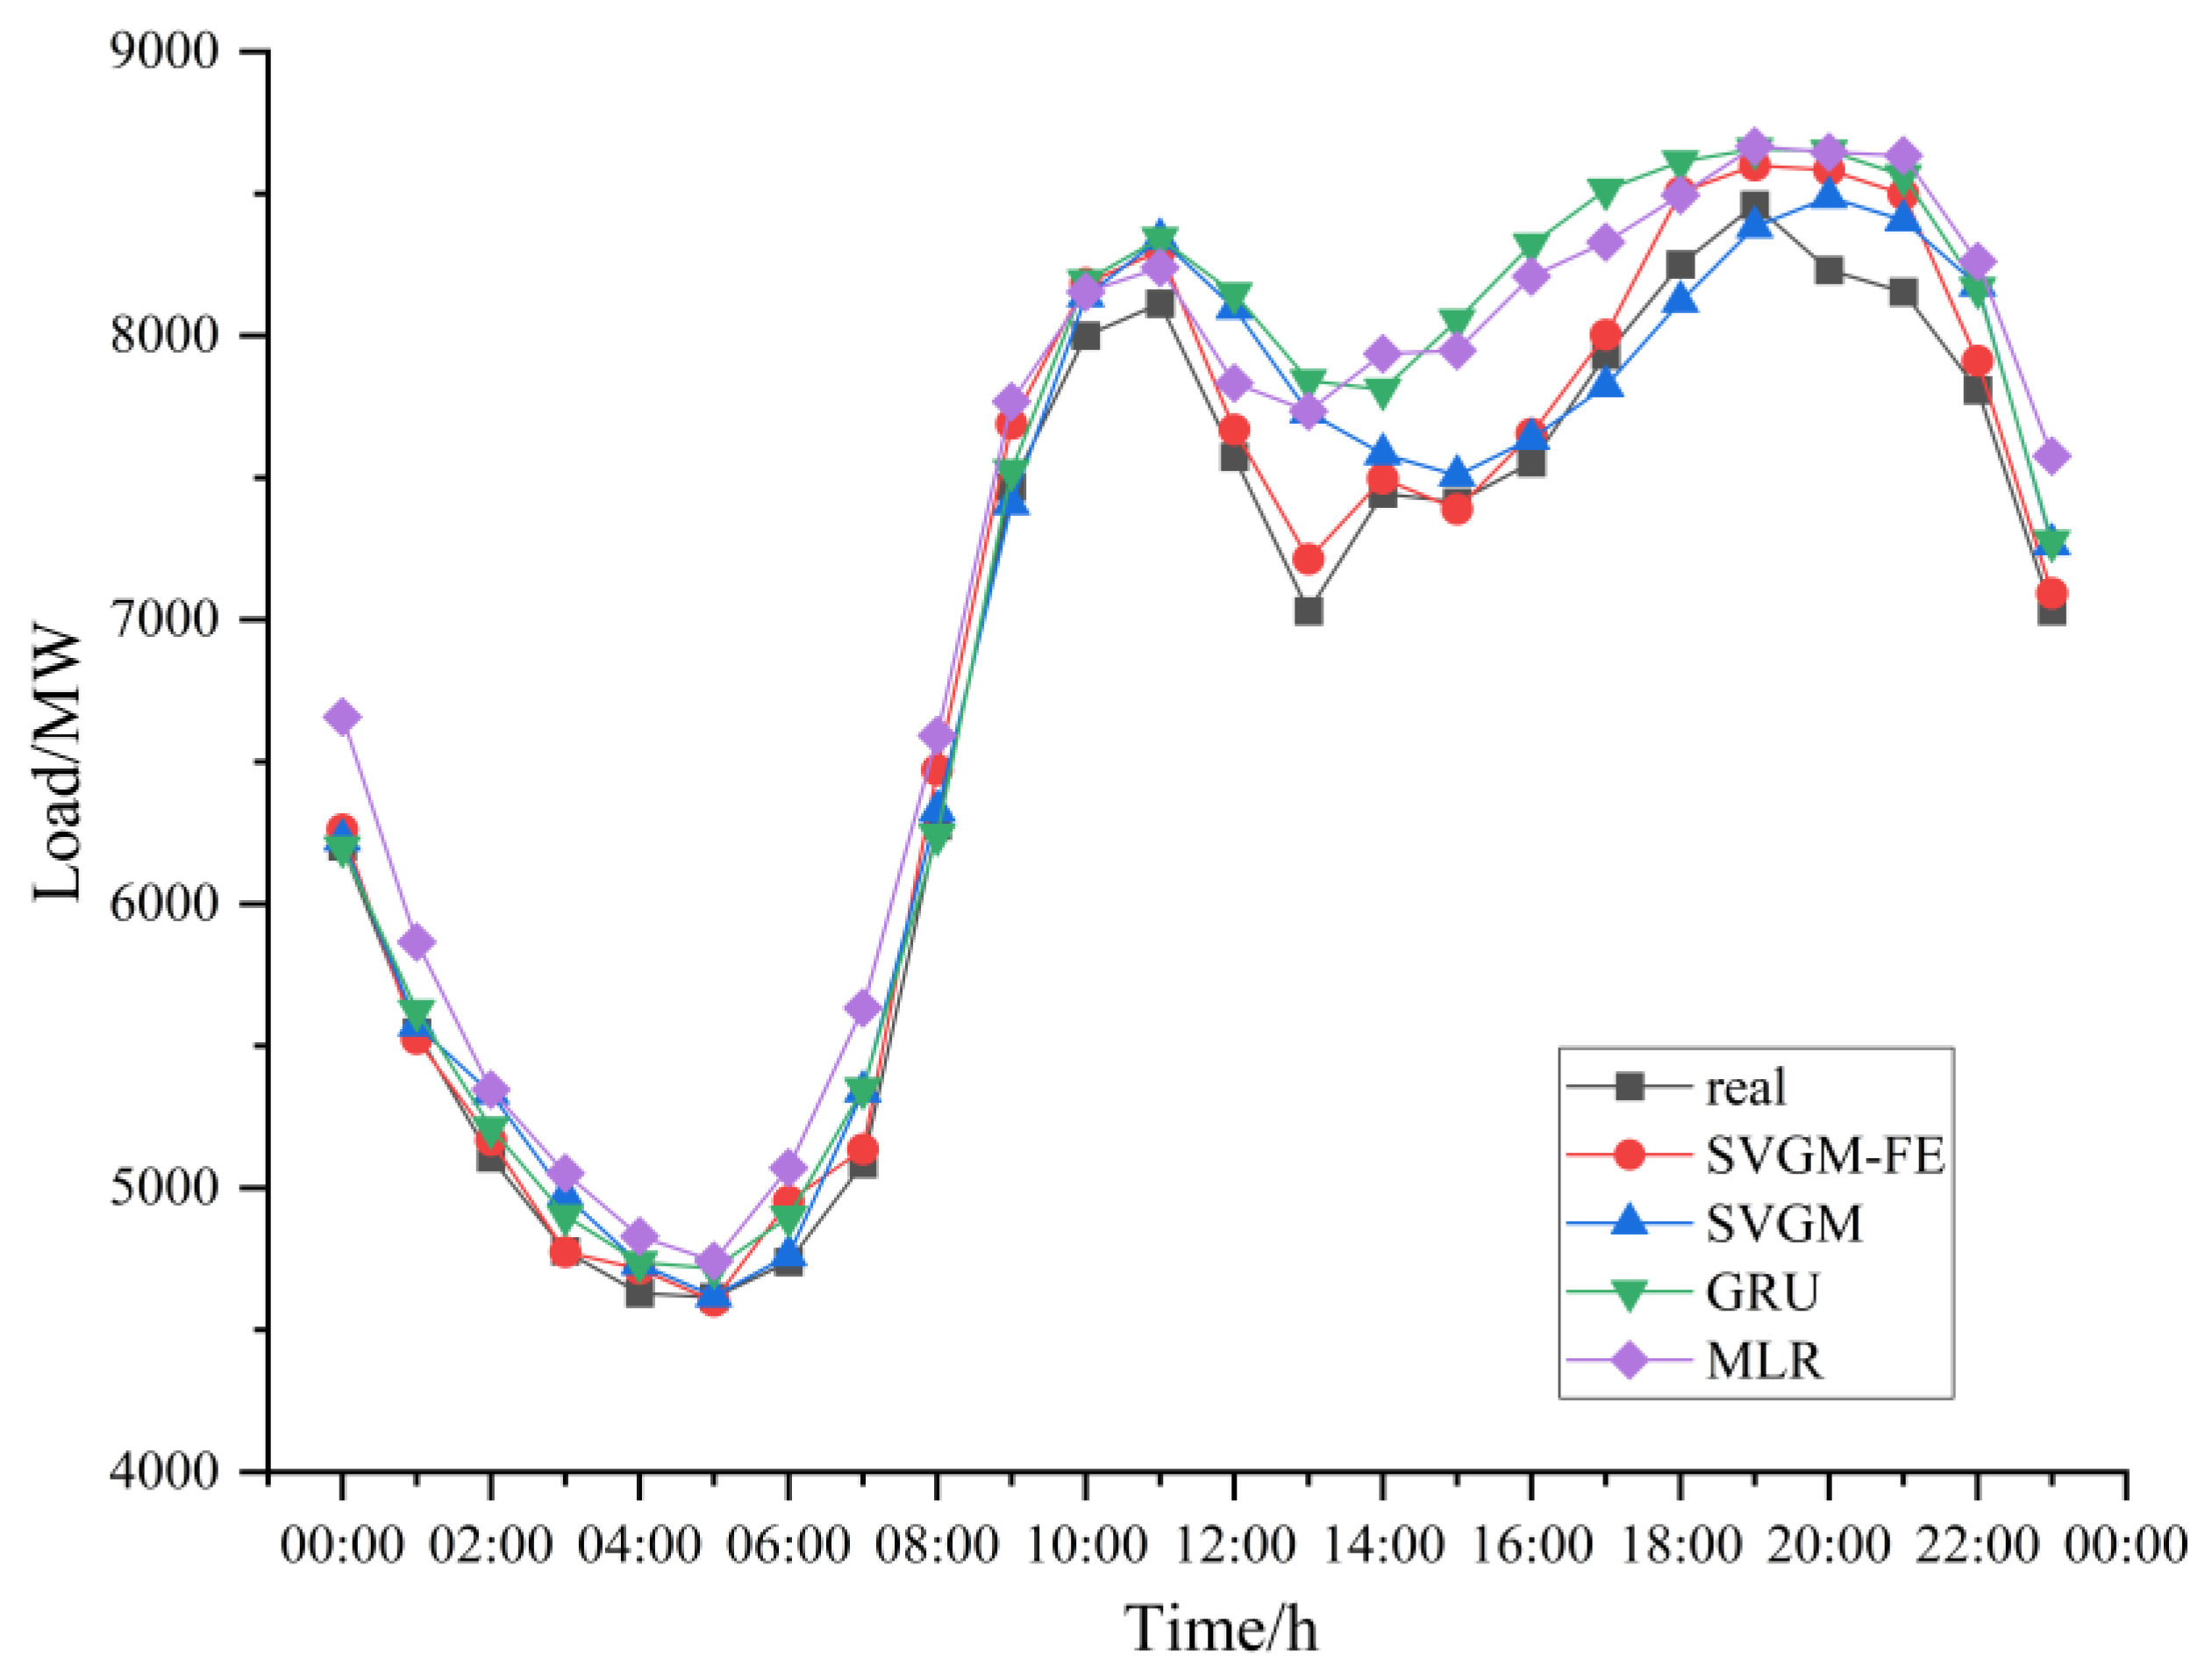
As can be seen in Table 8, and Figure 14 and Figure 15, the SVGM–FE model has the highest prediction accuracy and the best fit to the load curve in the comparison of the four prediction models, SVGM–FE, SVGM, GRU and MLR, which further demonstrates the effectiveness of constructing a short-term load forecasting model based on SSA–VMD and feature selection. A comparison with Table 7, and Figure 12 and Figure 13, shows that the forecasting performance of SVLM–FE is better than that of SVGM–FE.
In summary, in the experiments on the dataset from Place 2, the forecasting method SVLM–FE proposed in this paper achieved the best forecasting results, which means it has high accuracy and stability.

6. Conclusions

Accurate short-term power load forecasting is of great importance to the reliable and safe operation of power systems. Usually, the power load undergoes random fluctuations, and there are many complex factors influencing the load. In order to improve the accuracy of short-term load forecasting, assist in a higher level of production scheduling and planning between each department of the power system, and at the same time achieve energy saving and emission reductions, this paper proposes a short-term load forecasting model based on SSA–VMD and feature selection. The following conclusions were obtained experimentally:
(1) In view of the non-stationary characteristics of the load, the VMD is used to decompose the original load into multiple components. It is proposed to use the mean absolute error as the decomposition quality evaluation criterion, which can be extended to apply to the decomposition problem of data in time series forecasting. In order to solve the problem whereby VMD decomposition relies on the artificial setting of key parameter sets, this paper adopts SSA for VMD optimization, and uses the decomposition evaluation criterion proposed in this paper as the fitness function to construct an SSA–VMD decomposition optimization algorithm. The algorithm reduces the signal loss in the decomposition process and improves the quality of VMD decomposition, thus reducing load volatility, more effectively mining the deep time series features in load data, and laying the foundation for building a high-precision forecasting model;
(2) After decomposing the original load data via SSA–VMD, the different frequency components were forecasted separately using different methods. The SVLM model constructed in this paper shows a significant decrease in RMSE, MAE and MAPE compared to the single LSTM and MLR models. It proves the effectiveness of constructing a hybrid forecasting model based on SSA–VMD;
(3) The SVLM–FE model constructed in this paper is based on a two-stage hybrid forecasting idea. The model takes full account of the influence of load trend on the load value of the node to be predicted and the influence of related factors on the load. In the first stage, only the trend influence of power load is considered, and the forecasting value of each component is predicted. The component forecasting value is input as the feature vector to the second stage for error correction to further reduce the error. In the second stage of the model, the load component forecasts obtained in the first stage, the selected influencing factors using PCC and MIC, and the selected load values of the time nodes using ACF are fused and reconstructed into the feature vector, which is fed into the fully connected layer for forecasting to obtain the final forecasting values. Compared with the SVLM forecasting model without error correction, the forecasting accuracy of SVLM–FE was further improved, with RMSE, MAE and MAPE decreasing by 30.51%, 32.05% and 32.64% respectively. Moreover, SVLM–FE performs well at both peaks and troughs of load, and can respond promptly and accurately to the small peaks and troughs that occur when high-frequency changes in load occur. This proves that the two-stage hybrid forecasting model is effective in error correction. Additionally, the SVGM–FE model built on this idea in this paper shows sub-optimal performance in forecasting.
The forecasting method SVLM–FE proposed in this paper has a high forecasting accuracy. It is worth noting that some of the hyperparameters in the model need to be set artificially, such as the setting of hyperparameters in LSTM networks, which relies on a lot of artificial experience. In the future work, a swarm intelligence optimization algorithm can be used to determine some of the hyperparameters in the model.

Author Contributions

Conceptualization, Q.S.; methodology, Q.S.; formal analysis, W.H. and Q.S.; data curation, Q.S.; project administration, Y.H.; software, Q.S. and Y.H.; writing—original draft, Q.S; supervision, W.H. All authors have read and agreed to the published version of the manuscript.

Funding

This work was supported in part by the Natural Science Foundation of China under Grant No. 61772449, in part by the Natural Science Foundation of Hebei Province (Youth) under Grant No. D2021402043.

Institutional Review Board Statement

Not applicable.

Informed Consent Statement

Not applicable.

Data Availability Statement

Not applicable.

Conflicts of Interest

The authors declare no conflict of interest.

References

  1. Yang, Y.D.; Li, S.F.; Li, W.Q.; Qu, M.J. Power load probability density forecasting using Gaussian process quantile regression. Appl. Energy 2018, 213, 499–509. [Google Scholar] [CrossRef]
  2. Rubasinghe, O.; Zhang, T.; Zhang, X.; Choi, S.S.; Chau, T.K.; Chow, Y.; Fernando, T.; Iu, H.H.-C. Highly accurate peak and valley prediction short-term net load forecasting approach based on decomposition for power systems with high PV penetration. Appl. Energy 2023, 333, 120641. [Google Scholar] [CrossRef]
  3. Liang, Y.; Niu, D.X.; Hong, W.C. Short term load forecasting based on feature extraction and improved general regression neural network model. Energy 2019, 166, 653–663. [Google Scholar] [CrossRef]
  4. Yildiz, B.; Bilbao, J.I.; Sproul, A.B. A review and analysis of regression and machine learning models on commercial building electricity load forecasting. Renew. Sust. Energ. Rev. 2017, 73, 1104–1122. [Google Scholar] [CrossRef]
  5. Lee, C.M.; Ko, C.N. Short-term load forecasting using lifting scheme and ARIMA models. Expert Syst. Appl. 2011, 38, 5902–5911. [Google Scholar] [CrossRef]
  6. Li, Y.Y.; Han, D.; Yan, Z. Long-term system load forecasting based on data-driven linear clustering method. J. Mod. Power Syst. Clean Energy 2018, 6, 306–316. [Google Scholar] [CrossRef] [Green Version]
  7. Deng, C.R.; Zhang, X.Y.; Huang, Y.M.; Bao, Y.K. Equipping Seasonal Exponential Smoothing Models with Particle Swarm Optimization Algorithm for Electricity Consumption Forecasting. Energies 2021, 14, 4036. [Google Scholar] [CrossRef]
  8. Zheng, T.X.; Girgis, A.A.; Makram, E.B. A hybrid wavelet-Kalman filter method for load forecasting. Electr. Power Syst. Res. 2000, 54, 11–17. [Google Scholar] [CrossRef]
  9. Kandil, M.S.; El-Debeiky, S.M.; Hasanien, N.E. Long-term load forecasting for fast developing utility using a knowledge-based expert system. IEEE Trans. Power Syst. 2002, 17, 491–496. [Google Scholar] [CrossRef]
  10. Geysen, D.; De Somer, O.; Johansson, C.; Brage, J.; Vanhoudt, D. Operational thermal load forecasting in district heating networks using machine learning and expert advice. Energy Build. 2018, 162, 144–153. [Google Scholar] [CrossRef]
  11. Zhou, M.R.; Hu, T.Y.; Bian, K.; Lai, W.H.; Hu, F.; Hamrani, O.; Zhu, Z.W. Short-Term Electric Load Forecasting Based on Variational Mode Decomposition and Grey Wolf Optimization. Energies 2021, 14, 4890. [Google Scholar] [CrossRef]
  12. Hafeez, G.; Khan, I.; Jan, S.; Shah, I.A.; Khan, F.A.; Derhab, A. A novel hybrid load forecasting framework with intelligent feature engineering and optimization algorithm in smart grid. Appl. Energy 2021, 299, 24. [Google Scholar] [CrossRef]
  13. Srivastava, A.K.; Pandey, A.S.; Abou Houran, M.; Kumar, V.; Kumar, D.; Tripathi, S.M.; Gangatharan, S.; Elavarasan, R.M. A Day-Ahead Short-Term Load Forecasting Using M5P Machine Learning Algorithm along with Elitist Genetic Algorithm (EGA) and Random Forest-Based Hybrid Feature Selection. Energies 2023, 16, 867. [Google Scholar] [CrossRef]
  14. Pachauri, N.; Ahn, C.W. Regression tree ensemble learning-based prediction of the heating and cooling loads of residential buildings. Build. Simul. 2022, 15, 2003–2017. [Google Scholar] [CrossRef]
  15. Zambrano-Asanza, S.; Morales, R.E.; Montalvan, J.A.; Franco, J.F. Integrating artificial neural networks and cellular automata model for spatial-temporal load forecasting. Int. J. Electr. Power Energy Syst. 2023, 148, 108906. [Google Scholar] [CrossRef]
  16. Dong, Y.X.; Ma, X.J.; Fu, T.L. Electrical load forecasting: A deep learning approach based on K-nearest neighbors. Appl. Soft. Comput. 2021, 99, 15. [Google Scholar] [CrossRef]
  17. Kong, X.Y.; Li, C.; Zheng, F.; Wang, C.S. Improved Deep Belief Network for Short-Term Load Forecasting Considering Demand-Side Management. IEEE Trans. Power Syst. 2020, 35, 1531–1538. [Google Scholar] [CrossRef]
  18. Khan, Z.A.; Hussain, T.; Ullah, A.; Rho, S.; Lee, M.; Baik, S.W. Towards Efficient Electricity Forecasting in Residential and Commercial Buildings: A Novel Hybrid CNN with a LSTM-AE based Framework. Sensors 2020, 20, 1399. [Google Scholar] [CrossRef] [Green Version]
  19. Li, C.; Li, G.J.; Wang, K.Y.; Han, B. A multi-energy load forecasting method based on parallel architecture CNN-GRU and transfer learning for data deficient integrated energy systems. Energy 2022, 259, 13. [Google Scholar] [CrossRef]
  20. Cinar, Y.G.; Mirisaee, H.; Goswami, P.; Gaussier, E.; Ait-Bachir, A. Period-aware content attention RNNs for time series forecasting with missing values. Neurocomputing 2018, 312, 177–186. [Google Scholar] [CrossRef]
  21. Sekhar, C.; Dahiya, R. Robust framework based on hybrid deep learning approach for short term load forecasting of building electricity demand. Energy 2023, 268, 17. [Google Scholar] [CrossRef]
  22. Niu, D.X.; Yu, M.; Sun, L.J.; Gao, T.; Wang, K.K. Short-term multi-energy load forecasting for integrated energy systems based on CNN-BiGRU optimized by attention mechanism. Appl. Energy 2022, 313, 17. [Google Scholar] [CrossRef]
  23. Alsharekh, M.F.; Habib, S.; Dewi, D.A.; Albattah, W.; Islam, M.; Albahli, S. Improving the Efficiency of Multistep Short-Term Electricity Load Forecasting via R-CNN with ML-LSTM. Sensors 2022, 22, 6913. [Google Scholar] [CrossRef]
  24. Alfieri, L.; De Falco, P. Wavelet-Based Decompositions in Probabilistic Load Forecasting. IEEE Trans. Smart Grid 2020, 11, 1367–1376. [Google Scholar] [CrossRef]
  25. Sulaiman, S.M.; Jeyanthy, P.A.; Devaraj, D.; Shihabudheen, K.V. A novel hybrid short-term electricity forecasting technique for residential loads using Empirical Mode Decomposition and Extreme Learning Machines. Comput. Electr. Eng. 2022, 98, 13. [Google Scholar] [CrossRef]
  26. Fan, C.D.; Ding, C.K.; Xiao, L.Y.; Cheng, F.Y.; Ai, Z.Y. Deep belief ensemble network based on MOEA/D for short-term load forecasting. Nonlinear Dyn. 2021, 105, 2405–2430. [Google Scholar] [CrossRef]
  27. Yue, W.M.; Liu, Q.R.; Ruan, Y.J.; Qian, F.Y.; Meng, H. A prediction approach with mode decomposition-recombination technique for short-term load forecasting. Sust. Cities Soc. 2022, 85, 16. [Google Scholar] [CrossRef]
  28. Li, W.Q.; Chang, L. A combination model with variable weight optimization for short-term electrical load forecasting. Energy 2018, 164, 575–593. [Google Scholar] [CrossRef]
  29. Zhang, Z.C.; Hong, W.C. Electric load forecasting by complete ensemble empirical mode decomposition adaptive noise and support vector regression with quantum-based dragonfly algorithm. Nonlinear Dyn. 2019, 98, 1107–1136. [Google Scholar] [CrossRef]
  30. Dong, Y.C.; Zhang, H.L.; Wang, C.; Zhou, X.J. A novel hybrid model based on Bernstein polynomial with mixture of Gaussians for wind power forecasting. Appl. Energy 2021, 286, 15. [Google Scholar] [CrossRef]
  31. Wang, D.Y.; Yue, C.Q.; ElAmraoui, A. Multi-step-ahead electricity load forecasting using a novel hybrid architecture with decomposition-based error correction strategy. Chaos Solitons Fractals 2021, 152, 15. [Google Scholar] [CrossRef]
  32. Su, J.M.; Han, X.G.; Hong, Y. Short Term Power Load Forecasting Based on PSVMD-CGA Model. Sustainability 2023, 15, 2941. [Google Scholar] [CrossRef]
  33. Zhang, J.L.; Wang, S.Y.; Tan, Z.F.; Sun, A.L. An improved hybrid model for short term power load prediction. Energy 2023, 268, 9. [Google Scholar] [CrossRef]
  34. He, F.F.; Zhou, J.Z.; Feng, Z.K.; Liu, G.B.; Yang, Y.Q. A hybrid short-term load forecasting model based on variational mode decomposition and long short-term memory networks considering relevant factors with Bayesian optimization algorithm. Appl. Energy 2019, 237, 103–116. [Google Scholar] [CrossRef]
  35. Zhang, Z.J.; Wang, W.L.; Pan, G.F. A Distributed Quantum-Behaved Particle Swarm Optimization Using Opposition-Based Learning on Spark for Large-Scale Optimization Problem. Mathematics 2020, 8, 1860. [Google Scholar] [CrossRef]
  36. Ge, Q.B.; Guo, C.; Jiang, H.Y.; Lu, Z.Y.; Yao, G.; Zhang, J.M.; Hua, Q. Industrial Power Load Forecasting Method Based on Reinforcement Learning and PSO-LSSVM. IEEE Trans. Cybern. 2022, 52, 1112–1124. [Google Scholar] [CrossRef]
  37. Lai, C.Z.; Wang, Y.; Fan, K.; Cai, Q.L.; Ye, Q.; Pang, H.Q.; Wu, X. An improved forecasting model of short-term electric load of papermaking enterprises for production line optimization. Energy 2022, 245, 11. [Google Scholar] [CrossRef]
  38. Veeramsetty, V.; Reddy, K.R.; Santhosh, M.; Mohnot, A.; Singal, G. Short-term electric power load forecasting using random forest and gated recurrent unit. Electr. Eng. 2022, 104, 307–329. [Google Scholar] [CrossRef]
  39. Li, S.; Wang, P.; Goel, L. A Novel Wavelet-Based Ensemble Method for Short-Term Load Forecasting with Hybrid Neural Networks and Feature Selection. IEEE Trans. Power Syst. 2016, 31, 1788–1798. [Google Scholar] [CrossRef]
  40. Hu, Z.Y.; Bao, Y.K.; Xiong, T.; Chiong, R. Hybrid filter-wrapper feature selection for short-term load forecasting. Eng. Appl. Artif. Intell. 2015, 40, 17–27. [Google Scholar] [CrossRef]
  41. Ling, J.H.; Dai, N.; Xing, J.C.; Tong, H. An improved input variable selection method of the data-driven model for building heating load prediction. J. Build. Eng. 2021, 44, 11. [Google Scholar] [CrossRef]
  42. Dragomiretskiy, K.; Zosso, D. Variational Mode Decomposition. IEEE Trans. Signal Process. 2014, 62, 531–544. [Google Scholar] [CrossRef]
  43. Xue, J.K.; Shen, B. A novel swarm intelligence optimization approach: Sparrow search algorithm. Syst. Sci. Control Eng. 2020, 8, 22–34. [Google Scholar] [CrossRef]
  44. Hochreiter, S.; Schmidhuber, J. Long short-term memory. Neural Comput. 1997, 9, 1735–1780. [Google Scholar] [CrossRef] [PubMed]
  45. Reshef, D.N.; Reshef, Y.A.; Finucane, H.K.; Grossman, S.R.; McVean, G.; Turnbaugh, P.J.; Lander, E.S.; Mitzenmacher, M.; Sabeti, P.C. Detecting Novel Associations in Large Data Sets. Science 2011, 334, 1518–1524. [Google Scholar] [CrossRef] [PubMed] [Green Version]
Figure 1. The power load dataset of Place 1. The load dataset is taken from a place in China, spanning the period from 1 January 2013 to 10 January 2015, with a sampling interval of 1 h and 24 sampling points per day, for a total of 17,760 pieces of data.
Applsci 13 06845 g001
Figure 2. The flow chart of SSA.
Applsci 13 06845 g002
Figure 3. The internal structure of the LSTM.
Applsci 13 06845 g003
Figure 4. Heat map of quantitative analysis based on PCC for Place 1.
Applsci 13 06845 g004
Figure 5. Power load of Place 1 ACF plot.
Applsci 13 06845 g005
Figure 6. SVLM–FE short-time power load forecasting model.
Applsci 13 06845 g006
Figure 7. The decomposition results of the SSA–VMD algorithm of Place 1.
Applsci 13 06845 g007
Figure 8. Comparison of the evaluation criteria of SVLM–FE and other models in Place 1.
Applsci 13 06845 g008
Figure 9. Load forecasting results of SVLM–FE and other models in Place 1.
Applsci 13 06845 g009
Figure 10. Comparison of the evaluation criteria of SVGM–FE and other models in Place 1.
Applsci 13 06845 g010
Figure 11. Load forecasting results of SVGM–FE and other models in Place 1.
Applsci 13 06845 g011
Figure 12. Comparison of the evaluation criteria of SVLM–FE and other models in Place 2.
Applsci 13 06845 g012
Figure 13. Load forecasting results of SVLM–FE and other models for Place 2.
Applsci 13 06845 g013
Figure 14. Comparison of the evaluation criteria of SVGM–FE and other models in Place 2.
Applsci 13 06845 g014
Figure 15. Load forecasting results of SVGM–FE and other models in Place 2.
Applsci 13 06845 g015
Table 1. Comprehensive analysis of relevant references.
Types of Forecasting MethodsReferencesAdvantagesImprovement Requirement/Disadvantage
Traditional forecasting methods/statistics-based forecasting methods[4,5,6,7,8]This type of method has the advantage of being simple and fast, with a good fit and forecasting for smooth curves.This type of method is less effective in forecasting load data that are more volatile.
Artificial intelligence forecasting methods[9,10,11,12,13,14,15,16,17]Artificial intelligence methods are more widely applied and have a better forecasting effect.The single model does not sufficiently tap the information in the historical load data.
CNN with RNN combination[18,19,20,21,22,23]CNN can fully exploit the information in historical load data and influencing factors, and input the extracted feature vectors into RNN for forecasting. This type of method has high forecasting accuracy.This type of method is less interpretable.
Decomposing the original load data before forecasting[3,24,25,26,27,28,29,30,31,32,33,34]This type of method reduces the volatility of the original load data, and the different components obtained from the decomposition are forecasted individually, with the various methods forming a complementary advantage.A better decomposition algorithm should be chosen for the forecasting method to avoid mode mixing and to minimize decomposition residuals as much as possible.
Using swarm intelligence optimization algorithms in forecasting models to determine optimal parameters[21,29,35,36,37]The method is able to determine the optimal parameters in the model more efficiently and improve the forecasting performance of the model.Improving the global exploration capability and convergence speed of swarm intelligence optimization algorithms.
Using feature selection in forecasting models[39,40,41]The dimensionality of the feature vectors is reduced. Ensuring the efficient input of feature vectors into the model and ensuring a model is lightweight.The combination of different feature selection and correlation analysis methods can be considered.
Table 2. Range of correlation coefficients.
Coefficient range0~0.20.2~0.40.4~0.70.7~1
Degree of correlationWeakModerateStrongExtremely strong
Table 3. The top 8 ACF values of Place 1.
Time Lag after Moment tACF
t + 10.93179404
t + 20.821509785
t + 230.830599002
t + 240.891476616
t + 250.823931258
t + 480.830191602
t + 720.808749547
t + 1680.838642637
Table 4. PCC and MIC between influencing factors and loads in Place 1.
Types of Influencing FactorsInfluencing FactorsPCCMIC
Meteorological factorsMaximum temperature (°C)0.41820.2572
Minimum temperature (°C)0.44940.2771
Average temperature (°C)0.44650.2856
Average relative humidity (RH%)0.12570.0729
Rainfall (mm)0.04600.0710
Time factorYear0.07780.0721
Month0.28070.1942
Day0.10190.0602
Always0.42520.4036
Week date−0.10630.0745
Table 5. SVLM–FE and other models’ evaluation criteria of Place 1.
ModelRMSE/MWMAE/MWMAPE/%Computing Time/s
SVLM–FE128.169102.5251.562276.158
SVLM184.446150.8722.319247.971
LSTM361.911268.1643.88486.251
GRU401.552354.5555.35065.686
MLR393.017357.7825.4941.621
SVR816.883701.89710.84314.884
Table 6. SVGM–FE and other models’ evaluation criteria of Place 1.
ModelRMSE/MWMAE/MWMAPE/%Computing Time/s
SVGM–FE177.798134.9301.979204.812
SVGM254.897195.2872.589179.133
GRU401.552354.5555.35065.686
MLR393.017357.7825.4941.621
Table 7. SVLM–FE and other models’ evaluation criteria of Place 2.
ModelsRMSE/MWMAE/MWMAPE/%Computing Time/s
SVLM–FE111.63692.2911.426273.897
SVLM184.481154.9362.207244.941
LSTM371.084279.1533.79083.172
GRU376.590299.3964.19864.352
MLR399.085365.7945.4901.636
SVR808.662642.18811.43514.842
Table 8. SVGM–FE and other models’ evaluation criteria for Place 2.
ModelRMSE/MWMAE/MWMAPE/%Computing Time/s
SVGM–FE160.937128.2361.810203.921
SVGM241.331179.2752.608177.586
GRU376.590299.3964.19864.352
MLR399.085365.7945.4901.636
Disclaimer/Publisher’s Note: The statements, opinions and data contained in all publications are solely those of the individual author(s) and contributor(s) and not of MDPI and/or the editor(s). MDPI and/or the editor(s) disclaim responsibility for any injury to people or property resulting from any ideas, methods, instructions or products referred to in the content.