Abstract
Anomaly detection (AD) has captured a significant amount of focus from the research field in recent years, with the rise of the Internet of Things (IoT) application. Anomalies, often known as outliers, are defined as the discovery of anomalous occurrences or observations that differ considerably from the mainstream of the data. The IoT which is described as a network of Internet-based digital sensors that continuously generate massive volumes of data and use to communicate with one another theMessage Queuing Telemetry Transport (MQTT) protocol. Brute-force, Denial-of-Service (DoS), Malformed, Flood, and Slowite attacks are the most common in theMQTT network. One of the significant factors in IoT AD is the time consumed to predict an attack and take preemptive measures. For instance, if an attack is detected late, the loss of attack is irreversible. This paper investigates the time to detect an attack using machine learning approaches and proposes a novel approach that applies correlation analysis to reduce the training and testing time of these algorithms. The new approach has been evaluated on Random Forest, Decision Tree, Naïve Bayes, Multi-Layer Perceptron, Artificial Neural Network, Logistic Regression, and Gradient Boost. The findings indicate that the correlation analysis is significantly beneficial in the process of feature engineering, primarily to determine the most relevant features in the MQTT dataset. This is, to the best of our knowledge, the first study on MQTTset that reduces the prediction time for DoS 0.92 (95% CI −0.378, 2.22) reduced to 0.77 (95% CI −0.414, 1.97) and for Malformed 2.92 (95% CI −2.6, 8.44) reduced to 0.49 (95% CI −0.273, 1.25).
1. Introduction
The IoT is a network of sensors and computational devices that work together to solve problems and provide innovative features [1]. The IoT is a collection of physical objects—“things”—embedded with sensors, apps, and other technology for connecting and transmitting data with other devices and systems through the internet [2,3,4]. In recent years, the IoT has evolved as one of the most significant technologies of the 21st era. The IoT’s automated network connection grows increasingly complicated as demand and expansion increase [5].
The delays in anomaly detection cause significant and irrecoverable losses, such as unauthorized access or blockage of the IoT network by a malicious attack. The purpose of this study is to reduce the computational time for building the prediction models and overcome the problem of overfitting, which appears due to irrelevant attributes in the training dataset. The higher number of attributes in a model leads to an increase in the variance of prediction models. The training time of the model or its architectural complexity may cause the model to overfit. If the model trains on the training data for too long or is too complex, it learns the noise or irrelevant information within the dataset [6]. The new approach applies Pearson correlation [7] to determine the severity of dependencies among the attributes of the MQTTSet [8] dataset. In the first phase, the dataset has been categories in which the dataset is splitted into three subsets of corresponding type of attacks such as Brute-force (BF), denial-of-service (DoS), and malformed attacks. These attacks are chosen due to appearance of high frequencies of attacks in the MQTTset dataset. In the next phase, correlation matrices are generated for each of these subsets. The generated correlation matrices revealed that some of the features are highly correlated, while some have zero or weak correlation. The attributes having zero or weak correlation (r < 0.1) were eliminated from the corresponding subsets. In the final stage, ML algorithms such as Random Forest, Decision Tree, Naive Bayes, Multi-Layer Perceptron, Artificial Neural Network, Logistic Regression, and Gradient Boost are applied to train and test the prediction model on these datasets. As an evaluation measure, the prediction accuracy, F1 score, training and testing time have been recorded. The results show that in malformed and DoS attacks, the training time reduced to 83.21% and 16.3%, respectively.
“Big Data” refers to a large volume of data that is continually increasing over time. It is such a vast and complicated data collection that none of the usual tools for data management can save or evaluate data efficiently. The five fundamental and inherent characteristics of big data are the 5 V’s (velocity, volume, value, variety, and veracity) that enables data scientists to extract more value from their findings [9]. The IoT sensors generates enormous amount of data which arrives at high speed, therefore the time consumption in predicting the attacks in Big Data and improving the reliability is one of the most significant challenges in ML.
Using low-cost computers, the cloud, big data analytics, and physical smart objects that can exchange and gather data with minimum human participation in embedded systems that can detect, monitor, and change every interaction among networked devices [4,10].
Amazon and Facebook, for example, employ the MQTT protocol. MQTT, which is based on a publish/subscribe communication pattern, represents machine-to-machine (M2M) protocols. This protocol is intended to be used on devices with low memory and computing power [11].
1.1. MQTT Architecture
MQTT is regarded as the most advantageous connection protocol for M2M and IoT. It employs the publish/subscribe approach for easy deployment and flexible transition see Figure 1 depicts the MQTT publish/subscribe pattern. MQTT is suitable for re-source-constrained devices used on low-bandwidth or unstable networks. MQTT, like the Hypertext Transfer Protocol, is built on top of the TCP protocol (HTTP). It is designed, therefore, to provide a lower communication cost than HTTP [12], however, it sends messages at three different QoS levels. MQTT is divided into two distinct standards. MQTT v3.1 is the first, followed by MQTT-SN, sometimes known as MQTT-S (V1.2) [13]. MQTT-SN, as opposed to MQTT, employs the UDP protocol. Amazon Web Services just began supporting the MQTT protocol [14]. MQTT is a numerous-to-many networking standard that sends messages among several devices via a central broker.
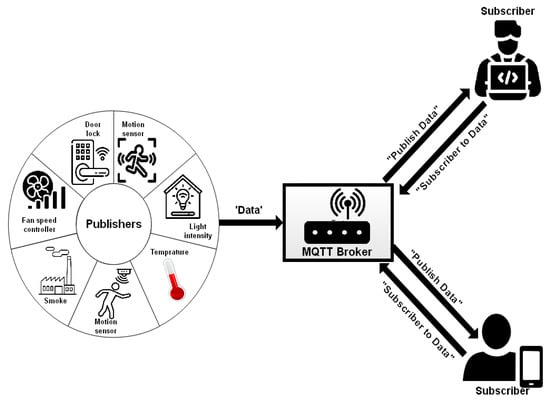
Figure 1.
System structure of MQTT [8].
MQTT devices communicated with the broker using a long-lived outbound TCP link, which was initially burdened by limited devices. To allow communication through MQTT, all devices need to be aware of the message formats in advance [15]. An MQTT broker is an intermediary entity that connects MQTT clients. Specifically, a MQTT broker receives messages generated by clients, filters them by subject, and spreads them to subscribers.
1.2. Anomaly Detection in the IoT
Anomaly detection in network activity is a popular and continuing research topic, particularly when it comes to IoT devices, which are rapidly expanding throughout numerous circumstances in people’s daily lives while also being vulnerable to attack via various weak areas [16]. The identification of anomalies and attacks in the IoT environment has recently been explored in [17] the authors raised some key challenges in the domain of IoT such as computational issue, fault tolerance issue, privacy and security issue, reliability issue etc., that requires an immediate concern. The authors also investigated the anomalies and assaults in scanning, malicious activity, denial of service, espionage, data type exploration, incorrect configuration, and malicious control that might cause an IoT system to fail. However, the main challenges are the reliability of dataset which includes the completeness and relevancy of input data. The major concerns of IoT security has been discussed in [12,13] the authors focused on IoT networks that comprise not only the security of the sensor network but also the internet and mobile network connectivity. The authors also noticed how anomalies and data leaks in IoT devices have become more common in re-cent years. The detection of attacks and abnormalities in IoT networks is a crucial problem in the IoT industry. As a result, threats and assaults are increasing in tandem. In this study, the abilities of multiple ML models to successfully anticipate attacks and abnormalities on IoT systems are compared. The performance criteria utilized for comparison include accuracy, and the F1 score [17]. The author [18] discussed a real-world issue in which an Anomaly Detection System (ADS) in a smart health monitoring IoT ecosystem was used to monitor occurrences of relevance involving patients’ health and environment, and also network attacks. It has been proven that combining communications infrastructure monitoring and e-health monitoring into a single system optimizes resources and maintains the stability of the system. The author’s proposed ADS is created and evaluated using a simulated data-set analysis to demonstrate high detection accuracy, with both healthcare advances and IoT network assaults included.
The author of [19] addressed the loss of data privacy by making consumers lose control of their health data by utilizing the limited processing power and storage capabilities of IoT systems, such as the hospital database or cloud. In Wireless Sensor Network (WSN) attacks, ML addresses a wide range of IoT security needs for digital sensors [20], which must adapt to a dynamic digital ecosystem. Massive volumes of historical data are used by ML to discover patterns that can be applied to future situations.
As previously indicated, ML architecture may offer the basic required services and robust security mechanisms to safeguard IoT devices. A signature-based system and an anomaly-based system [21] are two types of attack detection systems. Signature-based system attacks are based on malware matching particular patterns in network traffic, such as byte sequences or malicious instruction sequences [22]. Therefore, using anomaly-based techniques, unidentified attacks or deviations from normal traffic are detected [23].
The advantage of utilizing a ML detection methodology is that it’s faster than other methods and can tackle challenges presented by unknown risks [24]. As a result, data analysis approaches are employed in this work. The main purpose of the system is to create smart, safe, and long-lasting sensor connectivity that can identify flaws and operate as a strong firewall against threats.
This paper aims to categorize and prioritize assaults in a MQTT dataset depending on their frequency. Therefore, research also performs the Exploratory Data Analysis (EDA) for an anomaly-based system for detecting intrusions in the IoT that utilizes ML techniques. A generic taxonomy for the various ML algorithms such as Random Forest (RF) [25], Decision Tree (DT) [26], Naïve Bayes (NB) [27], Gradient Boost (GB) [28], Multi-layer Perceptron (MLP) [28], Artificial Neural Network (ANN) [29], and Logistic Regression (LR) [29] for anomaly identification that is utilized for Feature Engineering in the anomaly-based MQTT dataset in the IoT is presented. At the end, to evaluate the more precise results, the investigation of reducing ML-based methodologies for anomaly-based intrusion detection methods in the IoT that employ ML is required.
1.3. Contribution of the Study
The main contributions of this paper are summarized below:
- The paper investigated the time taken to detect an attack using ML approaches and proposed a novel approach that applied correlation analysis to reduce the training and testing time of these algorithms. The new approach was evaluated on various ML models, including RF, DT, NB, MLP, ANN, LR, and GB. The findings indicated that correlation analysis was significantly beneficial in the feature engineering process, primarily in identifying the most relevant features in the MQTT dataset.
- The paper investigated how to categorize and prioritize attacks based on their frequency using the MQTTset reduced dataset. In particular, the article identifies DoS, BF, and Malformed attacks as the most frequent attacks and selected them for further simulation.
- A comprehensive evaluation of state-of-the-art ML-based methodologies for anomaly-based intrusion detection systems in the IoT was conducted. Notably, when applying ML algorithms such as RF, DT, NB, MLP, ANN, LR, GB, and DNN to datasets without irrelevant attributes, significant reductions in training time were achieved. The evaluation was based on metrics such as precision, recall, F1 score, training time, and testing time, which are indicative of prediction accuracy.
This study discusses the challenges and future direction of ML-based anomaly detection in the IoT domain. The rest of the article is organized as follows: In Section 2, the research efforts on IoT attacks and AD are described using a related critical review. In Section 3, by using the dataset, different types of sensors and anomalies are attacked. Section 4 discusses the proposed approach and methodology using a Pearson correlation analysis. Section 5 discusses an experimental setup using ML models, significant findings, and a conclusion.
2. Critical Review
The authors in [30] introduced the IoT-enabled smart transportation and healthcare system which has gained popularity among academics and practitioners. In this research the authors have resolved the challenges of object detection and semantic segmentation in the context of IoT by using ML techniques. The author of [31] discusses improving the new enhancements in health wearable devices that are challenged by upgrading with innovative technology and resources that can be monitored periodically and regularly. The author offers a technique for monitoring IoT applications by using ML techniques to create an advanced tracking automation system and make decisions for proper diagnosis [32]. Concentrated on AD, which is characterized as a significant interest in detecting known or undiscovered anomalous complicated patterns of different destructive assaults in network protocols. The author chose the problem of a non-trivial algorithm that classifies data instances and where various application areas have different perspectives on anomalies. In the medical field, for example, a minor deviation is considered an anomaly. The author re-solved these challenges by utilizing ML, which is one of the most important techniques for AD since it automatically learns the system’s information or actions and is capable of recognizing complicated patterns. As a result, the computer’s functionality is threatened. The sophistication of IoT networks exposes their systems to dangerous vulnerabilities. Security flaws and abnormalities in IoT devices have become more common in recent years [33,34]. Several comparable efforts have been done in IoT, and academics are still researching in this field [35]. Created a detector and firewall to detect an abnormality at an IoT site. Clustering methods such as K-Means were used in this study for various IoT sectors. In clustering, different clusters were brought together if the center is inside three times the average deviation distance. A detailed explanation of a home automation system in which security breaches were uncovered utilizing a variety of ML approaches is presented in [36]. They mostly detailed a Denial of Service (DoS) attack on a basic IoT site. According to [37] a detector for On and Off attacks by a fraudulent network node in an industrial IoT site was presented. They suggested that an IoT network may be assaulted by a compromised node when it is operational or turned On. Moreover, while the malicious node is in the dormant or Off state, the IoT network works normally. For the identification of such an abnormality, the system was created using a light probe routing strategy, with each neighbor node’s trust estimation computed. The current security concern while building embedded technology for the IoT was described in [38]. Monitoring data flow between the IoT device’s physical, logical, and virtual parts was also difficult. To overcome these concerns, the authors of this paper suggested using digital watermarking [39] Published a paper describing an IoT intrusion detection system. Several ML classifiers have been successfully utilized to identify network monitoring probing and fundamental sorts of DoS attacks. Investigated the detection of problems in healthcare analytic using IoT [40]. This paper also offered a model for identifying heart abnormalities using a smartphone. IoT sensors, medical image analysis biomedical signal analysis, big data mining, and predictive analytic was applied to uncover abnormalities in healthcare. Several assaults on IoT networks may be identified in the literature, ranging from examining the impact of some well attacks in IoT settings [41] to suggesting unique threats targeting IoT networks, protocols, or nodes [42]. Threats to infrastructure and networks are detected using ML algorithms.
ML methods are utilized to identify cyber attacks through training the algorithm to use the KDDCUP99 [43], whereas the KDDCUP99 [44] employs RF, DT, and GB algorithms to develop intrusion detection systems, and NB techniques are used for cyber-protection [45].
The above synthesis table summarizes the critical review which includes the year of papers, problems, approaches, merits, demerits, or research see Table 1: MQTTset is a dataset that uses raw traffic data from the MQTT protocol and is commonly used in IoT contexts. It is crucial to note that public datasets such as KDDCUP99 are available. Rather, MQTTset is distributed as both CSV and PCAP raw data, allowing users to manually handle raw data and generate alternative CSV files as needed. The proposed dataset, in particular, encompasses both valid and malicious traffic.The following Table 2 describes previous work on MQTTset dataset.

Table 1.
Summarizes the critical review which includes the year of papers, problems, approaches, merits, demerits or research gap.
Table 2.
The previous work on MQTTset dataset.
3. The MQTTset Dataset
The MQTT dataset [8] used in this research has been provided to the scientific and industry communities to help with data analysis, ML, and AI in the context of IoT. The situation is based on a smart home setup in which 10 MQTT sensors collect data such as humidity, temperature, light intensity, CO-Gas, sensors for motion, smoke, fan, door lock, and fan speed. The readings arrive at varied intervals according to the unique behavior of every sensor. As shown in Figure 2, the sensors are divided into two rooms. The dataset simulates network attacks namely Malformed [60], Brute force [61], and DoS [62], the description of these attacks can be found in Section 4.4.

Figure 2.
MQTTset considers a circumstance [8].
4. Proposed Approach
This paper proposes a novel approach to AD in IoT problems by using correlation analysis for feature engineering. To the extent of our knowledge, this is the first study that applies categories and prioritization in statistical correlation for feature engineering. The existing approaches, such as [63,64], did not focus on feature engineering before training the prediction models. This section is organized into six sub-sections.
4.1. Methodology
The MQTTset open-source data collection includes 34 features and 330,926 categorical samples which has been reduced and only the most relevant. Correlation analysis is a statistical tool used in research to calculate the level of a relationship between two varia-bles. The level of variation in a single variable as a consequence of an alteration in another is computed using correlation analysis. A high correlation suggests a significant relationship between the two variables, whereas a weak relationship indicates a weak rela-tionship. When a rise in one variable causes an increase in the other, there is a strong cor-relation. A negative correlation, on the other hand, suggests that when one variable grows, the other falls, and vice versa [65]. The exploratory analysis is performed in python [66].
4.2. Data Preprocessing
Data preprocessing is a central activity for identifying and selecting characteristics since it boosts efficiency while providing dependable and precise information [67]. The primary needs for ML study are inferential statistical observation and analysis. The primary purpose of a classification model is to provide the data to an optimal classifier. As a result, dealing with missing data is the first step in this stage. The detection of IoT threats and abnormalities. The raw data from the sensor, or CSV file, is the framework’s initial process. The dataset was acquired and thoroughly observed during this phase to determine how to categorize and prioritize the various anomalies of data. Furthermore, data preparation was applied to the dataset see Figure 3.
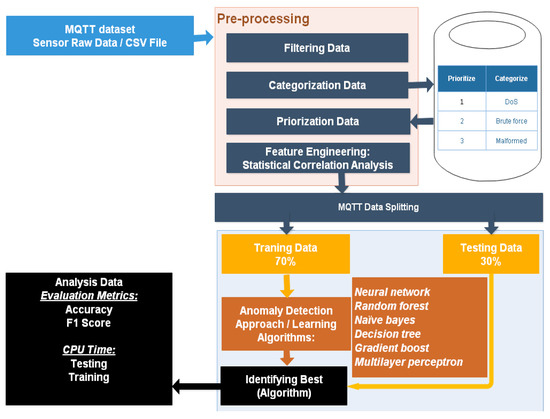
Figure 3.
MQTT Protocol and Architecture.
4.3. Filtering Data
Filtering data [67], helps in the elimination of redundant data. such as to remove the outliers, repetitive values, missed values, none, symbol values, and those values that contain two types of fields, such as integers and strings. By using data filtering to exclude all records that contain either type of field. Filtering data (to remove the null, symbol values, etc.), categorize the different anomaly attacks in the MQTT sets (DoS attack, brute-force at-tack, malformed attack, flood attack, and solwite attack), prioritized the attack w.r.t frequency of attacks on the IoT sensors.
4.4. Categorize Data
Three types attacks are considered and compared with legitimate data the categories of attacks are used in this research such as DoS attack Brute force attack, Malformed attack which are describe below.
4.4.1. Denial of Service (DoS) Attack
DoS attack are carried out in order to prevent genuine customers from accessing the service [62]. In this example, the MQTT protocol is used to overload the broker by creating many links with the broker and transmitting the maximum number of messages available for each connection.
4.4.2. Brute Force Attack
A brute force assault involves attempting to obtain user information that is used by MQTT [68]. The attacker’s purpose with MQTTset is to compromise user details such as credentials that are used in the authentication process [61].
4.4.3. Malformed Data
A malformed data assault seeks to generate and deliver a huge number of erroneous packets to the broker in order to disrupt the targeted service [60]. In order to carry out a faulty data attack, consider MQTTset.
4.5. Prioritize of Anomalies
The following shows the target class and frequency of each attack in the training datasets are shown in Figure 4.

Figure 4.
The attacks are prioritized as per the frequencies of anomaly attacks in the dataset, the three attacks used in this research are DOS, Brute-Force, and Malformed these attacks are more frequent and critical.
The chart represents the frequency distribution of the attack determined using the dataset, the DoS, Brute-Force, Malformed are the most frequent attacks, hence selected in the subsequent experiments.
4.6. Pseudocode: The Operation Process Flow
The algorithm is represent for anomaly detection in a dataset, where the target attribute is analyzed for anomalies such as DoS, brute force, malformed, flood, and slowite. The algorithm takes the dataset as input and performs various operations on it to obtain the accuracy, F1score, precision, recall, training and testing time. The algorithm is designed to work in multiple stages. In the first stage, the algorithm checks each value in the target attribute and executes code when the category matches one of the anomaly values. If the value is an anomaly, it is labeled with the corresponding category name and stored in the ‘anomaly_category’ column for that row. Then, the frequency of each anomaly is counted and stored in a dictionary called ‘anomaly_freq’. Anomalies with the highest frequency, such as DoS, brute force, and malformed, are selected and stored in a list called ‘high_freq_anomalies’ by iterating through the sorted list of anomalies until the count of high_freq_anomalies is equal to 3, shown in Figure 5.
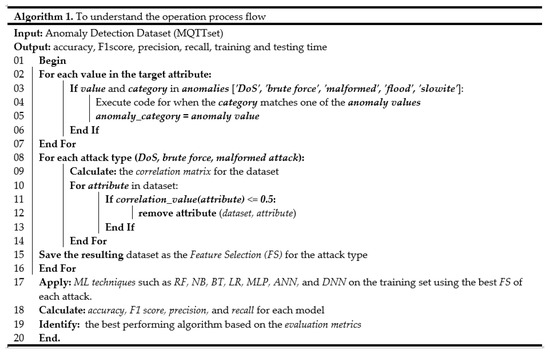
Figure 5.
The Pseudo code of the operation process flow of the research for anomaly detection using ML techniques to identify the best-performing algorithm based on the evaluation metrics.
In the next stage, the correlation matrix is calculated for the dataset, and the attributes with weak or zero correlation are removed from the dataset. The resulting dataset is saved as the Feature Selection (FS) for the corresponding attack type. Then, the dataset is split into training and testing sets, and various machine learning techniques such as RF, NB, BT, LR, MLP, ANN, and DNN are applied on the training set using the best FS for each attack. Finally, the accuracy, F1score, precision, recall, training and testing time are calculated for each model, and the best performing algorithm is identified based on the evaluation metrics. The algorithm is designed to automate the process of detecting anomalies in a dataset, and it uses various techniques to identify the best performing algorithm. This algorithm can be applied to various datasets to detect anomalies, and it can be modified to include additional techniques or metrics to improve its performance. The algorithm is useful in detecting anomalies in various domains, including smart homes, finance, healthcare, and cybersecurity.
4.7. Feature Analysis of MQTT Dataset
Evaluation Data Analysis (EDA) is a method of evaluating data that employs graphs or charts. It is used to detect trends, patterns, and assumptions using statistical summaries and graphical representations.
Using Pearson correlation, the author [69] demonstrated a real-time supervised learning approach. Pearson correlation [70] using deep convolutional neural networks (DCNN) for document categorization with the goal of reducing the influence of negative document image problems such as signatures, markings, logos, and handwritten notes.
Correlation is a statistical technique used to determine how one variable moves or changes in relation to another. It denotes the strength of the connection between the variables. It is a bivariate analytical measure that depicts the connection between many variables.
Pearson coefficients are correlation coefficients that represent the relationship be-tween two variables measured on the same ratio or interval scale. The Pearson coefficient reflects the degree of similarity between two continuous variables. The Pearson correlation coefficient measures the strength of a two-variable, linear relationship. It has a value between −1 and 1, with −1 representing total negative linear correlation, 0 representing no link, and +1 representing total positive linear correlation [71].
Below is a formula for calculating the Pearson correlation coefficient (r) [72] represented in Equation (1)
where, n is sample size, , are the individual sample points indexed with i.
Rearranging gives us the following formula which is represented in Equation (2)
The Pearson correlation is applied to MQTT dataset to determine the dependencies among the input variables and the target classes.
4.8. Results of Feature Analysis
The proposed mechanism uses Pearson correlation to assess the strength of relationships among MQTTSet dataset attributes. In the initial step, the dataset was divided into three groups based on the kind of attack, such as brute-force, DoS, and malformed assaults. Initially, a study or correlation has been determined for 17 input numerical features. The purpose of the study was to investigate the correlation between these features, which means to examine the degree to which they are related or associated with each other. To determine the correlation between the features, a correlation matrix was constructed. A correlation matrix is a table that shows the correlation coefficient between each pair of features. The correlation coefficient is a statistical measure that indicates the strength and direction of the linear relationship between two variables. It can range from −1 to +1, where a value of +1 indicates a perfect positive correlation (i.e., the two variables increase or decrease together), a value of −1 indicates a perfect negative correlation (i.e., as one variable increases, the other decreases), and a value of 0 indicates no correlation (i.e., the two variables are independent of each other). The results of the correlation analysis showed that some features were highly correlated with each other, either positively (i.e., when one feature increases, the other also tends to increase) or negatively (i.e., when one feature increases, the other tends to decrease). This suggests that these features may be measuring similar or related aspects of the data, and may therefore be redundant or redundant.
On the other hand, some features had weak or zero correlation with other features such as mqtt conack.flags.reserved, conflag.reserved, sub.qos, willmsglen, willtopiclen indicating that they may be measuring different aspects of the data Figure 6. A study or analysis that was conducted specifically on DoS (Denial-of-Service) attacks. The purpose of the study was to investigate the correlation between different features or variables that are associated with DoS attacks. To determine the correlation between the features, a correlation matrix was constructed, and the matrix is shown in Figure 7. In a correlation matrix, each row and column represent a different feature or variable, and the cells contain the correlation coefficients between each pair of features. The diagonal cells contain the correlation coefficient between each feature and itself, which is always equal to 1 because a variable is perfectly correlated with itself. The results of the correlation analysis showed that some features are highly correlated with each other, either positively or negatively. This means that these features tend to increase or decrease together, indicating that they may be measuring similar or related aspects of DoS attacks such as tcp.timedelta, tcp.len, mqtt.conflags, mqtt.hdrflags, mqtt.len, mqtt.msg, mqtt.msgid, mqtt.msgtype, mqtt.qos. Conversely, some features have zero or weak correlation with other features such as mqtt.conack.flags.reserved, mqtt.conack.flags.sp, mqtt.conflag.qos, suggesting that they may be measuring different aspects of DoS attacks. Additionally, this information may help in developing effective strategies to prevent or mitigate DoS attacks. A study or analysis that was conducted specifically on a brute-force attack. A brute-force attack is a type of cyber-attack in which an attacker tries all possible combinations of usernames and passwords until they find the correct one, gaining unauthorized access to a system or account.
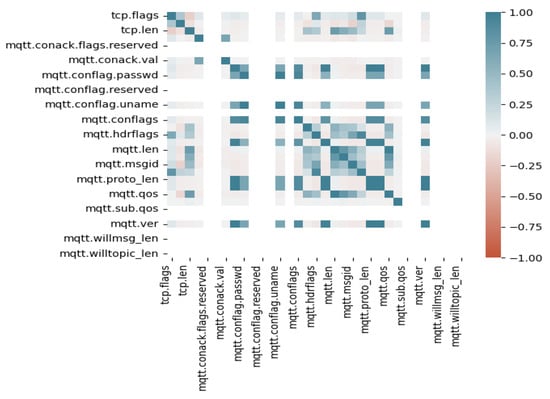
Figure 6.
Overall correlation matrix (DoS, BF, Malformed).

Figure 7.
Correlation matrix for DoS attack.
To determine the correlation between different features or variables that are associated with a brute-force attack, a correlation matrix was constructed, and the matrix is shown in Figure 8.

Figure 8.
Correlation matrix for brute-force attack.
In a correlation matrix, each row and column represent a different feature or variable, and the cells contain the correlation coefficients between each pair of features. The diagonal cells contain the correlation coefficient between each feature and itself, which is always equal to 1 because a variable is perfectly correlated with itself. The results of the correlation analysis showed that some features are highly correlated with each other, either positively or negatively. This means that these features tend to increase or decrease together, indicating that they may be measuring similar or related aspects of a brute-force attack. For example, two features that might be highly correlated in the context of a brute-force attack could be the number of failed logins attempts and the duration of the attack. Conversely, some features have between 0 to or weak correlation with other features such as mqtt retain, message, time TCP stream, TCP Segment length, suggesting that they may be measuring different aspects of a brute-force attack. For example, the source IP address of the attack and the time of the attack might have weak or zero correlation with other features. Additionally, this information may help in developing effective strategies to prevent or mitigate brute-force attacks.
A malformed attack is a type of cyber-attack in which an attacker sends specially crafted data to a system, exploiting vulnerabilities in the way the system handles the data. The results of the correlation analysis showed that some features are highly correlated with each other, either positively or negatively.
This means that these features tend to increase or decrease together, indicating that they may be measuring similar or related aspects of malformed attacks see Figure 9. For example, two features that might be correlated in the context of a malformed attack could be the size of the payload and the frequency of the attack such as tcp.flags, tcp.timedelta, tcp.len, mqtt.conflag.cleansess, mqtt.conflags, mqtt.hdrflags, mqtt.kalive, mqtt.len, mqtt.msg, mqtt.msgid, mqtt.msgtype, mqtt.protolen, mqtt.protoname, mqtt.retain, mqtt.ver. Conversely, some features have zero or weak correlation with other features such as mqtt.willmsg, mqtt.willtopic, suggesting that they may be measuring different aspects of a malformed attack and might have weak or zero correlation with other features. Additionally, this information may help in developing effective strategies to prevent or mitigate malformed attacks.
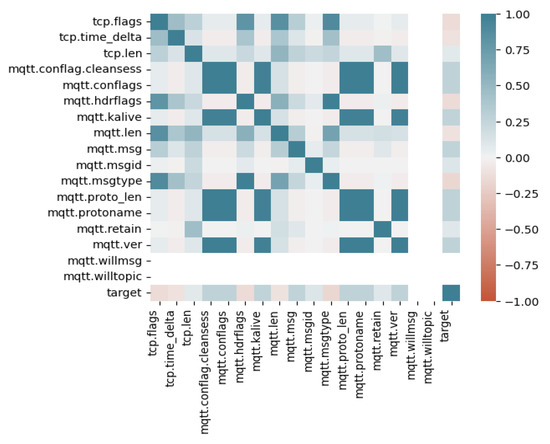
Figure 9.
Correlation matrix for malformed attack.
After conducting a correlation analysis on a dataset, features that were found to have zero or weak correlation with other features were removed from the dataset. Figure 10 likely shows the updated correlation matrix after these features were removed. Removing features with weak or zero correlation can have several benefits. First, it reduces the dimensionality of the dataset, which can simplify analysis and modeling. Second, it can improve the accuracy and efficiency in terms of training and testing time or irrelevant features that may obscure or dilute the signal from other features. Third, it can help avoid overfitting, a common problem in machine learning where a model is too complex and fits the training data too well, resulting in poor generalization and performance on new data. However, it’s important to note that removing features with zero correlation can also have some drawbacks such as mqtt.conack.val, mqtt.conflag.reserved, mqtt.conflag.retain, mqtt.conflag.willflag, mqtt.sub.qos, mqtt.suback.qos, mqtt.willmsglen, mqtt.willtopiclen. Additionally, removing features can be subjective and depend on the specific goals, assumptions, and domain knowledge of the analyst or modeler.

Figure 10.
Reduced dataset after applying correlation analysis.
Overall, the decision to remove features with weak or zero correlation should be based on careful consideration of the benefits and drawbacks, as well as other factors such as computational resources, and interpretability considerations.
5. Experimental Setup
The simulation was carried out using Colaboratory, or “Colab”, a Google Research tool [73]. Colab is particularly well suited to ML since it allows anybody to write and run arbitrary Python code in the browser. Colab is a free online Jupyter notebook platform that enables access to computing resources such as GPUs.
5.1. Evaluation Methodology and Environment
To put the chosen intrusion detection algorithms to the test, the dataset was separated into two parts: Training data and testing data, with 70 and 30% of created records, respectively. This ratio was used to compare the findings with the original MQTT dataset [8].
The evaluation of our proposed statistical correlation metric was conducted using the MQTTset dataset, which is a publicly available dataset accessible at https://www.kaggle.com/datasets/cnrieiit/mqttset, (accessed on 11 December 2022). The MQTTset dataset contains real-world data generated by IoT sensors using the MQTT protocol, and it has been widely used in the research community for evaluating anomaly detection techniques [8]. The dataset provides diverse sensor readings, including temperature, humidity, pressure, and other environmental parameters, making it suitable for our research on anomaly detection in IoT sensors. In our evaluation, we utilized the MQTTset dataset to validate the effectiveness of our proposed metric in improving the reliability of anomaly detection compared to traditional methods. The utilization of the MQTTset dataset allowed us to assess the performance and robustness of our approach in a realistic IoT sensor data environment. Supervised learning models such as DT, RF, ANN, NB, and Multi-layer perceptron have been used for prediction tasks. These techniques are described in detail in the sub-sections below.
5.2. Machine Learning Algorithms
A ML model is a program that can identify patterns or draw conclusions based on previously unknown data. There are different algorithms that are supported by ML. As a result, each node in the DT algorithm may evaluate potential actions against one another according on their benefits, costs, and probabilities. It is essentially a depiction of the likely outcomes of a series of linked decisions [74,75].
A DT typically begins with a single node and then branches into potential outcomes. Each of these events results in the formation of new nodes, which then branch off into new instances. As a result, it expanded into a tree-like architecture, or a data flow diagram structure [76].
The RF algorithm, as the name indicates, builds a forest with multiple decision trees. It is a classification method that is supervised. Because of its great execution speed [74], It is an appealing classifier. A random forest is created by joining numerous DT, and t analyzes the data by combining the predictions of each component tree. In terms of projected accuracy, it frequently outperforms a single DT. The more trees there are in the forest, the more vigorous it seems.
Naïve Bayes [77] is a classic classifier that uses Bayes’ theorem of pre-probability to categorize data instances. It offers a quick training pace for both small and large datasets. It is less susceptible to missing data, but it requires previous probabilities to be calculated. It is ineffective when the sample’s properties are connected. ANN is a ML approach that serves as the foundation for several deep learning algorithms. Using raw data, the ANN model can be trained [75,78]. In comparison to certain other classifiers, it has a large number of tuning parameters, giving it a complex structure. It also takes longer than other strategies to reduce error [79,80]. The NN algorithm is known as MLP. MLP contains an artificial neuron network (nodes). Input nodes, hidden nodes, and output nodes are the three types of nodes that are linked together. The node-to-node connectivity can be adjusted [26].
LR is another approach adopted from statistics by ML. This model explains how this method may be used to construct LR models at the leaves by incrementally refining those established at higher levels in the tree [81].
The GB technique is the foundational classifier for identifying malicious anomalous behaviors. In solving classification and regression problems, the ensemble GB technique has been shown to be more efficient than traditional boosting algorithms. This method has been enhanced with a feature selection mechanism that boosts overall performance by identifying the most important characteristics from the input data [82].
5.3. Evaluation Criteria
The metrics listed below are calculated to assess the efficiency of the created system. These parameters can be utilized to assess which method is best suited to this task.
Before discussing metrics, the following four ideas must be introduced:
- True positives (TP) are predictions that turn out to be correct.
- False positives (FP) are positive predictions that turn out to be negative.
- True negatives (TN) are predicted negatives that turn out to be negative.
- False negatives (FN) are predicted negatives that turn out to be positive.
5.3.1. Prediction Accuracy
A model’s accuracy is only a subset of its total performance. Accuracy is one of the metrics used to assess classification models [83]. The measurement of single class accuracy is represented in Equation (3)
5.3.2. F1 Score
The F1 score may also be used to assess a performance of the model. It is a weighted average of the accuracy and recall of a model [83]. Equation (4) gives the F1 Score value for a particular class.
5.3.3. Precision and Recall
5.3.4. CPU Time
CPU time [85], is the amount of time it takes the processor to process data and is used to assess how much processing is necessary for a process or how CPU-intensive a process or application is. Finally, Table 6 show a summary of the CPU time consumed by the categorization step (the consumed time is measured in seconds).
5.4. Significant Findings
By analyzing significant findings and comparing the accuracy of default attributes and feature selection for three high-frequency anomaly attacks (DoS, brute-force, and malformed attacks) with respect to seven algorithms (NB, DT, NN, RF, GB, LR, and MLP). Table 3 shows that DT and RF provided high accuracy of 95.94%, 99.81%, and 99.67%, respectively, in all three types of DoS attacks: Brute force attacks and malformed attacks, with no significant difference between default and feature selection attributes when using the correlation technique for DoS attacks. A minor drop in a few of the datasets such as in the Brute force algorithm is due to the removal of attributes in the feature engineering phase. However, this drop is minor in comparison to the advantages achieved in the proposed feature engineering methodology. Furthermore, this can be controlled by adjusting the parameter value of Pearson Correlation Coefficient (r).
Table 3.
Compare Accuracy between Defaults attributes and Feature selection of DoS, BF and Malformed anomaly attacks.
The performance of a Deep Neural Network (DNN) in detecting various types of cyber attacks. The DNN achieved high accuracy rates in identifying Denial of Service (DoS), Brute Force (BF), and malformed attacks when using default attributes, with accuracy rates of 95.83%, 99.41%, and 99.35%, respectively. The best values for each type of attack are highlighted in bold in Table 3. However, when using Feature Selection (FS) attributes, the accuracy rates were slightly lower, with rates of 87.74%, 99.67%, and 99.10% for DoS, BF, and malformed attacks, respectively. Overall, the DNN demonstrated strong performance in detecting cyber attacks, particularly with default attributes.
The results presented in Table 4, which compares the precision and recall of eight different algorithms in detecting various types of cyber attacks (DoS, BF, and Malformed) without Feature Selection (FS). The significant findings of the analysis reveal that the RF and DT algorithms had the highest precision and recall values of 99.80% for detecting Brute Force attacks without the use of FS. This suggests that RF and DT algorithms may be particularly effective for detecting this type of attack. On the other hand, the NB algorithm had the lowest precision value of 89.51% for detecting DoS attacks without FS. This indicates that NB may not be the best choice for detecting this type of attack. For the Malformed attack, the DNN algorithm had the lowest recall value of 76.59% without FS. Overall, the analysis in Table 4 provides insights into the strengths and weaknesses of various algorithms for detecting different types of cyber attacks, and highlights the importance of considering precision and recall values when evaluating the effectiveness of these algorithms.
Table 4.
Precision and Recall of DoS, BF, Malformed anomalies attacks—Without FS.
The results presented in Table 5, which compares the precision and recall of eight different algorithms in detecting various types of cyber attacks (DoS, BF, and Malformed) using Feature Selection (FS). The analysis revealed that the RF and DT algorithms had the highest precision and recall values of 99.81% for detecting Brute Force attacks using FS.
Table 5.
Precision and Recall of DoS, BF, Malformed anomalies attacks—using FS.
This suggests that RF and DT algorithms may be particularly effective for detecting this type of attack, even with the use of FS. However, the NB, LR, and DNN algorithms had the lowest precision values of 87.27%, 87.39%, and 87.74%, respectively, for detecting DoS attacks using FS. This indicates that these algorithms may not be the best choice for detecting this type of attack when FS is applied. Overall, the analysis in Table 5 provides further insights into the strengths and weaknesses of various algorithms for detecting different types of cyber attacks, and highlights the importance of considering both FS and precision/recall values when evaluating the effectiveness of these algorithms.
5.5. Evaluation Time
The obtained results for three high-frequency anomaly attacks (DoS, BF, and malformed attacks) with respect to seven algorithms (NB, DT, NN, RF, GB, LR, MLP, and DNN) are clearly different in terms of default attributes and feature selection. The default attributes were discovered to have 34 features using correlation techniques, but in DoS, brute-force, and malformed attacks, there were 13, 17, and 16 attributes, respectively. After applying the correlation technique and removing the attributes of weak correlation from the dataset, the result obtained in terms of training time is significantly reduced, as shown in Table 6, such as the training time of NB before 1489.22 after 59.81 and RF before 1338.05 after 58.7 using the correlation technique in a DoS attack. Using correlation techniques in a brute-force attack, the training time of NN is before 5244.97 after 139.59 and that of RF is before 5331.31 after 152.89. In the same pattern, The result obtained from testing times is shown in differences in Table 6, such as the testing time of MLP having before 0.3122 after 0.1565 but, on the other side, GB not having good results after using this technique, such as before 0.0714 after 0.1035 using the correlation techniques in a DoS attack. A comparison of training and testing time for different learning algorithms after applying feature engineering. As it is evident from the results, NN consumed the least time during training of all the attacks.
Table 6.
Comparison of Training and Testing time in (seconds) before and after feature engineering.
The Table 6 shows a comparison of training time in a DoS attack by applying defaults to 34 attributes with respect to the reduced 13 features that are obtained in the feature analysis of the MQTT dataset as described in Section 4.6. Default attributes range between 895.0386 and 2098.3992 s in training time and the feature selection is between 47.0213 and 59.8104 s, except the GB, LR and MLP which is between 107.3086 and 122.223 s.
The results of a comparison of seven techniques, namely NB, DT, NN, RF, GB, LR, MLP, and DNN, applied to three high frequencies of anomaly attacks, namely DoS, BF, and malformed. The comparison matrix table is presented in Table 7, and the techniques are ranked in ascending order based on the gain achieved using feature selection (FS) with respect to training and testing time. In training time the DoS attack, the DNN technique took the least amount of time for training, which was 7.67 s, ranking it first. In contrast, the LR technique took the longest time for training, which was 122.44 s, ranking it eighth. In the BF attack, the NN technique took the least amount of time for training, which was 139.59 s, ranking it first. On the other hand, the DNN technique took the longest time for training, which was 546.75 s, ranking it eighth. In the malformed attack, the NN technique took the least amount of time for training, which was 262.42 s, ranking it first. In contrast, the DNN technique took the longest time for training, which was 402.84 s, ranking it eighth. Overall, the results show that DNN takes the longest time for training across all three types of attacks, while NN takes the least amount of time. The results also demonstrate the effectiveness of feature selection in reducing the training time of the techniques.
Table 7.
Rank comparison matrix table of techniques to show the gain achieved using FS w.r.t. training and testing time.
In the other side the comparison matrix table is presented in Table 7, and the techniques are ranked in ascending order based on the gain achieved using feature selection (FS) with respect to testing time. In the DoS attack, the LR technique took the least amount of time for testing, which was 0.0115 s, ranking it first. In contrast, the DNN technique took the longest time for testing, which was 48.19 s, ranking it eighth. In the BF attack, the LR technique took the least amount of time for testing, which was 0.0067 s, ranking it first. On the other hand, the DNN technique took the longest time for testing, which was 27.66 s, ranking it eighth. In the malformed attack, the LR technique took the least amount of time for testing, which was 0.0106 s, ranking it first. In contrast, the DNN technique took the longest time for testing, which was 18.84 s, ranking it eighth. Overall, the results show that DNN takes the longest time for testing across all three types of attacks, while LR takes the least amount of time. The results also demonstrate the effectiveness of feature selection in reducing the testing time of the techniques.
The plot presented in Figure 11, which compares the testing time of a DoS attack by applying defaults to 34 attributes with respect to the reduced 13 features obtained from the feature analysis of the MQTT dataset.
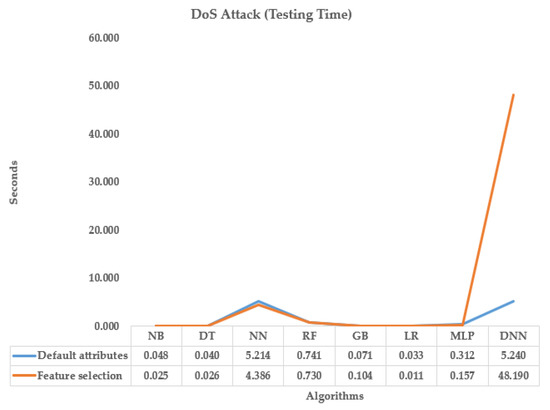
Figure 11.
Compare Testing CPU time in sec w.r.t. DoS attack between defaults attributes and feature selection.
The testing time for the default attributes ranges between 0.033 and 5.214 s, while the testing time for the reduced 13 features obtained through feature selection ranges between 0.011 and 0.157 s, except for the neural network, which has a testing time of 4.386 s. The plot also shows that the default attributes for the DNN technique have a testing time of 5.240 s, which is significantly longer than the testing time for the reduced 13 features obtained through feature selection, indicating the effectiveness of feature selection in reducing testing time. Moreover, the difference in feature selection between the default attributes and the reduced 13 features is quite significant for the DNN technique, with a difference of 48.190 s. This further emphasizes the importance of feature selection in optimizing the performance of the DNN technique. The plot in Figure 12, which compares the training time of a brute force attack by applying defaults to 34 attributes with respect to the reduced 17 features obtained from the feature analysis of the MQTT dataset. The default attributes have a range of training time between 5244.973 and 6238.328 s, while the training time for the reduced 17 features obtained through feature selection ranges between 139.586 and 236.027 s. It is noted that the DNN technique has good performance in default attributes, with a training time of 26.1600 s. However, in feature selection, DNN took a significantly longer time of 546.750 s compared to other algorithms, indicating that it is more expensive in terms of computation resources. Overall, the plot shows that the reduced 17 features obtained through feature selection significantly reduce the training time compared to using default attributes, except for the DNN technique, which takes longer time for feature selection.

Figure 12.
Compare Training CPU time in sec w.r.t. Brute force attack between defaults attributes and feature selection.
The plot in Figure 13 shows a comparison of testing time in a brute force attack by applying defaults to 34 attributes with respect to the reduced 17 features that are obtained in the feature analysis of the MQTT dataset as described in Section 4.6. Default attributes range between 0.022 and 2.715 s in testing time and the feature selection is between 0.007 and 8.794 s. A comparison of CPU time in seconds for a BF (brute force) attack on a dataset. The dataset is analyzed using default attributes, which range between 0.022 and 2.715 s in testing time. The dataset is also analyzed using feature selection, which reduces the dataset to 16 features and results in testing times ranging between 0.007 and 8.794 s. Additionally, a DNN (deep neural network) was used to analyze the dataset using default attributes, which took 3.270 s in testing time. The same DNN was also used to analyze the dataset after feature selection, which took 27.660 s in testing time. The paragraph notes that the increase in testing time for the DNN after feature selection was significant.

Figure 13.
Compare Testing CPU time in sec w.r.t. Brute force attack between defaults attributes and feature selection.
The plot in Figure 14 shows a comparison of training time in a malformed attack by applying defaults to 34 attributes with respect to the reduced 16 features that are obtained in the feature analysis of the MQTT dataset. The dataset is analyzed using default attributes, which range between 6990.7999 and 7624.1722 s in training time. The dataset is also analyzed using feature selection, which reduces the dataset to 16 features and results in training times ranging between 262.4163 and 311.839 s. Additionally, a DNN (deep neural network) was used to analyze the dataset using default attributes, which took 16.820 s in training time. The same DNN was also used to analyze the dataset after feature selection, which took 402.840 s in training time. The paragraph notes that the increase in training time for the DNN after feature selection was significant.
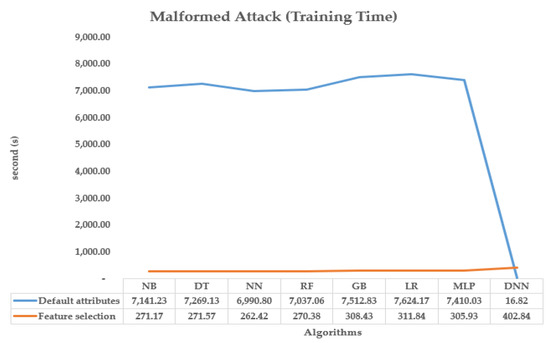
Figure 14.
Compare Training CPU time w.r.t. malformed attack between defaults attributes and feature selection.
The plot in Figure 15 shows a comparison of testing time in a malformed attack by applying defaults to 34 attributes with respect to the reduced 16 features that are obtained in the feature analysis of the MQTT dataset. The dataset is also analyzed using feature selection, which reduces the dataset to 16 features and results in testing times ranging between 0.011 and 2.800 s.

Figure 15.
Compare Testing CPU time in sec w.r.t. malformed attack between defaults attributes and feature selection.
In this case, it is not specified which method was used to perform the analysis, but it can be inferred that the testing time for the default attributes was 10.63 s, while the testing time for feature selection was 18.84 s.
6. Conclusions
The IoT is described as a network of various Internet-connected sensors that constantly generate massive volumes of data and interact among themselves using the MQTT protocol. Brute-force, denial-of-service (DoS), malformed, flood, and slowite attacks are the most prevalent on the MQTT network. In this study, the focus is on MQTTset, a network of several types of IoT sensors (temperature, motion sensor, humidity, locker door, etc.) that may be used to imitate several scenarios, including building automation and the industrial sector. Malicious or attack traffic was mixed in with legal MQTT network data. The attributes required to develop a functional detection system were extracted from the raw network data given by MQTTset sensors. In addition to validating the dataset by using numerous ML algorithms that are commonly used in the security domain, such as NN, RF, NB, DT, GB, and MLP. The results showed a good accuracy and F1 score for the dataset due to the vast number of records from real traffic that affected the final conclusions. Finally, the results obtained for the investigated ML approaches were assessed based on accuracy and the F1 score, as well as a comparison of training and testing time while utilizing various anomalies such as DoS, brute-force and malformed attacks by applying defaults to 34 attributes with respect to the reduced 13, 17, and 16 features, respectively, that are acquired with the features extracted from the MQTT dataset.
Author Contributions
Conceptualization, I.; Formal analysis, I.; Funding acquisition, M.M.S.; Investigation, I.; Methodology, I.; Project administration, M.F.A.Z. and M.M.A.; Resources, M.F.A.Z., S.M.A. and Z.S.; Supervision, M.F.A.Z., S.M.A., Z.S., M.M.A. and M.M.S.; Validation, I. and S.M.A.; Visualization, M.F.A.Z., Z.S. and M.M.A.; Writing—original draft, I.; Writing—review and editing, S.M.A. All authors read and agreed to the published version of the manuscript.
Funding
This research is funded by Multimedia University.
Institutional Review Board Statement
Not applicable.
Data Availability Statement
Dataset is publically available from https://www.kaggle.com/datasets/cnrieiit/mqttset, accessed on 11 December 2022.
Conflicts of Interest
The authors declare no conflict of interest.
References
- Benaddi, H.; Jouhari, M.; Ibrahimi, K.; Ben Othman, J.; Amhoud, E.M. Anomaly Detection in Industrial IoT Using Distributional Reinforcement Learning and Generative Adversarial Networks. Sensors 2022, 22, 8085. [Google Scholar] [CrossRef] [PubMed]
- Zhao, W.; Yang, S.; Luo, X. On Threat Analysis of IoT-Based Systems: A Survey. In Proceedings of the 2020 IEEE International Conference on Smart Internet of Things (SmartIoT), Beijing, China, 14–16 August 2020; pp. 205–212. [Google Scholar] [CrossRef]
- Elijah, O.; Rahman, T.A.; Orikumhi, I.; Leow, C.Y.; Hindia, M.N. An Overview of Internet of Things (IoT) and Data Analytics in Agriculture: Benefits and Challenges. IEEE Internet Things J. 2018, 5, 3758–3773. [Google Scholar] [CrossRef]
- Riahi Sfar, A.; Natalizio, E.; Challal, Y.; Chtourou, Z. A roadmap for security challenges in the Internet of Things. Digit. Commun. Netw. 2018, 4, 118–137. [Google Scholar] [CrossRef]
- Belgaum, M.R.; Soomro, S.; Alansari, Z.; Musa, S.; Alam, M.; Su’ud, M.M. Challenges: Bridge between Cloud and IoT. In Proceedings of the 2017 4th IEEE International Conference on Engineering Technologies and Applied Sciences (ICETAS), Salmabad, Bahrain, 29 November–1 December 2017; pp. 1–5. [Google Scholar] [CrossRef]
- Lawrence, S.; Giles, C.; Tsoi, A. Lessons in Neural Network Training: Overfitting May Be Harder than Expected. In Proceedings of the 14th National Conference on Artificial Intelligence, Menlo Park, CA, USA, 27–31 July 1997. [Google Scholar]
- Mapetu, J.P.B.; Kong, L.; Chen, Z. A dynamic VM consolidation approach based on load balancing using Pearson correlation in cloud computing. J. Supercomput. 2021, 77, 5840–5881. [Google Scholar] [CrossRef]
- Vaccari, I.; Chiola, G.; Aiello, M.; Mongelli, M.; Cambiaso, E. MQTTset, a New Dataset for Machine Learning Techniques on MQTT. Sensors 2020, 20, 6578. [Google Scholar] [CrossRef]
- Khan, M.A.U.D.; Uddin, M.F.; Gupta, N. Seven V’s of Big Data Understanding Big Data to Extract Value. In Proceedings of the 2014 Zone 1 Conference of the American Society for Engineering Education, Bridgeport, CT, USA, 3–5 April 2014; pp. 1–5. [Google Scholar] [CrossRef]
- Khan, N.; Sajak, A.A.B.; Alam, M.; Mazliham, M. Analysis of Green IoT. J. Phys. Conf. Ser. 2021, 1874, 012012. [Google Scholar] [CrossRef]
- Yassein, M.B.; Shatnawi, M.Q.; Aljwarneh, S.; Al-Hatmi, R. Internet of Things: Survey and Open Issues of MQTT Protocol. In Proceedings of the 2017 International Conference on Engineering & MIS (ICEMIS), Monastir, Tunisia, 8–10 May 2017; pp. 1–6. [Google Scholar] [CrossRef]
- Thangavel, D.; Ma, X.; Valera, A.; Tan, H.X.; Tan, C.K.Y. Performance Evaluation of MQTT and CoAP via a Common Middleware. In Proceedings of the 2014 IEEE Ninth International Conference on Intelligent Sensors, Sensor Networks and Information Processing (ISSNIP), Singapore, 21–24 April 2014; pp. 1–6. [Google Scholar] [CrossRef]
- Al-Fuqaha, A.; Guizani, M.; Mohammadi, M.; Aledhari, M.; Ayyash, M. Internet of Things: A Survey on Enabling Technologies, Protocols, and Applications. IEEE Commun. Surv. Tutorials 2015, 17, 2347–2376. [Google Scholar] [CrossRef]
- Mun, D.H.; Dinh, M.L.; Kwon, Y.W. An Assessment of Internet of Things Protocols for Resource-Constrained Applications. In Proceedings of the 2016 IEEE 40th Annual Computer Software and Applications Conference (COMPSAC), Atlanta, GA, USA, 10–14 June 2016; pp. 555–560. [Google Scholar] [CrossRef]
- Thombre, S.; Ul Islam, R.; Andersson, K.; Hossain, M.S. Performance Analysis of an IP Based ProtocolSstack for WSNs. In Proceedings of the 2016 IEEE Conference on Computer Communications Workshops (INFOCOM WKSHPS), San Francisco, CA, USA, 10–14 April 2016; pp. 360–365. [Google Scholar] [CrossRef]
- Aversano, L.; Bernardi, M.L.; Cimitile, M.; Pecori, R.; Veltri, L. Effective Anomaly Detection Using Deep Learning in IoT Systems. Wirel. Commun. Mob. Comput. 2021, 2021, e9054336. [Google Scholar] [CrossRef]
- Shafiq, M.; Tian, Z.; Sun, Y.; Du, X.; Guizani, M. Selection of effective machine learning algorithm and Bot-IoT attacks traffic identification for internet of things in smart city. Future Gener. Comput. Syst. 2020, 107, 433–442. [Google Scholar] [CrossRef]
- Said, A.M.; Yahyaoui, A.; Abdellatif, T. Efficient Anomaly Detection for Smart Hospital IoT Systems. Sensors 2021, 21, 1026. [Google Scholar] [CrossRef]
- Xu, J.; Xue, K.; Li, S.; Tian, H.; Hong, J.; Hong, P.; Yu, N. Healthchain: A Blockchain-Based Privacy Preserving Scheme for Large-Scale Health Data. IEEE Internet Things J. 2019, 6, 8770–8781. [Google Scholar] [CrossRef]
- Chaitanya, K.; Narayanan, S. Security and Privacy in Wireless Sensor Networks Using Intrusion Detection Models to Detect DDOS and Drdos Attacks: A Survey. In Proceedings of the 2023 IEEE International Students’ Conference on Electrical, Electronics and Computer Science (SCEECS), Bhopal, India, 18–19 February 2023; pp. 1–8. [Google Scholar]
- Alsoufi, M.A.; Razak, S.; Siraj, M.M.; Nafea, I.; Ghaleb, F.A.; Saeed, F.; Nasser, M. Anomaly-Based Intrusion Detection Systems in IoT Using Deep Learning: A Systematic Literature Review. Appl. Sci. 2021, 11, 8383. [Google Scholar] [CrossRef]
- Challa, S.; Wazid, M.; Das, A.K.; Kumar, N.; Goutham Reddy, A.; Yoon, E.J.; Yoo, K.Y. Secure Signature-Based Authenticated Key Establishment Scheme for Future IoT Applications. IEEE Access 2017, 5, 3028–3043. [Google Scholar] [CrossRef]
- Yahyaoui, A.; Abdellatif, T.; Attia, R. Hierarchical Anomaly Based Intrusion Detection and Localization in IoT. In Proceedings of the 2019 15th International Wireless Communications & Mobile Computing Conference (IWCMC), Tangier, Morocco, 24–28 June 2019; pp. 108–113. [Google Scholar] [CrossRef]
- Jordan, M.I.; Mitchell, T.M. Machine learning: Trends, perspectives, and prospects. Science 2015, 349, 255–260. [Google Scholar] [CrossRef] [PubMed]
- Protogerou, A. A graph neural network method for distributed anomaly detection in IoT. Evol. Syst. 2021, 33, 203–211. [Google Scholar] [CrossRef]
- Fenanir, S.; Semchedine, F.; Baadache, A. A Machine Learning-Based Lightweight Intrusion Detection System for the Internet of Things. Rev. D’Intell. Artif. 2019, 33, 203–211. [Google Scholar] [CrossRef]
- Al-amri, R.; Murugesan, R.K.; Man, M.; Abdulateef, A.F.; Al-Sharafi, M.A.; Alkahtani, A.A. A Review of Machine Learning and Deep Learning Techniques for Anomaly Detection in IoT Data. Appl. Sci. 2021, 11, 5320. [Google Scholar] [CrossRef]
- Al-Akhras, M.; Alawairdhi, M.; Alkoudari, A.; Atawneh, S. Using Machine Learning to Build a Classification Model for IoT Networks to Detect Attack Signatures. Int. J. Comput. Netw. Commun. 2020, 12, 99–116. [Google Scholar] [CrossRef]
- Bagui, S.; Wang, X.; Bagui, S. Machine Learning Based Intrusion Detection for IoT Botnet. Int. J. Mach. Learn. Comput. 2021, 11, 399–406. [Google Scholar] [CrossRef]
- Rejeb, A.; Rejeb, K.; Treiblmaier, H.; Appolloni, A.; Alghamdi, S.; Alhasawi, Y.; Iranmanesh, M. The Internet of Things (IoT) in Healthcare: Taking Stock and Moving Forward. Internet Things 2023, 14, 100721. [Google Scholar] [CrossRef]
- Godi, B.; Viswanadham, S.; Muttipati, A.S.; Prakash Samantray, O.; Gadiraju student, S.R. E-Healthcare Monitoring System using IoT with Machine Learning Approaches. In Proceedings of the 2020 International Conference on Computer Science, Engineering and Applications (ICCSEA), Gunupur, India, 13–14 March 2020; pp. 1–5. [Google Scholar] [CrossRef]
- Nawir, M.; Amir, A.; Yaakob, N.; Bi Lynn, O. Effective and efficient network anomaly detection system using machine learning algorithm. Bull. Electr. Eng. Inform. 2019, 8, 46–51. [Google Scholar] [CrossRef]
- Nazar, M.; Alam, M.M.; Yafi, E.; Su’ud, M.M. A Systematic Review of Human–Computer Interaction and Explainable Artificial Intelligence in Healthcare With Artificial Intelligence Techniques. IEEE Access 2021, 9, 153316–153348. [Google Scholar] [CrossRef]
- Larriva-Novo, X.; Vega-Barbas, M.; Villagrá, V.A.; Rivera, D.; Álvarez Campana, M.; Berrocal, J. Efficient Distributed Preprocessing Model for Machine Learning-Based Anomaly Detection over Large-Scale Cybersecurity Datasets. Appl. Sci. 2020, 10, 3430. [Google Scholar] [CrossRef]
- Khanna, A.; Kaur, S. Evolution of Internet of Things (IoT) and its significant impact in the field of Precision Agriculture. Comput. Electron. Agric. 2019, 157, 218–231. [Google Scholar] [CrossRef]
- Gelenbe, E.; Campegiani, P.; Czachórski, T.; Katsikas, S.K.; Komnios, I.; Romano, L.; Tzovaras, D. Security in Computer and Information Sciences: First International ISCIS Security Workshop 2018, Euro-CYBERSEC 2018, London, UK, 26–27 February 2018; Revised Selected Papers; Springer Nature: Berlin/Heidelberg, Germany, 2018. [Google Scholar]
- Liu, X.; Liu, Y.; Liu, A.; Yang, L.T. Defending ON–OFF attacks using light probing messages in smart sensors for industrial communication systems. IEEE Trans. Ind. Inform. 2018, 14, 3801–3811. [Google Scholar] [CrossRef]
- Graham, J.; Hieb, J.; Naber, J. Improving Cybersecurity for Industrial Control Systems. In Proceedings of the 2016 IEEE 25th International Symposium on Industrial Electronics (ISIE), Santa Clara, CA, USA, 8–10 June 2016; pp. 618–623. [Google Scholar]
- Kundur, D.; Hatzinakos, D. Digital watermarking for telltale tamper proofing and authentication. Proc. IEEE 1999, 87, 1167–1180. [Google Scholar] [CrossRef]
- Ukil, A.; Bandyoapdhyay, S.; Puri, C.; Pal, A. IoT Healthcare Analytics: The Importance of Anomaly Detection. In Proceedings of the 2016 IEEE 30th International Conference on Advanced Information Networking and Applications (AINA), Crans-Montana, Switzerland, 23–25 March 2016; pp. 994–997. [Google Scholar]
- Vaccari, I.; Cambiaso, E.; Aiello, M. Evaluating Security of Low-Power Internet of Things Networks. Int. J. Comput. Digit. Syst. 2019, 8, 101–114. [Google Scholar] [CrossRef]
- Vaccari, I.; Aiello, M.; Cambiaso, E. SlowITe, a Novel Denial of Service Attack Affecting MQTT. Sensors 2020, 20, 2932. [Google Scholar] [CrossRef]
- Komar, M.; Dorosh, V.; Hladiy, G.; Sachenko, A. Deep Neural Network for Detection of Cyber Attacks. In Proceedings of the 2018 IEEE First International Conference on System Analysis & Intelligent Computing (SAIC), Kiev, Ukraine, 8–12 October 2018; pp. 1–4. [Google Scholar] [CrossRef]
- Alqahtani, H.; Sarker, I.H.; Kalim, A.; Minhaz Hossain, S.M.; Ikhlaq, S.; Hossain, S. Cyber Intrusion Detection Using Machine Learning Classification Techniques. In Proceedings of the Computing Science, Communication and Security: First International Conference, COMS2 2020, Gujarat, India, 26–27 March 2020; Revised Selected Papers 1; Springer: Berlin/Heidelberg, Germany, 2020; pp. 121–131. [Google Scholar]
- Amor, N.B.; Benferhat, S.; Elouedi, Z. Naive Bayes vs. Decision Trees in Intrusion Detection Systems. In Proceedings of the 2004 ACM Symposium on Applied Computing—SAC ’04, Nicosia, Cyprus, 14–17 March 2004; p. 420. [Google Scholar] [CrossRef]
- Saheed, Y.K.; Abiodun, A.I.; Misra, S.; Holone, M.K.; Colomo-Palacios, R. A machine learning-based intrusion detection for detecting internet of things network attacks. Alex. Eng. J. 2022, 61, 9395–9409. [Google Scholar] [CrossRef]
- Bourou, S.; El Saer, A.; Velivassaki, T.H.; Voulkidis, A.; Zahariadis, T. A review of tabular data synthesis using GANs on an IDS dataset. Information 2021, 12, 375. [Google Scholar] [CrossRef]
- Alhowaide, A.; Alsmadi, I.; Tang, J. Towards the design of real-time autonomous IoT NIDS. Clust. Comput. 2021, 1–14. [Google Scholar] [CrossRef]
- Liu, J.; Kantarci, B.; Adams, C. Machine Learning-Driven Intrusion Detection for Contiki-NG-Based IoT Networks Exposed to NSL-KDD Dataset. In Proceedings of the 2nd ACM Workshop on Wireless Security and Machine Learning, Linz, Austria, 13 July 2020; pp. 25–30. [Google Scholar]
- Tuan, T.A.; Long, H.V.; Son, L.H.; Kumar, R.; Priyadarshini, I.; Son, N.T.K. Performance evaluation of Botnet DDoS attack detection using machine learning. Evol. Intell. 2020, 13, 283–294. [Google Scholar] [CrossRef]
- Qaddoori, S.L.; Ali, Q.I. An Efficient Security Model for Industrial Internet of Things (IIoT) System Based on Machine Learning Principles. Rafidain Eng. J. 2023, 28, 329–340. [Google Scholar] [CrossRef]
- Mahmood, M.S.; Al Dabagh, N.B. Improving IoT Security using Lightweight Based Deep Learning Protection Model. Tikrit J. Eng. Sci. 2023, 30, 119–129. [Google Scholar] [CrossRef]
- Siddharthan, H.; Deepa, T.; Chandhar, P. Senmqtt-set: An intelligent intrusion detection in iot-mqtt networks using ensemble multi cascade features. IEEE Access 2022, 10, 33095–33110. [Google Scholar] [CrossRef]
- Ullah, I.; Mahmoud, Q.H. An Anomaly Detection Model for IoT Networks Based on Flow and Flag Features Using a Feed-Forward Neural Network. In Proceedings of the 2022 IEEE 19th Annual Consumer Communications and Networking Conference (CCNC), Las Vegas, NV, USA, 8–10 January 2022; pp. 363–368. [Google Scholar]
- Han, H.; Kim, H.; Kim, Y. Correlation between Deep Neural Network Hidden Layer and Intrusion Detection Performance in IoT Intrusion Detection System. Symmetry 2022, 14, 2077. [Google Scholar] [CrossRef]
- Prajisha, C.; Vasudevan, A. An efficient intrusion detection system for MQTT-IoT using enhanced chaotic salp swarm algorithm and LightGBM. Int. J. Inf. Secur. 2022, 21, 1263–1282. [Google Scholar] [CrossRef]
- Friha, O.; Ferrag, M.A.; Shu, L.; Maglaras, L.; Choo, K.K.R.; Nafaa, M. FELIDS: Federated learning-based intrusion detection system for agricultural Internet of Things. J. Parallel Distrib. Comput. 2022, 165, 17–31. [Google Scholar] [CrossRef]
- Idrissi, I.; Azizi, M.; Moussaoui, O. An unsupervised generative adversarial network based-host intrusion detection system for internet of things devices. Indones. J. Electr. Eng. Comput. Sci. 2022, 25, 1140. [Google Scholar] [CrossRef]
- Ferrag, M.A.; Friha, O.; Maglaras, L.; Janicke, H.; Shu, L. Federated deep learning for cyber security in the internet of things: Concepts, applications, and experimental analysis. IEEE Access 2021, 9, 138509–138542. [Google Scholar] [CrossRef]
- Bhagat Patil, A.R.; Thakur, N.V. Mitigation Against Denial-of-Service Flooding and Malformed Packet Attacks. In Proceedings of the Third International Congress on Information and Communication Technology: ICICT 2018; Springer: London, UK, 2019; pp. 335–342. [Google Scholar]
- Palmieri, A.; Prem, P.; Ranise, S.; Morelli, U.; Ahmad, T. MQTTSA: A Tool for Automatically Assisting the Secure Deployments of MQTT Brokers. In Proceedings of the 2019 IEEE World Congress on Services (SERVICES), Milan, Italy, 8–13 July 2019; pp. 47–53. [Google Scholar] [CrossRef]
- Wood, A.; Stankovic, J. Denial of service in sensor networks. Computer 2002, 35, 54–62. [Google Scholar] [CrossRef]
- Su, S.; Sun, Y.; Gao, X.; Qiu, J.; Tian, Z. A Correlation-Change Based Feature Selection Method for IoT Equipment Anomaly Detection. Appl. Sci. 2019, 9, 437. [Google Scholar] [CrossRef]
- Kim, D.; Heo, T.Y. Anomaly Detection with Feature Extraction Based on Machine Learning Using Hydraulic System IoT Sensor Data. Sensors 2022, 22, 2479. [Google Scholar] [CrossRef] [PubMed]
- Kumar, S.; Chong, I. Correlation Analysis to Identify the Effective Data in Machine Learning: Prediction of Depressive Disorder and Emotion States. Int. J. Environ. Res. Public Health 2018, 15, 2907. [Google Scholar] [CrossRef] [PubMed]
- Sahoo, K.; Samal, A.K.; Pramanik, J.; Pani, S.K. Exploratory data analysis using Python. Int. J. Innov. Technol. Explor. Eng. 2019, 8, 2019. [Google Scholar] [CrossRef]
- Alam, M.T.; Ubaid, S.; Shakil; Sohail, S.S.; Nadeem, M.; Hussain, S.; Siddiqui, J. Comparative Analysis of Machine Learning based Filtering Techniques using MovieLens dataset. Procedia Comput. Sci. 2021, 194, 210–217. [Google Scholar] [CrossRef]
- Stiawan, D.; Idris, M.Y.; Malik, R.F.; Nurmaini, S.; Alsharif, N.; Budiarto, R. Investigating Brute Force Attack Patterns in IoT Network. J. Electr. Comput. Eng. 2019, 2019, 1–13. [Google Scholar] [CrossRef]
- Nasir, I.M.; Khan, M.A.; Yasmin, M.; Shah, J.H.; Gabryel, M.; Scherer, R.; Damaševičius, R. Pearson Correlation-Based Feature Selection for Document Classification Using Balanced Training. Sensors 2020, 20, 6793. [Google Scholar] [CrossRef]
- Benesty, J.; Chen, J.; Huang, Y.; Cohen, I. Pearson Correlation Coefficient. In Noise Reduction in Speech Processing; Springer Topics in Signal Processing; Springer: Berlin/Heidelberg, Germany, 2009; Volume 2, pp. 1–4. [Google Scholar] [CrossRef]
- Nettleton, D. Selection of Variables and Factor Derivation. In Commercial Data Mining; Elsevier: Amsterdam, The Netherlands, 2014; pp. 79–104. [Google Scholar] [CrossRef]
- Emerson, R.W. Causation and Pearson’s correlation coefficient. J. Vis. Impair. Blind. 2015, 109, 242–244. [Google Scholar] [CrossRef]
- Gunawan, T.S.; Ashraf, A.; Riza, B.S.; Haryanto, E.V.; Rosnelly, R.; Kartiwi, M.; Janin, Z. Development of video-based emotion recognition using deep learning with Google Colab. Telkomnika 2020, 18, 2463. [Google Scholar] [CrossRef]
- Ho, T.K. Random Decision Forests. In Proceedings of the 3rd International Conference on Document Analysis and Recognition, Montreal, QC, Canada, 14–16 August 1995; Volume 1, pp. 278–282. [Google Scholar] [CrossRef]
- Asghar, M.Z.; Lajis, A.; Alam, M.M.; Rahmat, M.K.; Nasir, H.M.; Ahmad, H.; Al-Rakhami, M.S.; Al-Amri, A.; Albogamy, F.R. A Deep Neural Network Model for the Detection and Classification of Emotions from Textual Content. Complexity 2022, 2022, 1–12. [Google Scholar] [CrossRef]
- Kotsiantis, S.B. Decision Trees: A Recent Overview. Artif. Intell. Rev. 2013, 39, 261–283. [Google Scholar] [CrossRef]
- Elmrabit, N.; Zhou, F.; Li, F.; Zhou, H. Evaluation of Machine Learning Algorithms for Anomaly Detection. In Proceedings of the 2020 International Conference on Cyber Security and Protection of Digital Services (Cyber Security), Dublin, Ireland, 15–19 June 2020; pp. 1–8. [Google Scholar] [CrossRef]
- Khan, T.; Alam, M.; Shaikh, F.A.; Khan, S.; Kadir, K.; Mazliham, M.; Shahid, Z.; Yahya, M. Flash Floods Prediction using Real Time data: An Implementation of ANN-PSO with less False Alarm. In Proceedings of the 2019 IEEE International Instrumentation and Measurement Technology Conference (I2MTC), Auckland, New Zealand, 20–23 May 2019; pp. 1–6. [Google Scholar] [CrossRef]
- Khan, T.A.; Alam, M.; Shahid, Z.; Ahmed, S.F.; Mazliham, M. Artificial Intelligence Based Multi-Modal Sensing for Flash Flood Investigation. In Proceedings of the 2018 IEEE 5th International Conference on Engineering Technologies and Applied Sciences (ICETAS), Bangkok, Thailand, 22–23 November 2018; pp. 1–6. [Google Scholar] [CrossRef]
- Diro, A.; Chilamkurti, N.; Nguyen, V.D.; Heyne, W. A Comprehensive Study of Anomaly Detection Schemes in IoT Networks Using Machine Learning Algorithms. Sensors 2021, 21, 8320. [Google Scholar] [CrossRef] [PubMed]
- Dreiseitl, S.; Ohno-Machado, L. Logistic regression and artificial neural network classification models: A methodology review. J. Biomed. Inform. 2002, 35, 352–359. [Google Scholar] [CrossRef] [PubMed]
- Upadhyay, D.; Manero, J.; Zaman, M.; Sampalli, S. Gradient Boosting Feature Selection With Machine Learning Classifiers for Intrusion Detection on Power Grids. IEEE Trans. Netw. Serv. Manag. 2021, 18, 1104–1116. [Google Scholar] [CrossRef]
- Khan, T.A.; Shahid, Z.; Alam, M.; Su’ud, M.; Kadir, K. Early Flood Risk Assessment Using Machine Learning: A Comparative Study of SVM, Q-SVM, K-NN and LDA. In Proceedings of the 2019 13th International Conference on Mathematics, Actuarial Science, Computer Science and Statistics (MACS), Karachi, Pakistan, 14–15 December 2019; pp. 1–7. [Google Scholar] [CrossRef]
- Keilwagen, J.; Grosse, I.; Grau, J. Area under precision-recall curves for weighted and unweighted data. PLoS ONE 2014, 9, e92209. [Google Scholar] [CrossRef] [PubMed]
- Mason, K.; Duggan, M.; Barrett, E.; Duggan, J.; Howley, E. Predicting host CPU utilization in the cloud using evolutionary neural networks. Future Gener. Comput. Syst. 2018, 86, 162–173. [Google Scholar] [CrossRef]
Disclaimer/Publisher’s Note: The statements, opinions and data contained in all publications are solely those of the individual author(s) and contributor(s) and not of MDPI and/or the editor(s). MDPI and/or the editor(s) disclaim responsibility for any injury to people or property resulting from any ideas, methods, instructions or products referred to in the content. |
© 2023 by the authors. Licensee MDPI, Basel, Switzerland. This article is an open access article distributed under the terms and conditions of the Creative Commons Attribution (CC BY) license (https://creativecommons.org/licenses/by/4.0/).