Article

Modeling the Effects of Horizontal Transverse Vibrations on the Thermal Behavior and the Ampacity of Rectangular Bus Bars

1
Faculty of Technical Sciences, University of Priština in Kosovska Mitrovica, Kneza Miloša 7, 38220 Kosovska Mitrovica, Serbia
2
Department of Electronics Engineering, Kaunas University of Technology, Studentu 50-438, 51368 Kaunas, Lithuania
3
“Mihajlo Pupin” Technical Faculty, University of Novi Sad, Đure Đakovića bb, 23101 Zrenjanin, Serbia
*
Author to whom correspondence should be addressed.
Appl. Sci. 2023, 13(11), 6745; https://doi.org/10.3390/app13116745
Submission received: 5 May 2023 / Revised: 21 May 2023 / Accepted: 30 May 2023 / Published: 1 June 2023
(This article belongs to the Section Mechanical Engineering)

Abstract

:
The purpose of this research is to correctly model steady-state heat transfer in and around rectangular bus bars installed horizontally in an indoor environment and to estimate the corresponding ampacities, considering the effects of horizontal transverse vibrations caused by electromagnetic forces. This thermo-electro-magneto-mechanical problem is solved analytically using correlations determined experimentally by other researchers, while the accuracy of the obtained results is verified numerically using the finite element method (FEM). The novelties of the developed model are as follows. First, modeling the effects of horizontal transverse vibrations on free convection from the top and bottom surfaces of rectangular bus bars via forced convection for different characteristic lengths. Second, modeling the effects of vibration amplitudes and vibration frequencies on the bus bar ampacity. Third, introducing the existing vibration classes (A, B, and C) into the analytical and FEM-based thermal analyses. The results show that with an increase either in the vibration amplitude or the vibration frequency, there is a greater convection-based dissipation of heat from the bus bars and an increase in their ampacity. Finally, for the standard vibration classes, it is found that the effect of horizontal transverse vibrations on the ampacity can be up to 41.99% for Class C.

1. Introduction

Electromagnetic forces appearing between bus bar conductors during normal operation have a static component, but also a vibrational (dynamic) component of a vibration frequency close to twice the frequency of the alternating current or of any other harmonic current of significant magnitude. These electromagnetic forces are of relatively minor consequence in normal operation [1,2]. However, if the bus bars are installed on supports [3], and if the vibration frequency matches a natural frequency for all bus bars, a resonance phenomenon may occur between every two sets of the supports [1,2]. In such an uncommon circumstance, the resulting mechanical stresses in the bus bars can be far greater than those caused by the electromagnetic forces due to a peak current [2], and can lead to high vibration amplitudes and possibly to fatigue damage of the bus bars or loosening of connections along them [1]. This problem has been successfully avoided by installing bus bars in line with one of the three standard vibration classes (A, B, or C), according to which vibration amplitudes of up to 3 mm are allowed [4]. Such continuously permissible vibration amplitudes can improve the dissipation of heat by convection from the bus bars and thus affect their ampacities. The questions of how should this be modeled thermally and how should the aforementioned effects be quantified are research gaps that will be addressed by this study.
A review of the literature to find possible gaps in the knowledge concerning the effect of vibrations on convection heat transfer from a vertical plate was already carried out by Abdu-Razak, Abbas, and Tahseen in 2020 [5]. In the same year, another relevant review on active and passive methods of enhancing heat transfer from a plate fin by means of vibrations was conducted by Rahman and Tafti in [6]. Based on the content of [5,6], it is logical that these reviews also cover the case of bus bars installed horizontally with vertical and horizontal major axes. However, these reviews did not include some relevant references, including the older ones used to conduct this study. For instance, in [5,6] there are no studies on free or forced convection heat transfer from a longitudinally vibrating vertical plate [7], vertical cylinders with vertically oriented plate fins [8], bus bars under short-circuit conditions [9], bus bars used to supply a test bench with high currents [10], and so on. Accordingly, all relevant references that were published in 2020 and later can be regarded as state of the art for this area.
The state-of-the-art references directly related to bus bars addressed the following research gaps: finite element method- (FEM-) based electrodynamic modeling of bus bars carrying high currents [11,12]; FEM-based modeling of bus bars in terms of coupling electromagnetic and thermal phenomena with fluid flow [13]; and vibration response of a bus bar enclosure considering the effect of a strong electric field [14]. In a broader context, these state-of-the-art studies have also closed research gaps, such as the effect of internal plate vibrations on heat transfer in a dryer [15]; visualization of a vibrating plate in a boiling bubble resonator [16]; mixed convection from a vertical plate subjected to periodic oscillations [17]; as well as the effect of vibrations on the phenomena of heat transfer and flow along heat exchange surfaces [18]. Within this broader context, the effects of square and sinusoidal wave-shaped vibrations on forced convection from a heat sink [19] and the modeling of the thermal behavior of different vibrating blades [20] were also addressed. According to this literature review, there is no study dealing with the effect of any vibrations on the ampacity of a bus bar in normal operation.
In this paper, the effects of horizontal transverse vibrations on the thermal behavior and the ampacity of ten different rectangular bus bars installed horizontally are modeled and analyzed analytically under the same steady-state service (operating and environmental) conditions, and the simulated results are compared with each other. The four bus bars of smaller cross-sections are assumed to be made of aluminum alloy 5052-O and have the same cross-sections as those of [21], so that the measurement results and empirical correlations from [21] can be used as an experimental background. The remaining six bus bars are assumed to be made of aluminum alloy 6101-T61 and identical to those of [22], so that the relevant data from [22] can be used for comparisons. The cases where the bus bars are installed horizontally in an indoor environment with a vertical and horizontal major axis are considered. The proposed analytical thermal model is implemented in the BUSBAR.m program, whose first version can only solve problems with pure free or forced convection without the effects of vibrations [22]. Whilst all FEM-based verifications are performed in COMSOL 4.3 [23].
Compared to the analytical model from [22], the most significant contributions made in the presented approach to the thermal modeling of rectangular bus bars are as follows. First, the effects of horizontal transverse vibrations on free convection from the top and bottom surfaces of current-carrying rectangular bus bars are modeled with existing empirical correlations for forced convection. This thermal modeling is carried out assuming that the top and bottom surfaces of the bus bars, regardless of their characteristic lengths, are non-adiabatic, which is contrary to an adiabatic assumption used in [21]. Second, the effects of different vibration amplitudes and different vibration frequencies on the bus bar ampacity are represented and quantified by means of the proposed analytical thermal model. The vibration amplitudes and vibration frequencies are chosen to correspond to the standard vibration classes A, B, and C, as well as frequencies that can cause the resonance phenomenon. Third, the standard vibration classes are introduced for the first time into the analytical and FEM-based thermal modeling of the rectangular bus bars at normal service conditions. Specifically, the effects of the vibration amplitudes and vibration frequencies corresponding to the standard vibration classes on the bus bar ampacity are modeled and quantified. Additional contributions of this paper are the results obtained for some vibration amplitudes that differ from the standard ones, as well as for vibration frequencies equal to some critical values and twice the frequencies of the second and third-order harmonic currents.

2. Geometry, Material Properties, and Assumptions

In general, the steady-state heat conduction equation follows from the law of conservation of energy in the volume of a rectangular bus bur of unit length (L = 1 m). Such volume elements of rectangular bus burs having width W (in m), height H (in m), and length L (in m) are shown in Figure 1. The unit length of the bus bars was chosen because the process of solving two-dimensional heat transfer problems in COMSOL implies that the default length of any geometric model (i.e., default depth when an object or solid is displayed on a two-dimensional computer screen) is L = 1 m. Thus, the representations of the problems in Figure 1 are three-dimensional, and the problems solved in COMSOL are two-dimensional with a length of 1 m.
The remaining symbols appearing in Figure 1 are as follows: T a is the ambient air temperature in K; Q tg , v is the volume power of heat sources in W·m−3; T s is the bus bar temperature in K, h cS is the heat transfer coefficient due to free or vibration-assisted convection from the two side surfaces in W·m−2·K−1; h cT is the heat transfer coefficient due to free or vibration-assisted convection from the top surface in W·m−2·K−1; h cB is the heat transfer coefficient due to free or vibration-assisted convection from the bottom surface in W·m−2·K−1; and ε is the thermal emissivity of the bus bar surfaces. Specifically, the effect of vibration parameters (vibration amplitude X in m or/and vibration frequency f V in Hz) on free convection from the side, top, or bottom surface of a rectangular bus bar is included based on the coefficient h cS , h cT , or h cB , respectively.
In the introduction, it is already provided that the considered bus bars are made of aluminum alloys 5052-O and 6101-T61. The thermal and electrical properties of these aluminum alloys are taken from [21,22,24] and outlined in Table 1. In Table 1, k t is the thermal conductivity in W·m−1·K−1, ρ e 20 is the direct current (or d.c.) resistivity at 293.157 K (or 20 °C) in Ω·m, and α ρ is the temperature coefficient of resistivity in K−1.
For the materials used, it is assumed that they are homogenous and isotropic, and that there is only radial heat conduction within them. It is also assumed that the volume powers of heat sources existing within those materials together with the corresponding thermal and electrical properties, and surface radiation properties (thermal emissivity ε and solar absorptivity α ) are constant.
For the indoor environment, it is assumed that the ampacity values are determined under the following service conditions [22]: (i) still air conditions; (ii) T a = 40 °C; (iii) continuously permissible temperature of bus bars T cp = 70 °C; (iv) ε = 0.35; (v) α = 0; (vi) frequency of the power system f = 60 Hz; and (vii) extra loss coefficient for the proximity effect k p = 1. Still air means that the wind velocity is 0 m·s−1, solar absorptivity of α = 0 means that there is no thermal effect of the sun, while k p = 1 means that the phase bus bar conductors are installed so that they do not affect each other thermally.
For the extra loss coefficient for the skin effect k s it is assumed that it depends only on the power system frequency f , but not on harmonic frequencies of higher orders. This assumption makes sense because the lengths of bus bar conductors are significantly shorter than the lengths of the conductors in electricity transmission and distribution lines, where the effects of harmonic frequencies of higher orders on the skin effect are very small. The values for the coefficient k s are taken from [22] or estimated based on available data.

3. Mathematical Modeling

3.1. Analytical Steady-State Thermal Model

If the law of conservation of energy is applied to any rectangular bus bar (i.e., any volume element of length L) from Figure 1, then the energy equation for steady-state heat transfer in an indoor environment (where there is no solar heating) becomes [22,25]:
Q tg ,   v V = 2 h cS S S + h cT S T + h cB S B + h r S o 1 T s T a
where
Q tg ,   v = k s k p ρ dc I 2 S 2
ρ dc = ρ e 20 1 + α ρ T s 293.157
h r = σ SB ε T s 2 + T a 2 T s + T a
V = WHL is the volume of the bus bar in m3, S S = HL is the area of one side surface of the bus bar in m2, S T = WL is the area of the top surface of the bus bar in m2, S B = WL is the area of the bottom surface of the bus bar in m2, h r is the heat transfer coefficient due to radiation between the bus bar surface and the indoor environment in W·m−2·K−1, S o 1 = 2 S S + S T + S B is the surface area of the bus bar in m2, ρ dc is the d.c. resistivity of the bus bar material in Ω·m, σ SB = 5.67 × 10⁻⁸ W·m−2·K−4 is the Stefan–Boltzmann constant, I is the bus bar RMS current in A (where RMS stands for Root-Mean Square value), and S = WH is the geometric cross-sectional area of the bus bar in m2. If there is no solar heating in an indoor environment, it means that the solar absorptivity is zero and/or the solar irradiance is zero. It should be emphasized here that the nominal and geometric cross-sectional areas are the same for any rectangular bus bar.
When the bus bar temperature T s is equal to the associated continuously permissible temperature T cp , the RMS current I becomes equal to the ampacity I cp . Accordingly, from Equations (1) and (2), the bus bar ampacity I cp can be expressed as [22]:
I cp = 2 h cS S S + h cT S T + h cB S B + h r S o 1 T cp T a 1 / 2 S k s k p ρ dc V 1 / 2
where ρ dc and h r should be calculated using Equations (3) and (4) for T s = T cp .
Moreover, based on Equation (1), the unknown bus bar temperature T s can be estimated as follows [22]:
T s = Q tg , v V 2 h cS S S + h cT S T + h cB S B + h r S o 1 + T a
Thermodynamic and physical properties of ambient air are needed to calculate the coefficients due to free, vibration-assisted, or forced convection. These convection coefficients are determined at the film temperature T film = T s + T a / 2 . For the ambient air at the film temperature T film , the density ρ a in kg·m−3, specific heat at constant pressure c t , a in J·kg−1·K−1, dynamic viscosity μ a in kg·m−1·s−1, thermal conductivity k t , a in W·m−1·K−1, or Prandtl number Pr is obtained by means of cubic spline interpolation and two arrays of discrete values from the pair of corresponding input data files. For instance: the density ρ a is determined by means of cubic spline interpolation and the pair of input data files Temperature.m and Density.m, the specific heat at constant pressure c t , a is determined by means of cubic spline interpolation and the pair of input data files Temperature.m and Capacity.m, and so on. More details related to the determination of thermodynamic and physical properties of ambient air can be found in [22].
For the two side surfaces of the bus bars, the vibration-assisted convection heat transfer coefficient h cS is estimated by means of [21,22]:
Gr S = 9.81 β T s T a H 3 ν a 2
Nu S = 0.825 + 0.387 Gr S Pr 1 / 6 1 + 0.492 / Pr 9 / 16 8 / 27 2   for   Gr S Pr 10 2
Nu S = 0.68 + 0.67 Gr S Pr 1 / 4 1 + 0.492 / Pr 9 / 16 4 / 9   for   Gr S Pr > 10 2
Nu SV = Nu S + 0.0315 2 π f V XH α t , a Nu S   for   Gr S Pr 10 2   or   Gr S Pr > 10 2
h cS = Nu sV k t , a H
where Gr S is the Grashof number for a stationary vertical plate, Nu S is the Nusselt number for a stationary vertical plate calculated using Equation (8) for Gr S Pr 10 2 or Equation (9) for Gr S Pr > 10 2 , Nu SV is the Nusselt number for a vibrating vertical plate, f V is the vibration frequency in Hz, X is the vibration amplitude in m, and α t , a = k t , a / ρ a c t , a is the thermal diffusivity of ambient air in m2·s−1. According to Equations (10) and (11), it is evident that the convection coefficient h cS includes the effect of horizontal transverse vibrations on free convection heat transfer between one of the two side surfaces of a bus bar and the ambient air. Modeling the effect of horizontal transverse vibrations on free convection using the empirical correlation (8) for the case when Gr S Pr 10 2 represents a generalization of the work of Park et al. from the year 2014 [21].
In Equation (10), there is a product of the vibration frequency f V and the vibration amplitude X, i.e.,
v V = f V X
which represents the vibration velocity in m·s−1 and which will be further used to model the effect of horizontal transverse vibrations on free convection heat transfer from the top and bottom surfaces of rectangular bus bars using existing empirical correlations for forced convection.
The vibration amplitudes considered here, assuming a vibration frequency of 120 Hz, are 0 m—for the case of free convection; 8.541 μm—for the case of twice the power system frequency [1]; 1 mm—for the case of the vibration class A [4]; 1.6 mm—for the case of the vibration class B [4]; 3 mm—for the case of the vibration class C [4]; and 4 mm and 5 mm—for the case of improper selection of supporting insulators and normal operating conditions [13]. The last two vibration amplitudes are chosen to match those of the experiments performed for the purpose of study [21]. The vibration frequencies considered here, assuming a vibration amplitude of 3 mm, are 0 Hz—for the case of free convection; 2.75 Hz—critical frequency for vibrations due to wind eddies [1]; 11.09 Hz—critical frequency for the vibration classes A and C [4]; 29 Hz—natural frequency determined experimentally in [21]; 120 Hz—twice the value of the power system frequency [1]; 240 Hz—twice the value of the frequency of the second order harmonic current [1,25]; and 360 Hz—twice the value of the frequency of the third order harmonic current [1,25]. The last two vibration frequencies are chosen to illustrate and quantify the potential effects of frequencies higher than twice the power system frequency.
For the top surface of the bus bars, the vibration-assisted convection heat transfer coefficient h cT is estimated in the following manner [7,22,26,27]:
Gr T = 9.81 β T s T a W 3 ν a 2
Nu T 1 = 0.54 Gr T Pr 1 / 4   for   Gr T Pr 8 · 10 6
Nu T 1 = 0.15 Gr T Pr 1 / 3   for   Gr T Pr > 8 · 10 6
Re TV = v V W ν a
Nu T 2 = 0.037 Re TV 4 / 5 Pr 1 / 3   for   Gr T Pr 8 · 10 6   or   Gr T Pr > 8 · 10 6
Nu TV = Nu T 2   for   Nu T 2 Nu T 1
Nu TV = Nu T 1   for   Nu T 2 < Nu T 1
h cT = Nu TV k t , a W
where Gr T is the Grashof number for a stationary horizontal plate, Nu T 1 is the Nusselt number for free convection from the top surface of a stationary horizontal plate calculated using Equation (14) for Gr T Pr 8 · 10 6 or Equation (15) for Gr T Pr > 8 · 10 6 , Re TV is the Reynolds number defined by the vibration velocity v V , Nu T 2 is the Nusselt number for fully developed turbulent forced convection from the top surface of a stationary horizontal plate, and Nu TV is the Nusselt number for vibration-assisted convection from the top surface of a horizontal plate.
For the bottom surface of the bus bars, the vibration-assisted convection heat transfer coefficient h cB is estimated as follows [7,22,26,27]:
Gr B = 9.81 β T s T a W 3 ν a 2
Nu B 1 = 0.27 Gr B Pr 1 / 4   for   Gr B Pr 8 · 10 6   or   Gr B Pr > 8 · 10 6
Re BV = v V W ν a
Nu B 2 = 0.037 Re BV 4 / 5 Pr 1 / 3   for   Gr B Pr 8 · 10 6   or   Gr B Pr > 8 · 10 6
Nu BV = Nu B 2   for   Nu B 2 Nu B 1
Nu BV = Nu B 1   for   Nu B 2 < Nu B 1
h cB = Nu BV k t , a W
where Gr B is the Grashof number for a stationary horizontal plate, Nu B 1 is the Nusselt number for free convection from the bottom surface of a stationary horizontal plate calculated using Equation (22) for Gr B Pr 8 · 10 6 or Gr B Pr > 8 · 10 6 , Re BV is the Reynolds number that is identical with Re TV , Nu B 2 is the Nusselt number for fully developed turbulent forced convection from the bottom surface of a stationary horizontal plate, and Nu BV is the Nusselt number for vibration-assisted convection from the bottom surface of a horizontal plate.
The idea that the effects of vibrations on free convection heat transfer from the surfaces of an isothermal plate can be modeled using pure forced convection is found in [7]. In practice, according to [26], a fully developed turbulent boundary layer (i.e., pure forced convection) over a stationary horizontal plate may be realized by “tripping” the existing boundary layer at the leading edge, using a fine wire or some other turbulence promoter. Based on the previous findings, it is assumed that the effect of horizontal transverse vibrations on free convection heat transfer from the top or bottom surface of an isothermal horizontal plate is the same as the effect of any turbulence promoter on forced convection heat transfer over a stationary horizontal surface. This assumption also agrees with the results of [6,19]. Accordingly, Equation (17) is obtained from the following equations [26,27]:
Nu T 2 = 0.037 Re TV 4 / 5 A Pr 1 / 3
A = 0.037 Re TV , cr 4 / 5 0.664 Re TV , cr 1 / 2
which are valid for 0.6 Pr 60 and Re TV , cr Re TV 10 8 , considering that, for a fully developed turbulent boundary layer, Re TV , cr = 0 and A = 0. In Equations (28) and (29), Re TV , cr represents the critical Reynolds number associated with the laminar to turbulent flow transition. In addition, for the transition, the critical Reynolds number and the constant A are equal to Re TV , cr = 5 · 10 5 and A = 871, respectively. The same applies to the bottom surface of a rectangular bus bar.
The above model can be applied to rectangular bus bars with surfaces whose characteristic lengths are large enough that a boundary layer can be formed along them. However, if these dimensions are small, as in the case of flat fins in [21], then the effects of convection and radiation from such surfaces can be ignored; i.e., those surfaces can be regarded as adiabatic. It is obvious that this was done in the experiments by [21]. On the contrary, in this paper, such surfaces are considered non-adiabatic, and the heat transfer coefficients due to free convection from them are modeled with the following correlations [28]:
h cS = 1.42 T s T a L c 1 / 4   for   Gr c Pr 10 9
h cS = 1.31 T s T a 1 / 3   for   Gr c Pr > 10 9
-
in the case of the two side surfaces;
h cT = 1.32 T s T a L c 1 / 4   for   Gr c Pr 10 9
h cT = 1.52 T s T a 1 / 3   for   Gr c Pr > 10 9
-
in the case of the top surface; and
h cB = 0.59 T s T a L c 1 / 4   for   Gr c Pr 10 9   or   Gr c Pr > 10 9
-
in the case of the bottom surface; where L c is the characteristic length of the side, top, or bottom bus bar surface in m, and Gr c is the Grashof number that refers to the side, top or bottom bus bar surface and that is defined by the corresponding characteristic length L c . Equations (30)–(34) represent simplified correlations for the free convection heat transfer coefficient from different flat surfaces to air at atmospheric pressure [28]. According to [29], a 5 mm long flat zone can be regarded as the zone where a boundary layer has enough space to form. Based on this, for each bus bar surface whose vertical or horizontal dimension is equal to or less than 5 mm, the characteristic length is set to L c = 5 mm. In particular, the proposed non-adiabatic assumption is used for each such surface instead of the adiabatic one.
Furthermore, it should be emphasized here that the case of vibration-assisted convection can be reduced to the case of free convection when X = 0 m or f V = 0 Hz is set.
Finally, all these empirical correlations and conditions are employed in the code of the iteration procedure of the BUSBAR.m program. In every iteration of the procedure, a convection coefficient is determined as the arithmetic mean value of the sum of the corresponding convection coefficient values from the previous and current iterations. The iterations in the inner and outer loops are repeated until the absolute value of the difference ( T s T cp ) becomes lower than specified accuracies. More details on the iteration procedure can be found in [22].

3.2. FEM-Based Steady-State Thermal Model

Steady-state heat transfer in and around any rectangular bus bar shown three-dimensionally in Figure 1 is defined by the following two-dimensional second-order partial differential equation [23,30]:
· k t T = x k t T x + y k t T y = Q tg , v
where x and y are the Cartesian spatial coordinates in m; k t is the thermal conductivity of the bus bar material in W·m−1·K−1; T is the unknown nodal temperature in K; and Q tg , v is the volume power of heat sources defined by Equation (2) in W·m−3.
Each side, top, or bottom surface of any rectangular bus bar from Figure 1 is represented by a combination of
n · k t T = ε σ SB ( T 4 T a 4 ) = h r T T a
-
radiation boundary condition; and
n · k t T = h c T T a
-
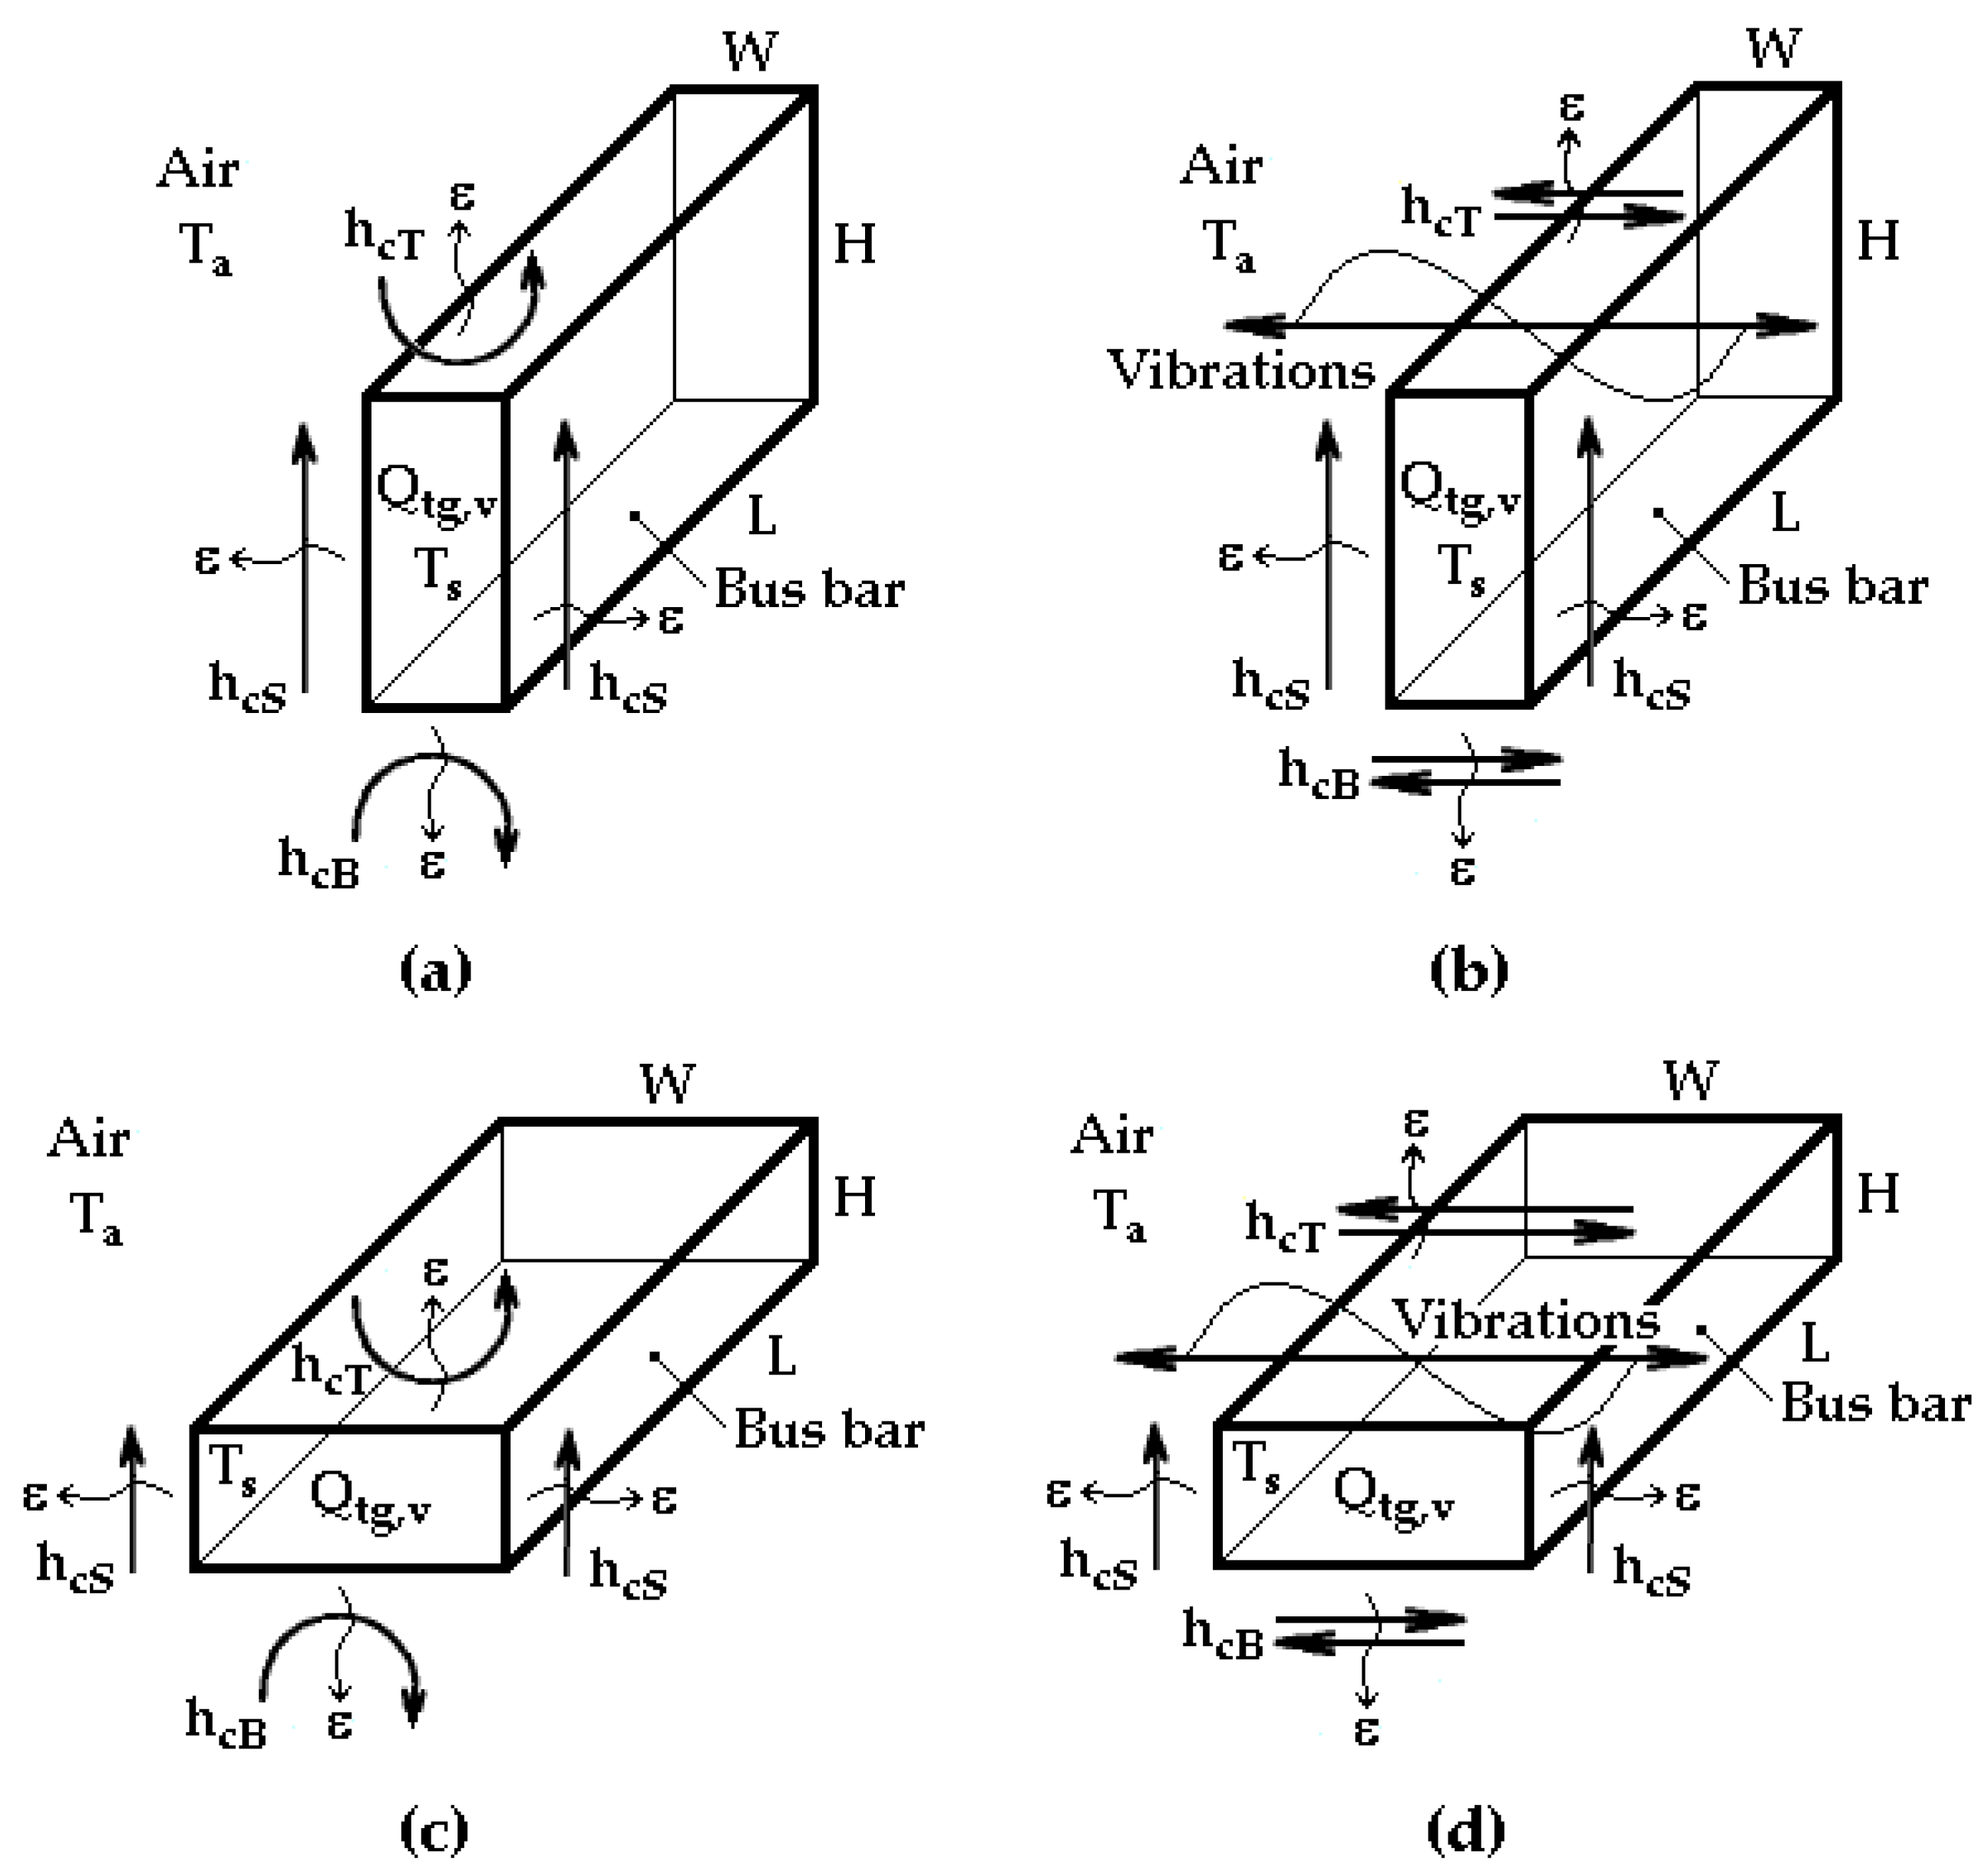
convection boundary condition [23,30]. In Equations (36) and (37), n is the normal vector oriented outwards in relation to the side, top, or bottom surface of the bus bar; T is the unknown temperature of the side, top, or bottom surface of the bus bar in K; h r is the heat transfer coefficient due to radiation from the bus bar surfaces defined by Equation (4) in W·m−2·K−1; h c is the heat transfer coefficient due to free or vibration-assisted convection from the side, top, or bottom surface of the bus bar in W·m−2·K−1; and T a is the temperature of the ambient air contacting the bus bar surfaces in K. The radiation boundary condition in each of the FEM-based models can be specified either by the thermal emissivity ε or by the radiation heat transfer coefficient h r . The effect of horizontal transverse vibrations on free convection from any rectangular bus bar is included in the corresponding FEM-based model using the convection heat transfer coefficient h c in the following manner: h c = h cS —for its side surfaces, h c = h cT —for its top surface, and h c = h cB —for its bottom surface. In addition, the combination of radiation and convection boundary conditions ensures that Equation (35) is non-linear, regardless of the fact that here the temperature difference ( T s T a ) should be constant and equal to 30 K.
Bus bar ampacities are also determined in COMSOL 4.3 by applying the FEM to two-dimensional computational domains corresponding to the rectangular bus bars from Figure 1, for the materials given in Table 1 and the service conditions specified in Section 2. In this regard, the values for Q tg , v are increased or decreased gradually from prescribed initial values to the values corresponding to the continuously permissible temperature T cp = 70 °C. The values of Q tg , v obtained in this way are compared with those generated by the BUSBAR.m program. Then, these Q tg , v values and Equations (2) and (5) are used to calculate the corresponding bus bar ampacities (for I = I cp ). The I cp values are also compared with those obtained using the BUSBAR.m program.
The FEM-based verification of the proposed analytical model is carried out in the Heat Transfer Module of COMSOL 4.3 [23] by means of the experimental data from [21]. In addition to the material properties and service conditions taken from the relevant literature, the Heat Transfer Module also uses as input data the volume power of heat sources, radiation heat transfer coefficient, and convection heat transfer coefficients generated by the updated version of the BUSBAR.m program. If the radiation boundary condition (36) is defined by the radiation heat transfer coefficient ( h r ), then the value of this coefficient should be added to the value of the corresponding convection heat transfer coefficient ( h c = h cS , h c = h cT or h c = h cB ). Otherwise, there still remains the possibility of setting the radiation boundary condition using the thermal emissivity ε .

4. Results and Discussion

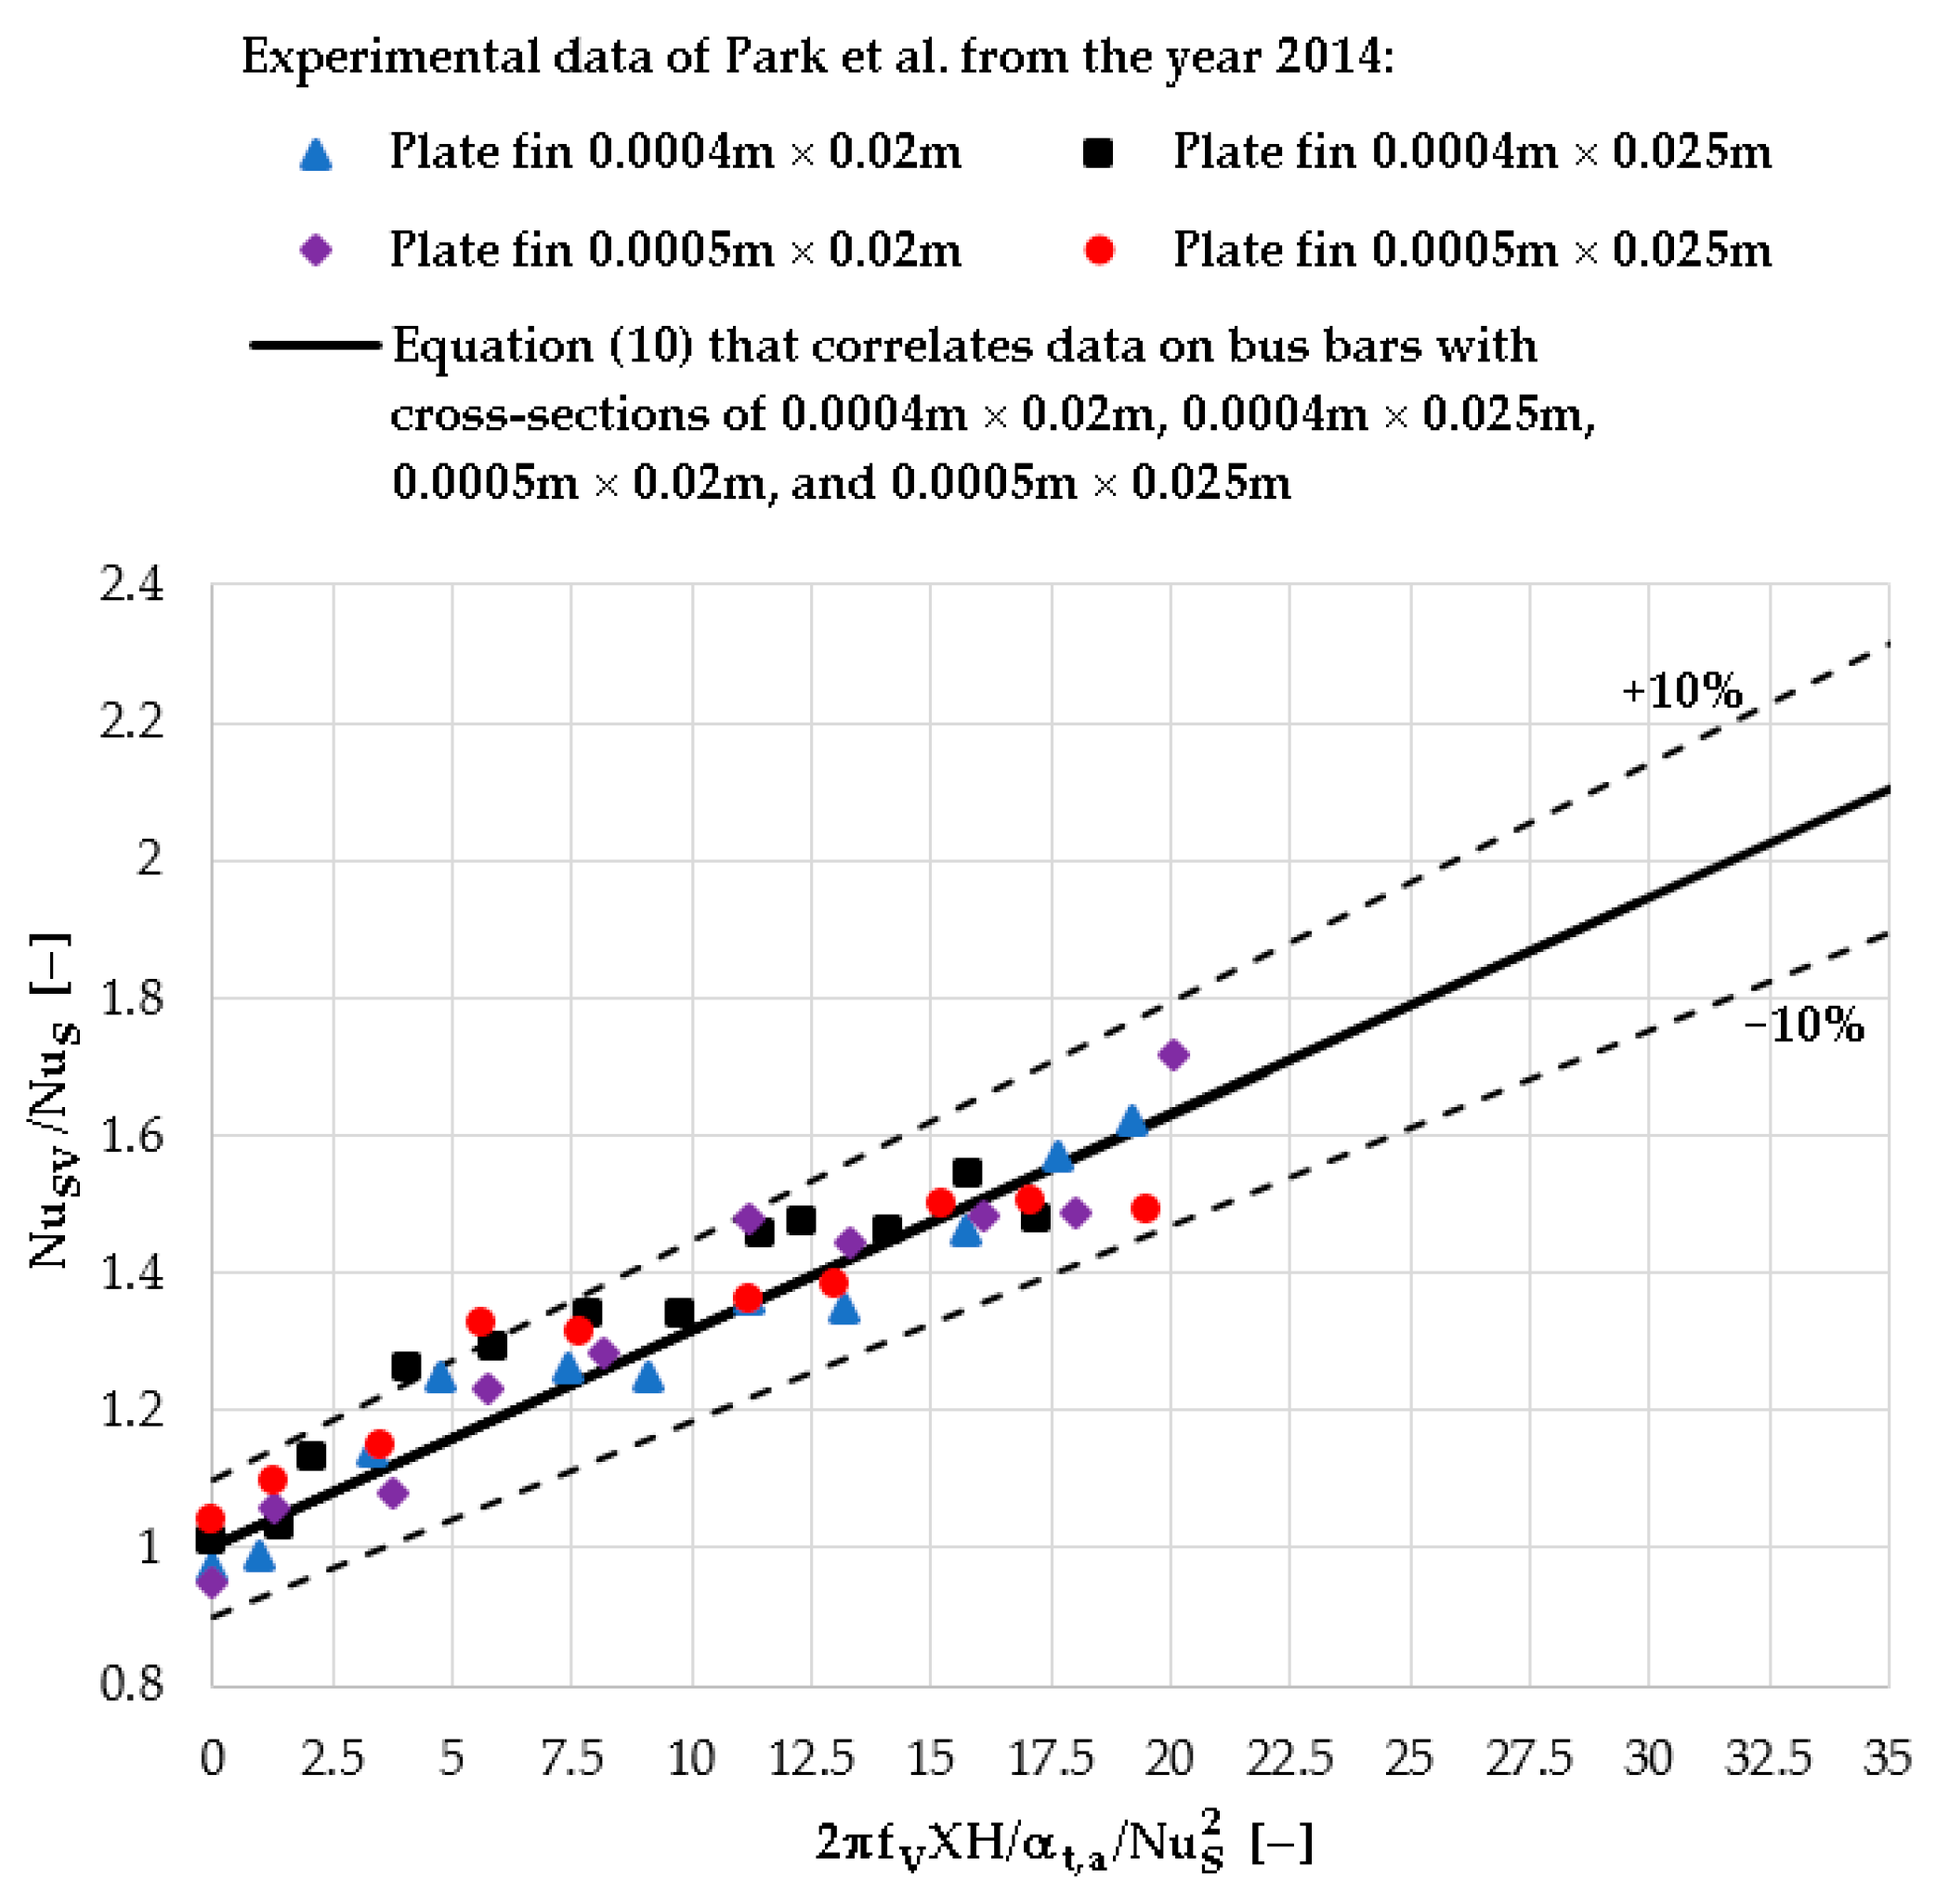
4.1. Experimental Validation of the Proposed Analytical Model

The proposed analytical model of steady-state heat transfer in and around the rectangular bus bars needs to be compared against relevant experimental data. These comparisons are required to validate that the proposed analytical model indeed represents the actual thermal behavior of the bus bars at steady-state conditions. For this purpose, the experimentally determined dependency of the normalized Nusselt number Nu SV / Nu S on the velocity ratio 2 π f V XH α t , a Nu S 2 from [21] is used. This dependency in its discrete form was generated for four different plate fins and different vibration amplitudes at natural frequencies of 50, 29, 59, and 40 Hz, assuming no heat transfer from the top and bottom surfaces of the plate fins (the so-called adiabatic assumption). According to [21], the natural frequencies of 50, 29, 59, and 40 Hz refer to plate fins with cross-sections of 0.0004 m × 0.02 m, 0.0004 m × 0.025 m, 0.0005 m × 0.02 m, and 0.0005 m × 0.025 m, respectively. In addition, for the purpose of this validation, a series of simulations was performed with bus bars having cross-sections identical to the cross-sections of plate fins from [21]. The data were generated using the BUSBAR.m program for different vibration amplitudes (ranging from 0 to 5 mm) at the same frequencies as those of the experiments, assuming that the top and bottom surfaces of the bus bars are non-adiabatic. Finally, the simulated data are correlated using Equation (10) and compared with the corresponding experimental data from [21]. This comparison is shown in Figure 2.
According to Figure 2, the normalized Nusselt number represented by Equation (10) agrees well with the experimental data from [21], where the discrepancy is only in two cases beyond the ±10% limits. According to [21], Equation (10) should be valid for vibration frequencies from 29 to 59 Hz and for velocity ratios from 0 to 20, i.e., for the ranges for which the experiments were carried out. In this study, according to Figure 2, these ranges of values are logically exceeded. Compared to the corresponding diagram from [21] that refers to the adiabatic assumption, there is practically no difference. Accordingly, the introduction of the non-adiabatic assumption for the top and bottom surfaces of the bus bars did not introduce any significant change in the thermal sense. Therefore, it can be considered that the proposed analytical model has been successfully validated through this comparison with experimental results.
Quantification of the effect of the non-adiabatic assumption on the bus bar ampacity for cases corresponding to the experiments from [21] is also performed. Table 2 outlines the ampacity values obtained for different amplitudes at frequencies of 50, 29, 59, and 40 Hz, assuming that the bus bars are installed horizontally with a vertical major axis.
The first four rows of Table 2 are generated for the adiabatic assumption from [21], while the remaining results are generated for the non-adiabatic assumption proposed in this paper. According to Table 2, the largest difference between these results is 0.4 A. This agrees with the results shown in Figure 2.

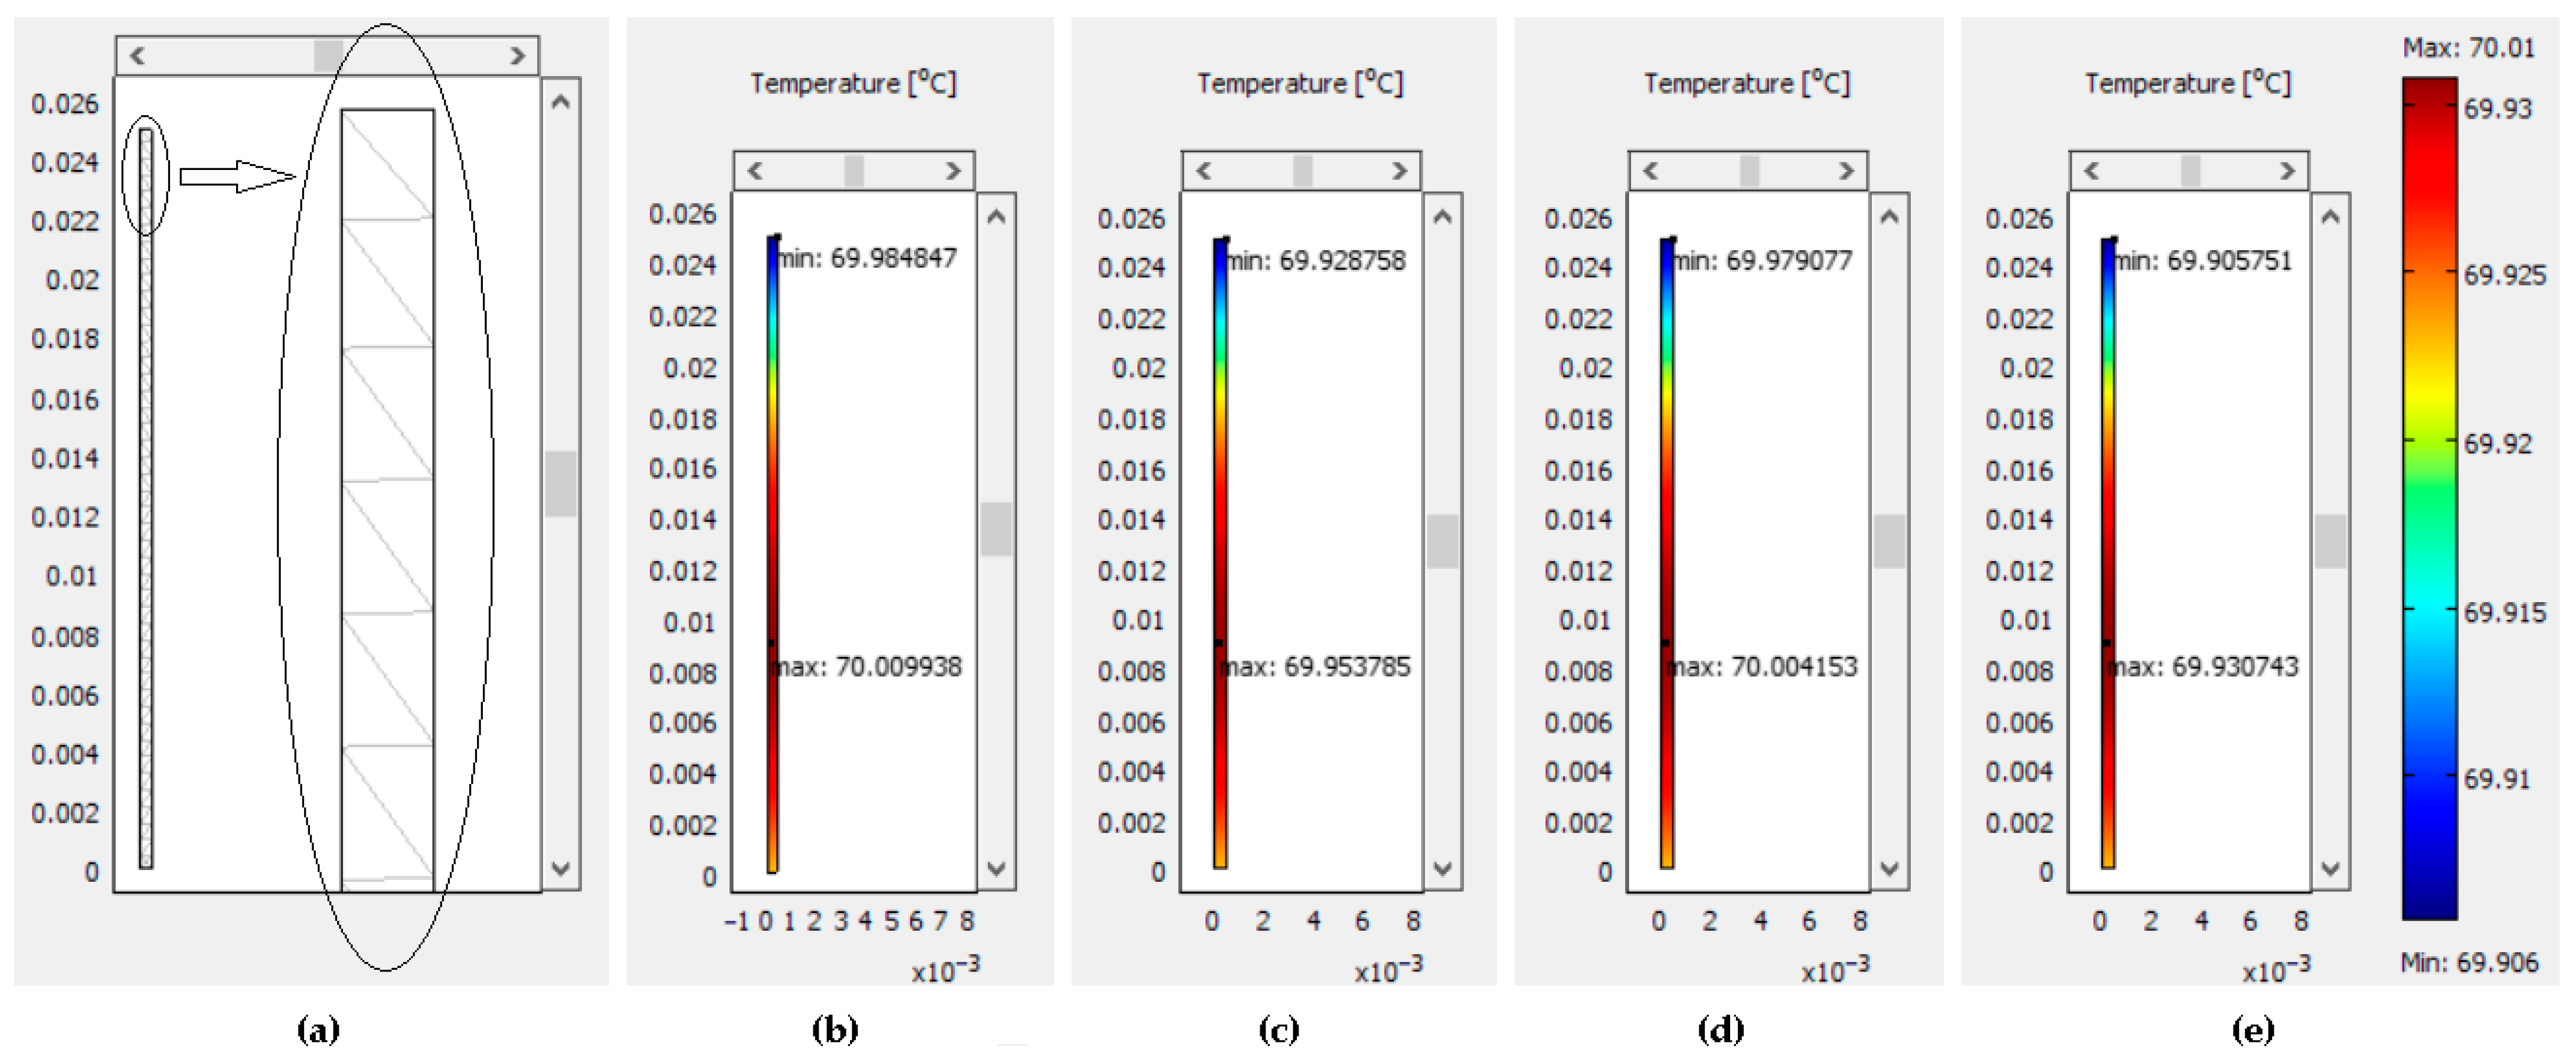
4.2. FEM-Based Verification of the Proposed Analytical Model

Verification of the accuracy of the proposed analytical model by applying the FEM to one of the examples from the experiments of [21] is the next thing to be performed. Accordingly, Figure 3 shows four steady-state temperature distributions over a two-dimensional representation of a rectangular bus bar whose area is equal to that of the plate fin 0.0004 m × 0.025 m considered in [21]. These temperature distributions are generated for the problem formulations from Figure 1a,b (taking into account the non-adiabatic assumption), vibration amplitudes of 0, 1, 1.6, and 3 mm (free convection and vibration classes A, B, and C, respectively), a vibration frequency of 29 Hz, and a temperature difference of T s T a = T cp T a = 343.157 − 313.157 = 30 K. These parameters were chosen to match the experimental data from [21]. Figure 3a shows the two-dimensional representation of the geometry (that is, solid) from Figure 1a,b with the associated finite element (FE) mesh.
The outputs of the BUSBAR.m program used as inputs in COMSOL 4.3 to generate the temperature distributions from Figure 3 are as follows:
(i)
Q tg , v = 1706547.953 W·m−3, h cS = 8.388 W·m−2·K−1, h cT = 11.615 W·m−2·K−1, and h cB = 5.192 W·m−2·K−1—for the case of free convection.
(ii)
Q tg , v = 1828981.716 W·m−3, h cS = 9.228 W·m−2·K−1, h cT = 11.61 W·m−2·K−1, and h cB = 5.19 W·m−2·K−1—for the case of vibration class A.
(iii)
Q tg , v = 1908493.466 W·m−3, h cS = 9.737   W ·m−2·K−1, h cT = 11.615 W·m−2·K−1, and h cB = 5.192 W·m−2·K−1—for the case of vibration class B.
(iv)
Q tg , v = 2079576.482 W·m−3, h cS = 10.913   W ·m−2·K−1, h cT = 11.608 W·m−2·K−1, and h cB = 5.189 W·m−2·K−1—for the case of vibration class C.
Values of k t , ε and T a are given in the previous sections.
According to Figure 3, it is evident that the temperature difference T s T a corresponds with that of the experiments performed in [21].
In addition, FE mesh independence tests are performed in accordance with the procedure described in [31]. The results of these mesh independence tests are shown in Table 3. These tests showed that the mesh density does not affect the accuracy of the results obtained for the computational domain of Figure 3a consisting of only one block, that is, one material. Results of other numerical simulations, except for the four temperature distributions in Figure 3, are not given here in order to reduce the content of this study.
According to Figure 3, the maximum and minimum bus bar temperatures are approximately equal to the continuously permissible temperature T cp = 343.157 K = 70 °C. The differences between these temperatures are less than ±0.1 °C. Moreover, the accuracy of each simulation carried out using the updated version of the BUSBAR.m program was also verified in the same manner. It was determined that the maximum and minimum bus bar temperatures obtained using the BUSBAR.m program and COMSOL 4.3 differ from the temperature T cp = 70 °C by approximately ±0.2 °C. Finally, it can be considered that the accuracy and effectiveness of the proposed steady-state thermal model have been successfully verified by means of the corresponding FEM-based simulations in COMSOL 4.3.

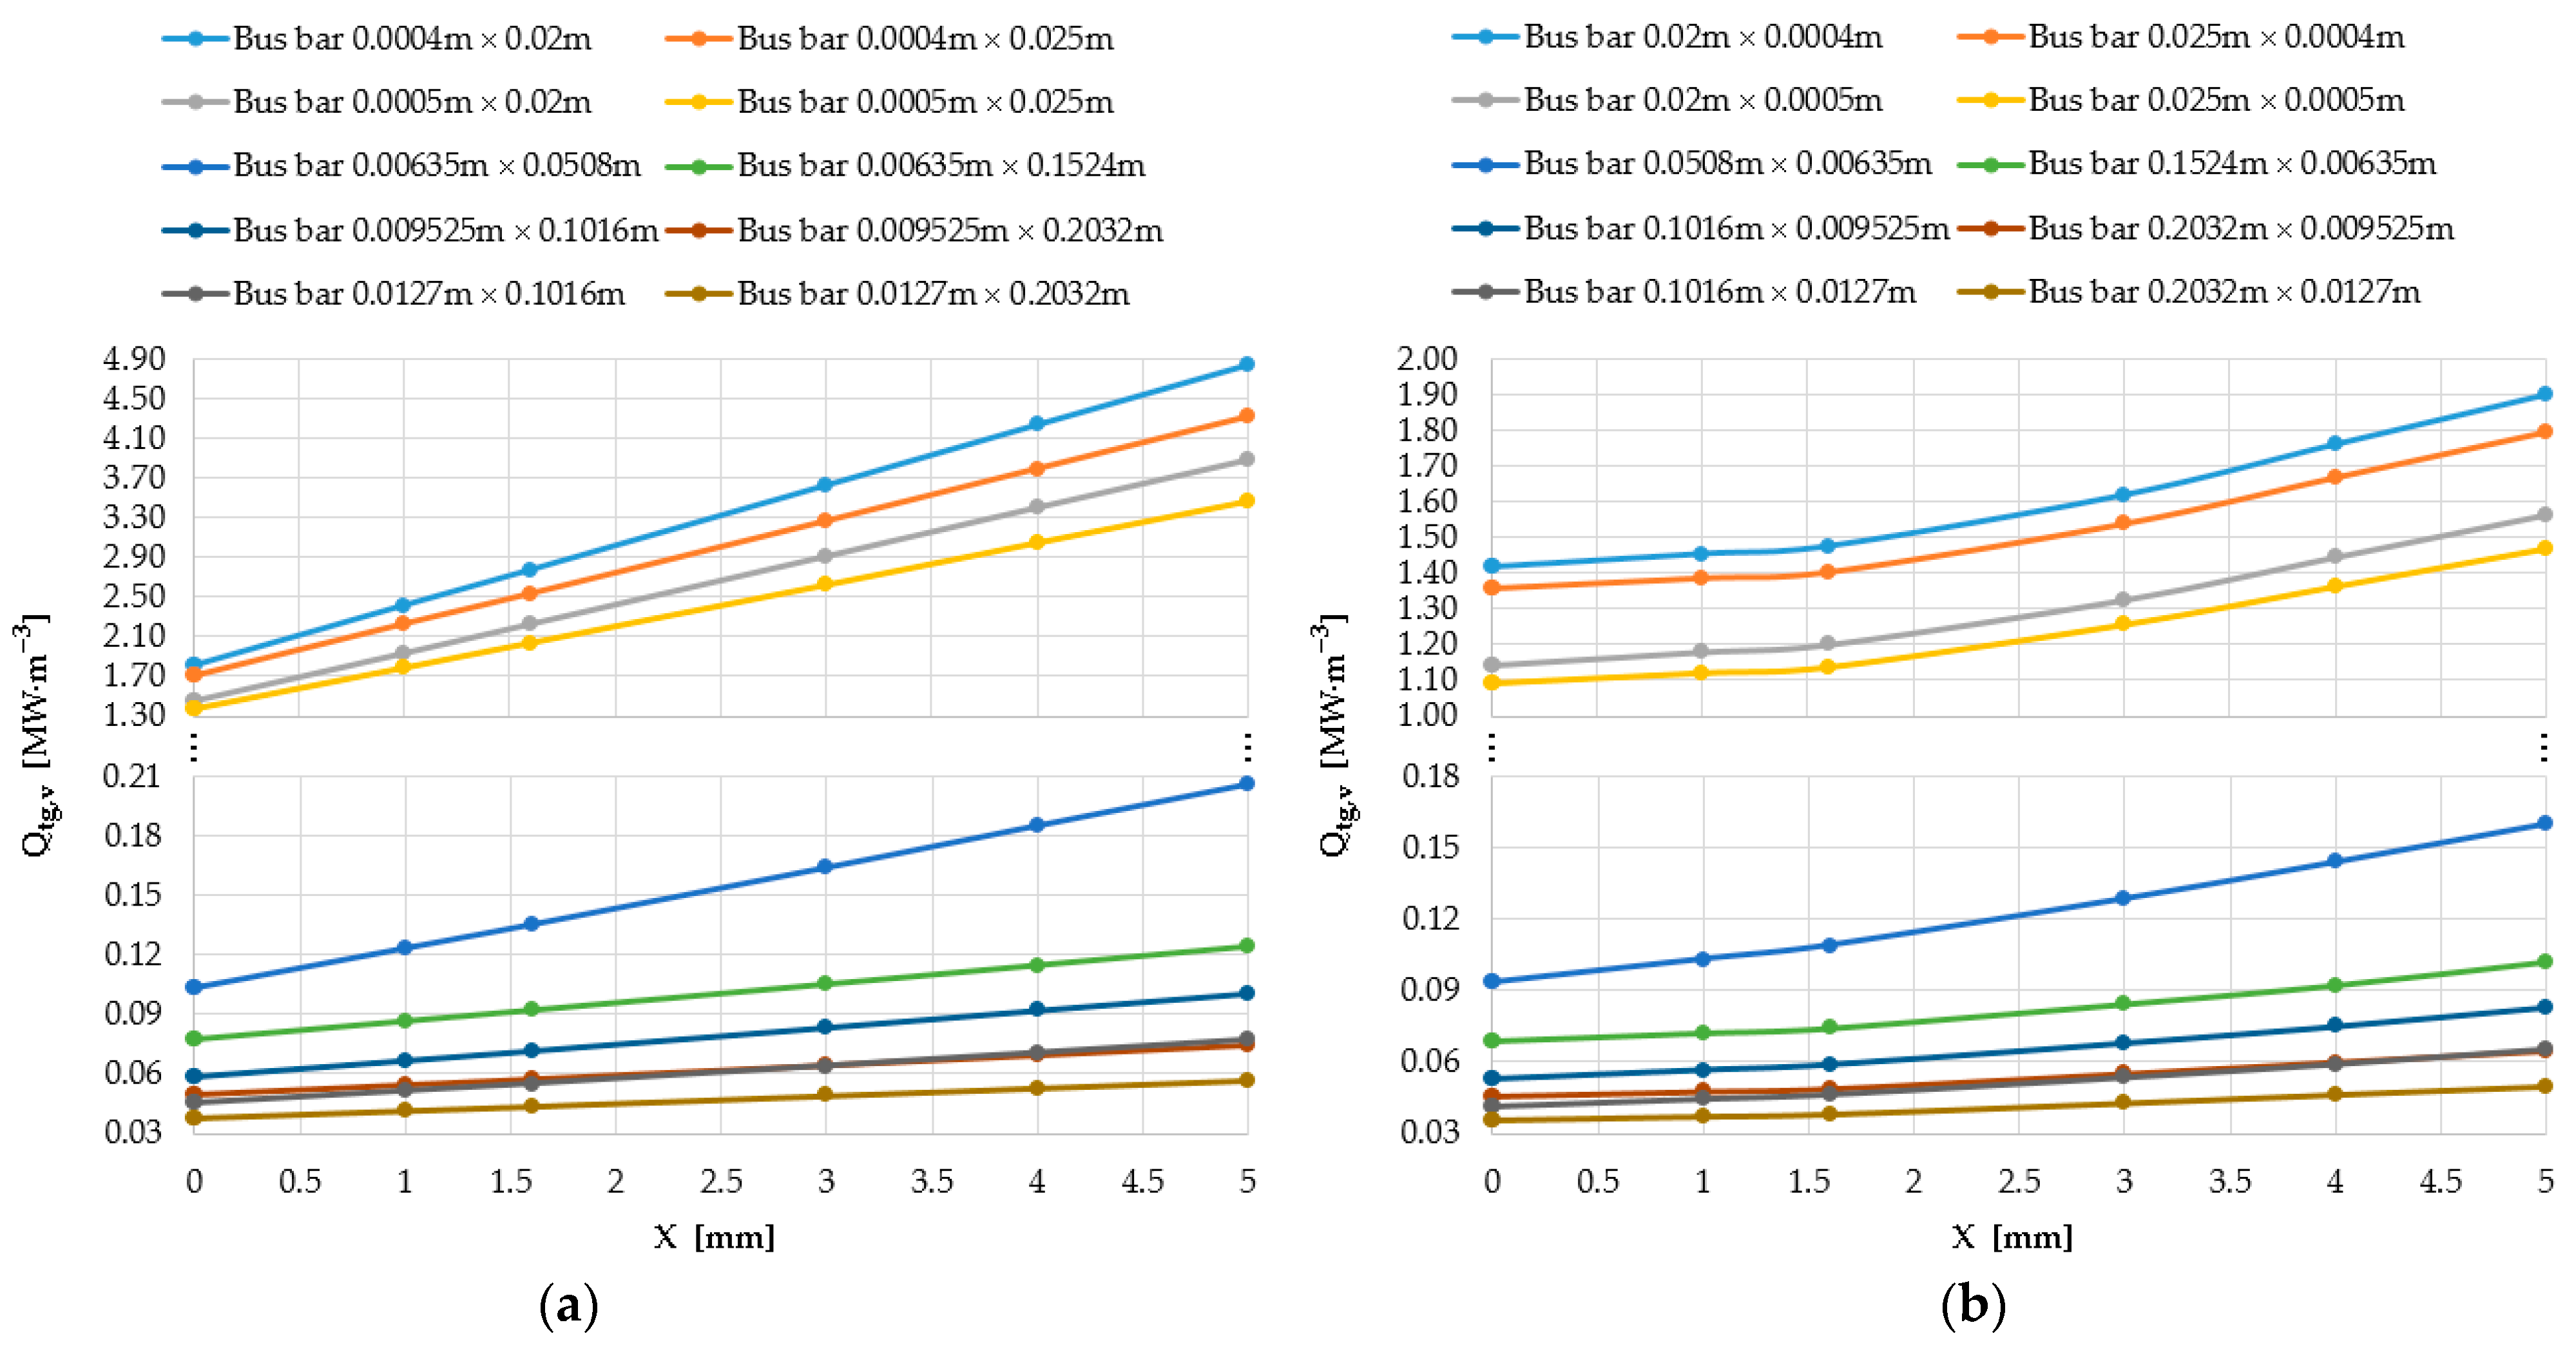
4.3. Results of Analytical Thermal Modeling

The diagrams in Figure 4a,b show the volume power of heat sources Q tg , v as a function of the vibration amplitude X for rectangular bus bars installed horizontally with a vertical and horizontal major axis (according to Figure 1), respectively. All these volume powers of heat sources are obtained for a vibration frequency of 120 Hz. The results obtained for X = 0 m correspond to stationary bus bars (Figure 1a,c), while all other results correspond to vibrating bus bars (Figure 1b,d).
According to Figure 4a,b, the volume power of heat sources increases with an increase in the vibration amplitude, and also with a decrease in the cross-sectional area of the bus bars. In the first case, the dependencies Q tg , v = f X are almost linear, while in the second, they are non-linear. The resulting nonlinearities are a consequence of the approach to modeling the vibration-assisted convection from the top and bottom surfaces of the bus bars using empirical correlations for forced convection. In particular, the diagrams in Figure 4a,b show that as the vibration amplitude increases, more electricity (i.e., a higher current) can flow through the same bus bar.
As for the heat transfer coefficient due to radiation, the value h r = 2.812 W·m−2·K−1 is obtained in each simulation performed by the BUSBAR.m program. This is the expected result, which can also be obtained by the calculation method described in [25].
The diagrams in Figure 5a,b show the normalized Nusselt number Nu SV / Nu S as a function of the velocity ratio 2 π f V XH α t , a Nu S 2 for different rectangular bus bars installed horizontally with a vertical and horizontal major axis, respectively. These normalized Nusselt numbers are generated for different vibration amplitudes at a vibration frequency of 120 Hz. The normalized Nusselt numbers obtained for X = 0 m correspond to stationary bus bars (Figure 1a,c), while all other normalized Nusselt numbers correspond to bus bars affected by horizontal transverse vibrations (Figure 1b,d). In this regard, the definition of the velocity ratio used here can be found in [21].
From Figure 5a,b, it is obvious that the normalized Nusselt number increases with an increase in the velocity ratio, i.e., with an increase in the vibration amplitude at f V = 120 Hz. For the same cross-sections, the normalized Nusselt numbers are significantly higher for bus bars installed with a horizontal major axis (Figure 5b) than for the same bus bars installed with a vertical major axis (Figure 5a). This is caused by a significant increase in the velocity ratio in the case of bus bars installed with a horizontal major axis. For velocity ratios ranging from 0 to 20, the results from Figure 5a, related to bus bars with cross-sections of 0.0004 m × 0.02 m, 0.0004 m × 0.025 m, 0.0005 m × 0.02 m, and 0.0005 m × 0.025 m, match the corresponding experimental data from [21]. Specifically, the discrepancies between the simulated and existing experimental data are almost the same. This can be considered a good result. The dependencies shown in Figure 5a,b coincide perfectly with Equation (10).
Heat transfer coefficients due to convection between the surfaces of different rectangular bus bars and the ambient air as functions of vibration amplitude are presented in Figure 6, Figure 7 and Figure 8. These coefficients are generated for a vibration frequency of 120 Hz. Figure 6 corresponds to the two side surfaces, Figure 7 to the top surface, and Figure 8 to the bottom surface. The convection coefficients obtained for X = 0 m correspond to stationary bus bars (Figure 1a,c), that is, free convection heat transfer. Whilst all other convection coefficients correspond to vibrating bus bars (Figure 1b,d), that is, vibration-assisted convection heat transfer.
Based on Figure 6 and Figure 8, it is evident that the coefficients due to vibration-assisted convection from the side and bottom surfaces increase with an increase in the vibration amplitude at f V = 120 Hz, and also with a decrease in the corresponding characteristic length. According to Figure 7, most of the coefficients due to vibration-assisted convection from the top surfaces are constant. The only exceptions are the coefficients that, according to Figure 7b, correspond to bus bars with cross-sectional areas of 0.0508 m × 0.00635 m, 0.1524 m × 0.00635 m, 0.1016 m × 0.009525 m, and 0.1016 m × 0.0127 m. The appearance of nonlinearities in Figure 7b and Figure 8a,b is once again a consequence of modeling the effect of horizontal transverse vibrations on free convection by means of empirical correlations for forced convection. It is found that this effect is most pronounced in the case of coefficients due to convection from the bottom surfaces of the considered bus bars. In general, it is found that the vibration amplitude can enhance the convection heat transfer from the bus bar surfaces, which agrees with the conclusions drawn in [32].
The ampacity as a function of the vibration amplitude at a vibration frequency of 120 Hz for different rectangular bus bars is given in Table 4.
According to Table 4, the bus bar ampacity increases with an increase in the vibration amplitude. Compared to the case corresponding to free convection (X = 0), this increase amounts to 0–0.226%—for X = 8.541 μm; 1.039–15.801%—for X = 1 mm (vibration class A); 1.663–24.154%—for X = 1.6 mm (vibration class B); 6.445–41.986%—for X = 3 mm (vibration class C); 10.811–53.499%—for X = 4 mm; and 14.969–64.108%—for X = 5 mm. For all the vibration amplitudes considered, the minimum increases correspond to a bus bar with a cross-section of 0.025 m × 0.0004 m, while the maximum increases correspond to a bus bar with a cross-section of 0.0004 m × 0.02 m.
The volume power of heat sources Q tg , v as a function of the vibration frequency f V for rectangular bus bars installed horizontally with a vertical and horizontal major axis is presented in Figure 9a,b, respectively. The volume powers of heat sources are calculated for a vibration amplitude of 3 mm (vibration class C). The volume powers of heat sources obtained for f V = 0 Hz correspond to stationary bus bars (Figure 1a,c), while the volume powers of heat sources obtained for all other vibration frequencies correspond to vibrating bus bars (Figure 1b,d).
From Figure 9a,b, it can be observed that the volume power of heat sources increases with an increase in the vibration frequency, and also with a decrease in the cross-sectional area of the bus bars. In the case shown in Figure 9a, the dependencies Q tg , v = f f V are almost linear, while in the case shown in Figure 9b, they are non-linear. As in the case of Figure 4b, the resulting nonlinearities are a consequence of the approach to modeling the vibration-assisted convection from the top and bottom surfaces of the bus bars. Specifically, the diagrams in Figure 9a,b show that as the vibration frequency increases, a higher current can flow through the same bus bar. Therefore, for the considered ranges of values, the effect of the vibration frequency on heat generation enhancement is significantly greater than the effect of vibration amplitude.
The normalized Nusselt number Nu SV / Nu S as a function of the velocity ratio 2 π f V XH α t , a Nu S 2 for different rectangular bus bars installed horizontally with a vertical and horizontal major axis is provided in Figure 10a,b, respectively. These normalized Nusselt numbers are calculated for different vibration frequencies at a vibration amplitude of 3 mm. The normalized Nusselt numbers obtained for f V = 0 Hz correspond to free convection (Figure 1a,c), while all other normalized Nusselt numbers correspond to vibration-assisted convection (Figure 1b,d).
From Figure 10a,b, it is clear that the normalized Nusselt number increases with an increase in the velocity ratio. Thus, the normalized Nusselt number increases with an increase in the vibration frequency at X = 3 mm, and in this particular case, the Nusselt number is higher for bus bars installed with a horizontal major axis (Figure 10b).
Convection heat transfer coefficients for the surfaces of different rectangular bus bars as functions of vibration frequency are presented in Figure 11, Figure 12 and Figure 13. The coefficients are generated for a vibration amplitude of 3 mm. Figure 11 refers to the two side surfaces, Figure 12 to the top surface, and Figure 13 to the bottom surface. The heat transfer coefficients obtained for f V = 0 Hz refer to free convection (Figure 1a,c), while all other heat transfer coefficients refer to vibration-assisted convection (Figure 1b,d).
From Figure 11, Figure 12 and Figure 13, it is clear that the vibration-assisted convection heat transfer coefficients from all the surfaces of the rectangular bus bars increase with an increase in the vibration frequency at X = 3 mm (vibration class C), and, in general, with a decrease in the corresponding characteristic length. According to Figure 11a,b, the vibration-assisted convection coefficients from the side surfaces of the bus bars are almost linear. Furthermore, according to Figure 12 and Figure 13, the vibration-assisted convection coefficients from the top and bottom surfaces are non-linear. The presence of nonlinearities in Figure 12 and Figure 13 is once again caused by the approach to modeling the effect of horizontal transverse vibrations on free convection using empirical correlations for forced convection. In particular, it is evident that the effect of vibration frequency on the enhancement of free convection heat transfer is significantly greater than the effect of vibration amplitude. This is also in line with the conclusions of [32].
The ampacity as a function of the vibration frequency at a vibration amplitude of 3 mm (vibration class C) for different rectangular bus bars is given in Table 5.
Based on Table 5, the bus bar ampacity increases with an increase in the vibration frequency. Compared to the ampacity values corresponding to free convection ( f V = 0 Hz), this increase amounts to 0–1.354%—for f V = 2.75 Hz; 0.208–4.74%—for f V = 11.09 Hz; 0.624–11.738%—for f V = 29 Hz; 6.445–41.986%—for f V = 120 Hz; 21.622–74.041%—for f V = 240 Hz; and 38.877–101.354%—for f V = 360 Hz. Once again, in the range of vibration frequency from 0 to 360 Hz, the minimum increases are obtained for the bus bar 0.025 m × 0.0004 m, and the maximum increases for the bus bar 0.0004 m × 0.02 m.

5. Conclusions

The analytical and numerical results of this study contributed decisively to modeling the effects of horizontal transverse vibrations on the free convection heat transfer phenomenon and the ampacity of rectangular bus bars in an indoor environment, under normal and near-normal service conditions. This study considered ten rectangular bus bars with different cross-sections, assuming that they were heated by the corresponding ampacities and that they were vibrated horizontally with an amplitude of 0 to 5 mm at a frequency of 120 Hz, as well as with a frequency of 0 to 360 Hz at an amplitude of 3 mm. The existing experimental data were used to quantify the effects of vibration amplitude and vibration frequency on intensifying convection heat transfer from the bus bars, and increasing ampacity. The analytical and numerical results of this study were compared with each other, as well as with those from the relevant literature.
The main conclusions of this study are as follows. First, the vibration amplitudes and frequencies considered can increase the bus bar ampacity up to 64.108% and 101.354%, respectively. These maximum increases correspond to the bus bar 0.0004 m × 0.02 m. Second, it is found that the effect of vibration frequency on enhancing free convection heat transfer and, consequently, increasing the bus bar ampacity is significantly greater than the effect of vibration amplitude. Third, for the vibration classes A, B, and C, it is estimated that horizontal transverse vibrations can increase the bus bar ampacity up to 41.986% at a vibration frequency of 120 Hz. Fourth, the discrepancy between the results obtained using the proposed analytical model and the relevant experimental data is in most cases within the ±10% limits. Fifth, the values of bus bar temperature obtained using the BUSBAR.m program and COMSOL 4.3 differ from the corresponding continuously permissible temperature by approximately ±0.2 °C. Sixth, the accuracy of the proposed analytical model was successfully validated using the relevant experimental data and verified using the FEM.
The results of this study can be useful for engineers and researchers involved in the design of bus bars in terms of including the effects of vibrations on the bus bar ampacity in normal operation. In addition, the next challenge could be to evaluate the effects of vibrations that occur in fault conditions on free convection heat transfer and associated short-circuit currents.

Author Contributions

Conceptualization, Lj.G. and D.K.; methodology, D.K. and Lj.G.; software, D.K. and D.A.; validation, Lj.G., D.K. and D.A.; formal analysis, Lj.G., D.K., D.A. and S.J.; investigation, Lj.G. and D.K.; resources, D.K.; data curation, Lj.G., D.K., D.A. and S.J.; writing—original draft preparation, D.K.; writing—review and editing, Lj.G., D.K., D.A. and S.J.; visualization, S.J.; supervision, D.K. and D.A; funding acquisition, Lj.G., D.K., D.A. and S.J. All authors have read and agreed to the published version of the manuscript.

Funding

This research received no external funding.

Institutional Review Board Statement

Not applicable.

Informed Consent Statement

Not applicable.

Data Availability Statement

The data used in this research are available on request from the corresponding author.

Acknowledgments

This manuscript was based on research conducted within program No. NIO 200155 supported by the Government of the Republic of Serbia.

Conflicts of Interest

The authors declare no conflict of interest.

Nomenclature

Symbols
Aconstant, – S S area of one side surface of a rectangular bus bar, m2
c t , a specific heat of air at constant pressure, J·kg−1·K−1
S T area of the top surface of a rectangular bus bar, m2
f frequency of the power system, 60 Hz
f V vibration frequency, HzTunknown nodal temperature, or unknown temperature of the side, top, or bottom surface of a rectangular bus bar, K
GrGrashof number, –
Hheight of a rectangular bus bar, m
h c heat transfer coefficient due to free or vibration-assisted convection, W·m−2·K−1 T a ambient air temperature, °C or K
T c p continuously permissible temperature of bus bars, °C or K
h r heat transfer coefficient due to radiation, W·m−2·K−1
T f i l m film temperature, K
I RMS current of a rectangular bus bar, A T s , T s bus bar temperature, °C or K
I c p ampacity of a rectangular bus bar, AVvolume of a rectangular bus bar, m3
k t thermal conductivity of the bus bar material, W·m−1·K−1 V V vibration velocity, m·s−1
Wwidth of a rectangular bus bar, m
k t , a thermal conductivity of air, W·m−1·K−1Xvibration amplitude, m, mm or μm
k p extra loss coefficient for the proximity effect, –x, yCartesian spatial coordinates, m
k s extra loss coefficient for the skin effect, – α solar absorptivity, –
Llength of a rectangular bus bar, m α t , a thermal diffusivity of air, m2·s−1
n normal vector oriented outwards in relation to the side, top, or bottom surface of a rectangular bus bar, – α ρ temperature coefficient of resistivity, K−1
β thermal expansion coefficient of air, K−1
ε thermal emissivity, –
NuNusselt number, – μ a dynamic viscosity, kg·m−1·s−1
PrPrandtl number, – ν a kinematic viscosity of air, m2·s−1
Q t g , v volume power of heat sources, W·m−3πPi number, 3.14159265
ReReynolds number, – ρ a density of air, kg·m−3
Sgeometric cross-sectional area of a rectangular bus bar, m2 ρ d c d.c. resistivity of the bus bar material, Ω·m
ρ e 20 d.c. resistivity of the bus bar material at 20 °C or 293.157 K, Ω·m
S B area of the bottom surface of a rectangular bus bar, m2
σ S B Stefan–Boltzmann constant, 5.67·10−8 W·m−2·K−4
S o 1 surface area of a rectangular bus bar, m2
Subscripts
Bbottom surface of a rectangular bus barTtop surface of a rectangular bus bar
crcritical valueVvibration, or vibrating bus bar
Sside surface of a rectangular bus bar
Abbreviations
d.c.direct currentFEMfinite element method
FEfinite elementRMSRoot-Mean Square

References

  1. Chapman, D.; Norris, T. Copper for Busbars—Guidance for Design and Installation, 15th ed.; Copper Development Association Inc.: New York, NY, USA; European Copper Institute Ltd.: Brussels, Belgium, 2014; pp. 1–107. [Google Scholar]
  2. Thierry, J.-P.; Kilindjian, C. Electrodymanic Forces on Busbars in LV Systems; No. 162; Cahier Technique Merlin Gerin: Grenoble, France, 1996; pp. 1–20. [Google Scholar]
  3. Maheswara Rao, N.; Vasudevamurthy, B.R.; Girija, G.; Das, S.K. Significance of support structure for short circuit withstand strength of bus-bar assembly panels—Experiences with testing. Power Res. A J. CPRI 2013, 9, 197–204. [Google Scholar]
  4. Det Norske Veritas (DNV). Environmental Test Specification for Instrumentation and Automation Equipment; Standard for Certification No. 2.4; DNV: Oslo, Norway, 2015. [Google Scholar]
  5. Abdu-Razak, A.E.; Abbas, E.F.; Tahseen, T.A. The effect of vibration on the heat transfer from a vertical plate: A review. SSRG Int. J. Therm. Eng. 2020, 6, 1–5. [Google Scholar] [CrossRef]
  6. Rahman, A.; Tafti, D. Characterization of heat transfer enhancement for an oscillating flat plate-fin. Int. J. Heat Mass Transf. 2020, 147, 119001. [Google Scholar] [CrossRef]
  7. Krishna Prasad, K.; Ramanathan, V. Heat transfer by free convection from a longitudinally vibrating vertical plate. Int. J. Heat Mass Transf. 1972, 15, 1213–1223. [Google Scholar] [CrossRef]
  8. An, B.H.; Kim, H.J.; Kim, D.-K. Nusselt number correlation for natural convection from vertical cylinders with vertically oriented plate fins. Exp. Therm. Fluid Sci. 2012, 41, 59–66. [Google Scholar] [CrossRef]
  9. Kadkhodaei, G.; Sheshyekani, K.; Hamzeh, M.; Tavakoli, S.D. Multiphysics analysis of busbars with various arrangements under short-circuit conditions. IET Electr. Syst. Transp. 2016, 6, 237–245. [Google Scholar] [CrossRef]
  10. Plesca, A. Thermal analysis of busbars from a high current power supply system. Energies 2019, 12, 2288. [Google Scholar] [CrossRef]
  11. Kolimas, Ł.; Łapczyński, S.; Szulborski, M. Simulations of electrical parameters in high current busbars. Prz. Elektrotech. 2020, 11, 178–181. [Google Scholar] [CrossRef]
  12. Szulborski, M.; Łapczyński, S.; Kolimas, Ł.; Kozarek, Ł.; Rasolomampionona, D.D. Calculations of electrodynamic forces in three-phase asymmetric busbar system with the use of FEM. Energies 2020, 13, 5477. [Google Scholar] [CrossRef]
  13. Szulborski, M.; Łapczyński, S.; Kolimas, Ł. Thermal analysis of heat distribution in busbars during rated current flow in low-voltage industrial switchgear. Energies 2021, 14, 2427. [Google Scholar] [CrossRef]
  14. Yang, D.; Li, Y.; Han, Y.; Ding, B.; Li, L.; Wu, J. Vibration analysis and experimental study of GIS busbar enclosure under electric field. Shock. Vib. 2022, 2022, 3055139. [Google Scholar]
  15. Aberuee, M.J.; Ahmadikia, H.; Ziaei-Rad, M. The effect of internal plate vibration on the rate of heat transfer in a glass recycling process dryer. Int. J. Therm. Sci. 2020, 156, 106424. [Google Scholar] [CrossRef]
  16. Ono, J.; Unno, N.; Yuki, K.; Taniguchi, J.; Satake, S.-I. Visualization and sound measurements of vibration plate in a boiling bubble resonator. Fluids 2021, 6, 443. [Google Scholar] [CrossRef]
  17. Akcay, S.; Akdag, U. Mixed convection heat transfer from a vertical flat plate subjected to periodic oscillations. J. Ther. Eng. 2021, 7, 1377–1391. [Google Scholar] [CrossRef]
  18. Hou, S.; Zhang, X.; Liu, J.; Fan, S.; Zhang, Y.; Li, M. Impact of vibration on heat transfer and flow properties of heat exchange surfaces. Numer. Heat Transf. A Appl. 2022, 1–21. [Google Scholar] [CrossRef]
  19. Rasangika, A.H.D.K.; Nasif, M.S.; Pao, W.; Al-Waked, R. Numerical investigation of the effect of square and sinusoidal waves vibration parameters on heat sink forced convective heat transfer enhancement. Appl. Sci. 2022, 12, 4911. [Google Scholar] [CrossRef]
  20. Hu, J.; Min, C.; Yang, X.; Wang, K.; Xie, L. Numerical and experimental study on heat transfer characteristics of single vibrating blade in a channel flow. J. Therm. Sci. 2023, 32, 982–992. [Google Scholar] [CrossRef]
  21. Park, K.T.; Lee, J.W.; Lee, M.G.; Kim, H.J.; Kim, D.-K. Nusselt number correlation for vibration-assisted convection from vertically oriented plate fins. Int. J. Heat Mass Transf. 2014, 78, 522–526. [Google Scholar] [CrossRef]
  22. Klimenta, D.O.; Perović, B.D.; Jevtić, M.D.; Radosavljević, J.N. An analytical algorithm to determine allowable ampacities of horizontally installed rectangular bus bars. Therm. Sci. 2016, 20, 717–730. [Google Scholar] [CrossRef]
  23. COMSOL AB. Heat Transfer Module User’s Guide, Version 4.3; COMSOL AB: Stockholm, Sweden, 2012. [Google Scholar]
  24. NDT Supply. com. Conductivity and Resistivity Values for Aluminum & Alloys; NDT Supply.com, Inc.: Lenexa, KS, USA, 2002. [Google Scholar]
  25. IEEE Std 605TM-2008; IEEE Guide for Bus Design in Air Insulated Substations. (Revision of IEEE Std 605-1998/Incorporates IEEE Std 605-2010/Amendment 1); IEEE: New York, NY, USA, 2010.
  26. Incropera, F.P.; Dewitt, D.P.; Bergman, T.L.; Lavine, A.S. Fundamentals of Heat and Mass Transfer, 6th ed.; John Wiley & Sons, Inc.: Hoboken, NJ, USA, 2007; pp. 401–484. [Google Scholar]
  27. Lienhard, J.H., IV; Lienhard, J.H., V. A Heat Transfer Handbook, 5th ed.; Phlogiston Press: Cambridge, MA, USA, 2020; pp. 269–535. [Google Scholar]
  28. Holman, J.P. Heat Transfer, 8th ed.; McGraw-Hill Book Co: Singapore, 1999; pp. 336–393. [Google Scholar]
  29. Salort, J.; Liot, O.; Rusaouen, E.; Seychelles, F.; Tisserand, J.-C.; Creyssels, M.; Castaing, B.; Chillà, F. Thermal boundary layer near roughnesses in turbulent Rayleigh-Bénard convection: Flow structure and multistability. Phys. Fluids 2014, 26, 015112. [Google Scholar] [CrossRef]
  30. Šućurović, M.; Klimenta, D.; Raičević, N.; Perović, B. The Effect of Aging of Surface Non-Metallic Coatings on the Ampacity of Medium Voltage Rectangular Bus Bars. In Proceedings of the 7th Virtual International Conference on Science, Technology and Management in Energy–eNergetics 2021, Belgrade, Serbia, 16–17 December 2021. [Google Scholar]
  31. Klimenta, D.; Minić, D.; Pantić-Ranđelović, L.; Radonjić-Mitić, I.; Premović-Zečević, M. Modeling of steady-state heat transfer through various photovoltaic floor laminates. Appl. Therm. Eng. 2023, 229, 120589. [Google Scholar] [CrossRef]
  32. Eid, E.I.; Gomaa, M.E. Influence of vibration in enhancement of heat transfer rates from thin plannar fins. Heat Mass Transf. 2009, 45, 713–726. [Google Scholar] [CrossRef]
Disclaimer/Publisher’s Note: The statements, opinions, and data contained in all publications are solely those of the individual author(s) and contributor(s) and not of MDPI and/or the editor(s). MDPI and/or the editor(s) disclaim responsibility for any injury to people or property resulting from any ideas, methods, instructions, or products referred to in the content.
Figure 1. Three-dimensional representation of heat transfer in and around rectangular bus bars installed horizontally in an indoor environment: (a) A stationary bus bar installed with a vertical major axis; (b) A vibrating bus bar installed with a vertical major axis; (c) A stationary bus bar installed with a horizontal major axis; (d) A vibrating bus bar installed with a horizontal major axis.
Applsci 13 06745 g001
Figure 2. Normalized Nusselt number versus velocity ratio generated for different vibration amplitudes at natural frequencies of 50, 29, 59, and 40 Hz. The discrete representations correspond to the plate fins considered in [21] assuming that their top and bottom surfaces are adiabatic. The continuous representation, i.e., Equation (10), refers to the rectangular bus bars considered here assuming that their top and bottom surfaces are non-adiabatic.
Applsci 13 06745 g002
Figure 3. Temperature distribution over (a) the meshed part of a two-dimensional representation of the rectangular bus bar 0.0004 m × 0.025 m, obtained for vibration amplitudes of (b) X = 0 mm, (c) X = 1 mm, (d) X = 1.6 mm, and (e) X = 3 mm at a vibration frequency of 29 Hz.
Applsci 13 06745 g003
Figure 4. Volume power of heat sources as a function of vibration amplitude at a vibration frequency of 120 Hz for different rectangular bus bars: (a) Bus bars installed horizontally with a vertical major axis; (b) Bus bars installed horizontally with a horizontal major axis.
Applsci 13 06745 g004
Figure 5. Normalized Nusselt number as a function of velocity ratio for different rectangular bus bars and different vibration amplitudes at a vibration frequency of 120 Hz: (a) Bus bars installed horizontally with a vertical major axis; (b) Bus bars installed horizontally with a horizontal major axis.
Applsci 13 06745 g005
Figure 6. Heat transfer coefficient due to convection from the side surfaces of different rectangular bus bars as a function of vibration amplitude at a vibration frequency of 120 Hz: (a) Bus bars installed horizontally with a vertical major axis; (b) Bus bars installed horizontally with a horizontal major axis.
Applsci 13 06745 g006
Figure 7. Heat transfer coefficient due to convection from the top surfaces of different rectangular bus bars as a function of vibration amplitude at a vibration frequency of 120 Hz: (a) Bus bars installed horizontally with a vertical major axis; (b) Bus bars installed horizontally with a horizontal major axis.
Applsci 13 06745 g007
Figure 8. Heat transfer coefficient due to convection from the bottom surfaces of different rectangular bus bars as a function of vibration amplitude at a vibration frequency of 120 Hz: (a) Bus bars installed horizontally with a vertical major axis; (b) Bus bars installed horizontally with a horizontal major axis.
Applsci 13 06745 g008
Figure 9. Volume power of heat sources as a function of vibration frequency at a vibration amplitude of 3 mm for different rectangular bus bars: (a) Bus bars installed horizontally with a vertical major axis; (b) Bus bars installed horizontally with a horizontal major axis.
Applsci 13 06745 g009
Figure 10. Normalized Nusselt number as a function of velocity ratio for different rectangular bus bars and different vibration frequencies at a vibration amplitude of 3 mm: (a) Bus bars installed horizontally with a vertical major axis; (b) Bus bars installed horizontally with a horizontal major axis.
Applsci 13 06745 g010
Figure 11. Heat transfer coefficient due to convection from the side surfaces of different rectangular bus bars as a function of vibration frequency at a vibration amplitude of 3 mm: (a) Bus bars installed horizontally with a vertical major axis; (b) Bus bars installed horizontally with a horizontal major axis.
Applsci 13 06745 g011
Figure 12. Heat transfer coefficient due to convection from the top surfaces of different rectangular bus bars as a function of vibration frequency at a vibration amplitude of 3 mm: (a) Bus bars installed horizontally with a vertical major axis; (b) Bus bars installed horizontally with a horizontal major axis.
Applsci 13 06745 g012
Figure 13. Heat transfer coefficient due to convection from the bottom surfaces of different rectangular bus bars as a function of vibration frequency at a vibration amplitude of 3 mm: (a) Bus bars installed horizontally with a vertical major axis; (b) Bus bars installed horizontally with a horizontal major axis.
Applsci 13 06745 g013
Table 1. Thermal and electrical properties of the materials used.
Aluminum Alloy k t (W·m−1·K−1) ρ e 20 (Ω·m) α ρ (K−1)
5052-O138.04.930 ×·10−80.00383
6101-T61218.52.998 × 10−80.00383
Table 2. Bus bar ampacity as a function of vibration amplitude at different natural frequencies a.
WH f V I c p for
X = 0 m
I c p for
X = 8.541 μm
I c p for
X = 1 mm
I c p for
X = 1.6 mm
I c p for
X = 3 mm
I c p for
X = 4 mm
I c p for
X = 5 mm
BUSBAR bBUSBAR bBUSBAR bBUSBAR bBUSBAR bBUSBAR bBUSBAR b
mmHzAAAAAAA
Bus bars installed horizontally with a vertical major axis and adiabatic top and bottom surfaces
0.00040.025044.044.147.148.852.655.257.6
0.00040.0252953.553.555.556.759.261.062.8
0.00050.025949.349.353.255.560.463.766.8
0.00050.0254059.959.962.964.668.571.273.7
Bus bars installed horizontally with a vertical major axis and non-adiabatic top and bottom surfaces
0.00040.025044.344.447.449.152.955.457.8
0.00040.0252953.953.955.857.059.561.363.0
0.00050.025949.749.753.655.960.764.067.1
0.00050.0254060.360.363.365.068.971.674.1
a For aluminum alloy 5052-O bus bars, k s = 1 , T a = 40 °C, T cp = 70 °C, ε = 0.35 , α = 0 , and f = 60 Hz. b Values calculated using the updated version of the BUSBAR.m program.
Table 3. Details on the FE meshes generated within the two-dimensional domain in Figure 3a and results of the corresponding mesh independence tests performed for the case of rectangular bus bar 0.0004 m × 0.025 m and vibration class B.
FE MeshNumber of NodesNumber of Elements( T s T a ) (°C) a( T s T a ) (°C) b( T s T s ) (°C) c
Automatically generated
(Figure 3a)
939230.00415330.00.004153
Generated after the first refinement27736830.00416430.00.004164
Generated after the second refinement921147230.00416430.00.004164
a Values of the temperature difference ( T s T a ) obtained for different densities of the FE mesh using COMSOL 4.3, where T s stands for the maximum value of the bus bar temperature. b The reference value of the temperature difference ( T s T a ) taken from the experiments performed in [21]. c Differences between the simulated and measured values of the bus bar temperature obtained as ( T s T s ) = ( T s T a ) ( T s T a ) .
Table 4. Bus bar ampacity as a function of vibration amplitude at a vibration frequency of 120 Hz for bus bars in an indoor environment.
WH 60   Hz   k s at 70 °C I c p for
X = 0 m
I c p for
X = 8.541 μm
I c p for
X = 1 mm
I c p for
X = 1.6 mm
I c p for
X = 3 mm
I c p for
X = 4 mm
I c p for
X = 5 mm
BUSBAR cBUSBAR dBUSBAR dBUSBAR dBUSBAR dBUSBAR dBUSBAR d
mmAAAAAAA
Bus bars installed horizontally with a vertical major axis
0.0004 a0.021.00044.344.451.355.062.968.072.7
0.0004 a0.0251.00053.953.961.665.774.680.485.8
0.0005 a0.021.00049.749.857.461.670.476.181.3
0.0005 a0.0251.00060.360.468.973.683.590.096.0
0.00635 b0.05081.014544.9545.4595.5623.8687.1730.0770.3
0.00635 b0.15241.0921365.81366.51443.51488.21589.51659.31726.2
0.009525 b0.10161.1001182.31183.01261.71307.01410.41481.61549.2
0.009525 b0.20321.2102073.72074.62173.92231.82365.12457.72546.8
0.0127 b0.10161.1401359.61360.31448.51499.31616.61697.61774.7
0.0127 b0.20321.2592366.72367.72479.22544.32695.52800.92902.2
Bus bars installed horizontally with a horizontal major axis
0.02 a0.00041.00039.339.339.840.142.043.845.5
0.025 a0.00041.00048.148.148.648.951.253.355.3
0.02 a0.00051.00044.144.144.845.247.549.651.6
0.025 a0.00051.00053.953.954.655.057.860.262.5
0.0508 b0.006351.014517.8518.1544.5559.8608.2643.7678.8
0.1524 b0.006351.0921286.61286.81316.91334.71421.71485.91562.5
0.1016 b0.0095251.1001121.11121.51161.41184.91273.31338.21409.0
0.2032 b0.0095251.2101992.11992.52033.72058.22184.82277.32364.0
0.1016 b0.01271.1401294.71295.11344.51373.51478.11554.31636.9
0.2032 b0.01271.2592278.72279.12330.42360.82509.12616.92718.1
a For aluminum alloy 5052-O bus bars, T a = 40 °C, T cp = 70 °C, ε = 0.35 , α = 0 , and f = 60 Hz. b For aluminum alloy 6101-T61 bus bars, T a = 40 °C, T cp = 70 °C, ε = 0.35 , α = 0 , and f = 60 Hz. c Values obtained for instance of free convection heat transfer (i.e., for v V = 0 m·s−1) by means of the updated version of the BUSBAR.m program. d Values obtained for instance of vibration-assisted convection heat transfer (i.e., for v V = f V X ) by means of the updated version of the BUSBAR.m program.
Table 5. Bus bar ampacity as a function of vibration frequency at a vibration amplitude of 3 mm for bus bars in an indoor environment.
WH 60   Hz   k s at
70 °C
I c p for f v = 0 Hz I c p for f v = 2.75 Hz I c p for
f v = 11.09 Hz
I c p for
f v = 29 Hz
I c p for
f v = 120 Hz
I c p for
f v   = 240 Hz
I c p for
f v   = 360 Hz
BUSBAR cBUSBAR dBUSBAR dBUSBAR dBUSBAR dBUSBAR dBUSBAR d
mmAAAAAAA
Bus bars installed horizontally with a vertical major axis
0.0004 a0.021.00044.344.946.449.562.977.189.2
0.0004 a0.0251.00053.954.456.159.574.690.8104.6
0.0005 a0.021.00049.750.351.955.470.486.399.8
0.0005 a0.0251.00060.360.962.866.783.5101.6117.0
0.00635 b0.05081.014544.9548.5559.4582.0687.1809.5918.7
0.00635 b0.15241.0921365.81371.31387.81422.61589.51791.61977.0
0.009525 b0.10161.1001182.31187.91204.81240.41410.41616.11803.9
0.009525 b0.20321.2102073.72080.82102.02146.82365.12635.12886.1
0.0127 b0.10161.1401359.61365.91384.81424.61616.61851.92067.8
0.0127 b0.20321.2592366.72374.62398.42448.82695.53003.83291.7
Bus bars installed horizontally with a horizontal major axis
0.02 a0.00041.00039.339.339.439.742.048.155.0
0.025 a0.00041.00048.148.148.248.451.258.566.8
0.02 a0.00051.00044.144.244.344.647.554.662.5
0.025 a0.00051.00053.954.054.154.457.866.275.7
0.0508 b0.006351.014517.8519.7525.3537.3608.2720.1828.5
0.1524 b0.006351.0921286.61288.71295.11308.61421.71648.51873.7
0.1016 b0.0095251.1001121.11124.01132.51150.51273.31489.61701.2
0.2032 b0.0095251.2101992.11995.02003.72022.32184.82490.72823.2
0.1016 b0.01271.1401294.71298.11308.71331.01478.11730.11975.3
0.2032 b0.01271.2592278.72282.32293.12316.32509.12863.63245.9
a For aluminum alloy 5052-O bus bars, T a = 40 °C, T cp = 70 °C, ε = 0.35 , α = 0 , and f = 60 Hz. b For aluminum alloy 6101-T61 bus bars, T a = 40 °C, T cp = 70 °C, ε = 0.35 , α = 0 , and f = 60 Hz. c Values obtained for instance of free convection heat transfer (i.e., for v V = 0 m·s−1) by means of the updated version of the BUSBAR.m program. d Values obtained for instance of vibration-assisted convection heat transfer (i.e., for v V = f V X ) by means of the updated version of the BUSBAR.m program.
Disclaimer/Publisher’s Note: The statements, opinions and data contained in all publications are solely those of the individual author(s) and contributor(s) and not of MDPI and/or the editor(s). MDPI and/or the editor(s) disclaim responsibility for any injury to people or property resulting from any ideas, methods, instructions or products referred to in the content.

