Article

Object-Oriented Remote Sensing Image Change Detection Based on Color Co-Occurrence Matrix

1
School of Geographical Sciences, Southwest University, Chongqing 400715, China
2
Center for Geospatial Information, Shenzhen Institutes of Advanced Technology, Chinese Academy of Sciences, Shenzhen 518055, China
3
Key Laboratory of Eco-Environments in Three Gorges Reservoir Region (Ministry of Education), Chongqing 400715, China
4
Shenzhen Engineering Laboratory of Ocean Environmental Big Data Analysis and Application, Shenzhen 518055, China
*
Author to whom correspondence should be addressed.
These authors contributed equally to this work.
Appl. Sci. 2023, 13(11), 6748; https://doi.org/10.3390/app13116748
Submission received: 4 May 2023 / Revised: 22 May 2023 / Accepted: 30 May 2023 / Published: 1 June 2023
(This article belongs to the Special Issue Novel Approaches for Remote Sensing Image Processing)

Abstract

:

Featured Application

Change detection for remote sensing images.

Abstract

Aiming at the problem of misdetection caused by the traditional texture characteristic extraction model, which does not describe the correlation among multiple bands, an object-oriented remote sensing image change detection method based on a color co-occurrence matrix is proposed. First, the image is divided into multi-scale objects by graph-based superpixel segmentation, and the optimal scale is determined by the overall goodness F-measure (OGF). Then, except for the extraction of the spectral features, the multi-channel texture features based on the color co-occurrence matrix (CCM) are extracted to consider the correlation among multiple bands. To accurately find the representative features to overcome the impact of feature redundancy, a cumulative backward search strategy (CBSS) is further designed. Finally, the change detection is completed by inputting the difference image of dual time points to the trained random forest model. Taking Shenzhen and Dapeng as the study areas, with Sentinel-2 and Skysat images under different spatial resolutions, and the forest–bareland change type as an example, the effectiveness of the proposed algorithm is verified by qualitative and quantitative analyses. They show that the proposed algorithm can obtain higher detection accuracy than the texture features without band correlation.

1. Introduction

With the development of society and the economy, the depth and breadth of human utilization of land resources have been greatly improved, leading to a significant increase in the frequency of land changes [1,2,3]. Accurately acquiring information about land changes is of great significance for understanding the relationship between humans and nature and for promoting sustainable development of the social economy and ecological environment, such as deforestation, forest fires, and landslide disaster monitoring [4,5]. Remote sensing technology can achieve large area observations in a short time and has become one of the most important means to extract the change information of land [6,7,8]. However, with the development of spatial resolution of remote sensing sensors, the geometric and texture information is prominent. Although it provides rich information for change detection, it still faces new challenges due to the serious phenomenon of “same object, different spectrum” and “foreign object, same spectrum” [9,10,11].
The change detection methods include two main categories: detection after classification and detection before classification [12]. In the first one, the accuracy of detection depends on the classification result, and errors can accumulate and propagate. In addition, the computing efficiency of change detection will be affected by the classification operation when the image size is too large. The other one detects the changing area according to its characteristics, which can enable the detection of the targeted areas and improve efficiency. It includes the difference method, ratio method, change vector analysis (CVA), and model-based methods [13,14,15]. The difference and ratio methods are usually used for the single-band images, and CVA can be regarded as a multi-band extension of the difference method. However, they have some common problems; for example, the threshold is difficult to determine, and using only the threshold as the judgment criterion will inevitably lead to error detection. Model-based methods train the detection model according to the samples, which can continually optimize the model parameters and obtain the optimal change detection result. Thus, model-based methods have become the widely used methods, wherein the most popular models are deep learning and random forest. For example, Lv et al. [16] proposed a spatial–spectral attention network to inhibit the pseudo-change noise, preserve the shape of the changed areas, and improve the change detection accuracy. However, deep learning often requires a large number of samples to train the model well, and it has poor transferability. In the case of small samples in specific areas, the random forest is also considered to be a good tool [17].
From another perspective, change detection methods can be divided into two types according to the basic units of operation: pixel-based and object-oriented. Traditional pixel-based algorithms take a single pixel as the basic unit, which can easily cause a “salt and pepper” phenomenon in the detection results due to the absence of context information [18,19]. Object-oriented algorithms take a homogeneous region as the basic unit. The homogeneous region is composed of a group of connected pixels with the same characteristics, and its shape can be irregular. This special characteristic makes it possible to describe spatial relevance information, which can improve the “salt and pepper” phenomenon [20,21]. Ma et al. [22] demonstrated that object-oriented methods are more accurate than pixel-based methods by testing four common unsupervised change detection methods on the basis of the spectral information. Lv et al. [23] proposed the object-oriented sorted-histogram comparison methods, which achieved satisfactory results. The characteristics that are extracted based on objects possess a higher-level description of the image [24]. False detection and missing detection can easily occur when relying only on spectral features for change detection. It is an inevitable trend to introduce deep features, such as texture characteristics [25].
There are two classical texture feature extraction methods: local binary pattern (LBP) [26] and gray level co-occurrence matrix (GLCM) [27]. LBP describes the texture by using the relationship between the central pixel and the adjacent pixel in the local neighborhood. For example, Lei et al. [28] combined LBP and speeded-up robust features (SURF) based on the fixed-size objects to complete the change detection of Google Earth images. The traditional LBP is too simple and has poor noise resistance. With this development, a series of improved LBP-based texture extraction algorithms are proposed, such as binary rotation-invariant and noise-tolerant (BRINT) [29], Locally Encoded TRansform feature hISTogram (LETRIST) [30], local directional zigzag pattern (LDZP) [31], and overlapped multi-oriented tri-scale local binary pattern (OMTLBP) [32]. They combine the mean method, scale method, and histogram method to increase the noise resistance, breadth, and wholeness of the feature description. LBP can obtain the local texture information, but it is difficult to capture the overall information of an image [33]. GLCM describes the texture through the joint conditional probability among image gray levels. It can not only take into account the overall situation of the image but also describe the texture information in multiple directions by extracting different statistics. For example, Li et al. [34] proposed a change-detection method based on spectral and GLCM texture features, which can significantly increase the robustness of noise and spectral similarity. However, the traditional texture feature extraction methods can extract information only from single-band images. For multispectral remote sensing images with multiple bands, the bands must be treated as independent, which will lose some information hidden among the bands that could be used to distinguish changing areas. Thus, the description of texture features among bands is also important and cannot be ignored.
To solve the above problems, the object-oriented remote sensing image change detection method based on a color co-occurrence matrix is proposed in this paper. The color co-occurrence matrix (CCM) [35] is an extension of the GLCM, which can describe the texture features not only within the band but also among the bands. First, the band combination of the remote sensing images of two periods is implemented to ensure the spatial consistency of the objects, where the multi-scale objects are generated on the basis of the graph-based superpixel segmentation method and the fractal net evolution approach (FNEA). Second, to obtain the optimal scale to establish the optimal objects, the overall goodness F-measure (OGF) index was used to evaluate the quality of the superpixels. Then, after extracting the spectral features of the object, the texture statistical variables, including band correlation, are extracted on the basis of the CCM. To accurately find representative features to overcome the Hughes phenomenon, where too many features lead to information redundancy and affect the detection accuracy, a cumulative backward search strategy (CBSS) is further designed on the basis of the ranking of the importance of the features. The main idea of the CBSS is to remove the features with the lowest contribution in turn until the number of features reaches the minimum set value. The sorting standard is the cumulative value of the importance of features obtained through multiple rounds of training. The combination with the smallest feature number and the highest accuracy is regarded as the best feature combination. Finally, change detection results are obtained by putting the differential image of selected features into the random forest model. The main contributions of this paper are summarized as follows:
(1)
The proposed approach abandons the traditional method of describing the texture features in multi-channel images, which involves separately extracting texture features from single-band gray images and then concatenating them to describe multi-channel texture features. The CCM is innovatively used to establish inter-channel correlation and directly extract color texture features from multi-channel images for change detection.
(2)
The cumulative backward search strategy (CBSS) is proposed to eliminate the impact of instability in feature sorting under the one-time training on feature selection, which is beneficial for finding more representative and effective feature subsets.
In this study, Shenzhen and Dapeng are selected as the research areas, and Sentinel-2 and Skysat images constitute the research data. Considering that forest protection and bareland supervision are the focus of attention in Shenzhen, the forest–bareland change type is selected as an example to verify the effectiveness of the proposed method. The remainder of this manuscript proceeds as follows: Section 2 introduces each aspect of the proposed algorithm, Section 3 provides the experimental results and discussion, and Section 4 presents the conclusion and prospect.

2. Methods

In this paper, on the basis of object orientation, change detection is carried out under the framework of a random forest based on the color co-occurrence matrix model. The overall process is shown in Figure 1. It includes four main steps:
(a)
Optimal object construction based on multi-scale segmentation: In order to ensure the spatial consistency of the two periods of remote sensing images, band combination is carried out. On the basis of over-segmentation based on graph-based superpixel segmentation, the FNEA algorithm is utilized to establish multi-scale objects, and then the optimal segmentation scale is determined according to the maximum criterion of OGF to obtain the optimal object.
(b)
Multi-feature extraction based on object: There are two types of features: spectral features and texture features. Spectral features include the mean and variance of bands, and texture features are extracted by CCM on the basis of a pairwise combination of bands, including 8 directions and 4 statistical variables, i.e., angular second moment (ASM), contrast (Con), correlation (Cor), and inverse different moment (IDM).
(c)
Feature filtering based on CBSS: On the basis of the random forest model, the contribution degree of characteristics of one-time training is estimated. The cumulative value of the contribution degrees obtained from multiple rounds of training is considered as a standard to delete the least important feature in turn until the given minimum number of features is reached. Then, the feature combination with the highest accuracy and the smallest number of features is selected as the optimal feature combination.
(d)
Object-oriented change detection based on the random forest: The differential image based on the optimal feature vector set after screening is incorporated into the random forest model for change detection, and the detection results are evaluated qualitatively and quantitatively.

2.1. Optimal Object Construction Based on Multi-Scale Segmentation

Due to the diversity of the surface object types and the complexity of the spatial distribution in remote sensing images, different regions also require different segmentation scales [36]. In order to obtain the optimal segmentation scale, the remote sensing image is first over-segmented into a series of smaller superpixels on the basis of the graph theory segmentation method, and then the adjacent superpixel blocks are merged on the basis of the FNEA algorithm to obtain the different scales of superpixel segmentation results, and the optimal segmentation scale is determined by OGF index to obtain the best object.
The main idea of superpixel segmentation based on graph theory is to map the image into a weighted undirected graph G = (V, E), in which the set of vertexes V is composed of pixels of the image, and set of edges E corresponds to the adjacent relationship between pixels. Each edge has a corresponding weight w, which is the dissimilarity between neighboring elements. The pixels are merged according to the criteria, and then the superpixels are formed [37]. The merger guidelines are as follows:
D i f f ( C 1 , C 2 ) M i n t ( C 1 , C 2 )
M i n t ( C 1 , C 2 ) = min { I n t ( C 1 ) + τ ( C 1 ) , I n t ( C 2 ) + τ ( C 2 ) }
where Diff (C1, C2) is the difference between regions C1 and C2, which is defined as the minimum weight edge connecting the two components. Int(C) is the internal difference of the regions C, and it is defined as the largest weight in the minimum spanning tree of the component. τ(C) = B/|C| is the threshold function to regulate the extreme case where both regions contain only one pixel; B is a constant parameter, and |C| is the size of component C.
FNEA is one of the most widely used methods of multi-scale segmentation, which has been commercially applied in eCognition software. Its principle is to form different scales by merging connected superpixels [38,39]. The merge cost function is:
f = w c o l o r h c o l o r + ( 1 w c o l o r ) h s h a p e
where  h c o l o r  and  h s h a p e  are the costs of spectral heterogeneity and shape heterogeneity after the merger, respectively, and  w c o l o r  is the weight of spectral heterogeneity. Spectral heterogeneity  h c o l o r  is defined as:
h c o l o r = c w c [ n o b j 3 σ c o b j 3 ( n o b j 1 σ c o b j 1 + n o b j 3 σ c o b j 2 ) ]
where  o b j 3  is the superpixel after merging  o b j 1  and  o b j 2 c  is the band index,  w c  is the band weight,  σ  is the standard deviation, and  n  is the number of pixels.
Shape heterogeneity  h s h a p e  is defined as:
h s h a p e = w c o m p t h c o m p t + ( 1 w c o m p t ) h s m o o t h
where  w c o m p t  is the compactness weight. Assuming that the circumference of the superpixel is represented by l, the compactness  h c o m p t  and edge smoothness  h s m o o t h  are:
h c o m p t = n o b j 3 l o b j 3 n o b j 3 n o b j 1 l o b j 1 n o b j 1 + n o b j 2 l o b j 2 n o b j 2
h s m o o t h = n o b j 3 l o b j 3 b o b j 3 n o b j 1 l o b j 1 b o b j 1 + n o b j 2 l o b j 2 b o b j 2
where  b  is the perimeter of the object’s bounding box.
In order to determine the optimal segmentation scale among many scales, the segmentation results are evaluated on the basis of the OGF maximization criteria:
O G F = ( 1 + α 2 ) M I n o r m × L V n o r m α 2 × M I n o r m + L V n o r m
where  M I n o r m  and  L V n o r m  are the results after the normalization of the weighted variance  L V  of the segmentation object and Global Moran’s I index  M I  (for detailed information, please see reference [40]).  α  controls its relative weight, where  α > 1  indicates higher weights of  L V n o r m , and finer results are preferred, and  α < 1  indicates higher weights of  M I n o r m .

2.2. Object-Oriented Multi-Feature Extraction

2.2.1. Spectral Features

The spectrum value is the most direct and basic information of the image; it characterizes the intensity of the target object to electromagnetic wave reflection. In this study, the mean and variance of all pixel spectral features in the optimal segmentation object are selected as the object spectral feature vector.
Given a remote sensing image  I = I i : i = 1 , , n , where  i  is the pixel index and  n  is the number of pixels, we have  I i =   I i c : c = 1 , , h , where  c  is the band index, and  h  is the number of bands. Then, the mean and variance characteristics of object j in  c  band can be expressed as:
μ j c = 1 | Ω j | i Ω j I i c
σ j c 2 = 1 | Ω j | i Ω j ( I i c μ j c ) 2
where  Ω j  represents the total number of pixels in the object j, and iΩj represents the pixels belonging to object j.

2.2.2. Texture Features Based on Color Co-Occurrence Matrix

The remote sensing image is divided into N gray levels, that is I = {Ii*, i = 1, …, n} and Ii* = {Iic*, c = 1, …, h}, where Iic* represents the gray level of pixel i in c band, which satisfies Iic* ∈ {1, …, N}. A color co-occurrence matrix about two bands is established, i.e., CCMcs(e, o, d, θ), where c and s represent the bands; e and o represent gray levels, such that e, o ∈ {1, …, N}; d is the spatial distance of two pixels; and θ is the texture direction. Generally, the value of θ is 4 or 8; when |θ| = 4, we have θ = {0°, 90°, 180°, 270°}, and when |θ| = 8, we have θ = {0°, 45°, 90°, 135°, 180°, 225°, 270°, 315°}. CCMcs(e, o, d, θ) represents the probability of two pixels, which have d distance in the θ direction and gray levels e and o, respectively, i.e.,
CCM c s ( e , o , d , θ ) = Pr I i c = e I i s = o | i i | = d , i i = θ
In particular, when c = s and d = 1, the color co-occurrence matrix degenerates into the traditional gray level co-occurrence matrix. According to the number of bands,  C h 2 + h  co-occurrence matrices can be established. If h = 3, i.e., R, G, B, the six co-occurrence matrices will be CCMRR, CCMGG, CCMBB, CCMRG, CCMRB, and CCMGB.
Taking the 3 × 3 local region as an example, we assume that there are 3 bands and 8 gray levels in the local region, as shown in Figure 2a. The number of pixel pairs of the color co-occurrence matrix about bands R and G with d = 1 and θ = 0 is shown in Figure 2b. In the local region, there are two pairs of pixels that meet the requirements of Iic* = 1, Ii′c* = 1, and |ii′| = 1, ∠ii′ = 0, as shown by the red lines. In fact, the local region can have an irregular shape because the real boundary is constrained by objects, which ensures the homogeneity of the texture feature description.
Based on the CCM, the four statistical variables of the texture features are extracted [27], as shown in Table 1, including angular second moment (ASM), contrast (Con), correlation (Cor), and inverse different moment (IDM). The ASM represents the evenness of the grayscale distribution of the image, Con represents the sharpness, Cor represents the consistency of image texture, and IDM represents the homogeneity of image texture.  P e , o  is the probability value of the occurrence of the element at the position (e, o) in the matrix, and  μ  and  σ  are the mean and variance of the corresponding gray level, respectively. The mean values of the statistical variables in different directions compose the color texture feature set of the object.

2.3. Feature Filtering Based on the Cumulative backward Search Strategy

The random forest (RF) algorithm is an integrated algorithm that takes the decision tree model as the basic classification model. The final result is obtained by establishing multiple decision tree classifiers and voting, or averaging, their predicted values. Compared with a single decision tree, the RF has higher accuracy and stability by using random sampling of samples and features. The RF can solve classification and regression problems and can estimate the importance of features at the same time [41,42].
In order to effectively utilize the characteristic information of changed and unchanged samples and to ensure that the selected features are stable and representative, a cumulative backward search strategy is proposed based on the random forest framework. In the proposed strategy, the traditional way of determining feature ranking by a single search is abandoned [43], and the cumulative value of the feature contributions by multiple searches is regarded as the foundation for sorting the features. This approach can enhance the accuracy of the feature sorting and avoid the impact of randomness and volatility of the model on the sorting results. The details are elucidated as follows, and the flow chart is shown in Figure 3.
First, after determining the changed and unchanged object samples, 70% of the samples are selected as training samples to train the model. The test set, including all the samples and many additional superpixels, is used to evaluate the model training accuracy. The difference images of the spectral and color texture feature sets are input into the random forest, and the importance of each feature of a single training round is estimated. In order to ensure the stability of filtering features, the model is trained many times, and the features are re-sorted according to the cumulative value of the feature importance of each training. On the basis of the spectral features, the least important color texture features are eliminated successively, and a new feature combination is formed and re-input into the random forest for training. The training is stopped once the number of features reaches the minimum given value. Finally, according to the fluctuation of the test accuracy under the condition of multiple feature combinations, the feature combination with fewer features and higher test accuracy is selected as the optimal feature combination.

2.4. Change Detection Based on Random Forest

After the optimal feature combination is obtained, the feature vector of pixels in the image is cleaned, and only the vector information of the optimal feature combination is retained. In this way, the random forest classification model is reconstructed. The final binary classification result is the object-oriented change detection result of the remote sensing images.

3. Experimental Results and Discussion

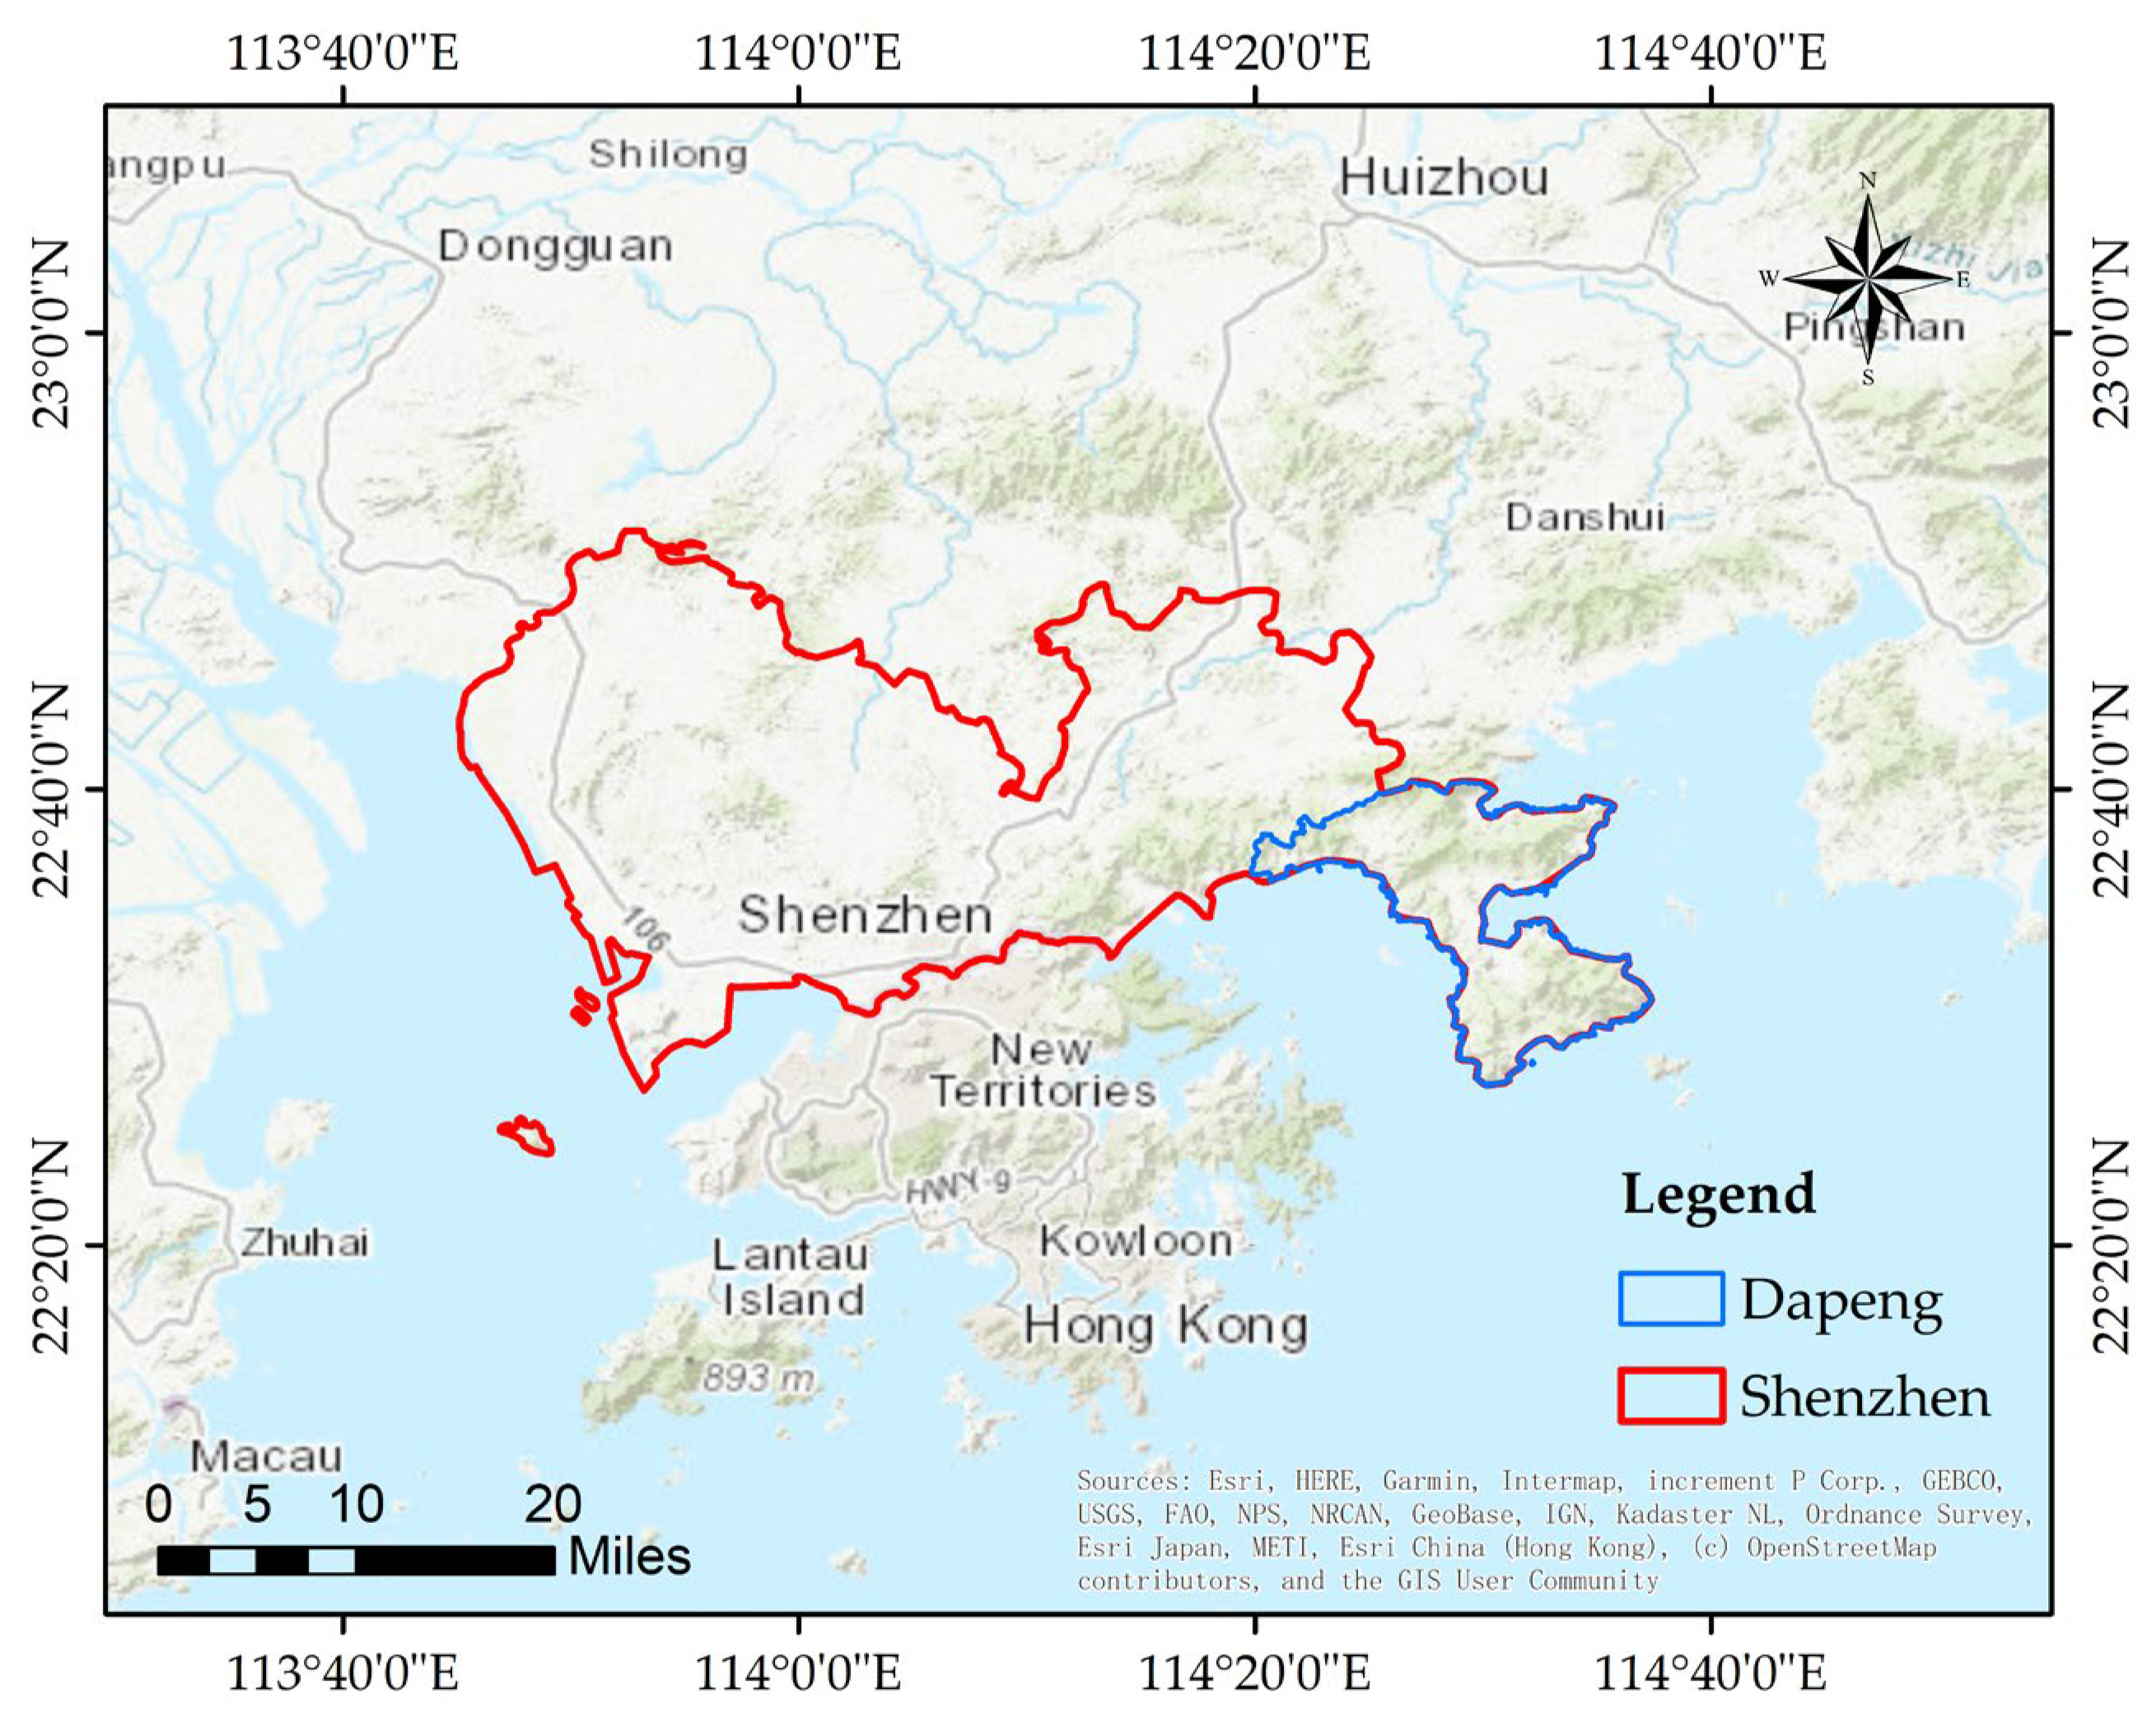
3.1. Study Area and Experimental Data

Shenzhen is located in the southern part of Guangdong Province, between 113°43′ to 114°38′ east longitude and 22°24′ to 22°52′ north latitude, adjacent to Hong Kong, as shown in Figure 4a. It belongs to the subtropical monsoon climate, and the annual rainfall is 1933.3 mm. Shenzhen is the national economic center, scientific and technological innovation center, regional financial center, and trade and logistics center. Dapeng is located in the southeast of Shenzhen, and it is an important node in the Guangdong Hong Kong Macao Greater Bay Area (GBA). In the past 40 years of urbanization, Shenzhen has made remarkable achievements in economic and social aspects. The urbanization rate of Shenzhen has reached 100%; the land possesses high spatial heterogeneity and changes frequently. At the same time, the relevant departments attach great importance to the ecological environment construction in Shenzhen. The forest protection and bareland management have gradually developed into the center of urban supervision. In view of this, we take Shenzhen and Dapeng as the research areas and the forest–bareland change as an example to verify the effectiveness of the proposed algorithm. The locations of the research areas are shown in Figure 4.
Considering that Shenzhen is often cloudy and rainy and the land is fragmented, the Sentinel-2 images of Shenzhen with 10 m resolution in January of winter 2020 and 2021 are selected as the Experimental Data 1. In order to ensure the full coverage of the image, the target image is synthesized by finding the useful image set under a three-month time window centered on January, with a cloud content less than 5%, as shown in Figure 5a1,b1. In order to ensure the consistency of spatial resolution of the data, the R, G, B, and NIR bands are selected in this experiment. In addition, to verify the effectiveness of the proposed method on other datasets of different resolutions, the Skysat images of Dapeng with 1 m resolution and R, G, and B bands during October 2021 and May 2022 are purchased as the Experimental Data 2, as shown in Figure 5a2,b2.

3.2. Determination of the Optimal Segmentation Scale

In remote sensing images, the scale has a very important significance, as different scales reflect different details of ground objects. Selecting the appropriate scale for certain research applications has been one of the hot issues in the field of remote sensing research. In order to determine the optimal scale, the OGF is used as the evaluation criterion. Figure 6 shows the changes in the OGF curve with the increasing scale, where Figure 6a,b represent Sentinel-2 and Skysat images, respectively. It can be seen that the OGF shows a trend of increasing first and then decreasing with the increase of the segmentation scale. For Sentinel-2, the maximum OGF = 0.71 corresponds to a scale of 41. For Skysat, the maximum OGF = 0.67 corresponds to a scale of 268. It also shows that the optimal scale will increase as the resolution increases.
In order to display the results of the optimal segmentation scale more intuitively, the representative regions are intercepted from the study area and are shown in Figure 7 and Figure 8, where Figure 7a1–a3,b1–b3,c1–c3 show the segmentation results of different representative regions of Sentinel-2 images when the segmentation scale is 21, 41, and 61, respectively. Figure 8a1–a3,b1–b3,c1–c3 show different representative regions of Skysat images when the segmentation scale is approximately 100, 300, and 1500, respectively. It can be seen that the smaller scale will lead to over-segmentation, requiring unnecessary calculations and damaging the integrity of the surface, as shown in Figure 7 and Figure 8a1–c1. The larger scale will lead to under-segmentation, and the bareland cannot be segmented from the surrounding vegetation and buildings, as shown in Figure 7 and Figure 8a3–c3. In Figure 7 and Figure 8a2–c2, the segmentation results are more closely in accord with human understanding of the earth’s surface. Whether qualitative or quantitative, this can prove the effectiveness of the OGF index in the selection of the best scale. Thus, 41 and 268 can be regarded as the optimal scales to obtain the optimal objects in the subsequent experiments.

3.3. Optimal Feature Combination Filtering

The features reflect the ground object information of the remote sensing images. Generally speaking, a large number of features can provide rich information, but too many features not only bring redundancy but also affect the accuracy of detection. In this study, all features are filtered through a cumulative backward search strategy, and the importance of the features is calculated through training for all the features. The ranking results of the feature importance in a single training will be slightly different. In this study, after repeating the training many times, the cumulative importance value of each feature is taken for the feature ranking. The experiments show that the cumulative ranking result is almost consistent with the statistical sorting result, which sorts features on the basis of the highest number of occurrences at the location.

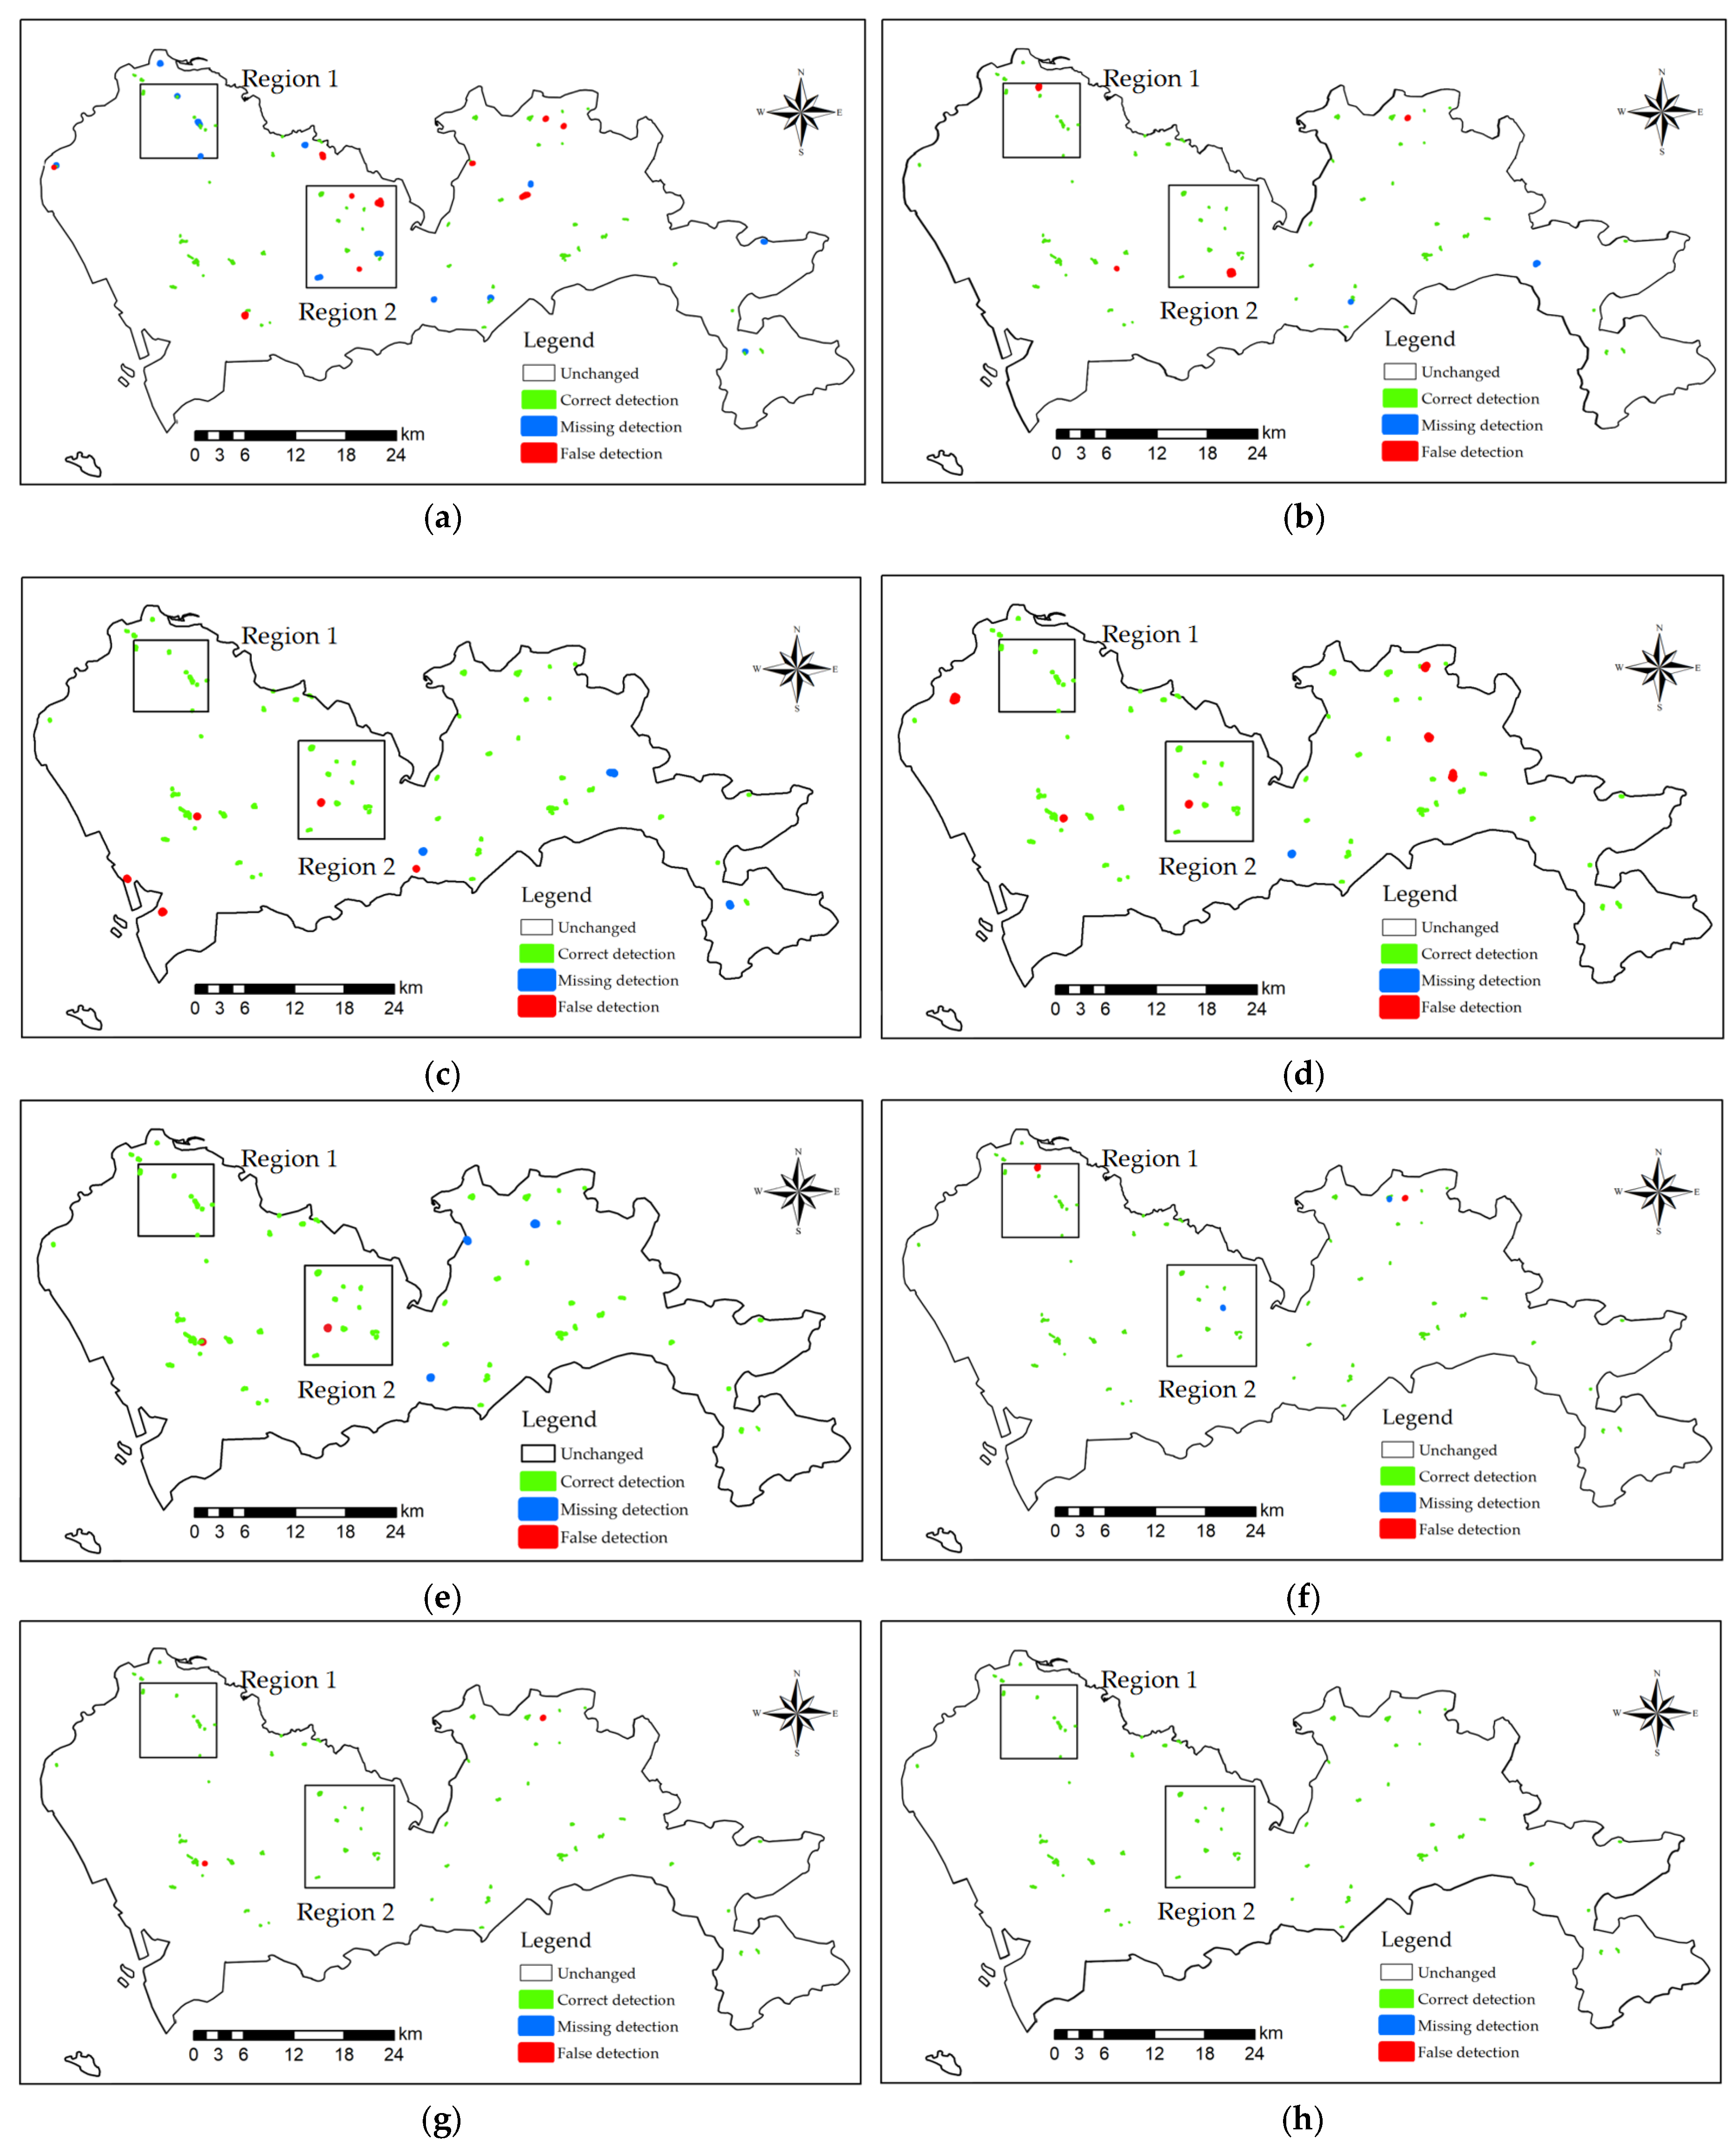
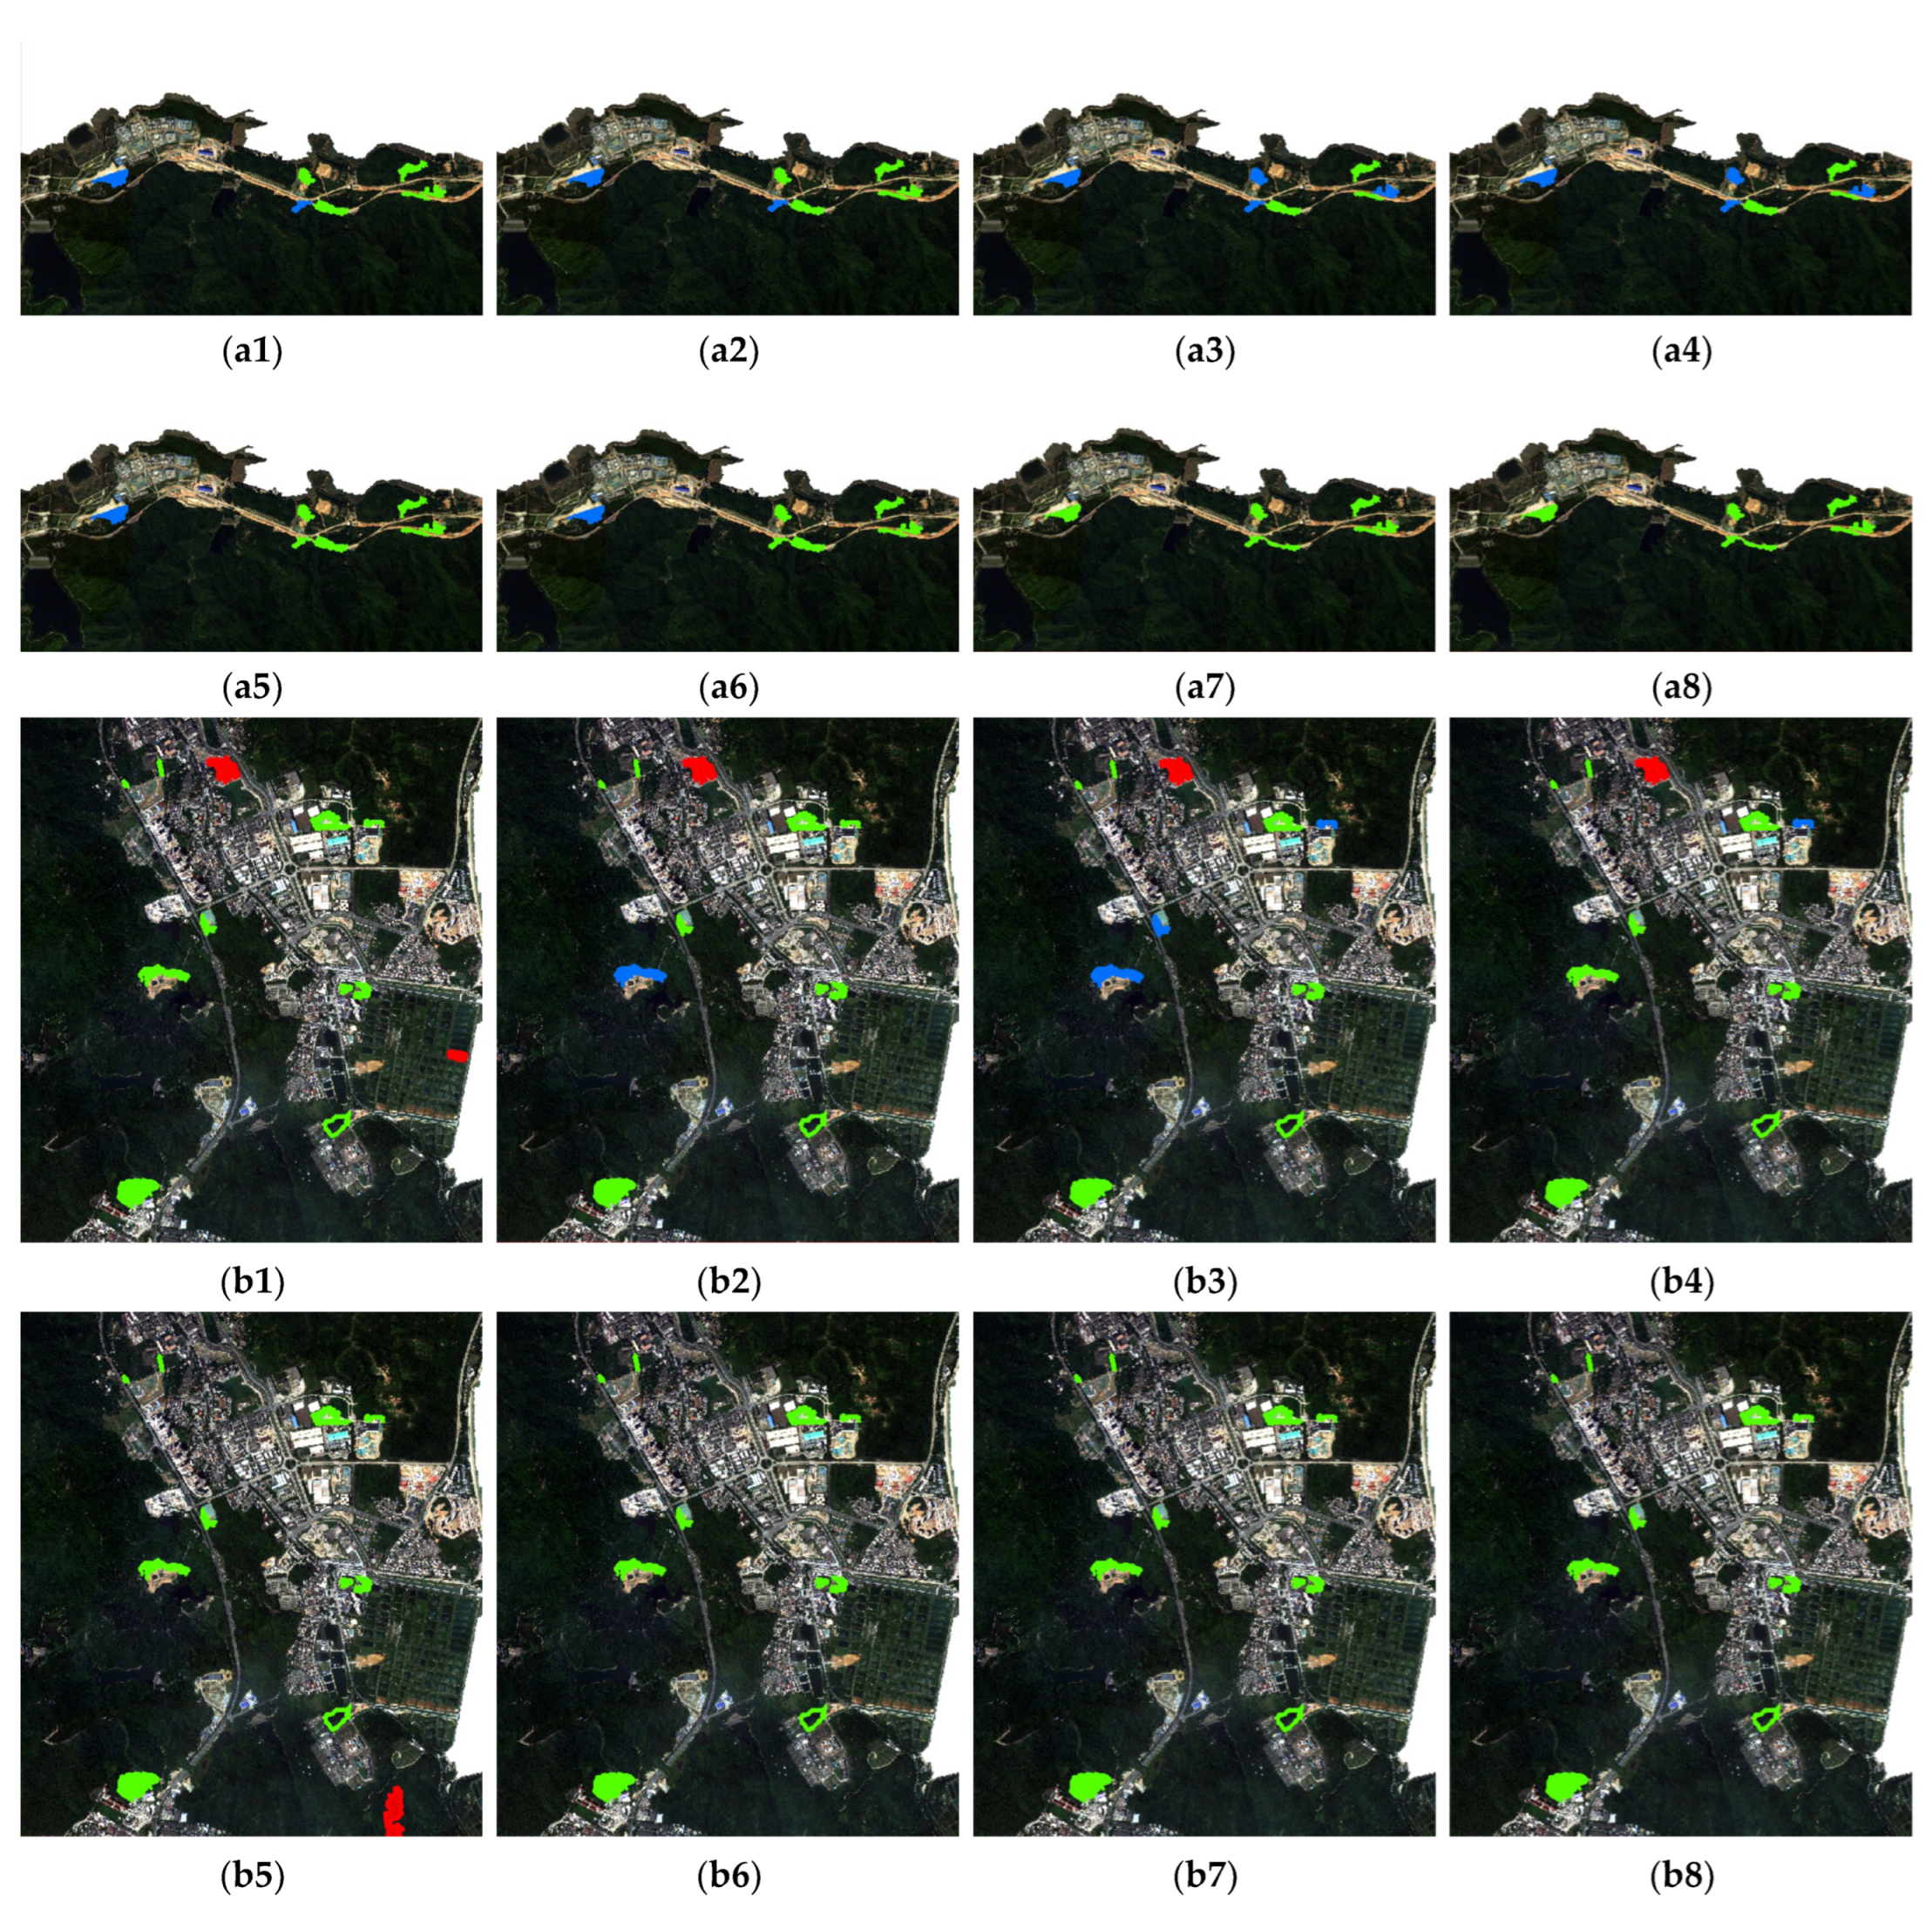
3.4. Object-Oriented Change Detection

To verify the effectiveness of the proposed method, six comparative experiments are designed, as shown in Table 2. In order to ensure the consistency of the experimental environment, all experiments are trained and evaluated on the basis of the random forest model.
(a)
Sentinel-2 data
For the Sentinel-2 images, there are 280 samples, where the number of positive samples is 90. According to the machine learning rules, 70% of the total samples randomly selected are used for training. The test set includes all samples and 50 additional superpixels. If the difference in the number of positive and negative samples in the training data set is too large, the training samples are redetermined until they meet the requirements.
Figure 9 illustrates the change detection results of Sentinel-2, where Figure 9a–g show Comparisons 1–6 and the proposed algorithm, and Figure 9h shows the standard change detection result determined through manual visual interpretation. The white area represents unchanged superpixels, the green area represents the changing area corresponding to the standard, the red area represents false detection, and the blue area represents missing detection. It can be seen that there are many missing and false detections when only the spectral characteristics are considered, as shown in Figure 9a. After adding the texture features extracted by the GLCM and the LBP family, the errors are significantly reduced, as shown in Figure 9b–f. This effectively verifies the benefit of the texture characteristics in remote sensing change detection. The proposed algorithm extracts the texture characteristics on the basis of the CCM by considering the correlation among bands, and it filters the features by the CBSS, which greatly reduces the rate of missing and false detection. There are almost no red or blue regions, as shown in Figure 9g.
Figure 10 illustrates the enlarged images of the change detection results in the different areas that were indicated in Figure 9. Figure 10a1–a8 show the spectral-based, GLCM, LETRIST, LDZP, OMTLBP, and GLCM-SBS methods as well as the proposed algorithm and the standard of Area 1; Figure 10b1–b8 shows the corresponding images of Area 2. Through an analysis of a large number of areas, it is found that the spectral-based method can detect only the changing area that completed the change, and the spectrum is absolutely homogeneous. Among the four texture feature extraction algorithms, the traditional GLCM is inferior to the improved LBP family, and the LBP family has some missing detection on the absolute change area. The LETRIST, LDZP, and OMTLBP methods have similar detection results regarding anti-interference, but the proposed method is the most similar to the standard results, as shown in Figure 10a7,a8,b7,b8.
In order to verify quantitatively the effectiveness of the proposed method, the missed detection rate, false detection rate, overall accuracy rate, and Kappa coefficient are calculated, the results of which are listed in Table 3; this is accomplished by counting the number of correctly detected superpixel blocks. It can be seen that the accuracy of Comparison 1 is the lowest—the missed detection rate is 48.15%, the error detection rate is 39.13%, and the overall accuracy is only 60%. The addition of textures achieves an accuracy of greater than 90%. Among them, the error of GLCM is larger, and its false detection rate is 9.09%. The LETRIST method tends to false detection, as the false detection rate is much larger than the missing detection rate, and the results of the LDZP are just the opposite. The OMTLBP effectively improves the above issues by introducing different scales and unifies the missing and false detection rates—the OA is 97.83% and the Kappa coefficient is 0.95. The GLCM-SBS method performs better than the GLCM, but worse than the OMTLBP. The proposed method achieves the highest values due to the help of considering channel correlation—its OA is 98.15%, and the Kappa coefficient is 0.96.
(b)
Skysat data
For the Skysat images, there are 210 samples, where the number of positive samples is 90. As in the case of the Sentinal-2 data, 70% of the total samples randomly selected are used for training. The test set includes all the samples and 50 additional superpixels.
Figure 11 is the change detection results of Skysat, where Figure 11a–g illustrate Comparisons 1–6 and the proposed algorithm, and Figure 11h shows the standard change detection result, which is determined through manual visual interpretation. The white area represents the unchanged superpixels, the green area represents the changing area corresponding to the standard, the red area represents false detection, and the blue area represents missing detection. It can be seen that the missing detections are distributed in the upper right corner, and each algorithm has varying degrees of missed detections. The LBP family has difficulty describing whole characteristics because of its local texture descriptor, and there are a lot of false detections, as shown in Figure 11c–e. As can be seen, the better results are attributed to the GLCM-SBS method and the proposed algorithm.
Figure 12 shows the enlarged images of the change detection results in the different areas that were indicated in Figure 11. Figure 12a1–a8 illustrates the spectral-based, GLCM, LETRIST, LDZP, OMTLBP, and GLCM-SBS methods as well as the proposed algorithm and the standard of Area 1; Figure 12b1–b8 show the corresponding images of Area 2. It can be seen that the false detection instances are distributed around the previous bare soil areas, and the missing detections are around the urban areas. The spectral-based, GLCM, LETRIST, and LDZP methods have a lot of missing detections and false detections, as shown in Figure 12a1–a4,b1–b4. In general, among these algorithms, the proposed algorithm has higher similarity with the standard image.
In order to verify quantitatively the effectiveness of the proposed method in different data sets, the missing detection rate, false detection rate, overall accuracy rate, and Kappa coefficient are calculated and are listed in Table 4. It can be seen that with the increase in spatial resolution, the accuracy of detection has generally improved; for example, the accuracy of the spectral-based method is 92.45%. However, at the same time, the pixels among the superpixels increased dramatically, the texture features described by LETRIST and LDZP have difficulty representing global texture features, and the accuracies are relatively low, only 88.68% and 89.15%, respectively. The OMTLBP uses a multi-scale approach to describe the whole texture characteristics, resulting in significant improvements. As a whole, the LBP family performs equal to or worse than the GLCM-based method, and the traditional GLCM-based methods perform worse than the proposed algorithm that describes the texture characteristics by considering the band correlation.

3.5. Discussion

To analyze deeply the performance of the comparison and proposed algorithms, the change situation is divided into four types, i.e., complete changing of forest–bareland, incomplete changing of forest–bareland, other changes, and unchanged. Here, complete changing means that dense forests change to bareland without green vegetation, and incomplete changing means that sparse forests change to bareland without green vegetation or that dense forests change to bareland with secondary vegetation. Typical examples of the detection results of these four types under each algorithm are shown in Figure 13a–d. For the complete changing type and unchanged type, most algorithms can achieve relatively perfect detection, except for the spectral-based and GLCM algorithms, as shown in Figure 13a,d. The main reason is the lack of sufficient description of the features of the superpixels. As the spatial resolution increases, the number of pixels in the superpixels increases, and the missing phenomenon improves, as shown in the third and fourth columns of Figure 13a. For the incomplete changing type, the distinguishability of the superpixel changes is reduced, which increases the difficulty of the change detection. The LBP family all have missing detection in the Sentinel-2 data, and the LETRIST and LDZP also exhibit this phenomenon in the Skysat data, as shown in the fifth and sixth columns of Figure 13b. The main reason is that the LBP family’s ability to describe global texture features is not good enough, and the feature dimension is too high. For other changes, the LBP family has severe false detection compared with the statistics-based approach, i.e., GLCM-based, as shown in Figure 13c. In addition, algorithms with feature filtering are more effective and stable than those without feature filtering, as shown in the eighth and ninth columns of Figure 13.

4. Conclusions

In the study presented in this paper, an object-oriented remote sensing image change detection method based on a color co-occurrence matrix is proposed. It extends the gray co-occurrence matrix and constructs the color co-occurrence matrix by considering the correlation among bands. It can describe not only the texture in a band but also the texture among bands, and the object-level texture can be more conducive to describing the overall characteristics. In addition, to avoid the impact of feature information redundancy on the detection accuracy, a cumulative backward search strategy is proposed to filter the features. It can effectively avoid the error filtering caused by the random fluctuation of feature ranking and obtain a stable and representative feature combination. Through the qualitative and quantitative analyses of the detection results of the proposed and comparison algorithms in different resolution remote sensing images, it is found that the proposed method is superior to the other methods in both false detection and missing detection. In the future, the proposed algorithm will be extended to incorporate multiple changing types, which can lay the foundation for mining special change patterns.

Author Contributions

Conceptualization, X.L. and S.G.; methodology, X.L. and Z.Z.; software, Z.Z.; validation, Z.Z.; investigation, Z.Z.; writing—original draft preparation, Z.Z. and X.L.; writing—review and editing, X.L., T.Z., J.C., S.G., L.Z. and L.S.; supervision, X.L. and T.Z. All authors have read and agreed to the published version of the manuscript.

Funding

This research was funded by the National Natural Science Foundation of China, grant numbers 42001286 and 42171323; the Fundamental Research Foundation of Shenzhen Technology and Innovation Council, grant number KCXFZ202002011006298; the Fundamental Research Foundation of Shenzhen Technology and Innovation Council (General Program), grant number JCYJ20190806170814498; the Project of the State Council Three Gorges Office on the Investigation and Assessment of the Aquatic Habitat Status of the Important Tributary of Chongqing Reservoir Area (Fuling–Wushan Section), grant number 5000002013BB5200002; and the Strategic Priority Research Program of the Chinese Academy of Sciences, grant number XDA19030301.

Institutional Review Board Statement

Not applicable.

Informed Consent Statement

Not applicable.

Data Availability Statement

No applicable.

Conflicts of Interest

The authors declare no conflict of interest.

References

  1. Wang, X.; Liu, S.; Du, P.; Liang, H.; Xia, J.; Li, Y. Object-oriented change detection in urban areas from high spatial resolution images based on multiple features and ensemble learning. Remote Sens. 2018, 10, 276. [Google Scholar] [CrossRef]
  2. Hussain, M.; Chen, D.; Cheng, A.; Wei, H.; Stanley, D. Change detection from remotely sensed images: From pixel-based to Object-oriented approaches. ISPRS J. Photogramm. Remote Sens. 2013, 80, 91–106. [Google Scholar] [CrossRef]
  3. Sun, C.; Li, J.; Liu, Y.; Cao, L.; Zheng, J.; Yang, Z.; Ye, J.; Li, Y. Ecological quality assessment and monitoring using a time-series remote sensing-based ecological index (ts-RSEI). GISci. Remote Sens. 2022, 59, 1793–1816. [Google Scholar] [CrossRef]
  4. Cao, G.; Zhou, L.; Li, Y. A new change-detection method in high-resolution remote sensing images based on a conditional random field model. Int. J. Remote Sens. 2016, 37, 1173–1189. [Google Scholar] [CrossRef]
  5. Lv, Z.; Wang, F.; Sun, W.; You, Z.; Falco, N.; Benediktsson, J.A. Landslide inventory mapping on VHR images via adaptive region shape similarity. IEEE Trans. Geosci. Remote Sens. 2022, 60, 1–11. [Google Scholar] [CrossRef]
  6. Liu, Z.; Li, G.; Mercier, G.; He, Y.; Pan, Q. Change detection in heterogenous remote sensing images via homogeneous pixel transformation. IEEE Trans. Image Process. 2018, 27, 1822–1834. [Google Scholar] [CrossRef]
  7. Wang, Z.; Wei, C.; Liu, X.; Zhu, L.; Yang, Q.; Wang, Q.; Zhang, Q.; Meng, Y. Object-oriented change detection for vegetation disturbance and recovery using Landsat time series. GISci. Remote Sens. 2022, 59, 1706–1721. [Google Scholar] [CrossRef]
  8. Chen, J.; Chen, J.; Gong, P.; He, C.; Pu, R.; Shi, P. Land-use/land-cover change detection using improved change-vector analysis. Photogramm. Eng. Remote Sens. 2003, 69, 369–379. [Google Scholar]
  9. Niemeyer, I.; Marpu, P.R.; Marpu, P.R. Change detection using object features. In Object-Oriented Image Analysis: Spatial Concepts for Knowledge-Driven Remote Sensing Applications; Blaschke, T., Lang, S., Hay, G.J., Eds.; Springer: Berlin/Heidelberg, Germany, 2008; pp. 185–201. [Google Scholar]
  10. Lv, Z.; Huang, H.; Li, X.; Zhao, M.; Benediktsson, J.A.; Sun, W.; Falco, N. Land cover change detection with heterogeneous remote sensing images: Review, Progress, and Perspective. Proc. IEEE 2022, 110, 1976–1991. [Google Scholar] [CrossRef]
  11. Lv, Z.; Huang, H.; Gao, L.; Benediktsson, J.A.; Zhao, M.; Shi, C. Simple multiscale UNet for change detection with heterogeneous remote sensing images. IEEE Trans. Geosci. Remote Sens. 2022, 19, 1–5. [Google Scholar] [CrossRef]
  12. Liu, T.; Yang, L.; Lunga, D. Change detection using deep learning approach with object-based image analysis. Remote Sens. Environ. 2021, 256, 112308. [Google Scholar] [CrossRef]
  13. Lu, D.; Mausel, P.; Brondizio, E.; Moran, E. Change detection techniques. Int. J. Remote Sens. 2004, 25, 265–2401. [Google Scholar] [CrossRef]
  14. Gong, M.; Zhou, Z.; Ma, J. Change detection in synthetic aperture radar images based on image fusion and fuzzy clustering. IEEE Trans. Image Process. 2012, 21, 2141–2151. [Google Scholar] [CrossRef]
  15. Bovolo, F.; Marchesi, S.; Bruzzone, L. A framework for automatic and unsupervised detection of multiple changes in multitemporal images. IEEE Trans. Geosci. Remote Sens. 2012, 50, 2196–2212. [Google Scholar] [CrossRef]
  16. Lv, Z.; Wang, F.; Cui, G.; Benediktsson, J.A.; Lei, T.; Sun, W. Spatial–spectral attention network guided with change magnitude image for land cover change detection using remote sensing images. IEEE Trans. Geosci. Remote Sens. 2022, 60, 1–12. [Google Scholar] [CrossRef]
  17. Tewkesbury, A.P.; Comber, A.J.; Tate, N.J.; Lamb, A.; Fisher, P.F. A critical synthesis of remotely sensed optical image change detection techniques. Remote Sens. Environ. 2015, 160, 1–14. [Google Scholar] [CrossRef]
  18. Addink, E.A.; Van Coillie, F.M.B.; De Jong, S.M. Introduction to the GEOBIA 2010 special issue: From pixels to geographic objects in remote sensing image analysis. Int. J. Appl. Earth Obs. 2012, 15, 1–6. [Google Scholar] [CrossRef]
  19. Tan, K.; Zhang, Y.; Wang, X.; Chen, Y. Object-oriented change detection using multiple classifiers and multi-scale uncertainty analysis. Remote Sens. 2019, 11, 359. [Google Scholar] [CrossRef]
  20. Zhang, Y.; Peng, D.; Huang, X. Object-oriented change detection for VHR images based on multiscale uncertainty analysis. IEEE Geosci. Remote Sens. 2018, 1, 13–17. [Google Scholar] [CrossRef]
  21. Aguirre-Gutiérrez, J.; Seijmonsbergen, A.C.; Duivenvoorden, J.F. Optimizing land cover classification accuracy for change detection, a combined pixel-based and Object-oriented approach in a mountainous area in Mexico. Appl. Geogra. 2012, 34, 29–37. [Google Scholar] [CrossRef]
  22. Ma, L.; Li, M.; Blaschke, T.; Ma, X.; Tiede, D.; Cheng, L.; Chen, Z.; Chen, D. Object-oriented change detection in urban areas: The effects of segmentation strategy, scale, and feature space on unsupervised methods. Remote Sens. 2016, 8, 761. [Google Scholar] [CrossRef]
  23. Lv, Z.; Yang, X.; Zhang, X.; Benediktsson, J.A. Object-based sorted-histogram similarity measurement for detecting land cover change with VHR remote sensing images. IEEE Geosci. Remote Sens. Lett. 2022, 19, 1–5. [Google Scholar] [CrossRef]
  24. Cai, L.; Shi, W.; Zhang, H.; Hao, M. Object-oriented change detection method based on adaptive multi-method combination for remote-sensing images. Int. J. Remote Sens. 2016, 37, 5457–5471. [Google Scholar] [CrossRef]
  25. Wang, J.; Bretz, M.; Dewan, M.A.; Delavar, M.A. Machine learning in modelling land-use and land cover-change (LULCC): Current status, challenges and prospects. SCI. Total Environ. 2022, 822, 153559. [Google Scholar] [CrossRef]
  26. Ojala, T.; Pietikäinen, M.; Mäenpää, T. Gray scale and rotation invariant texture classification with local binary patterns. IEEE Trans. Pattern Anal. Mach. Intell. 2002, 24, 971–987. [Google Scholar] [CrossRef]
  27. Haralick, R.M.; Shanmugam, K.; Dinstein, I.H. Textural features for image cIassification. IEEE Trans. Syst. Man Cybern. 1973, 3, 610–621. [Google Scholar] [CrossRef]
  28. Lei, H.; Hao, Y.; Jin, L.; Yun, Z. A change detection method for remote sensing image based on LBP and SURF feature. In Proceedings of the 9th International Conference on Graphic and Image Processing (ICGIP 2017), Qingdao, China, 21 February 2017; pp. 1–7. [Google Scholar]
  29. Liu, L.; Long, Y.; Fieguth, P.W.; Lao, S.; Zhao, G. BRINT: Binary rotation invariant and noise tolerant texture classification. IEEE Trans. Image Process. 2014, 23, 3071–3084. [Google Scholar]
  30. Song, T.; Li, H.; Meng, F.; Wu, Q.; Cai, J. LETRIST: Locally encoded transform feature histogram for rotation-invariant texture classification. IEEE Trans. Circuits Syst. Video Technol. 2018, 28, 1565–1579. [Google Scholar] [CrossRef]
  31. Roy, S.K.; Chanda, B.; Chaudhuri, B.B.; Banerjee, S.; Ghosh, D.K.; Dubey, S.R. Local directional ZigZag pattern: A rotation invariant descriptor for texture classification. Pattern Recogn. Lett. 2018, 108, 23–30. [Google Scholar]
  32. Fawad; Khan, M.J.; Riaz, M.A.; Shahid, H.; Khan, M.S.; Amin, Y.; Loo, J.; Tenhunen, H. Texture representation through overlapped multi-oriented tri-scale local binary pattern. IEEE Access 2019, 7, 66668–66679. [Google Scholar] [CrossRef]
  33. Bianconi, F.; González, E.; Fernández, A. Dominant local binary patterns for texture classification: Labelled or unlabelled. Pattern Recogn. Lett. 2015, 65, 8–14. [Google Scholar] [CrossRef]
  34. Li, Z.; Shi, W.; Hao, M.; Zhang, H. Unsupervised change detection using spectral features and a texture difference measure for VHR remote-sensing images. Int. J. Remote Sens. 2017, 38, 7302–7315. [Google Scholar] [CrossRef]
  35. Palm, C. Color texture classification by integrative Co-occurrence matrices. Pattern Recogn. 2004, 37, 965–976. [Google Scholar] [CrossRef]
  36. Hossain, M.D.; Chen, D. Segmentation for Object-oriented image analysis (OBIA): A review of algorithms and challenges from remote sensing perspective. ISPRS J. Photogramm. Remote Sens. 2019, 150, 115–134. [Google Scholar] [CrossRef]
  37. Felzenszwalb, P.F.; Huttenlocher, D.P. Efficient graph-based image segmentation. Int. J. Comput. Vis. 2004, 59, 167–181. [Google Scholar] [CrossRef]
  38. Benz, U.C.; Hofmann, P.; Willhauck, G.; Lingenfelder, I.; Heynen, M. Multi-resolution, object-oriented fuzzy analysis of remote sensing data for GIS-ready information. ISPRS J. Photogramm. Remote Sens. 2004, 58, 239–258. [Google Scholar] [CrossRef]
  39. Baatz, M.; Schape, A. Multiresolution segmentation: An optimization approach for high quality multi-scale image segmentation. In Angewandte Geographische Informationsverarbeitung; XII; Wichmann: Appleton, WI, USA, 2000; pp. 12–23. [Google Scholar]
  40. Johnson, B.A.; Bragais, M.; Endo, I.; Magcale-Macandog, D.B.; Macandog, P.B.M. Image segmentation parameter optimization considering within-and between-segment heterogeneity at multiple scale levels: Test case for mapping residential areas using Landsat imagery. ISPRS Int. J. Geo-Inf. 2015, 4, 2292–2305. [Google Scholar] [CrossRef]
  41. Breiman, L. Random forests. Mach. Learn. 2001, 45, 5–32. [Google Scholar] [CrossRef]
  42. Zhou, F.Q.; Zhang, A.N. Optimal subset selection of time-series MODIS images and sample data transfer with random forests for supervised classification modelling. Sensors 2016, 16, 1783. [Google Scholar] [CrossRef]
  43. Jain, A.; Zongker, D. Feature selection: Evaluation, application, and small sample performance. IEEE Trans. Pattern Anal. Mach. Intell. 1997, 19, 153–158. [Google Scholar] [CrossRef]
Figure 1. Flow chart of the proposed algorithm.
Applsci 13 06748 g001
Figure 2. Color co-occurrence matrix. (a) Subregion and grayscale; (b) Color co-occurrence matrix about bands R and G.
Applsci 13 06748 g002
Figure 3. Flow chart of CBSS.
Applsci 13 06748 g003
Figure 4. The location of research areas.
Applsci 13 06748 g004
Figure 5. (a1,b1) Sentinel-2 images of Shenzhen in January 2020 and 2021; (a2,b2) Skysat images of Dapeng in October 2021 and May 2022.
Applsci 13 06748 g005
Figure 6. OGF curves of segmentation scales: (a) Sentinel-2 image and (b) Skysat image.
Applsci 13 06748 g006
Figure 7. Segmentation results of local areas at different scales in Sentinel-2 images: (a1c1) scale = 21; (a2c2) scale = 41; and (a3c3) scale = 61.
Applsci 13 06748 g007
Figure 8. Segmentation results of local areas at different scales in Skysat images: (a1c1) scale ≈ 100; (a2c2) scale ≈ 300; and (a3c3) scale ≈ 1500.
Applsci 13 06748 g008
Figure 9. Change detection results of comparisons and the proposed algorithm of Sentinel-2: (a) Spectral-based, (b) GLCM, (c) LETRIST, (d) LDZP, (e) OMTLBP, (f) GLCM-SBS, (g) the proposed algorithm, and (h) the standard change detection result.
Applsci 13 06748 g009
Figure 10. Enlarged images of Sentinel-2 in Areas 1 and 2: (a1,b1) Spectral-based, (a2,b2) GLCM, (a3,b3) LETRIST, (a4,b4) LDZP, (a5,b5) OMTLBP, (a6,b6) GLCM-SBS, (a7,b7) the proposed algorithm, and (a8,b8) the standard change detection result.
Applsci 13 06748 g010
Figure 11. Change detection results of comparisons and the proposed algorithms of Skysat: (a) Spectral-based, (b) GLCM, (c) LETRIST, (d) LDZP, (e) OMTLBP, (f) GLCM-SBS, (g) the proposed algorithm, and (h) the standard change detection result.
Applsci 13 06748 g011
Figure 12. Enlarged images of Skysat in Areas 1 and 2: (a1,b1) Spectral-based, (a2,b2) GLCM, (a3,b3) LETRIST, (a4,b4) LDZP, (a5,b5) OMTLBP, (a6,b6) GLCM-SBS, (a7,b7) the proposed algorithm, and (a8,b8) the standard change detection result.
Applsci 13 06748 g012
Figure 13. Performance analysis of comparisons and the proposed algorithm under different change types.
Applsci 13 06748 g013
Table 1. Statistical variables of the texture features.
Feature NamesFeature DescriptionCalculation Formula
Angular Second Moment
(ASM)
The evenness of the grayscale distribution of the image   A S M = e , o = 1 N P e , o 2
Contrast (Con)Graphic sharpness   C o n = e , o = 1 N P e , o e o 2
Correlation (Cor)Consistency of image texture   C o r = e , o = 1 N P e , o e μ e o μ o σ e 2 σ o 2
Inverse Different Moment
(IDM)
Homogeneity of image texture   I D M = e , o = 1 N P e , o 1 + e o 2
Table 2. Experimental scheme design.
Experiment NameBasic Operating UnitFeature SetFeature FilteringFeature-Filtering MethodReference
Comparison 1–
Spectral-based
Object-levelSpectral featuresNo--
Comparison 2–
GLCM
Object-levelSpectral features and
GLCM texture features
No-[27]
Comparison 3–
LETRIST
Object-levelSpectral features and LETRIST texture featuresNo-[30]
Comparison 4–
LDZP
Object-levelSpectral features and LDZP texture featuresNo-[31]
Comparison 5–
OMTLBP
Object-levelSpectral features and OMTLBP texture featuresNo-[32]
Comparison 6–
GLCM-SBS
Object-levelSpectral features and
GLCM texture features
YesSingle backward search[27,43]
The proposed algorithmObject-levelSpectral features and
CCM texture features
YesCumulative backward search-
Table 3. Change detection accuracy of Sentinel-2 in different experiments.
Experiment NameMissing Detection RateFalse Detection RateOverall Accuracy RateKappa Coefficient
Comparison 1–
Spectral-based
48.15%39.13%60.00%0.20
Comparison 2–
GLCM
6.25%9.09%90.74%0.81
Comparison 3–
LETRIST
2.22%6.38%94.96%0.89
Comparison 4–
LDZP
7.45%1.10%94.62%0.88
Comparison 5–
OMTLBP
3.33%1.60%97.83%0.95
Comparison 6–
GLCM-SBS
6.67%3.45%94.44%0.89
The proposed algorithm0.00%3.33%98.15%0.96
Table 4. Change detection accuracy of Skysat in different experiments.
Experiment NameMissing Detection RateFalse Detection RateOverall Accuracy RateKappa Coefficient
Comparison 1–
Spectral-based
5.43%9.17%92.45%0.85
Comparison 2–
GLCM
5.00%6.52%94.34%0.88
Comparison 3–
LETRIST
19.57%5.00%88.68%0.77
Comparison 4–
LDZP
15.227.50%89.15%0.78
Comparison 5–
OMTLBP
4.35%6.67%94.34%0.89
Comparison 6–
GLCM-SBS
5.43%2.5%96.23%0.92
The proposed algorithm4.35%1.67%97.17%0.94
Disclaimer/Publisher’s Note: The statements, opinions and data contained in all publications are solely those of the individual author(s) and contributor(s) and not of MDPI and/or the editor(s). MDPI and/or the editor(s) disclaim responsibility for any injury to people or property resulting from any ideas, methods, instructions or products referred to in the content.

