Article

Fault Reconstruction for a Giant Satellite Swarm Based on Hybrid Multi-Objective Optimization

1
College of Astronautics, Nanjing University of Aeronautics and Astronautics, Nanjing 210016, China
2
Wuhan National Laboratory for Optoelectronics, Huazhong University of Science and Technology, Wuhan 430074, China
*
Author to whom correspondence should be addressed.
Appl. Sci. 2023, 13(11), 6674; https://doi.org/10.3390/app13116674
Submission received: 12 May 2023 / Revised: 24 May 2023 / Accepted: 26 May 2023 / Published: 30 May 2023

Abstract

:
To perform indicator selection and verification for the on-orbit fault reconstruction of a giant satellite swarm, a hybrid multi-objective fault reconstruction algorithm is proposed and then verified by Monte Carlo analysis. First, according to the on-orbit failure analysis of the satellite swarm, several optimization indicators, such as the health state of the satellite swarm, the total energy consumption of reconstruction, and the balance of fuel consumption, are proposed. Then, a hybrid multi-objective fitness function is constructed, and a hybrid multi-objective genetic algorithm is used to optimize the objective function to obtain the optimal reconstruction strategy. Finally, the algorithm is statistically verified by Monte Carlo analysis. The simulation results not only show the algorithm’s validity but also reveal the relationship between the number of satellite faults and the health of the satellite swarm. From this, the maximum number of faulty satellites allowed in the giant satellite swarm is calculated, which is significant for assessing the swarm’s health.

1. Introduction

In recent years, satellite systems have shown a trend of clustering [1]. For example, SpaceX plans to launch tens of thousands of low-Earth orbit satellites to achieve global high-speed internet coverage as part of its Starlink project [2]. The rapid increase in micro- and nanosatellites has made many tasks easier. Moreover, system complexity and fault risk have increased, which has led to higher requirements for the on-orbit maintenance and health management of ultra-large-scale satellite swarm systems [3]. The definition of an ultra-large-scale satellite cluster is not consistent throughout academia. To avoid confusion, this paper refers to satellite clusters consisting of more than 1000 satellites as ultra-large-scale satellite swarms.
To improve the ability of ultra-large-scale satellite swarms to handle and tolerate faults autonomously, scholars have carried out research on satellite swarm reconstruction technology. Yang H et al. [4] proposed a decentralized formation control scheme based on couplings within the satellite system and maintained the stable operation of the entire tethered satellite system by adjusting the controller of the faulty satellite itself. Zhang C et al. [5] considered the problem of spacecraft formation reconfiguration under directed and undirected communication. They proposed that the faulty satellite and the reconfigured healthy satellite cooperate to compensate for controller faults and synchronize the system attitude. Li J et al. [6] introduced a fuzzy logic system to solve the problem of tracking inconsistency among multiple satellites under fault conditions by cutting off the communication between faulty satellites and healthy satellites. From the perspective of fault-tolerant control, the above scheme focuses on the situation in which a single satellite fault has little impact on the entire system. To study the problem of mission failure caused by multi-satellite failure, Jiang B et al. [7] proposed a state-switching multibody satellite formation failure reconstruction method, which has faulty satellites leave the formation and healthy satellites compensate to achieve reconstruction.
The above fault reconstruction techniques have been developed over many years. However, for ultra-large-scale satellite clusters, factors such as the complexity of satellite coordination, task diversity, and uncertainty of reconstruction indicators introduce challenges to the satellite swarm reconstruction task. Since fault satellite swarm reconstruction is usually based on system redundancy and reconfiguration of the system structure [8], there may be multiple reconstruction control strategies. However, for different satellite swarm systems, there are differences in their reconstruction strategies in terms of energy consumption, health state, reliability, etc. Therefore, the problem of satellite swarm fault reconstruction is a kind of multi-objective optimization problem. Multi-objective optimization problems play an important role both in theory and in engineering applications. In the 1960s, R.S. Rosenberg [9] first tried to use genetic algorithms to solve multi-objective optimization problems, and gradually multi-objective optimization problems came to the public’s attention. In the 1980s, J.D. Schaffer [10] designed the first multi-objective evolutionary algorithm, the vector-evaluated genetic algorithm. Since then, the multi-objective optimization algorithm has gone through two periods, from the initial development with simple rules to the current second stage with efficiency as the evolutionary goal. According to the different ways of solving multi-objective problems, refactoring methods can be divided into system-model-based and transformation-based methods. The former needs to establish an accurate system model and use inference diagnosis to solve the strategy, which cannot deal with large and complex systems and is not efficient. The latter converts the problem to other well-studied domain problems, such as the planning field [11,12,13].
Multi-objective optimization algorithms [14,15] are usually used to solve multi-objective problems. These algorithms have advantages and disadvantages. For instance, the multi-objective evolutionary algorithm based on decomposition (MOEA/D) [16,17] converges quickly, but the effect for high-dimensional multi-objective problems is poor. Multi-objective particle swarm optimization (MOPSO) algorithms [18,19,20] cannot solve discrete optimization problems. The nondominated sorting genetic algorithm-II (NSGA-II) [21,22,23] has low computational complexity and high population diversity and is widely used to solve multi-objective optimization problems. However, there is no unique solution to a given multi-objective optimization problem; that is, the goal of multi-objective algorithms is to find a global optimal solution on the Pareto front [24,25,26,27]. Therefore, for reconstruction problems that require a unique optimal solution, other solutions need to be considered. There are three common methods: (1) the generative method, i.e., generating the optimal solution set, which requires the decision maker to filter out the optimal solution according to the needs of the problem. (2) The interactive method finds the optimal solution through dialogue and interaction between the decision-maker and the analyst. (3) The transformation method requires the decision maker to judge the importance of the objective function, transforms the multi-objective problem into a single-objective problem for a solution and often uses an intelligent algorithm.
This paper takes the self-assembled space telescope [28] as the mission setting and introduces optimization indicators such as the health state of the satellite swarm, the total energy consumption of the reconstruction, and the balance of fuel consumption. Based on this framework, a reconstruction optimization model for each stage is constructed, and a hybrid multi-objective genetic algorithm [29,30] is used to perform the reconstruction. The core advantage of the method in this paper is that even if the satellite faults in the satellite swarm system are different, it still provides a multi-objective optimal reconstruction strategy.

2. Construction of On-Orbit Reconstruction Indicators for a Giant Satellite Swarm

Fault reconfiguration refers to the process in which the satellite swarm maintains a healthy state by adjusting the positions of healthy satellites to replace faulty satellites or by isolating faulty satellites to limit their influence on the swarm. In essence, reconfiguration involves a change in the satellite swarm topology; for example, position replacement results in a configuration change, and fault isolation results in a change in the information path. In some scenarios, the latter is also an independent satellite swarm fault isolation problem. The core issue of reconstruction is how to select reconstruction indicators. Starting from actual engineering, this paper studies the reconstruction of the swarm configuration. It constructs mathematical models for properties such as the satellite swarm health state, the total energy consumption of reconstruction, and the balance of fuel consumption, which lays the foundation for the selection of reconstruction indicators.

2.1. Model Assumptions of Satellite Swarm Failure

Satellite swarm fault reconstruction involves multi-satellite deployment. Without loss of generality, it is assumed that the satellites participating in the reconstruction are near the faulty satellite swarm, and the faulty satellites retain deorbiting capabilities. The entire satellite swarm failure reconstruction process is shown in Figure 1.
Self-assembled space telescopes are representative of mission-oriented multi-satellite scenarios. Its health and stability will impact the space telescope’s imaging mission. Therefore, this paper studies the self-assembled mirror satellite swarm of the space telescope. To simplify the decision-making problem of reconfiguration and allocation of satellite clusters, a two-dimensional schematic diagram shows the status of satellite swarm reconfiguration. The three main states of the satellite swarm are shown in Figure 2: Figure 2a shows the normal satellite arrangement, and Figure 2b,c show the process of the satellite swarm returning to health from the fault state during the reconfiguration process.
Considering the characteristics of the satellite swarm, the following assumptions are made for the model:
  • The mission-oriented satellite swarm is composed of individual star satellites that are connected via inter-satellite communication links.
  • The number of satellites in the satellite swarm is N , each satellite is of the same type, and each satellite is a regular hexagon [28] with a side length of L .
  • The satellites in the satellite swarm are evenly distributed, and the distance between adjacent satellites is a , which is much smaller than the orbital radius r , i.e., a r .
  • The satellites are numbered clockwise from the virtual center of the satellite swarm, and the inter-satellite distance correlation matrix is D n × n .

2.2. Relative Motion Modeling

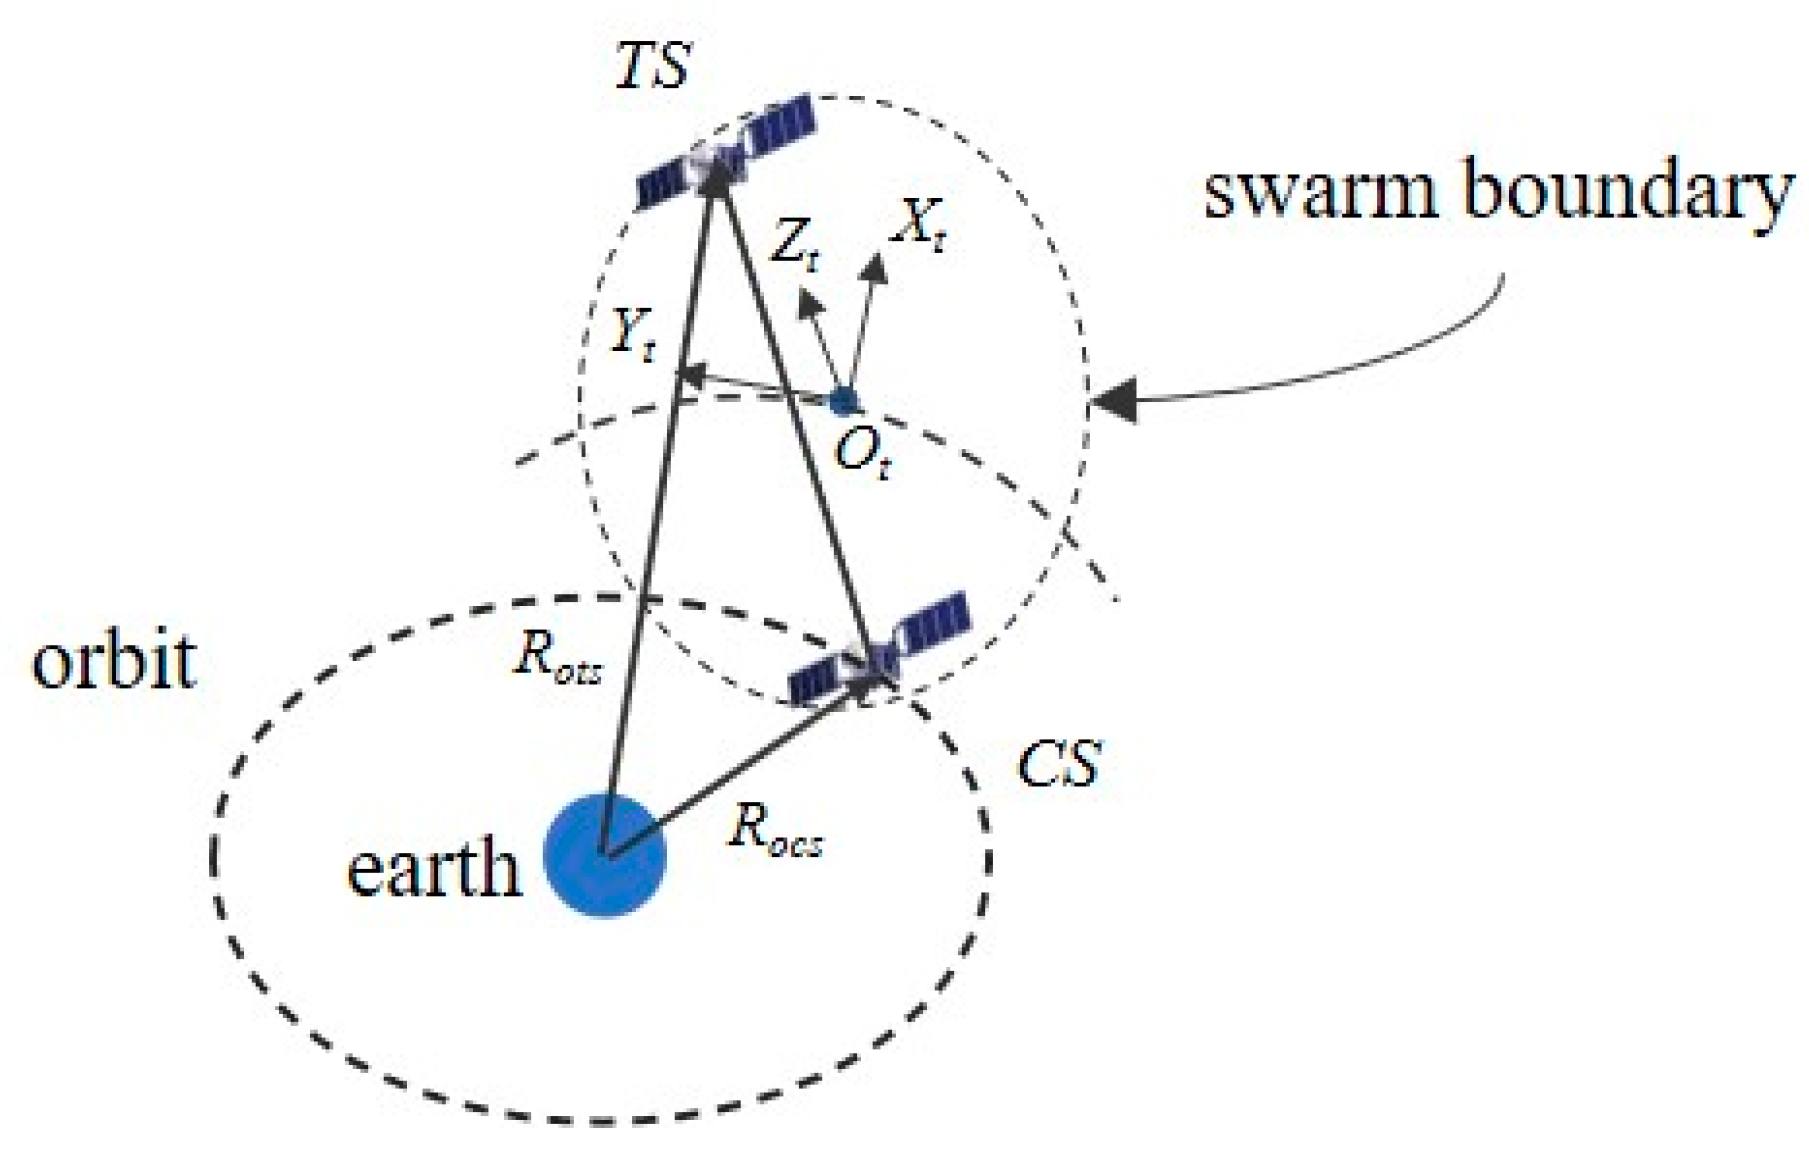
To better describe the position and velocity of the satellite, a coordinate system R is established with the virtual center O t of the satellite swarm as the origin. The X t axis is perpendicular to the orbit where O t is located; the Y t axis is perpendicular to the X t axis and tangent to the O t orbit, and the direction of movement is positive. The Z t axis is perpendicular to the orbital plane and forms a right-handed coordinate system with the X t and Y t axes. In this coordinate system, the reconstructed satellite CS moves toward the faulty satellite TS, as shown in Figure 3.
Due to the small relative distance of the satellite swarms, the motion of the satellite swarms satisfies the C-W equation [31]. Then, the satellite reconstruction problem is:
{ x ¨ 2 n y ˙ 3 n 2 x = u x y ¨ + 2 n x ˙ = u y z ¨ + n 2 z = u z
where x , y and z are the position components of the reconstructed satellite in the R coordinate system; u x , u y , and u z are the orbit control accelerations of the reconstructed satellite; and n is the orbital angular velocity of the faulty satellite.
Let the state sequence be x ( t ) = [ x y z x ˙ y ˙ z ˙ ] T and the orbital acceleration be u ( t ) = [ u x u y u z ] T . The relative motion Equation (1) is written in matrix form to obtain Equation (2):
x ˙ ( t ) = A x ( t ) + B u ( t )
where
A = [ 0 3 × 3 I 3 × 3 A 01 A 02 ] ,   B = [ 0 3 × 3 I 3 × 3 ] T A 01 = [ 3 n 2 0 0 0 0 0 0 0 n 2 ] ,   A 02 = [ 0 2 n 0 2 n 0 0 0 0 0 ]
According to optimal control theory, considering the finite time, the optimal energy is:
J = 1 2 t 0 t f u T u d t
In Equation (3), t 0 and t f are the initial and final times, respectively. The energy-optimal position-velocity equation is as follows:
{ x = t 2 n 2 c 1 3 t 2 2 n c 2 + 5 t b 12 n 2 c 4 + 5 t a 12 n 2 c 5 + b c 10 + a c 11 y = 3 t 2 8 n c 1 ( 2 t n 2 3 t 3 4 ) c 2 ( b 2 n 3 + 5 t a 6 n 2 ) c 4 ( a 2 n 3 5 t b 6 n 2 ) c 5 3 2 n t c 7 + c 8 2 a c 10 + 2 b c 11 z = t a 4 n c 3 + t b 4 n c 6 + b c 9 + a c 12 x ˙ = 1 2 n 2 c 1 3 t n c 2 + ( 5 b 12 n 2 5 t a 12 n ) c 4 + ( 5 a 12 n 2 + 5 t b 12 n ) c 5 n a c 10 + n b c 11 y ˙ = 3 t 4 n c 1 + ( 9 t 2 4 2 n 2 ) c 2 ( a 3 n 2 + 5 t b 6 n ) c 4 + ( b 3 n 2 5 t a 6 n ) c 5 3 2 n c 7 2 n b c 10 2 n a c 11 z ˙ = ( a + n t b 4 n ) c 3 + ( b n t a 4 n ) c 6 n a c 9 + n b c 12
In the formula, c 1 ~ c 12  are constants, which can be obtained by substituting the known position and speed states of CS and TS into Equation (4); in addition, a = sin n t and b = cos n t .

2.3. The Introduction of the Reconstruction Indicators

Because satellites carry limited fuel, fuel consumption, and energy consumption need to be considered during on-orbit reconstruction. Meanwhile, the health state also needs to be considered, so the following parameters are used to establish a reconstruction indicator system:
(1)
Satellite swarm health state
The satellite swarm health state refers to the durability of individual satellites and topological structures in the satellite swarm and the ability of the satellite swarm to meet mission requirements [32]. The satellite swarm health state is an important indicator that measures the overall health of the satellite swarm and detects faults effectively. The health state is used to measure the effect of satellite swarm reconstruction. Considering the nonlinear composition characteristics of the satellite swarm, such as the multiple dimensions of a single satellite, inter-satellite communication link, and mission effectiveness in the satellite swarm, the health state at time H s w a r m is expressed as:
H s w a r m = H s a t k 1 H l i n k k 2 E s w a r m k 3 H s a t = i = 1 N R s a t _ i ω s a t _ i H l i n k = i = 1 M R l i n k _ i ω l i n k _ i
In the formula, H s a t is the weighted sum of the health states of all individual satellites in the swarm, where the single-satellite reliability of satellite i is R s a t _ i and its weight is ω s a t _ i ; in the same way, H l i n k is the weighted sum of the health status of the inter-satellite communication links, where the link reliability of link i is R l i n k _ i and its weight is ω l i n k _ i . k 1 , k 2 , k 3 are the influencing parameters, which represent the relative influence of each part of the satellite swarm system.
E s w a r m is the satellite swarm performance, indicating the ability of the satellite swarm to achieve a task. Different tasks have different forms, which are determined by the specific circumstances of the task. This paper considers a satellite swarm that performs space telescope missions. According to the requirements of optical imaging, the fewer faulty satellites are located near the center of the mirror, the better the imaging performance, i.e., the number of effective satellites can be used to measure the satellite swarm performance. Therefore, the satellites are divided into different layers according to the distance from the satellite to the center of the surface. Satellite swarm effectiveness is determined by the number of working satellites in each layer and the weight values of each layer:
E s w a r m = i = 1 l a y e r N l a y e r _ i ω l a y e r _ i
In the formula, ω s a t _ i is the weight value of layer i; N l a y e r _ i indicates the number of nonfaulty satellites contained in the i-th layer and satisfies i = 1 l a y e r N l a y e r _ i = N H , where N H is the number of nonfaulty satellites in the satellite swarm.
(2)
Total energy consumption of reconstruction
The total energy consumption of reconstruction is the sum of the energy consumed by all satellites participating in the reconstruction to complete orbital maneuvers. Due to the limited fuel carried by each satellite, to satisfy the satellite swarm’s requirements for operating life and mission performance, the lower the total energy consumption is, the better. Therefore, the total energy consumption of reconstruction is expressed as:
J s u m = i = 1 k J i , i = 1 , 2 , , k
In this formula, J i indicates the energy consumption of the orbital maneuver of the i-th satellite participating in the reconstruction, and k indicates the number of satellites participating in the reconstruction.
(3)
Fuel consumption balance [33]
To reduce the reconstruction time, the principle of nearest replacement is adopted. However, the remaining fuel of adjacent satellites may be insufficient, resulting in excessive fuel consumption of the satellite, a shorter working life, and negative effects on the health and mission performance of the satellite swarm. The constraint of fuel consumption balance is introduced to avoid such a situation. The variance of the satellite speed increment involved in the reconstruction is used to characterize the fuel consumption balance:
P = ( J i J ¯ ) N H 1 , i N H
In the formula, J ¯ is the average energy consumption of all nonfaulty satellites participating in the reconstruction.

3. Fault Reconstruction Based on a Hybrid Multi-Objective Genetic Algorithm

After the reconstruction indicator system is established, the reconstruction strategy must be determined. Since the satellite numbers are discontinuous, the process requires optimizing a discrete system. Commonly used multi-objective optimization algorithms obtain a set of optimal solutions at the Pareto front for continuous variables, so they are unsuitable for this research scenario. Therefore, consistent with the optimization indicators established in the previous section, the linear weighted sum method is adopted, and a utility function is formed to represent the overall optimization goal after normalization; then, the reconstruction strategy is determined by a genetic algorithm. In summary, the decision tree of multi-objective fault reconstruction is shown in Figure 4.

3.1. Genetic Coding for Satellite Numbering

Suppose the number of satellites in a given swarm is N , and the set of numbers is S = { s 1 , s 2 , , s N } , s i N . At a certain moment, N F faulty satellites are detected, the set of which is S F = { s F 1 , s F 2 , , s F N F } , s F i S . Then, the set of nonfaulty satellites is S H = { s H 1 , s H 2 , , s H N H } , s H i ( S S F ) , and N H = N N F .
Since it is necessary to determine the number of satellites participating in the reconstruction, integer coding is used. The decision variable X = [ x 1 , x 2 , , x N F ] is a vector composed of satellite numbers participating in the reconstruction. The genetic code is a one-to-one correspondence between the x i and s F i , which is shown in Figure 5:
To prevent the repetition of variable x i in the process of cross-mutation, the process draws on the principle of solving the traveling salesman problem. During initialization, the domain of X is set to S H , which can be expressed as:
x i { S H ,   if   s F i   is   replaced   = 0 ,   if   s F i   is   not   replaced
In the formula, i = 1 , 2 , , N F .

3.2. Construction of Hybrid Multi-Objective Functions

The total energy consumption and fuel consumption balance must be made as small as possible, while the satellite swarm health must be made as large as possible. According to the gray clustering [34] weight determination method, weight values are assigned to the optimization indicators, and the multi-objective problem is transformed into a single-objective problem.
Since the units of the three indicators are different, normalization and standardization are used to obtain the normalized indicator function f i ( x ) * :
f i ( x ) * = f i ( x ) min f i ( x ) max f i ( x ) min f i ( x )
where f i ( x ) is the i-th indicator function. Therefore, the evaluation function F ( X ) can be expressed as:
F ( X ) = F ( H s w a r m , J s u m , P )
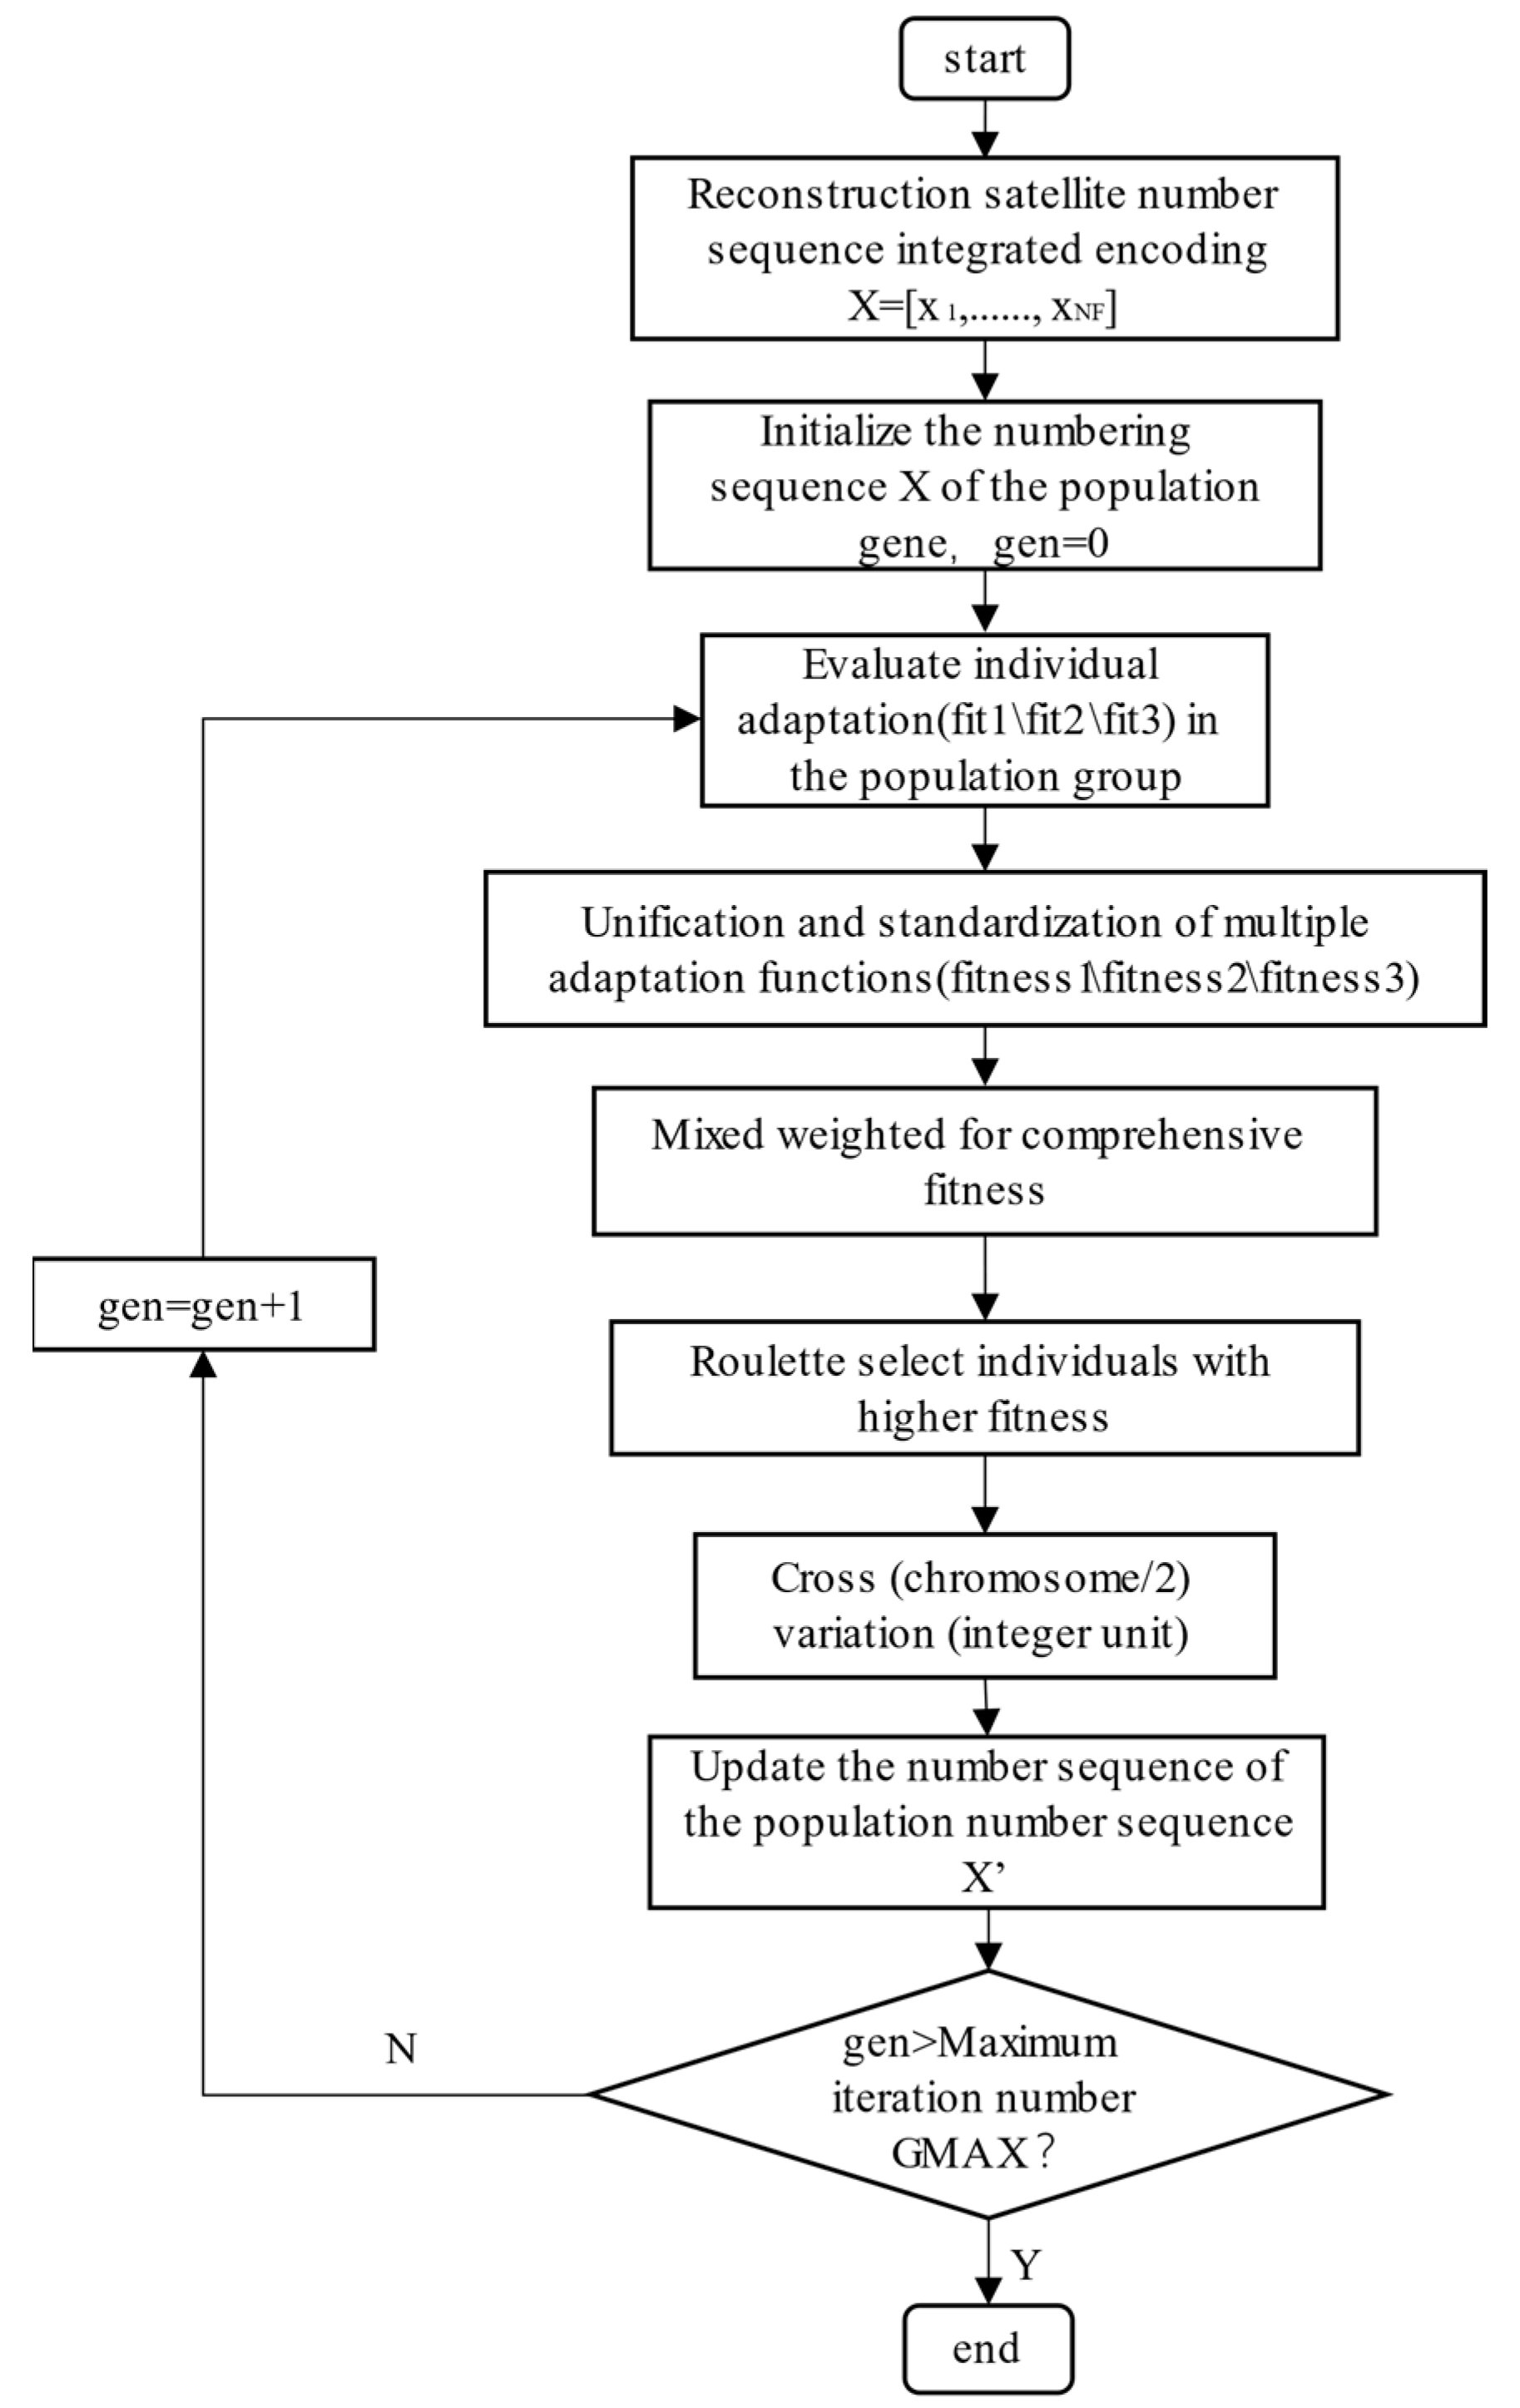
The detailed flow of the hybrid multi-objective genetic algorithm is shown in Figure 6.

4. Simulation and Analysis

According to the model in Section 2.1, fault reconstruction simulation analysis is carried out first to verify the effectiveness of the reconstruction algorithm; then, Monte Carlo simulation is used to verify the correctness of the reconstruction algorithm.

4.1. Fault Reconstruction Simulation

According to the model assumptions in Section 2.1, the faulty satellite distribution is represented as a vector S F ; the orbital radius of the virtual center of the satellite swarm is R s , and Earth’s gravitational constant is μ . The reconstruction model parameters are shown in Table 1. The three-axis coordinate parameters of the faulty satellite in the relative coordinate system are shown in Table 2. The simulated running orbit is nearly circular, so the angular velocities are approximately equal. The initial values of the two moving satellites in the relative system are shown in Table 3.
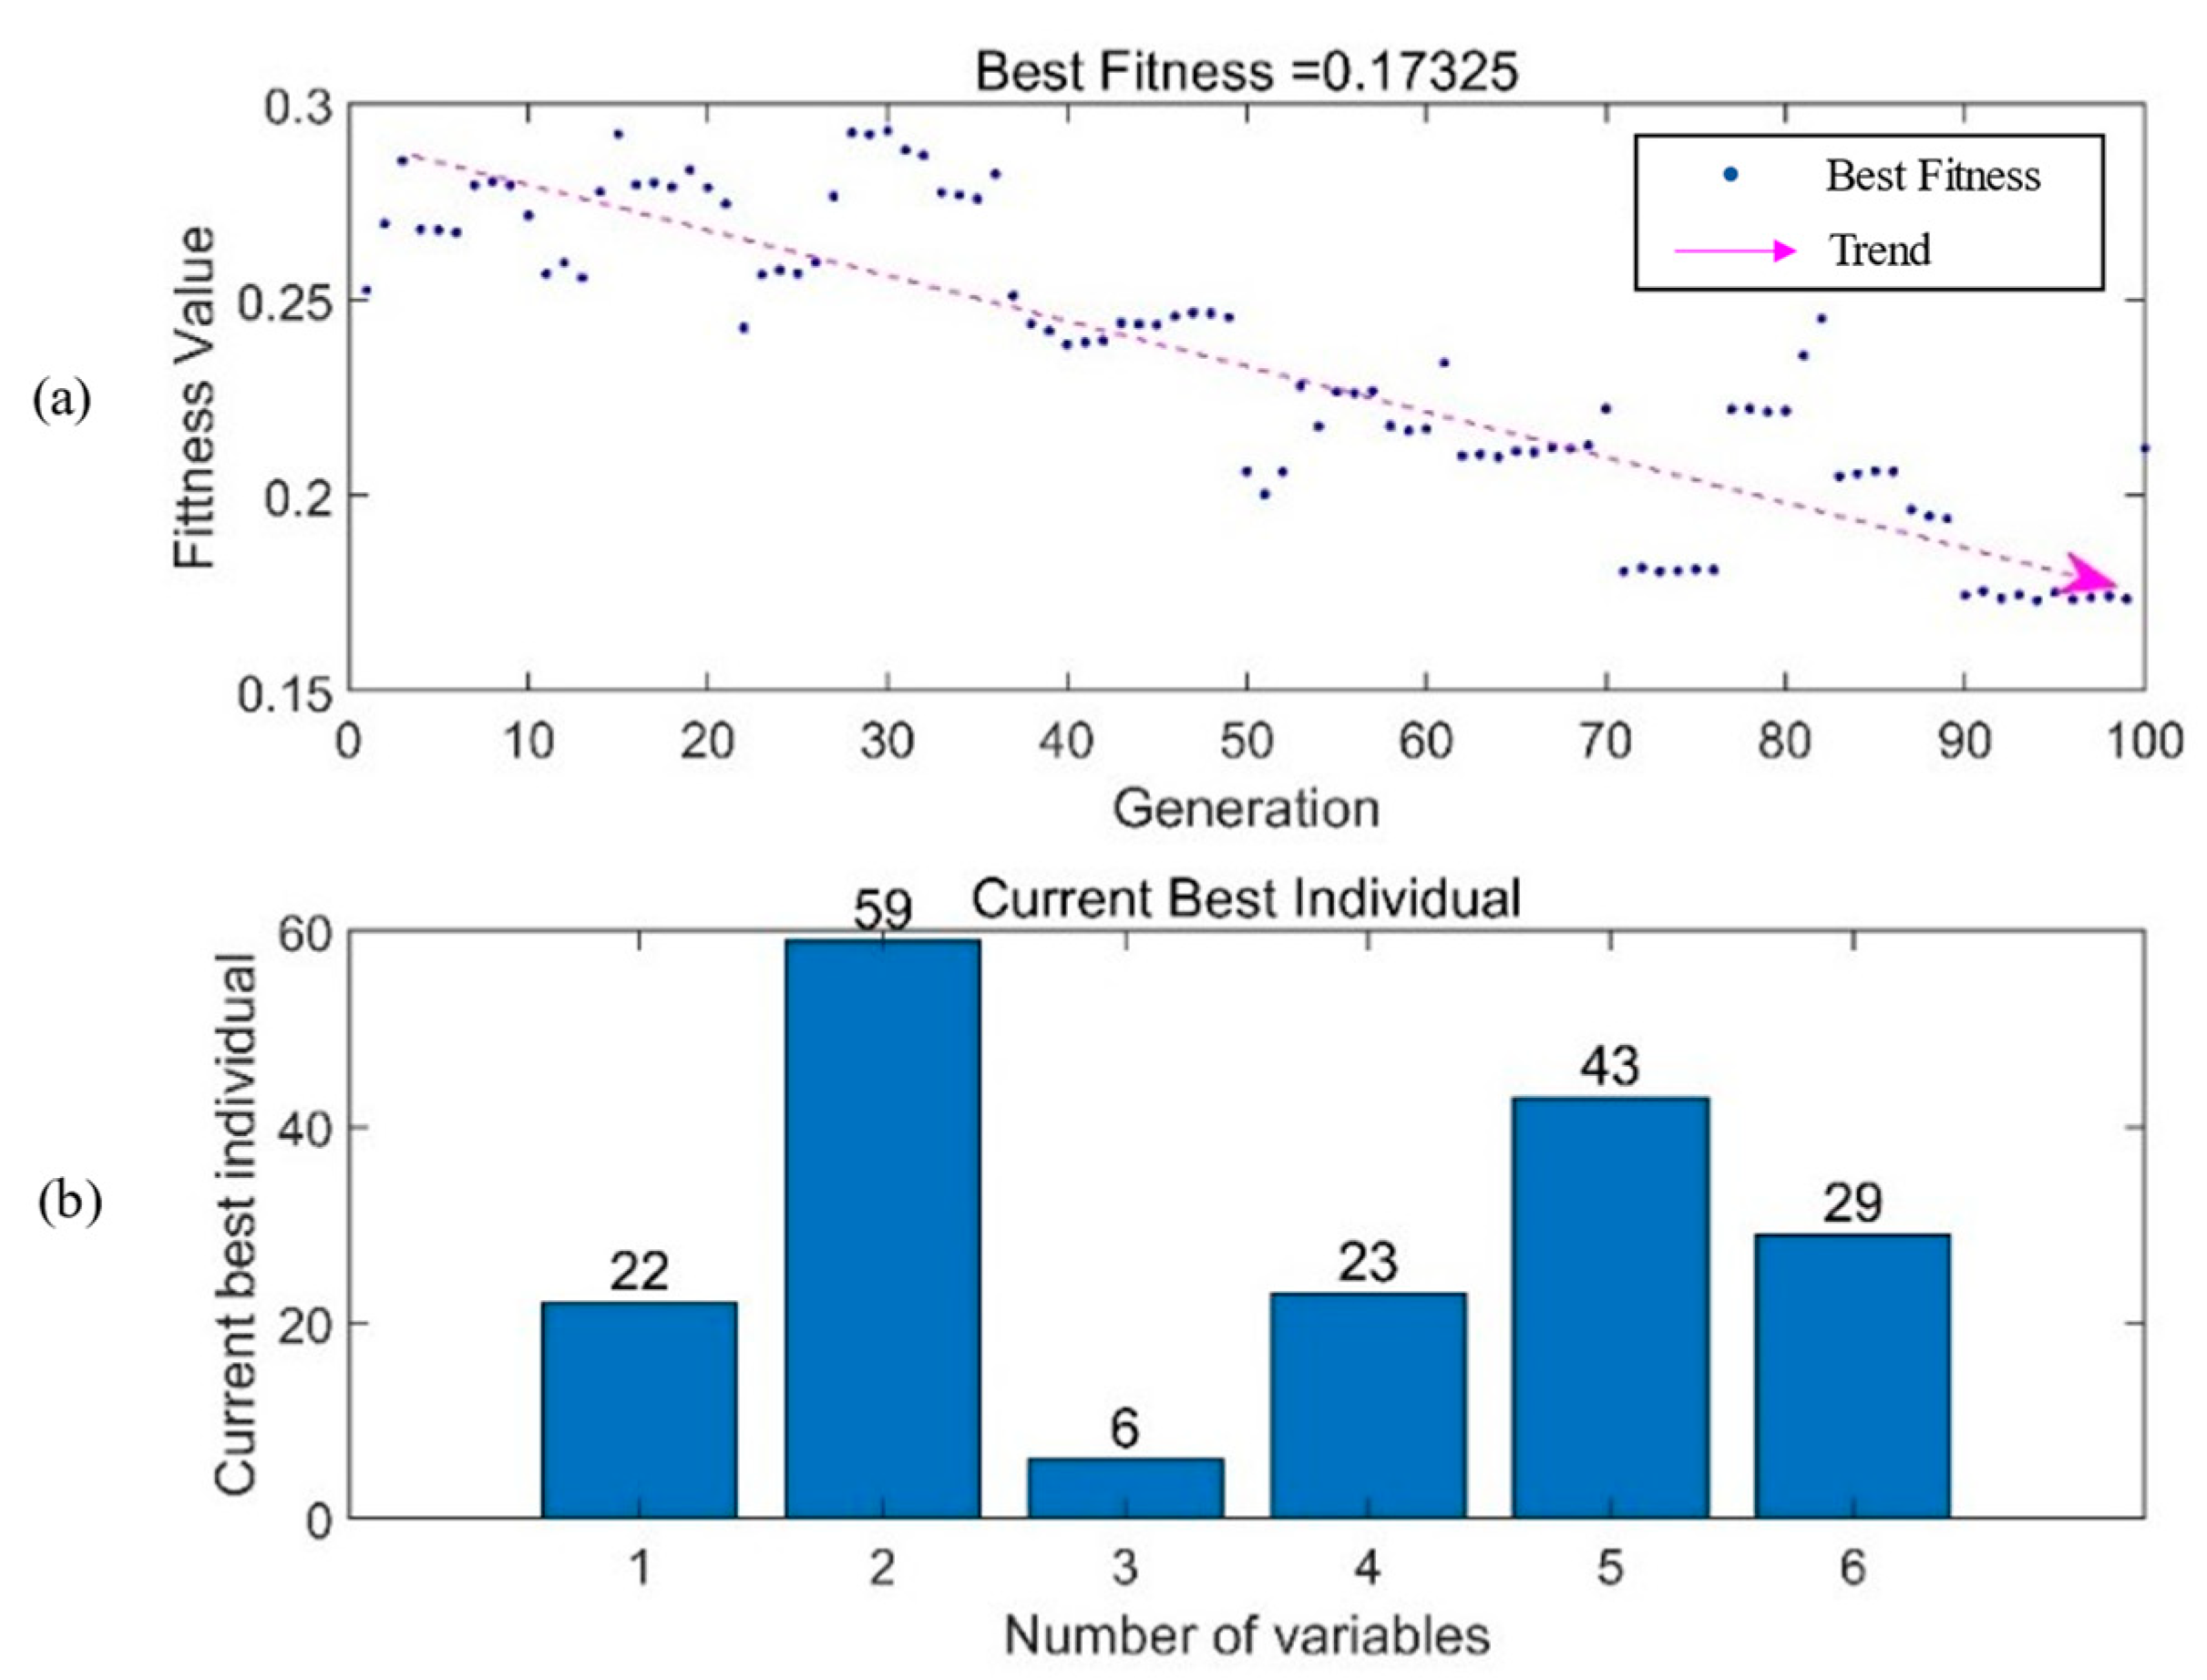
The genetic algorithm population size is set to 100, and the maximum number of generations is set to 100. The simulation of the optimal fault reconstruction strategy calculated using the algorithm in Chapter 3 is shown in Figure 7.
From the scatter plot in Figure 6, the overall fitness value fluctuates and decreases. The fluctuation is due to the inconsistency of the direction of the optimization indicators in the iterative process, resulting in local optima. However, as the number of generations increases, the global optimum is gradually located. Therefore, after 100 iterations, the curve shows convergence. The histogram indicates that the optimal reconstruction scheme has been obtained through the genetic algorithm: X = [ 22 , 59 , 6 , 23 , 43 , 29 ] , i.e., the healthy satellites numbered 22, 59, 6, 23, 43, and 29 correspond to the reconstructed faulty satellites 10, 18, 33, 40, 44, and 53. This reconfiguration scheme optimizes the health state, energy consumption, and fuel consumption balance of the entire satellite swarm.

4.2. Monte Carlo Simulation Verification

To prove the effectiveness and reliability of the reconstruction decision-making algorithm for satellite swarms with different degrees of faults, this section uses the Monte Carlo method. The steps are as follows:
  • Set the number of faulty satellites randomly distributed in the range [1, 30], i.e. N F [ 1 , 30 ] .
  • Randomly select N F satellites in a satellite swarm with N satellites and generate fault type S F .
  • Set the health state indicator of the objective function in Section 3.2 and the rest of the indicators as constraints, solving the optimal reconfiguration strategy.
  • Calculate the optimal health state and average health state of the satellite swarm corresponding to the reconstruction strategy.
  • Repeat the above steps 300 times.
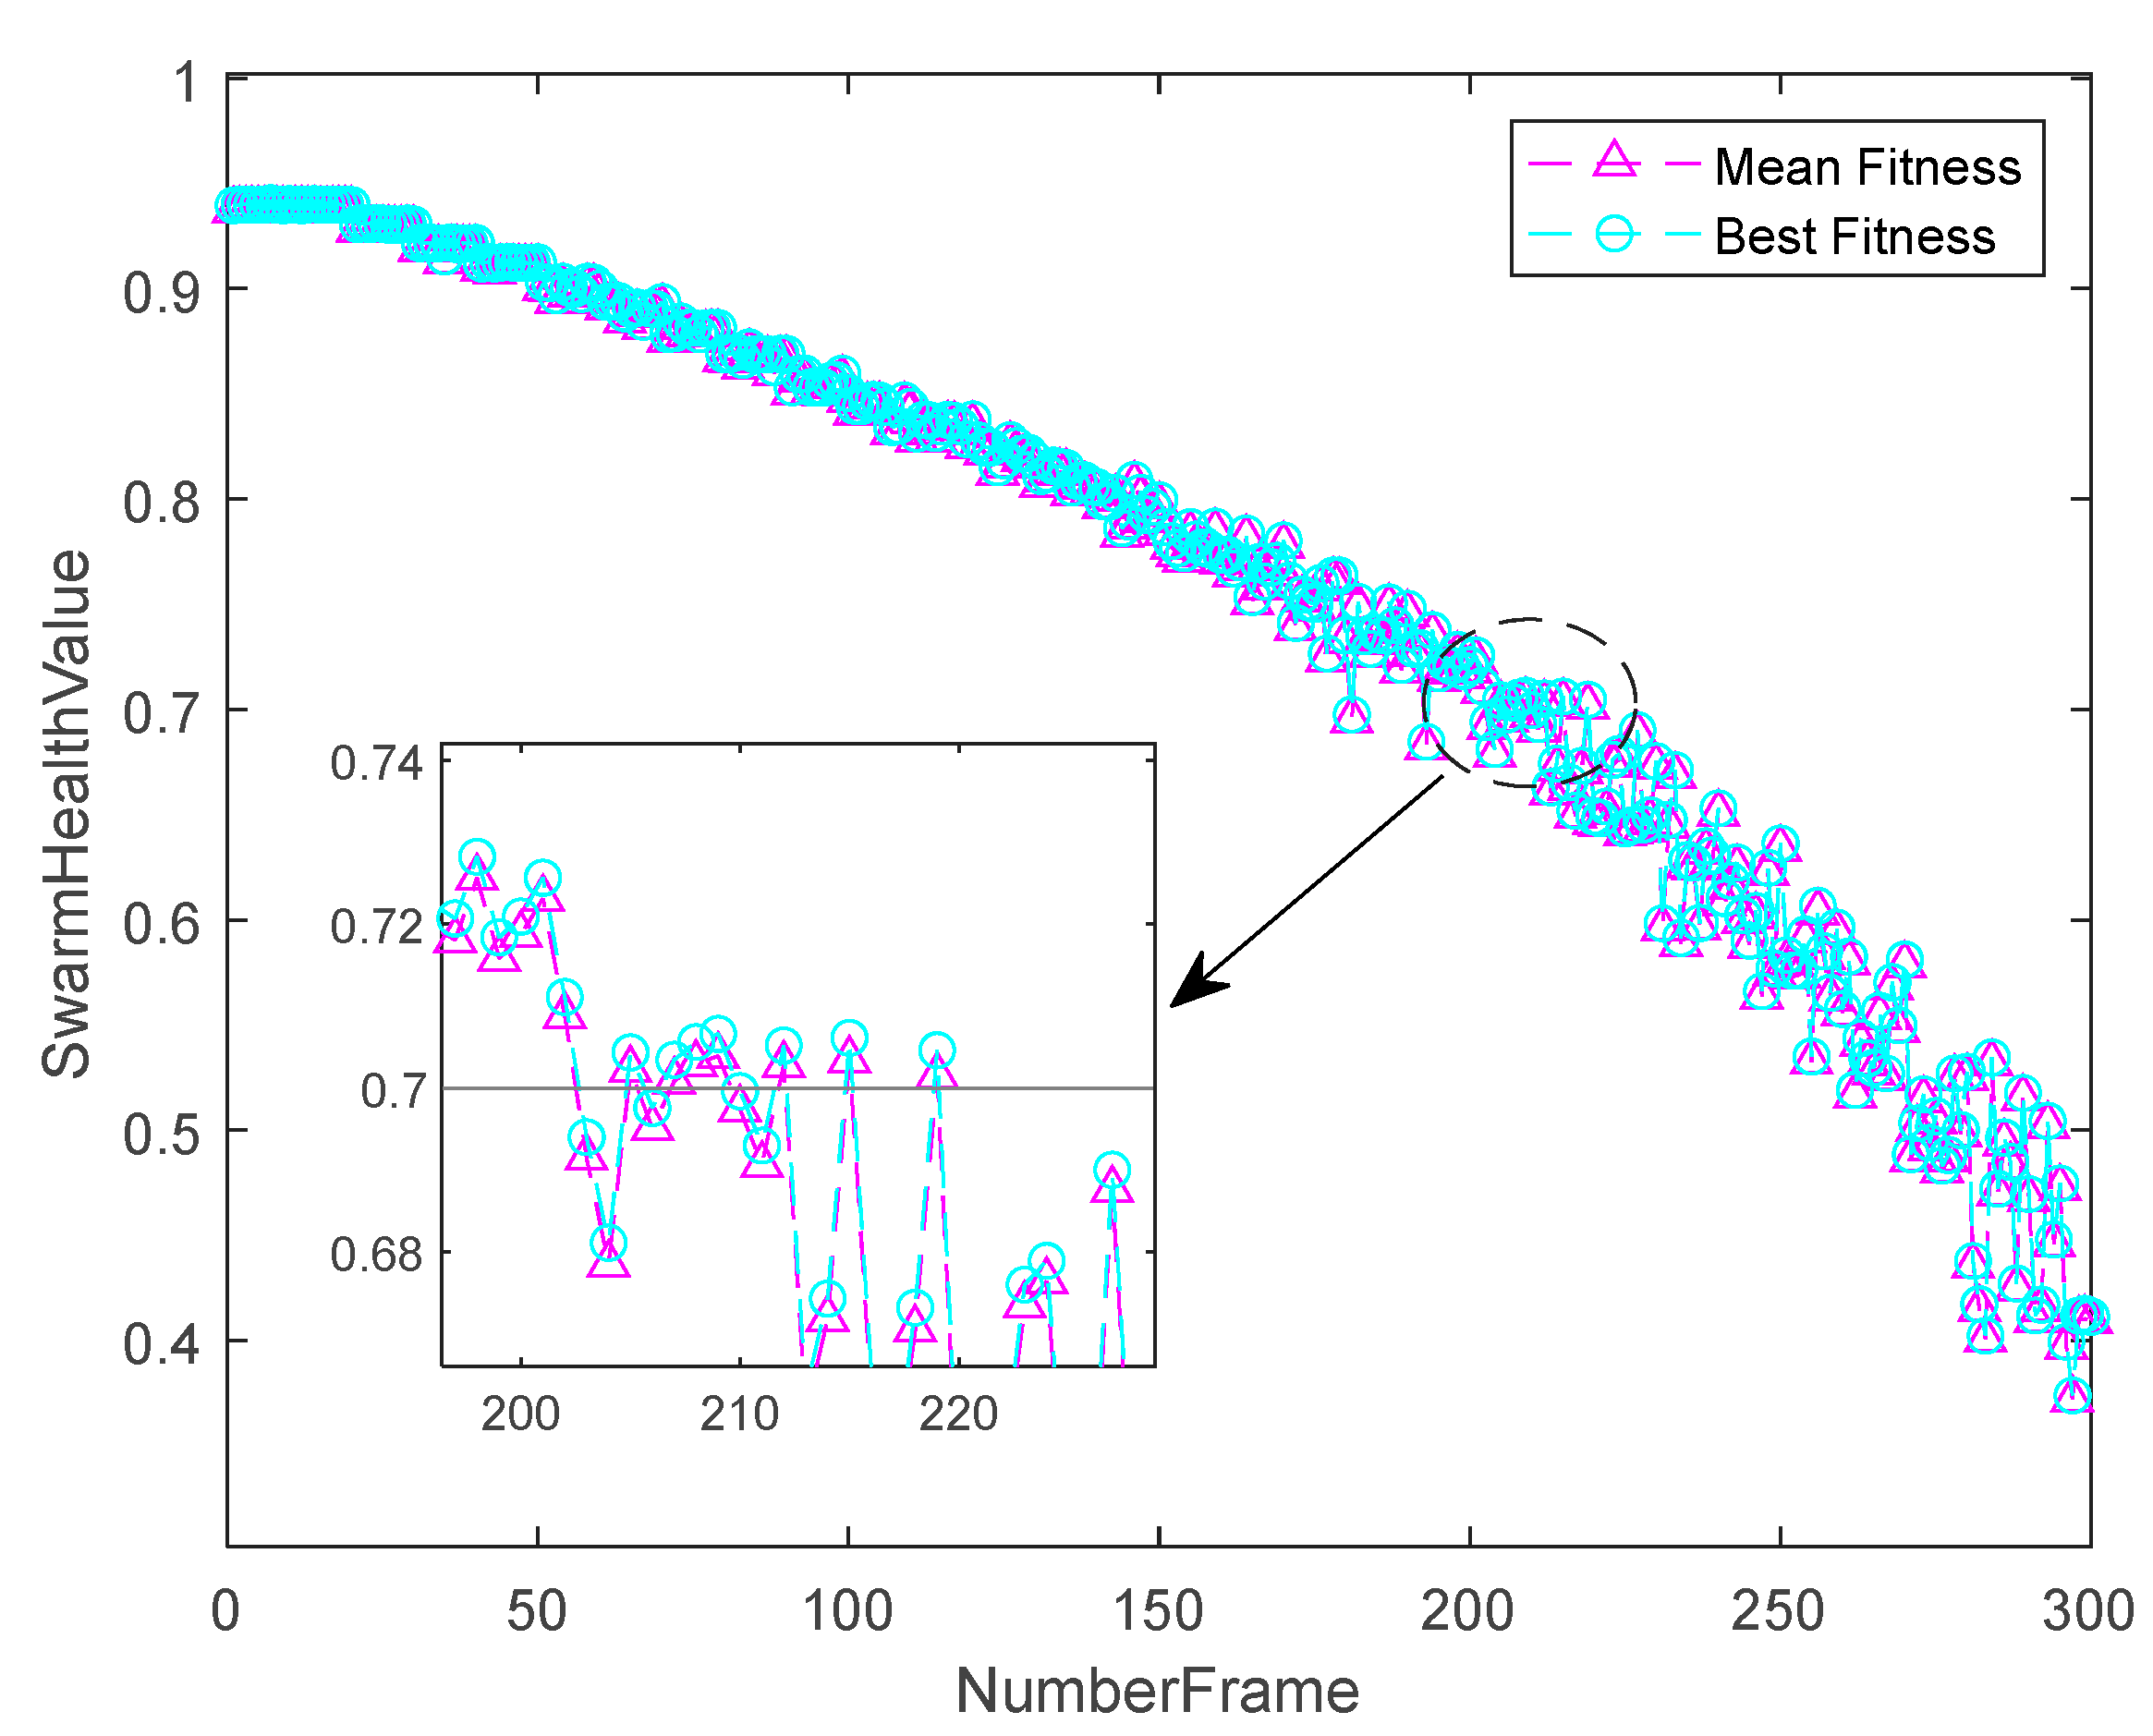
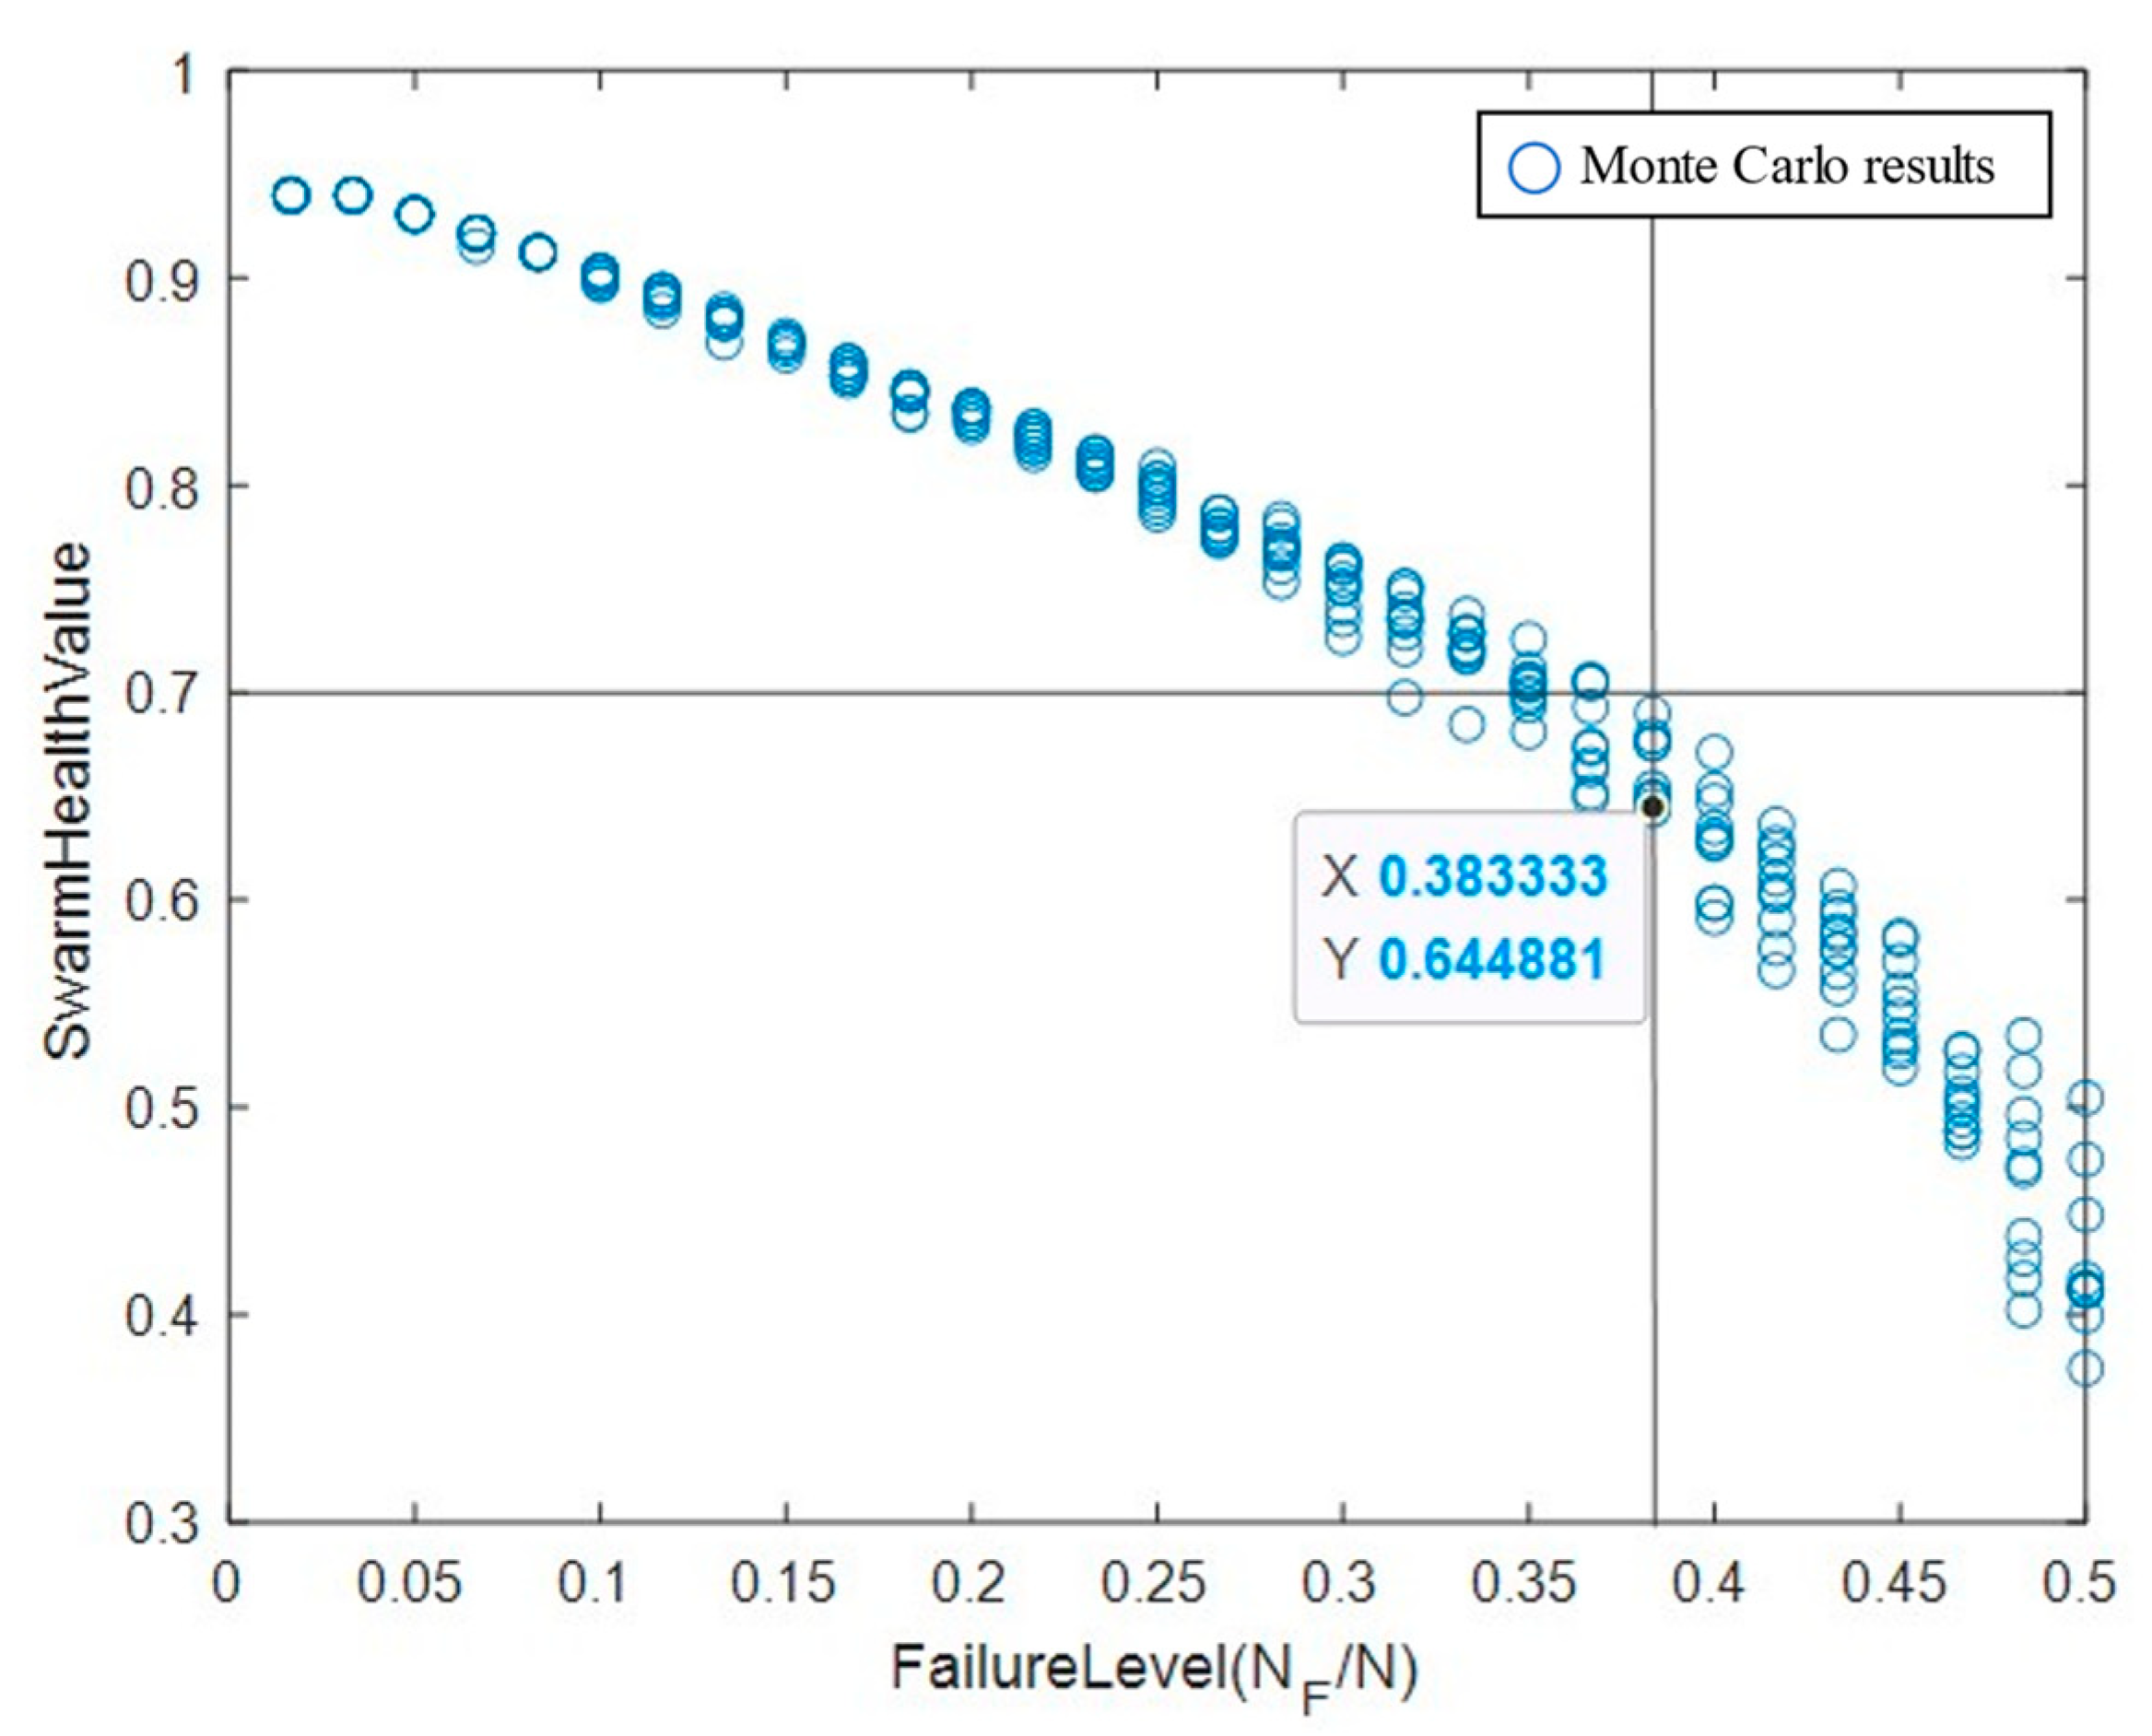
After collecting health state data 300 times, the health state data are sorted according to the severity of the fault from low to high, producing the simulation results in Figure 8. The ratio of faulty satellites to the total number of satellites ( N F / N ) is calculated, and the corresponding Monte Carlo optimal health state value is selected, yielding the simulation results in Figure 9.
From the simulation results in Figure 7:
  • For a satellite swarm with 61 satellites, when the number of faulty satellites is in the range [1, 30], the reconstruction decision algorithm restores the satellite swarm health state to 0.95~0.4. The optimal health is very close to the average health, and the difference is within 10−3, which shows that the algorithm has high precision.
  • The health state curve is a typical ponytail curve, and nearly 1/3 of the data show that the health state value of the restored satellite swarm is below 0.7; when the health state is less than 0.7, the health state begins to decrease rapidly and fluctuate.
Figure 8 is obtained from Figure 7 by using the fault proportion as the abscissa, which makes the Monte Carlo simulation results more intuitive. It is obvious that the higher the proportion of faulty satellites, the lower the health of the satellite swarm and the more severe the health state jitter, i.e., the health state after fault reconstruction is very uncertain. At the same time, when the health state is 0.7, the proportion of faulty stars is 38%. That is, for the mission satellite swarm when the number of faulty satellites exceeds 38%, the health state of the entire swarm becomes unstable. Therefore, it is possible to obtain the fault threshold of the satellite swarm, which can be used to manage it.

5. Conclusions

In this paper, the problem of reconstructing a satellite swarm after faults occur is analyzed, and a reconstruction optimization algorithm based on hybrid multi-objective optimization is proposed. Taking the health state of the satellite swarm, the total energy consumption of reconstruction, and the balance of the fuel consumption as the optimization indicators, the optimal strategy of the fault reconstruction is solved using mixed multi-objective weighting and a genetic algorithm; then, simulation verification is carried out on a typical case. Finally, the effectiveness of the reconstruction algorithm is verified by Monte Carlo simulation. The simulation results show that as the number of population iterations increases, the fitness value will gradually approach the global optimum, and the curve shows convergence. Therefore, the reconstruction algorithm proposed in this paper provides the optimal reconstruction scheme for satellite swarms with different fault degrees. At the same time, the Monte Carlo simulation shows that the iteration of the algorithm has high precision, and the change in the health state of the satellite swarm conforms to the ponytail curve of the faulty spacecraft. When the number of faulty satellites exceeds 38%, the health state of the entire swarm becomes unstable. Therefore, a fault threshold can be given for faulty satellite swarms, which can be used to effectively manage satellite swarms.
In the future, more reconstruction indicators will be introduced into the system to improve the overall efficiency of the satellite swarm. In addition, the efficiency of the multi-objective reconstruction planning algorithm will be improved, thereby increasing the practicability of on-orbit calculations.

Author Contributions

Conceptualization, G.K. and X.Y.; methodology, X.Y. and Z.Y.; software, X.Y. and Z.Y.; validation, J.W.; writing—original draft preparation, X.Y.; writing—review and editing, G.K. and Z.Y.; visualization, X.Y.; project administration, G.K.; funding acquisition, G.K. All authors have read and agreed to the published version of the manuscript.

Funding

This research received no external funding.

Institutional Review Board Statement

Not applicable.

Informed Consent Statement

Not applicable.

Data Availability Statement

Not applicable.

Conflicts of Interest

The authors declare no conflict of interest. The funders had no role in the study’s design; in the collection, analyses, or interpretation of data; in the writing of the manuscript; or in the decision to publish the results.

References

  1. Alvarez, J.; Walls, B. Constellations, clusters, and communication technology: Expanding small satellite access to space. In Proceedings of the 2016 IEEE Aerospace Conference, Big Sky, MT, USA, 5–12 March 2016; IEEE: Piscataway Township, NJ, USA, 2016. [Google Scholar] [CrossRef]
  2. McDowell, J.C. The Low Earth Orbit Satellite Population and Impacts of the SpaceX Starlink Constellation. Astrophys. J. 2020, 892, L36. [Google Scholar] [CrossRef]
  3. Dong, F.; Li, X.; Yao, Q.; He, Y.; Wang, J. Topology structure design and performance analysis on distributed satellite cluster networks. In Proceedings of the 2015 4th International Conference on Computer Science and Network Technology (ICCSNT), Harbin, China, 19–20 December 2015; IEEE: Piscataway Township, NJ, USA, 2015; Volume 1. [Google Scholar] [CrossRef]
  4. Yang, H.; Jiang, B.; Cocquempot, V. Decentralized fault tolerant formation control for a class of tethered space-craft. IFAC-PapersOnLine 2015, 48, 1128–1133. [Google Scholar] [CrossRef]
  5. Zhang, C.; Wang, J.; Zhang, D.; Shao, X. Fault-tolerant adaptive finite-time attitude synchronization and tracking control for multi-spacecraft formation. Aerosp. Sci. Technol. 2018, 73, 197–209. [Google Scholar] [CrossRef]
  6. Li, J.; Kumar, K.D. Decentralized Fault-Tolerant Control for Satellite Attitude Synchronization. IEEE Trans. Fuzzy Syst. 2011, 20, 572–586. [Google Scholar] [CrossRef]
  7. Yang, H.; Jiang, B.; Cocquempot, V.; Chen, M. Spacecraft formation stabilization and fault tolerance: A state-varying switched system approach. Syst. Control Lett. 2013, 62, 715–722. [Google Scholar] [CrossRef]
  8. Peng, X. Study on Some Key Techniques of Autonomous Health Management for Spacecraft Propulsion System. Ph.D. Thesis, National University of Defense Technology, Changsha, China, 2017. [Google Scholar] [CrossRef]
  9. Rosenberg, R.S. Stimulation of genetic populations with biochemical properties: I. The model. Math. Biosci. 1970, 7, 223–257. [Google Scholar] [CrossRef]
  10. Schaffer, J.D. Some Experiments in Machine Learning Using Vector Evaluated Genetic Algorithms. Ph.D. Thesis, Vanderbilt University, Nashville, TN, USA, 1985. [Google Scholar]
  11. Palacios, V.; Héctor, L. Translation-Based Approaches to Conformant Planning; Universitat Pompeu Fabra: Barcelona, Spain, 2009. [Google Scholar]
  12. Palacios, H.; Geffner, H. Compiling Uncertainty Away in Conformant Planning Problems with Bounded Width. J. Artif. Intell. Res. 2009, 35, 623–675. [Google Scholar] [CrossRef]
  13. Palacios, H. Pruning Conformant Plans by Counting Models on Compiled d-DNNF Representations. ICAPS 2005, 5, 141–150. [Google Scholar]
  14. Deb, K.; Kalyanmoy, D. Multi-objective optimization. In Search Methodologies: Introductory Tutorials in Optimization and Decision Support Techniques; Springer: Boston, MA, USA, 2013; pp. 403–449. [Google Scholar]
  15. Li, H.; Zhang, Q. Multi-objective Optimization Problems with Complicated Pareto Sets, MOEA/D and NSGA-II. IEEE Trans. Evol. Comput. 2008, 13, 284–302. [Google Scholar] [CrossRef]
  16. Zhang, Q.; Li, H. MOEA/D: A Multi-objective Evolutionary Algorithm Based on Decomposition. IEEE Trans. Evol. Comput. 2007, 11, 712–731. [Google Scholar] [CrossRef]
  17. Qi, Y.; Ma, X.; Liu, F.; Jiao, L.; Sun, J.; Wu, J. MOEA/D with Adaptive Weight Adjustment. Evol. Comput. 2014, 22, 231–264. [Google Scholar] [CrossRef] [PubMed]
  18. Lalwani, S. A comprehensive survey: Applications of multi-objective particle swarm optimization (MOPSO) algorithm. Trans. Comb. 2013, 2, 39–101. [Google Scholar]
  19. Coello, C.A.C.; Lechuga, M. MOPSO: A proposal for multiple objective particle swarm optimization. In Proceedings of the 2002 Congress on Evolutionary Computation, Honolulu, HI, USA, 12–17 May 2003; Volume 2, pp. 1051–1056. [Google Scholar]
  20. Borhanazad, H.; Mekhilef, S.; Ganapathy, V.G.; Modiri-Delshad, M.; Mirtaheri, A. Optimization of micro-grid system using MOPSO. Renew. Energy 2014, 71, 295–306. [Google Scholar] [CrossRef]
  21. Deb, K.; Pratap, A.; Agarwal, S.; Meyarivan, T. A fast and elitist multi-objective genetic algorithm: NSGA-II. IEEE Trans. Evol. Comput. 2002, 6, 182–197. [Google Scholar] [CrossRef]
  22. Xia, Z.; Ma, L. An Improved NSGA-II algorithm for multi-objective nonlinear optimization. Microelectron. Comput. 2020, 37, 47–53. [Google Scholar]
  23. Yusoff, Y.; Ngadiman, M.S.; Zain, A.M. Overview of NSGA-II for Optimizing Machining Process Parameters. Procedia Eng. 2011, 15, 3978–3983. [Google Scholar] [CrossRef]
  24. Xiao, X. Overview on multi-objective optimization problem research. Appl. Res. Comput. 2011, 28, 805–808. [Google Scholar]
  25. Li, Z. Overview of Constrained Optimization Evolutionary Algorithms. J. Softw. 2017, 28, 1529–1546. [Google Scholar]
  26. Xu, B. Research and Application of Multi-Objective Optimization Algorithms Base on Differential Evolution. Ph.D. Thesis, East China University of Science and Technology, Shanghai, China, 2013. [Google Scholar]
  27. Yang, G. Research on Multi-objective Decision-Making Problems and Their Solving Methods. J. Math. Pract. Theory 2012, 24, 108–115. [Google Scholar]
  28. Underwood, C. Using CubeSat/micro-satellite technology to demonstrate the Autonomous Assembly of a Reconfigurable Space Telescope (AAReST). Acta Astronaut. 2015, 114, 112–122. [Google Scholar] [CrossRef]
  29. Li, X. Finite Thrust Orbit Interception Optimization Using Hybrid Genetic Algorithm. Comput. Simul. 2010, 27, 20–23. [Google Scholar]
  30. Ghiasi, H.; Damiano, P.; Larry, L. A non-dominated sorting hybrid algorithm for multi-objective optimization of engineering problems. Eng. Optim. 2011, 43, 39–59. [Google Scholar] [CrossRef]
  31. Kang, G.; Zhang, H.; Wei, J.; Wu, J.; Zhang, L. Spacecraft Continuous Dynamic Obstacle Avoidance Trajectory Planning with Optimal Energy. J. Astronaut. 2021, 42, 305–313. [Google Scholar]
  32. Kang, G.; Yuan, X.; Wu, J.; Yang, Z. Mission-Oriented Real-Time Health Assessments of Microsatellite Swarm Orbits. Appl. Sci. 2022, 12, 5605. [Google Scholar] [CrossRef]
  33. Yoo, S.-M.; Lee, S.; Park, C.; Park, S.-Y. Spacecraft fuel-optimal and balancing maneuvers for a class of formation reconfiguration problems. Adv. Space Res. 2013, 52, 1476–1488. [Google Scholar] [CrossRef]
  34. Su, B.; Xie, N. Research on safety evaluation of civil aircraft based on the grey clustering model. Grey Syst. Theory Appl. 2018, 8, 110–120. [Google Scholar] [CrossRef]
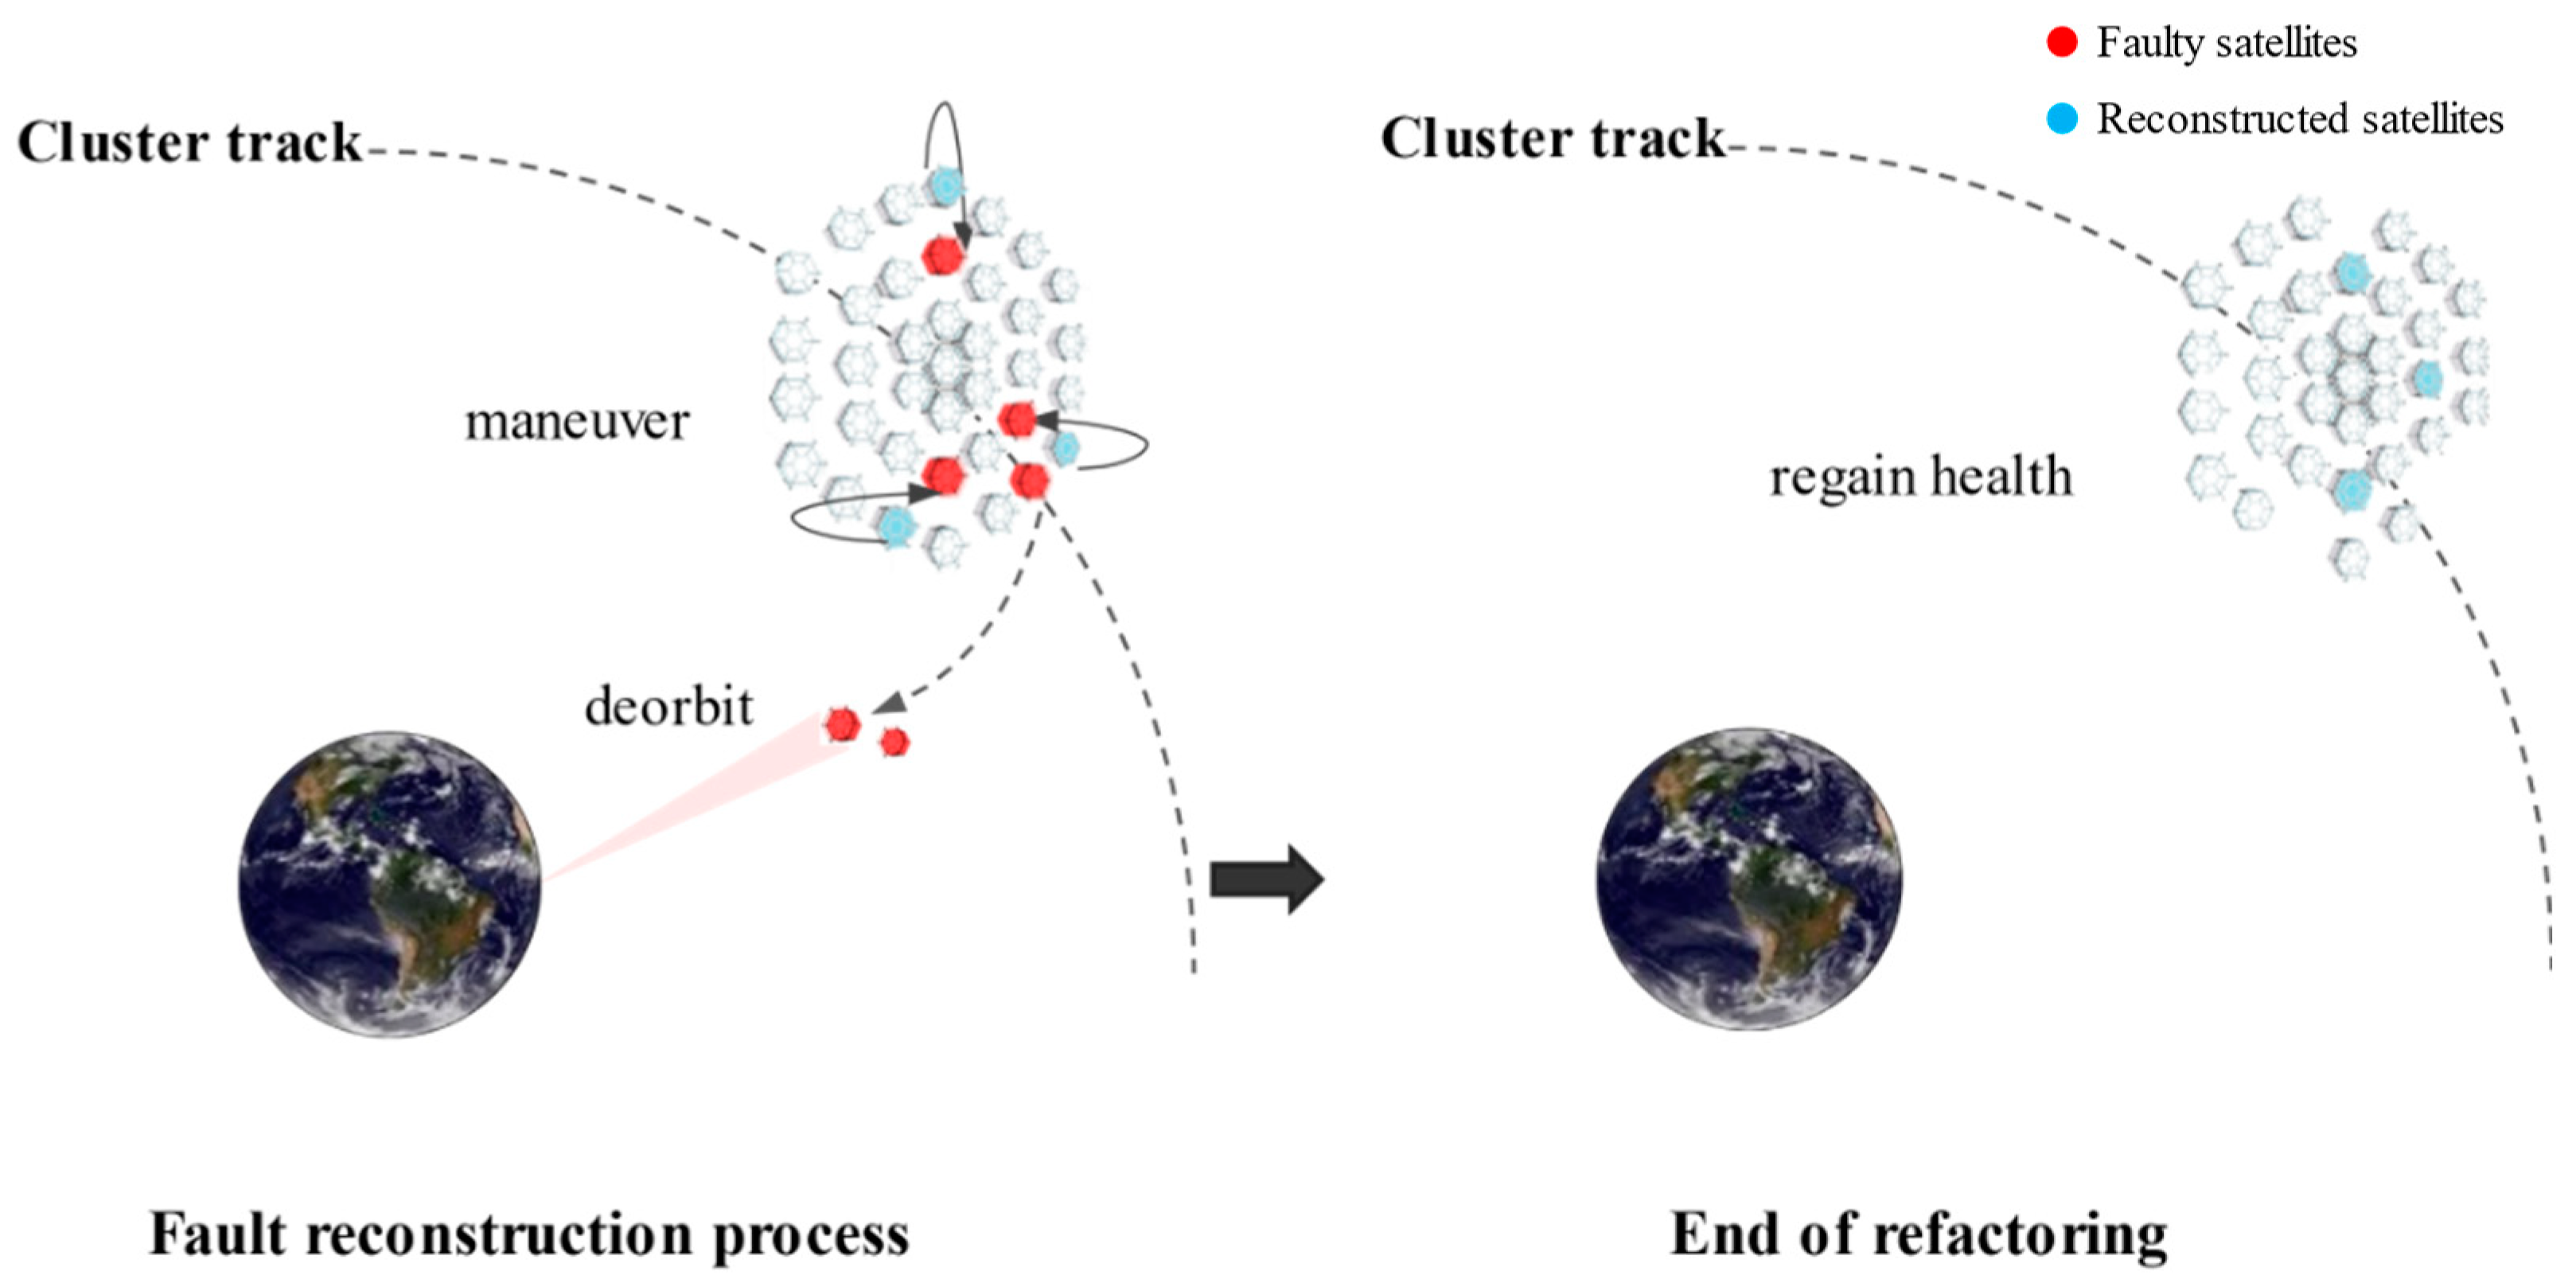
Figure 1. Schematic diagram of satellite swarm fault reconstruction.
Applsci 13 06674 g001
Figure 2. Schematic diagram of the two-dimensional structure of two reconstruction states: (a) Before failure; (b) Before reconstruction; (c) After reconstruction.
Applsci 13 06674 g002
Figure 3. Relative motion model.
Applsci 13 06674 g003
Figure 4. Decision tree of multi-objective fault reconstruction.
Applsci 13 06674 g004
Figure 5. Schematic diagram of the genetic code.
Applsci 13 06674 g005
Figure 6. Flowchart of the hybrid multi-objective genetic algorithm.
Applsci 13 06674 g006
Figure 7. Fault reconstruction results: (a) Adaptation change; (b) Optimal reconstruction scheme.
Applsci 13 06674 g007
Figure 8. Satellite swarm health state curve after Monte Carlo simulation.
Applsci 13 06674 g008
Figure 9. Satellite swarm health as a function of failure level.
Applsci 13 06674 g009
Table 1. Model parameters.
ParameterValue
N u m 61
a 30 m
S F [10, 18, 33, 40, 44, 53]
μ 3.986 × 10¹⁴ m3/s2
R s 6958 × 103 m
t f 100 s
Table 2. Initial position of the faulty satellite in the relative coordinate system.
Module S F X / m Y / m Z / m
1 S 10 03051.9615
2 S 18 030−51.9615
3 S 33 0−15−77.9423
4 S 40 09051.9615
5 S 44 00103.9230
6 S 53 0−75−77.9423
Table 3. Initial values of the two satellite reconstructions in the relative coordinate system.
ModuleSF X / m Y / m Z / m X ˙ / ( m / s ) Y ˙ / ( m / s ) Z ˙ / ( m / s )
1 x 1 x x 1 0 y x 1 30 z x 1 51.9615 000
2 x 2 x x 2 0 y x 2 30 z x 2 + 51.9615 000
3 x 3 x x 3 0 y x 3 + 15 z x 3 + 77.9423 000
4 x 4 x x 4 0 y x 4 90 z x 4 51.9615 000
5 x 5 x x 5 0 y x 5 0 z x 5 103.9230 000
6 x 6 x x 6 0 y x 6 + 75 z x 6 + 77.9423 000
Disclaimer/Publisher’s Note: The statements, opinions and data contained in all publications are solely those of the individual author(s) and contributor(s) and not of MDPI and/or the editor(s). MDPI and/or the editor(s) disclaim responsibility for any injury to people or property resulting from any ideas, methods, instructions or products referred to in the content.