Abstract
The hybrid Ice Protection System combining thermoelectric and superhydrophobic coating is efficient and benefits from low-energy consumption. In order to explore the application details of superhydrophobic coating, this paper investigated the sensitivities of the Ice Protection System parameters including the range of the superhydrophobic coating, heating range and power to icing environmental parameters. In this paper, an icing wind tunnel test was adopted to study the performance of this Ice Protection System under different icing conditions, as well as the influence of the superhydrophobic coating range, heating range and power variation on ice protection. The results showed that the superhydrophobic coating is effective only when it covers the droplet impingement area, with the heating power requirement emerging as a critical design consideration that is extremely sensitive to environmental temperature changes. Additionally, median volumetric diameter determines the protection area to be protected, while liquid water content variation has little effect on the designed Ice Protection System in contrast.
1. Introduction
Icing on key parts of an aircraft, such as wings, tails and engines, poses a threat to flight safety [1]. To tackle this issue, various ice protection systems have been developed and widely used, including thermal, pneumatic, electro-mechanic and anti-/de-icing fluid systems [2,3]. Although these ice protection systems have been effective, the increasing emphasis on safety requirements and limited aircraft energy capacity have exposed the conflict between the two. For instance, the hot-air ice protection system utilizes engine-generated hot air that affects engine power. In adverse weather conditions, when the hot air is insufficient, surface heating cannot ensure the complete evaporation of impinging water droplets, and part of the supercooled water impinging on the surface will freeze and form runback ice after flowing over the protected area [4]. That is the major cause of the ATR72 accident in Roselawn in 1994 [5]. The thermoelectric ice protection system has been widely used in helicopter blades, windshields, instruments, etc. However, with components such as wings and tails, due to the limited power supply of the aircraft, it typically operates periodically or continuously provides less heat only to maintain water on the surface in its liquid state [6], resulting in weak ice protection. Pneumatic, electro-mechanic ice protection system and anti-/de-icing fluid would negatively impact aerodynamic performance or add extra weight.
With advances in material technology, researchers attempted to develop a kind of icephobic coating that can passively reduce or delay ice formation without energy consumption. However, almost all coatings could not achieve the desired goal [7,8,9]. Alternatively, hydrophobic or superhydrophobic coatings have been used to decrease the power required for ice protection by facilitating droplet removal when subjected to shear flow. In 2007, Kimura et al. [10] tested a mixture of acrylic urethane resin and polytetrafluoroethylene named AIS, and the results showed less difference in performance when no heating was performed. There was less ice on the AIS, but the test did not reflect whether it was due to the icephobic or hydrophobic properties. In 2009, Cao et al. [11] examined the ice formation process of supercooled water drops on surfaces with different hydrophobic characteristics and confirmed that the hydrophobic property had a significant impact on icing. In subsequent studies, Antonini et al. [12] investigated the reasons why superhydrophobic coatings reduce energy consumption and determined that they reduced water droplet aggregation on the surface and promote water droplets’ falling off the surface, resulting in fewer droplets freezing. Mangini et al. [13], by comparing runback ice formed on a hydrophilic surface and a superhydrophobic surface, believed that surface wetting state played an important role in the icing process. Yin et al. [14] found that the decreasing contact angle would lead to an increase in the angle needed for droplet inclined rolling. The movement of water droplets on the surface deteriorates rapidly under the condition of high relative humidity and low temperature. In 2011, Fortin et al. [15] combined thermoelectric and hydrophobic coatings and evaluated the behavior of various hydrophobic coatings under glaze and rime icing conditions. The energy savings achieved were about 33% for glaze ice and about 13% for rime ice compared to ice protection systems used with no coating [15]. In 2017, Pauw et al. [16] studied the behavior of superhydrophobic coating on an airfoil model equipped with a thermal ice protection system and found no ice formation when maintaining the superhydrophobic coating surface temperature above 4 °C, while the ice protection system surface with no coating needs at least 70 °C in the same condition. They inferred that there would be no ice formation if the impingement area was covered with a superhydrophobic coating and the temperature was maintained above 6 °C.
The literature suggests two main perspectives: (1) Coatings with better superhydrophobic behavior, characterized by larger contact-angles and smaller roll-off-angles, achieve superior anti-icing performance. To address this perspective, novel coatings must be developed. (2) Combining thermoelectric and superhydrophobic coatings represents an efficient and low-energy consumption method for preventing ice formation. This perspective requires research into the design methods for the combined use of these coatings, which is a focus of this study. The literature has focused on the anti-icing mechanisms of superhydrophobic coatings, the reason why it reduces energy consumption, the effectiveness of different superhydrophobic coatings and the reduction of energy consumption. However, less attention has been paid to the engineering problems associated with the application of superhydrophobic coatings, such as their layout and internal heating area. To address these issues, similar to the design of thermoelectric and hot-air anti-icing systems, it is crucial to investigate the effects of various parameters of the anti-icing system, including the heating range and the layout of superhydrophobic coatings, under different icing conditions. This research provides valuable insights into the design of anti-icing system parameters specific to different icing conditions and offers actionable methods for the design and development of anti-icing systems that combine thermoelectric and superhydrophobic coatings.
This study provides fundamental research data to guide the future design of the Ice Protection System with a superhydrophobic coating (IPS). The data include the sensitivities of IPS to icing environmental parameters, as well as protective effects at different IPS parameters. The IPS parameters include the superhydrophobic coating range, heating range and power. Moreover, the environment parameters include median volumetric diameter (MVD), liquid water content (LWC) and environment temperature. These data can help guide the design of this type of IPS in the future.
2. Experimental Methodology
2.1. Experimental Setup
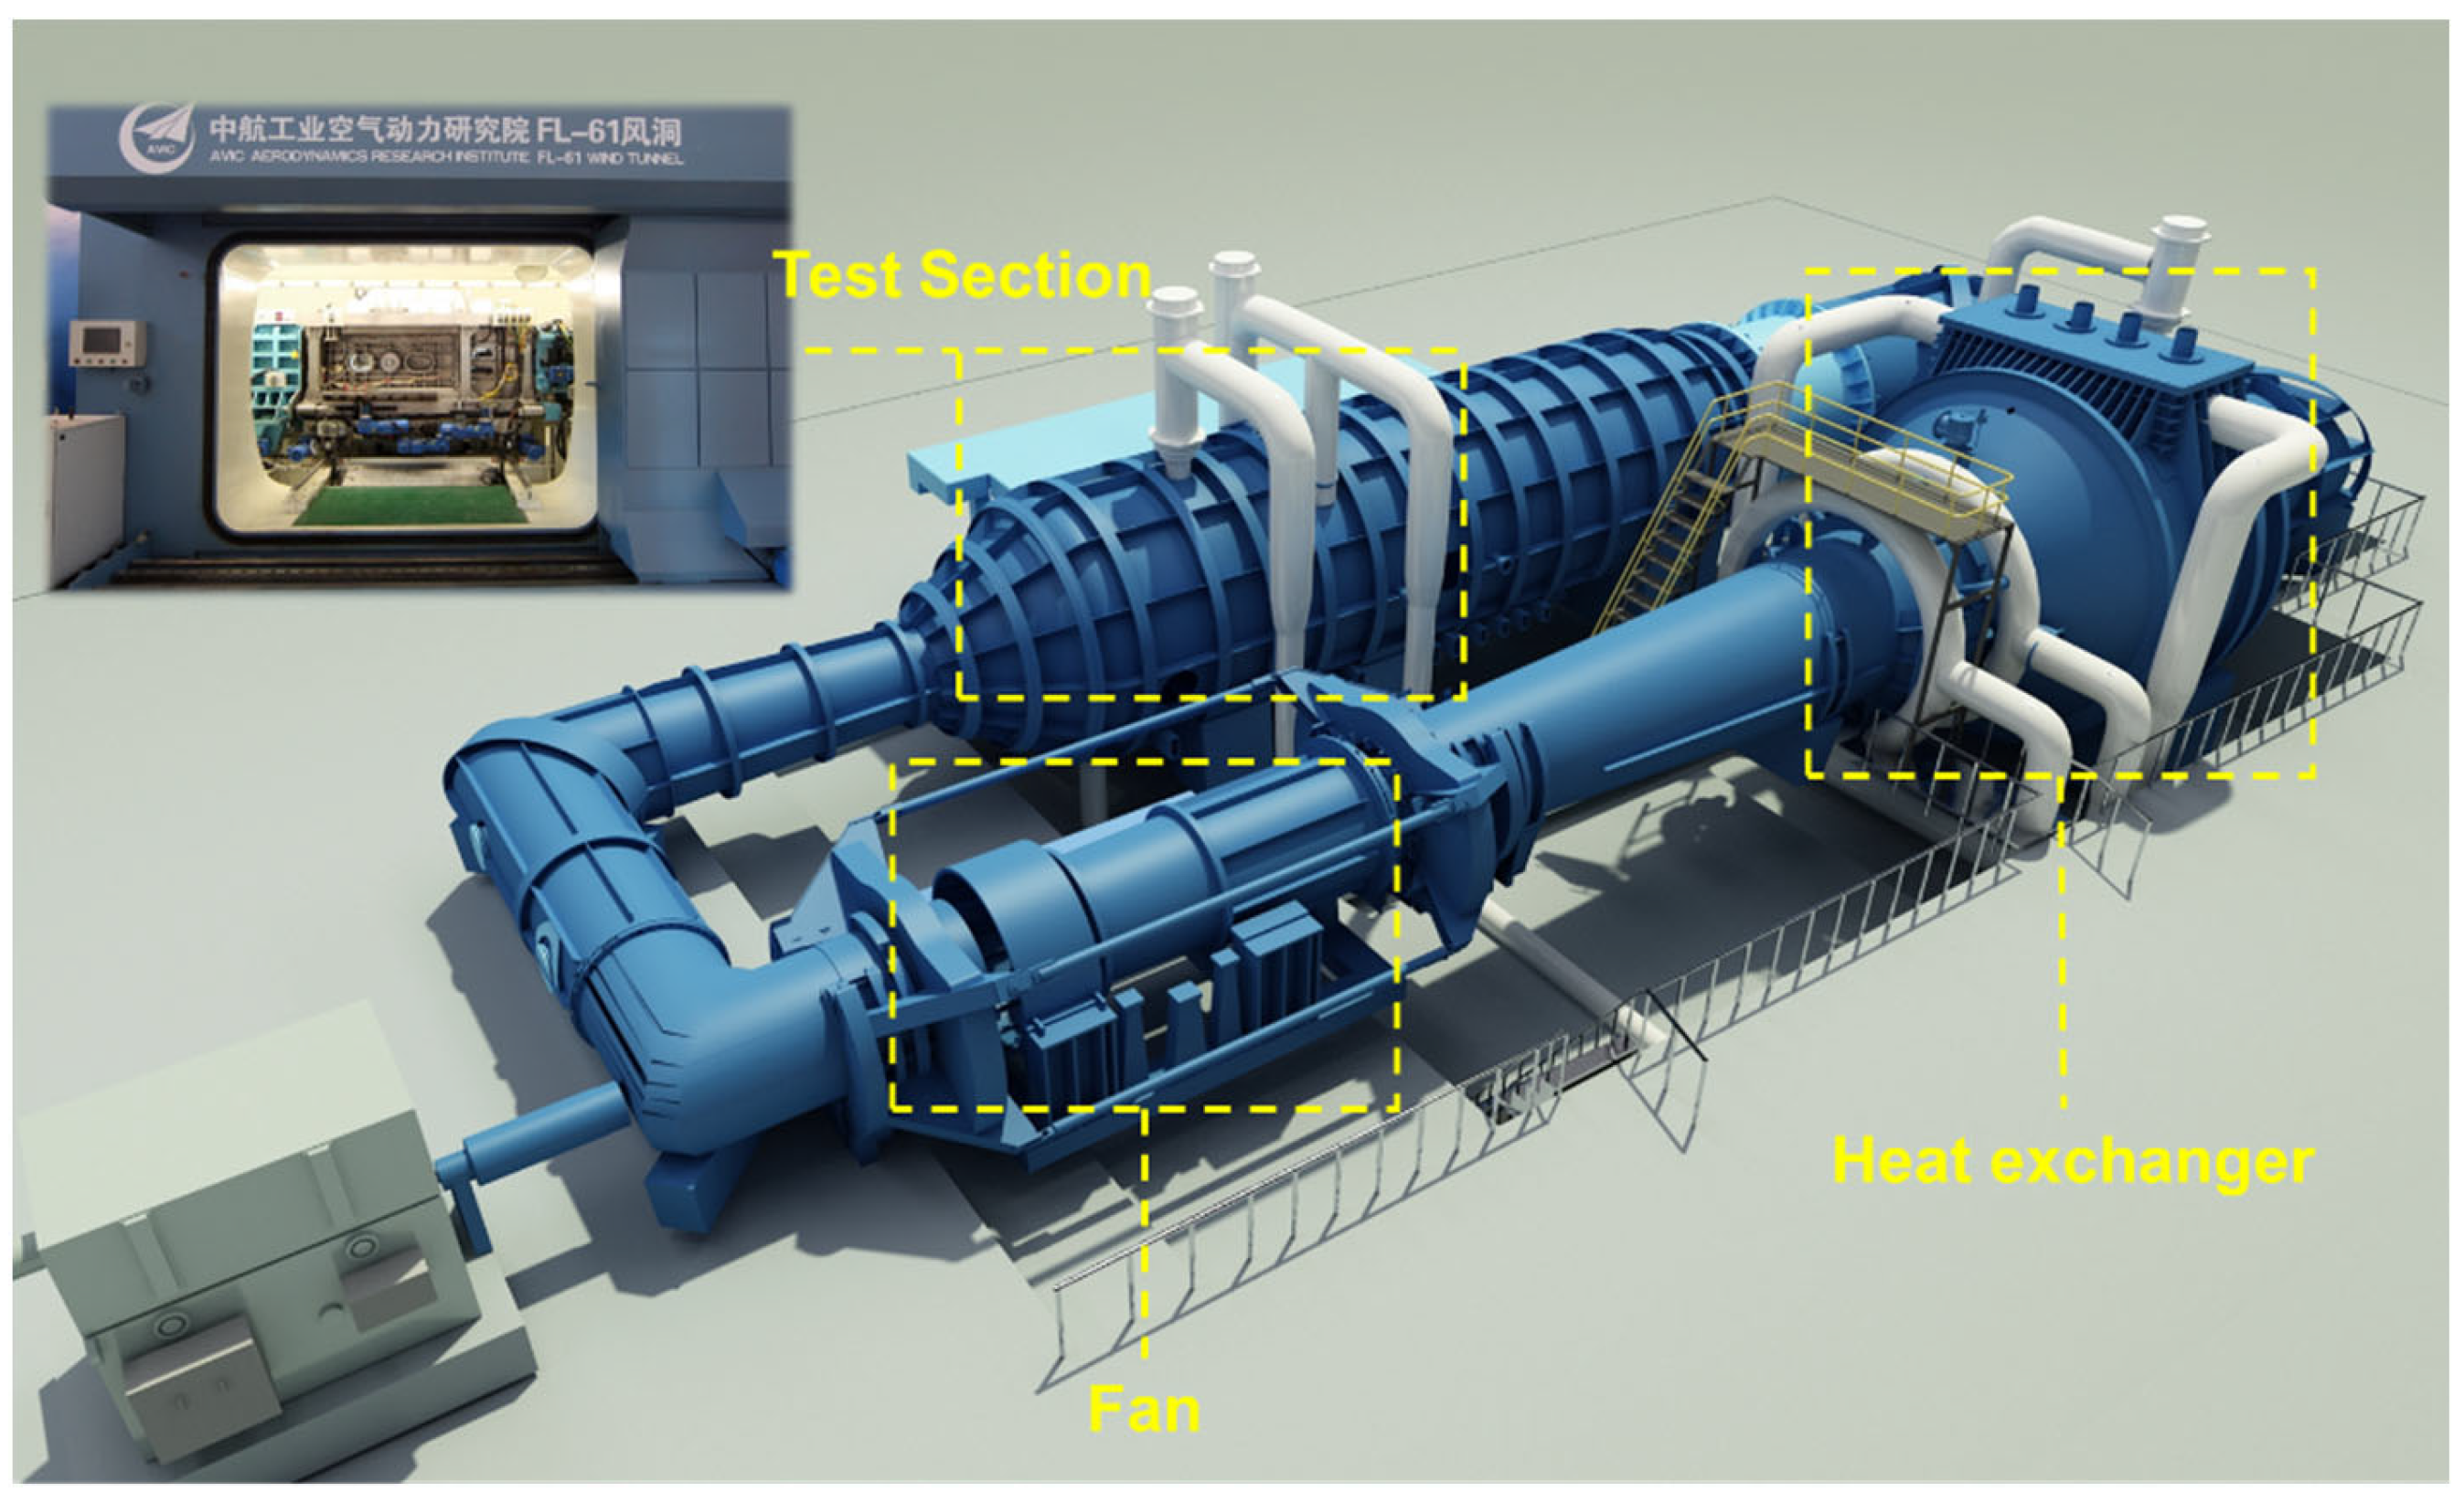
The tests were conducted in a FL-61 icing wind tunnel at the AVIC Aerodynamic Research Institute. As shown in Figure 1, FL-61 facility is a closed loop circuit refrigerated wind tunnel with a test section size of 0.6 m × 0.6 m × 2.7 m, driven by a 5200 kW main compressor and a 2500 kW auxiliary compressor. This facility can simulate altitude effect on ice accretion up to 7000 m. The maximum wind speed achievable in the test section is up to 240 m/s. Refrigeration of the air flow is achieved via a heat exchanger located upstream of the third corner, with the minimum temperature attainable being −40 °C. The system accuracy is ±2 °C when the temperature falls below −30 °C and ±0.5 °C within the range of −30 °C to 5 °C. The cloud uniformity in the test section is within ±20%. The tunnel is equipped with both a thermoelectric de-icing supply and a hot-air de-icing system supply making it capable of ice protection system tests.
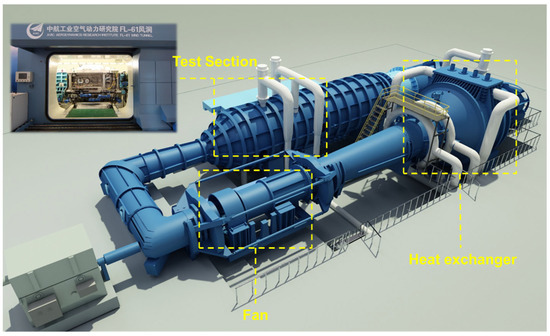
Figure 1.
FL-61 icing wind tunnel.
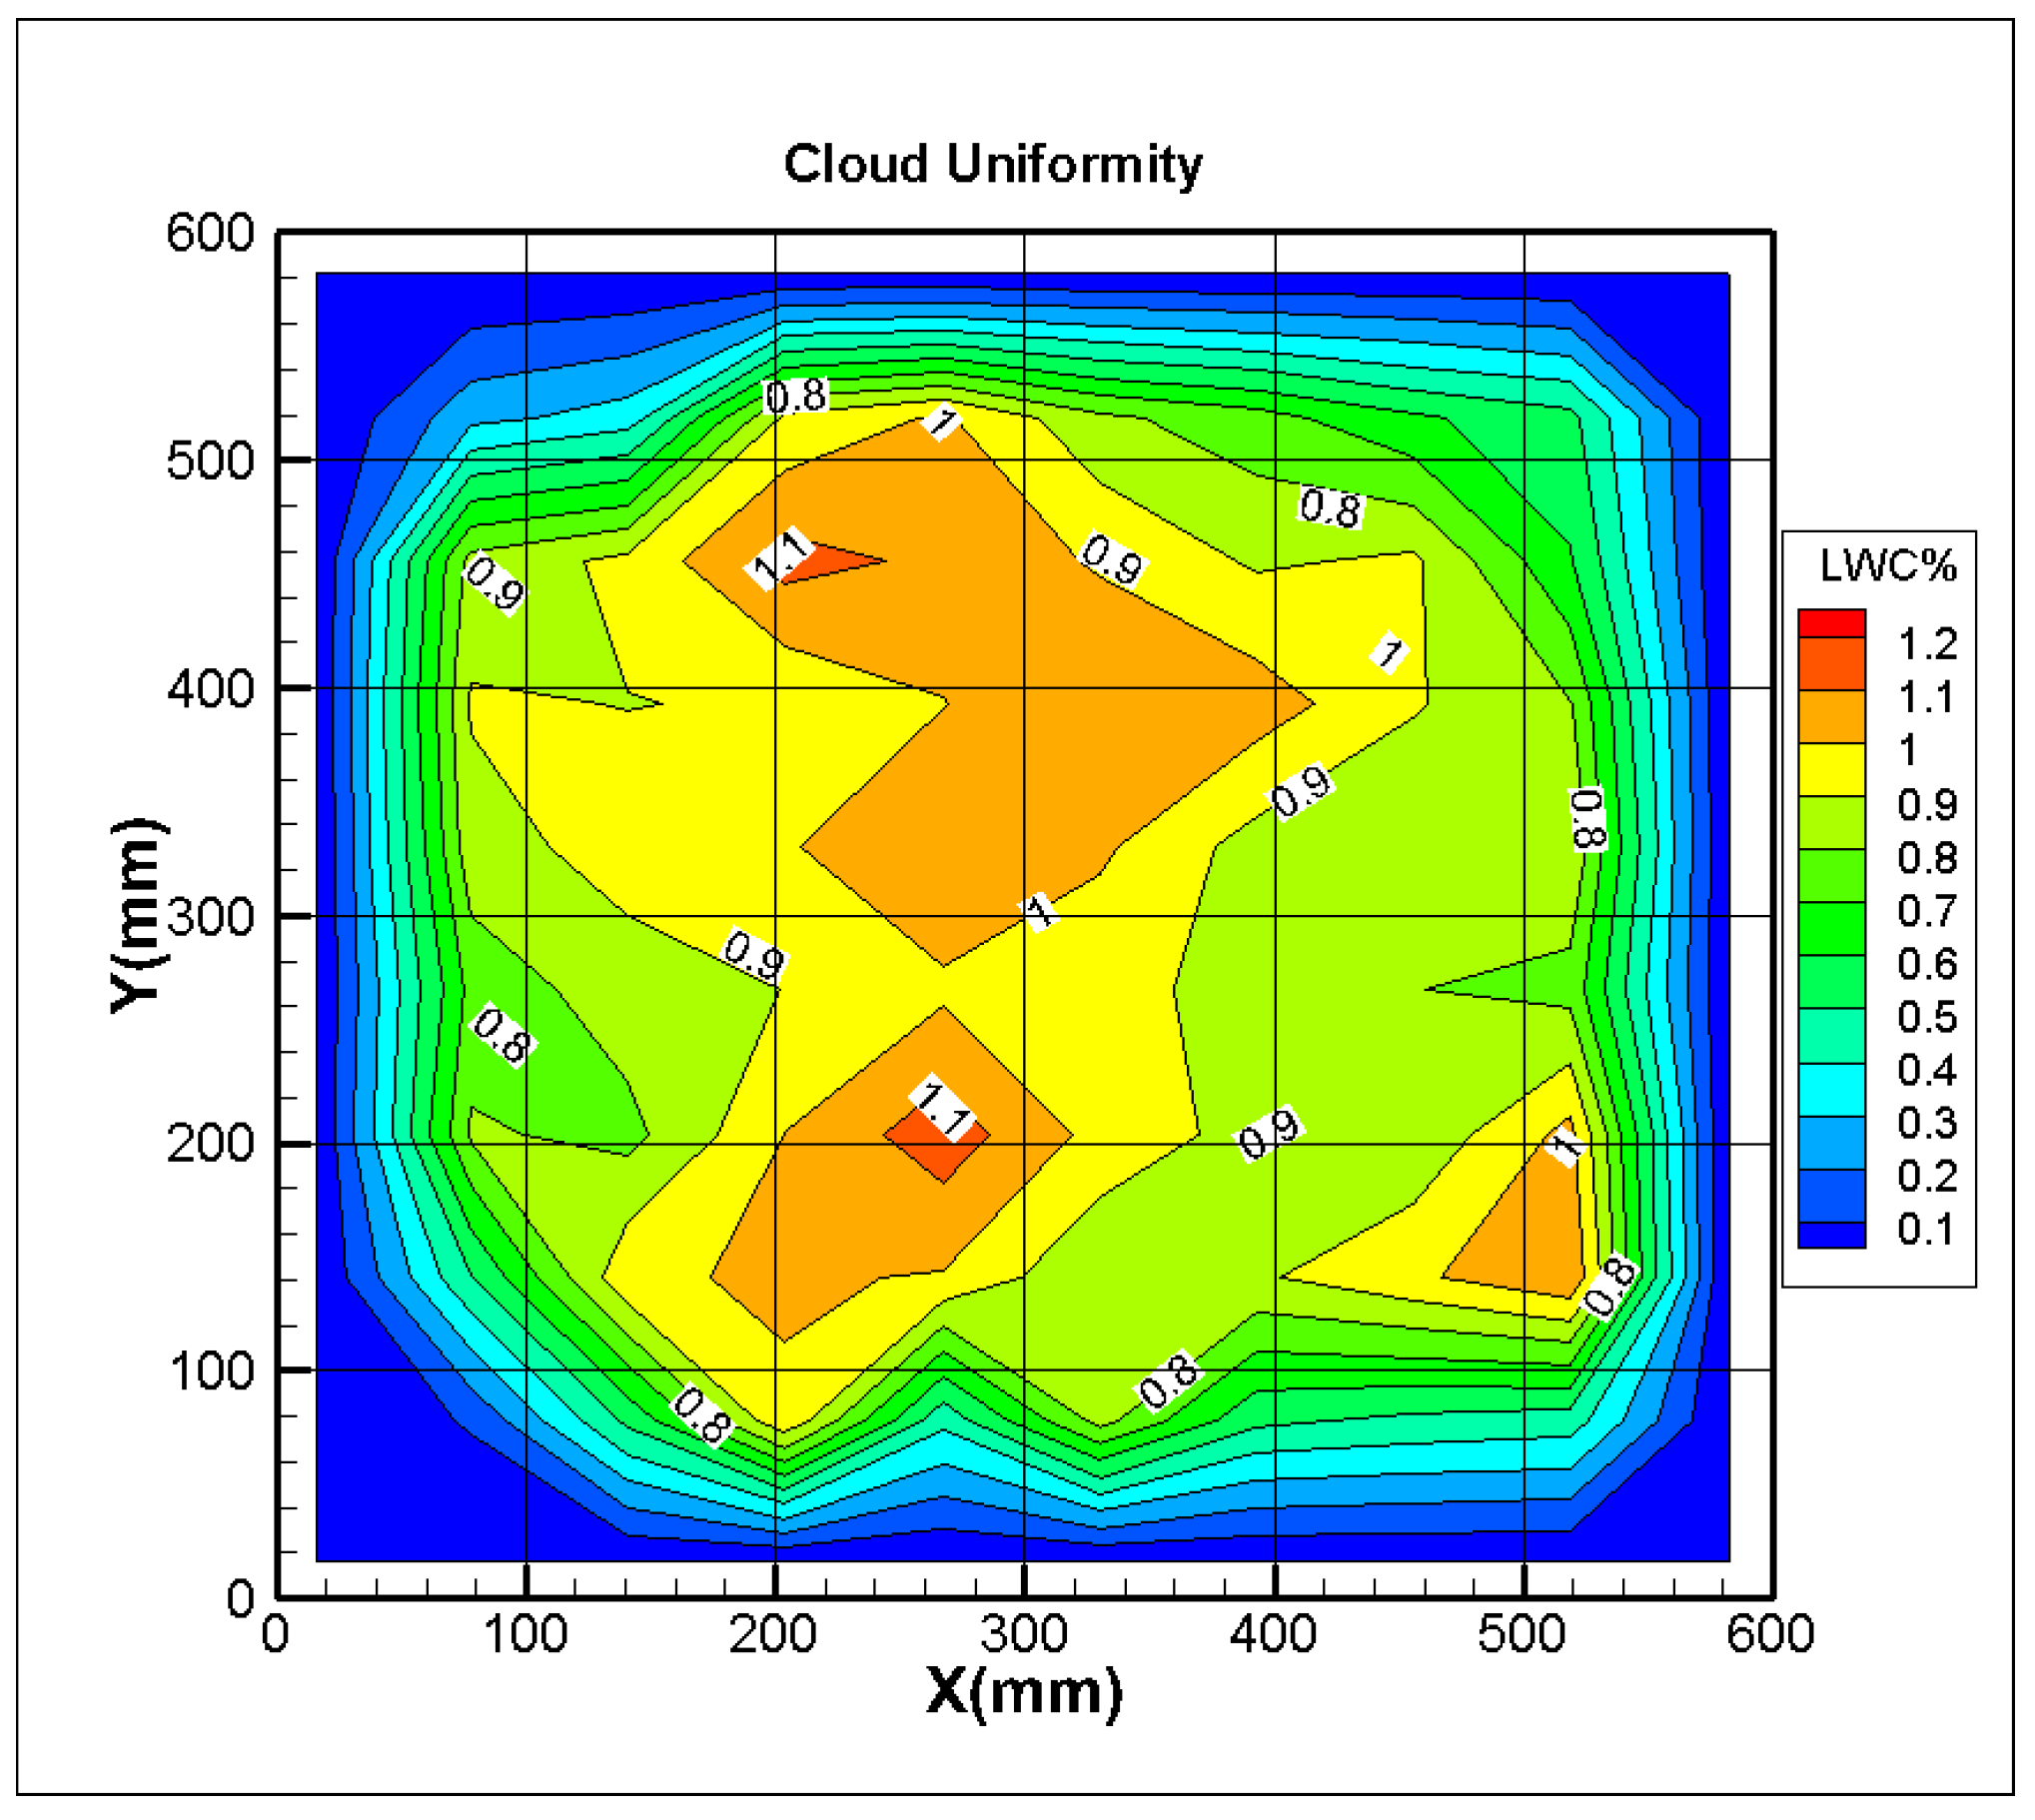
This facility is calibrated annually and conforms to the SAE Aerospace Recommended Practice 5905 document. An additional calibration of LWC’s spatial uniformity in the test section was performed before this experiment. One typical cloud uniformity result was shown in Figure 2.
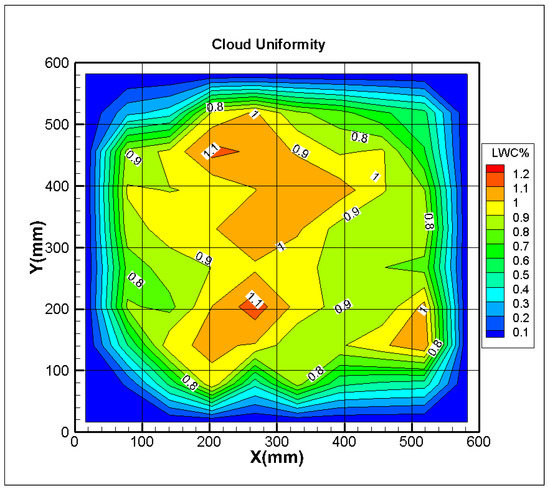
Figure 2.
Icing cloud uniformity (V = 90 m/s, LWC = 1 g/m3, MVD = 20 μm).
2.2. Test Model
The model used in this study was a 2 D NACA0012 airfoil model with a sweep angle of 15°, as shown in Figure 3a. The NACA0012 airfoil is frequently utilized in aerodynamics research. Its upper and lower surfaces’ symmetrical characteristics facilitate comparative analysis of these regions. Therefore, it sees widespread employment in the research shown above. The model had a chord of 500 mm and a span of 600 mm, suspended in the test section. This model size was selected based on the maximum allowable size within the FL-61 icing wind tunnel. As shown in Figure 3b, five electric heating sheets were installed chordwise within the leading edge of the model to simulate the thermoelectric ice protection system, with each sheet’s heating power controlled separately via voltage control. All sheets covered the whole spanwise area. White lines drawn in the leading edge signified the position of the heating sheets. Additionally, lines were drawn in the rear spaced 2 cm apart, serving as a visual measure of icing extent, as shown in Figure 3a. The parameters of each sheet are shown in Table 1. Sheets A, B and C covered the droplet impingement area analyzed using numerical simulation methods during the initial stage, while sheets D and E were reserved for further heating purposes. The heating sheet distribution, with a narrow sheet in the leading edge and large sheets in the rear, was designed referencing aircraft ice protection system layout. In order to measure the model surface temperature, 9 thermocouples were arranged in the leading edge of the middle section spanwise of the model with the positions of each thermocouple detailed in Table 2. Due to possible significant temperature variations near the stagnation point of the leading edge, three thermocouples were arranged on sheet A. As the temperature gradient changed continuously after the leading edge, two thermocouples were positioned approximately 1/3 and 2/3 along sheet B and C, respectively, with one additional thermocouple on each of the sheets D and E. These thermocouples measured temperature fluctuations twice a second, with an accuracy of approximately ±0.5 °C after calibration.
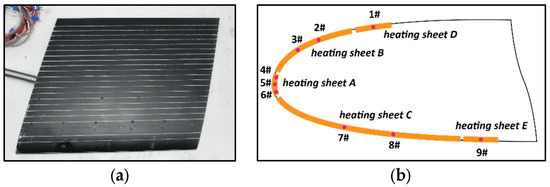
Figure 3.
Test model. (a) Test model (top view), (b) Heating sheets and thermocouples layout.

Table 1.
Heating sheets parameters.
Table 2.
Thermocouples position.
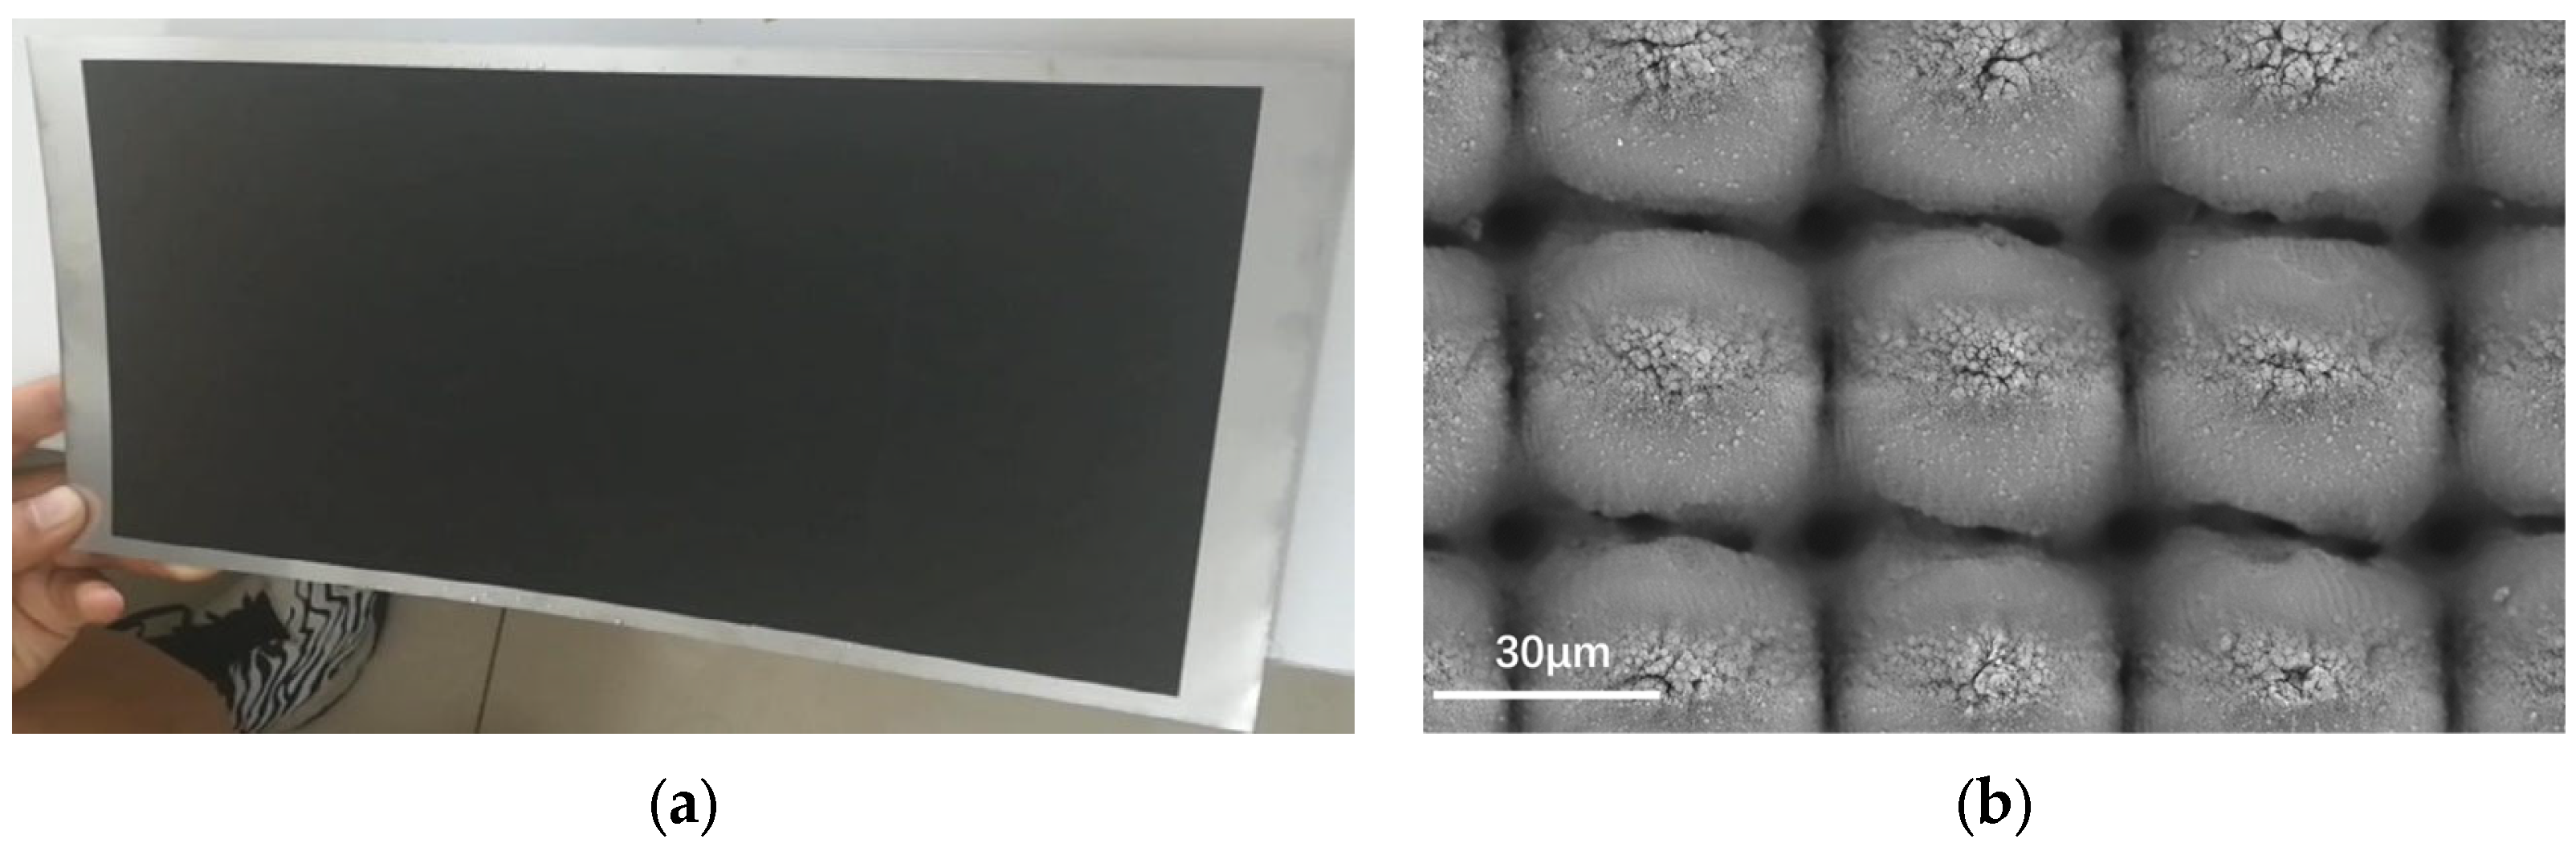
Superhydrophobic coatings (Figure 4) were fabricated with laser sources on aluminum (AI) alloy foils (from BondHus, 6061 AI) with a thickness of 300 μm. A fs laser having a wavelength of 1030 nm, a pulse length of 800 fs, average power up to 40 W and beam diameter of around 30 um was used as the laser source. SEM-image is shown in Figure 3b. Contact-angle 150.14° and roll-off-angle 6.63° were measured using a video-based optical contact-angle measurement device.

Figure 4.
Superhydrophobic coating. (a) Coating appearance. (b) SEM-images of the coating.
2.3. Test Conditions
In this experiment, three typical temperatures were selected to simulate glaze ice (−7 °C), mixed ice (−10 °C) and rime ice (−15 °C) at a speed of 90 m/s. The other icing cloud parameters selected were MVD 20, 30 and 40 μm, combined with LWC 0.5, 1, 1.3 and 1.5 g/m3. These parameters represent the typical icing conditions outlined in 14 CFR parts 25, Appendix C (https://www.ecfr.gov/current/title-14/chapter-I/subchapter-C/part-25/appendix-Appendix%20C%20to%20Part%2025 (accessed on 23 March 2023)). Heating sheet area was designed using the numerical simulation method under the speed of 90 m/s, an angle of attack ranging from 0° to 4°, MVD 20 μm and a static temperature of −7 °C. Pre-tests were conducted indicating that a minimum power density of 5 kW/m2 was required to prevent ice forming on the leading edge with a coating.
The test was divided into two parts. The first part (shown in Table 3) explored the sensitivities of a designed superhydrophobic coating range, heating range and power of IPS to icing environmental parameters. The purpose was to evaluate the performance when IPS encountered an icing environment beyond the system’s designated capabilities. Each case maintained the same velocity of 90 m/s, angle of attack of 0° and a testing time of 180 s, while varying MVD, LWC and environmental temperature. Sheets A, B and C were powered on and were covered with superhydrophobic coating, as a basic configuration.
Table 3.
Test condition for part 1.
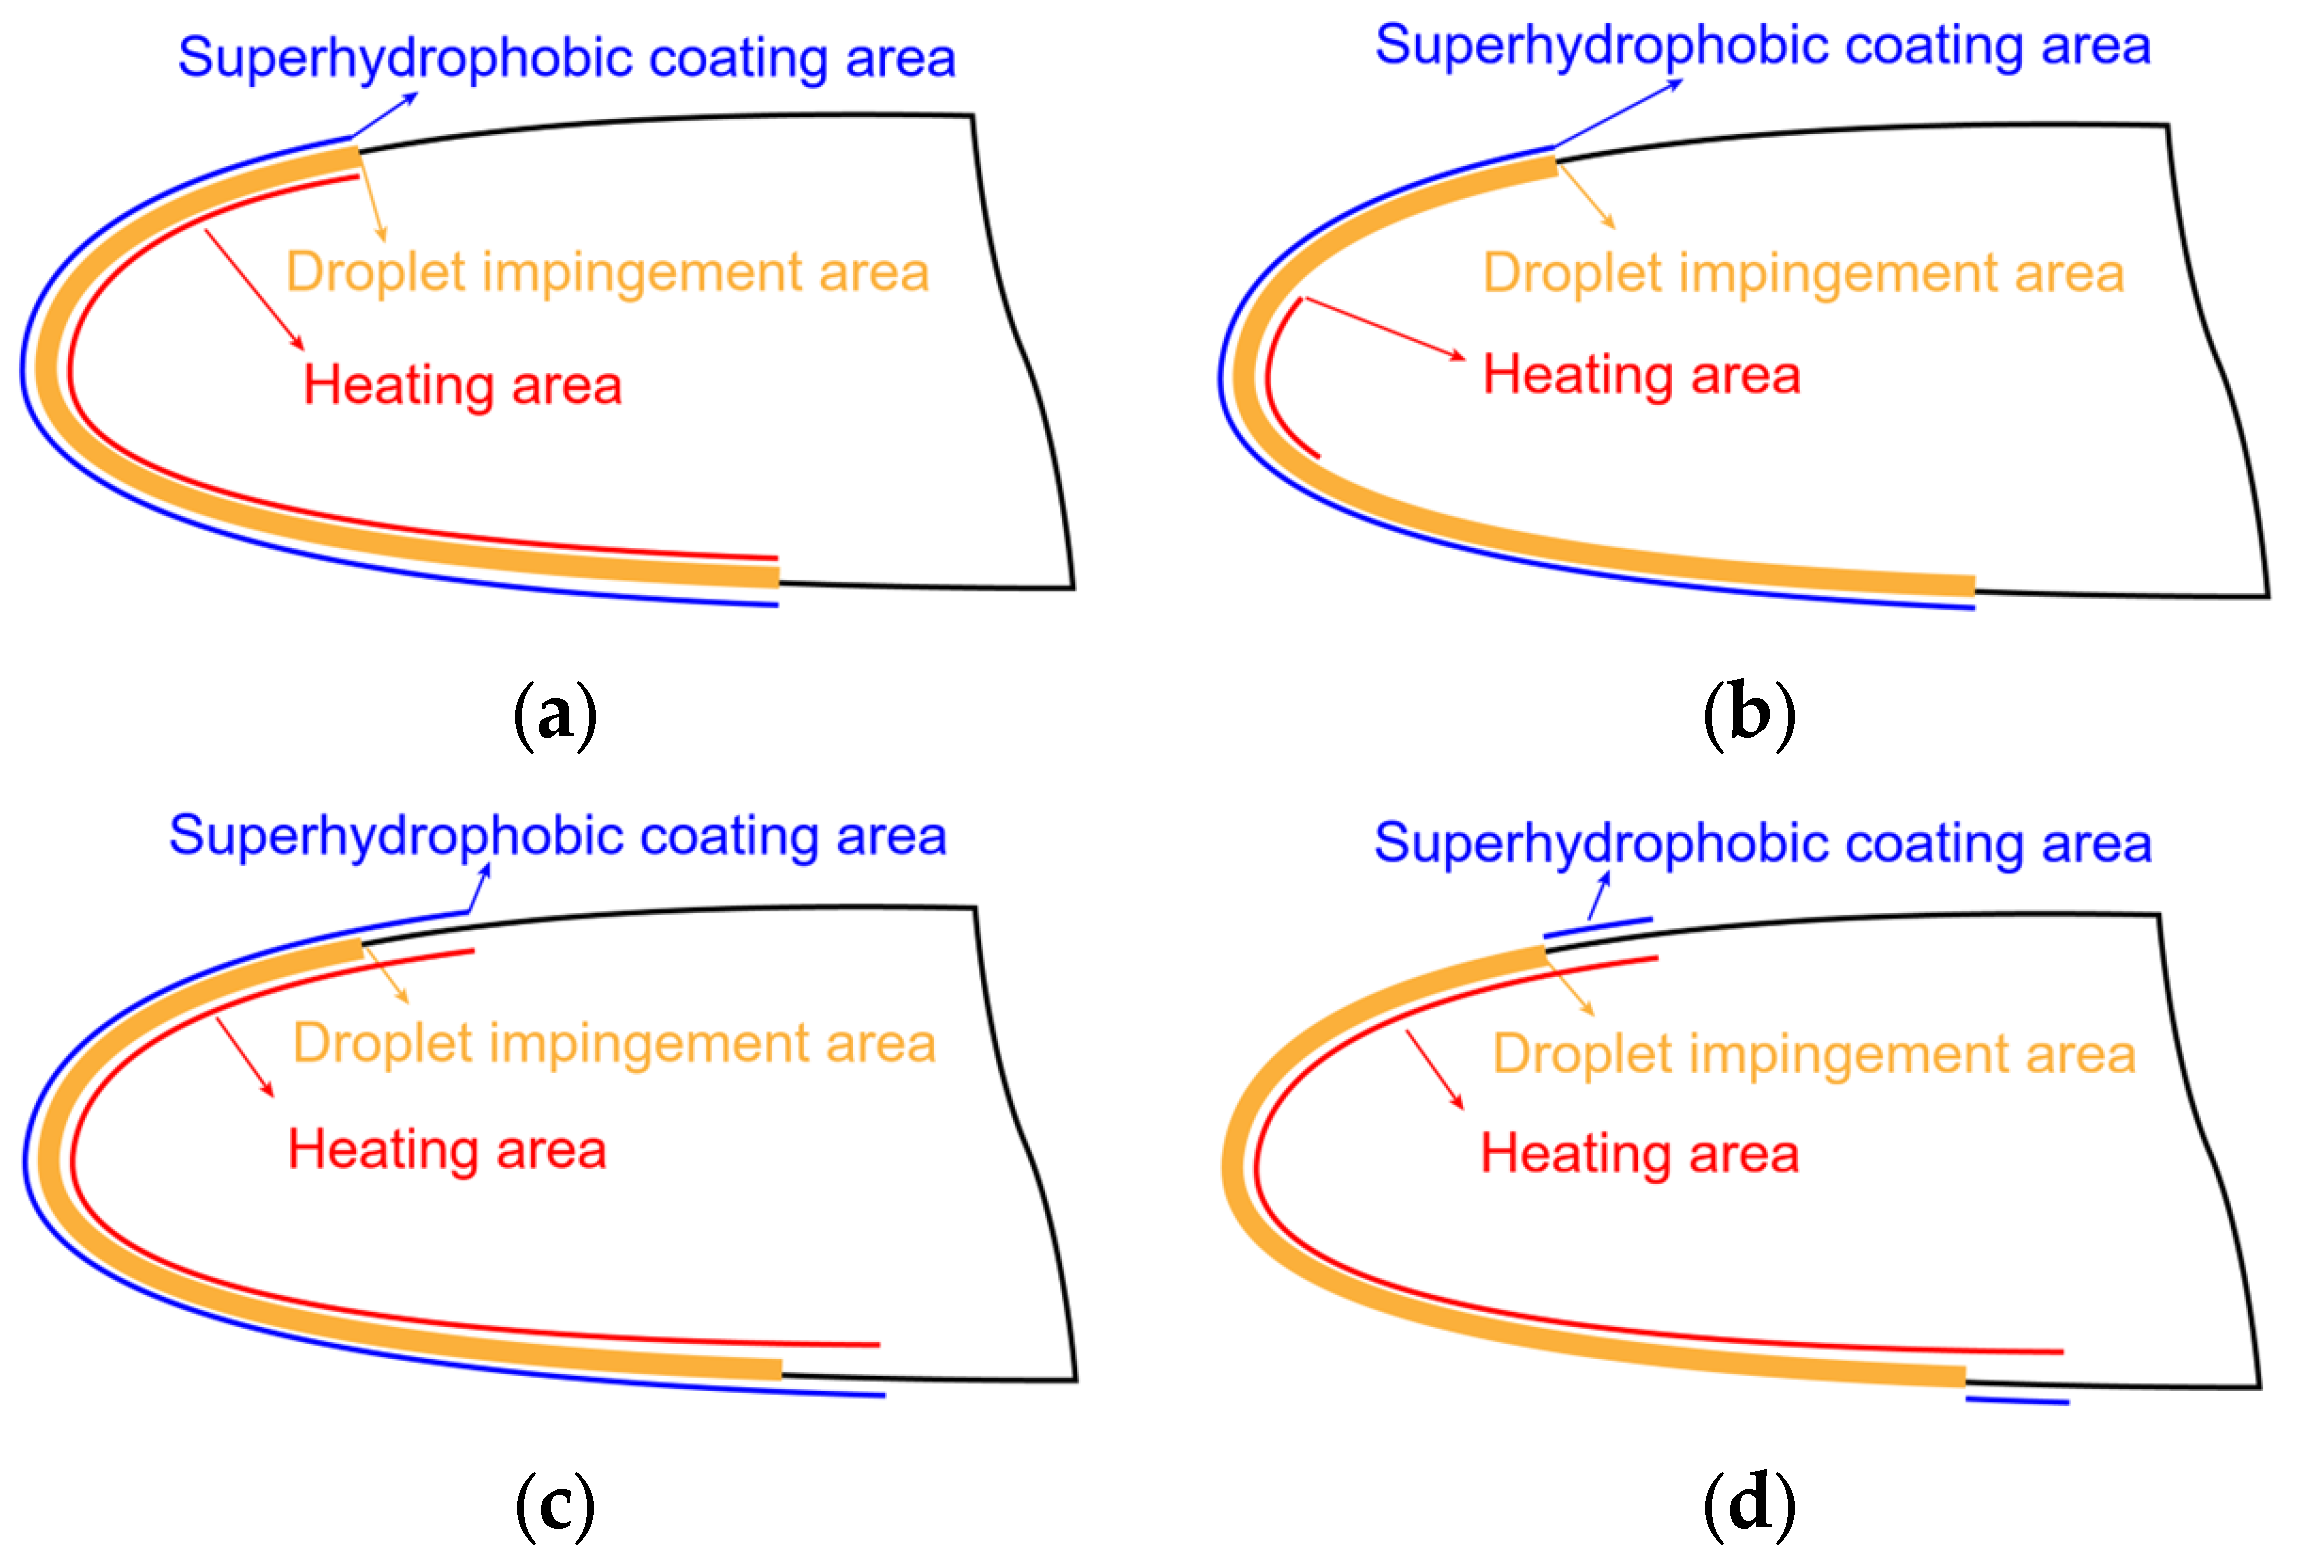
The second part studied the performance of various IPS parameters such as coating ranges, heating ranges and powers dealing with a fixed icing environment parameter. The purpose was to explore the potential for further power reduction through optimization. Four types of IPS layout were examined (Figure 5). Type (1) represented the baseline configuration with both the heating sheet range and superhydrophobic coating range identical to the droplet impingement area. It was expected that supercooled droplets impacting the coating would immediately fall off and there would be no runback water after the heating protection area. Type (2) decreased the range of heating area, expecting an increase in heating power density but the reduced heating area would reduce the total heating power consumption. Type (3) increased both the range of heating area and superhydrophobic coating area equally, intending to reduce the total heating power consumption with increased protection area but less power. Type (4) examined whether the water would fall off after the heating protection area. The superhydrophobic coating was positioned after the droplet impingement area with high heating power supplied to ensure the water temperature on the coating remained above freezing point. Type (1)–(3) targeted ways to reduce power consumption. As shown in Equation (1), type (2) decreased heating area but increased heating power density slightly trying to minish heating power compared with type (1). In contrast, type (3) decreased heating power density but increased heating area slightly, trying to minish heating power compared with type (1). That is why the reserved heating sheets D and E which expand the heating area were chosen with artificially different sizes than sheets B or C. Type (4) was designed to determine where droplets fell off, compared with Type (1).
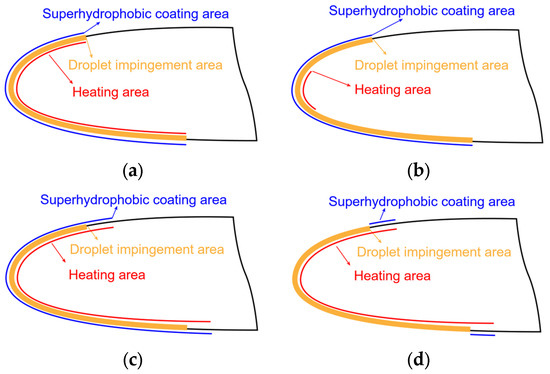
Figure 5.
Four types of layouts of ice protection system. (a) Type (1). (b) Type (2). (c) Type (3). (d) Type (4).
The tests were conducted at a velocity of 90 m/s, angle of attack of 0°, MVD 20 μm, LWC 1 g/m3 and a test duration of 180 s. The heating power, the range of heating area and the range of superhydrophobic coating area represented with sheet A, B, C, D, E are shown in Table 4.
Table 4.
Test condition for part 2.
2.4. Test Procedure and Temperature Processing Method
The test procedure followed the steps below: (1) the wind tunnel temperature was set at target value; (2) the velocity was set to target value; (3) heating system was switched on and allowed the model surface temperature to reach a steady state condition; (4) spray system was activated to generate liquid water cloud, and this time was set to 0; (5) test run for 180 s, after which wind tunnel fan and spray systems were switched off; (6) pictures of model were taken immediately. Throughout the test, temperatures of the model surface were continuously monitored.
Take case 1 results as an example to explain the temperature data processing method. Figure 6 indicates that time 0 s denotes step (4). Due to the cloud, the surface temperature decreased to a lower value, reaching a steady state once again at approximately time 100 s. The final value of each thermocouple was calculated by averaging out the surface temperatures collected between 120 and 170 s.
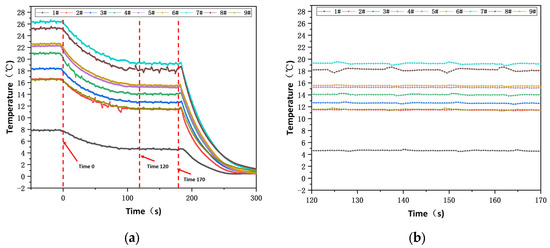
Figure 6.
Surface temperature history in case 1. (a) Complete history. (b) Time 120 s to 170 s.
3. Results and Discussion
3.1. Sensitivity to Icing Environment Parameters
3.1.1. MVD
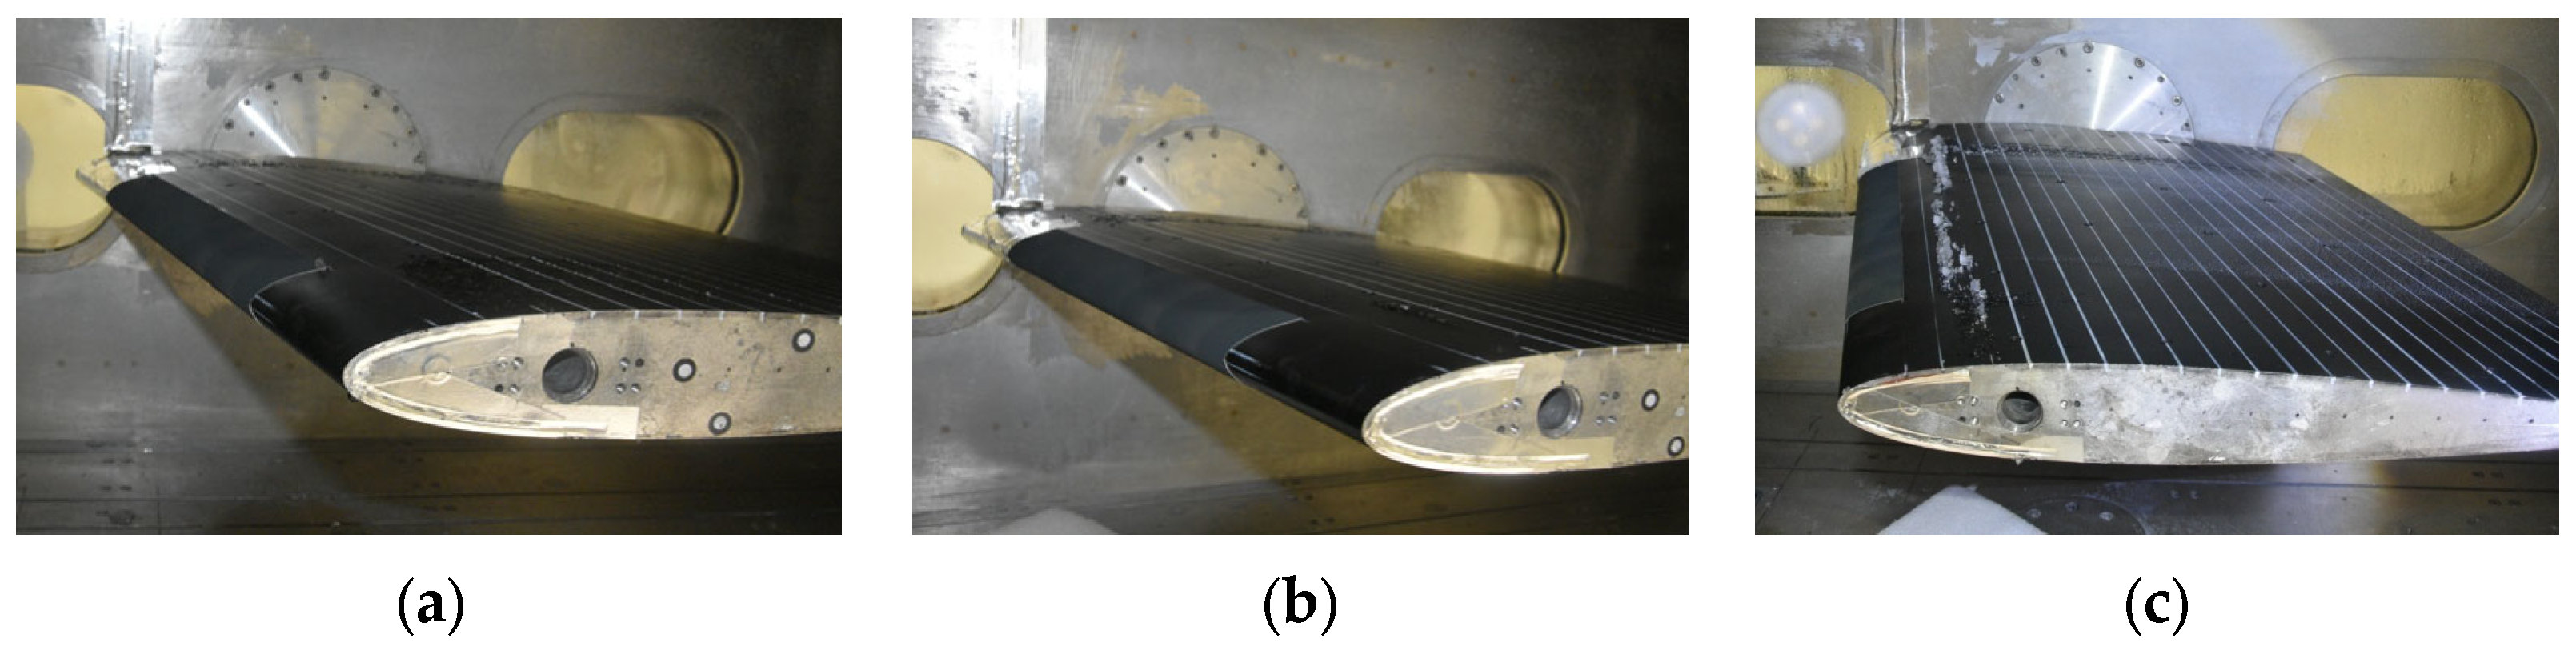
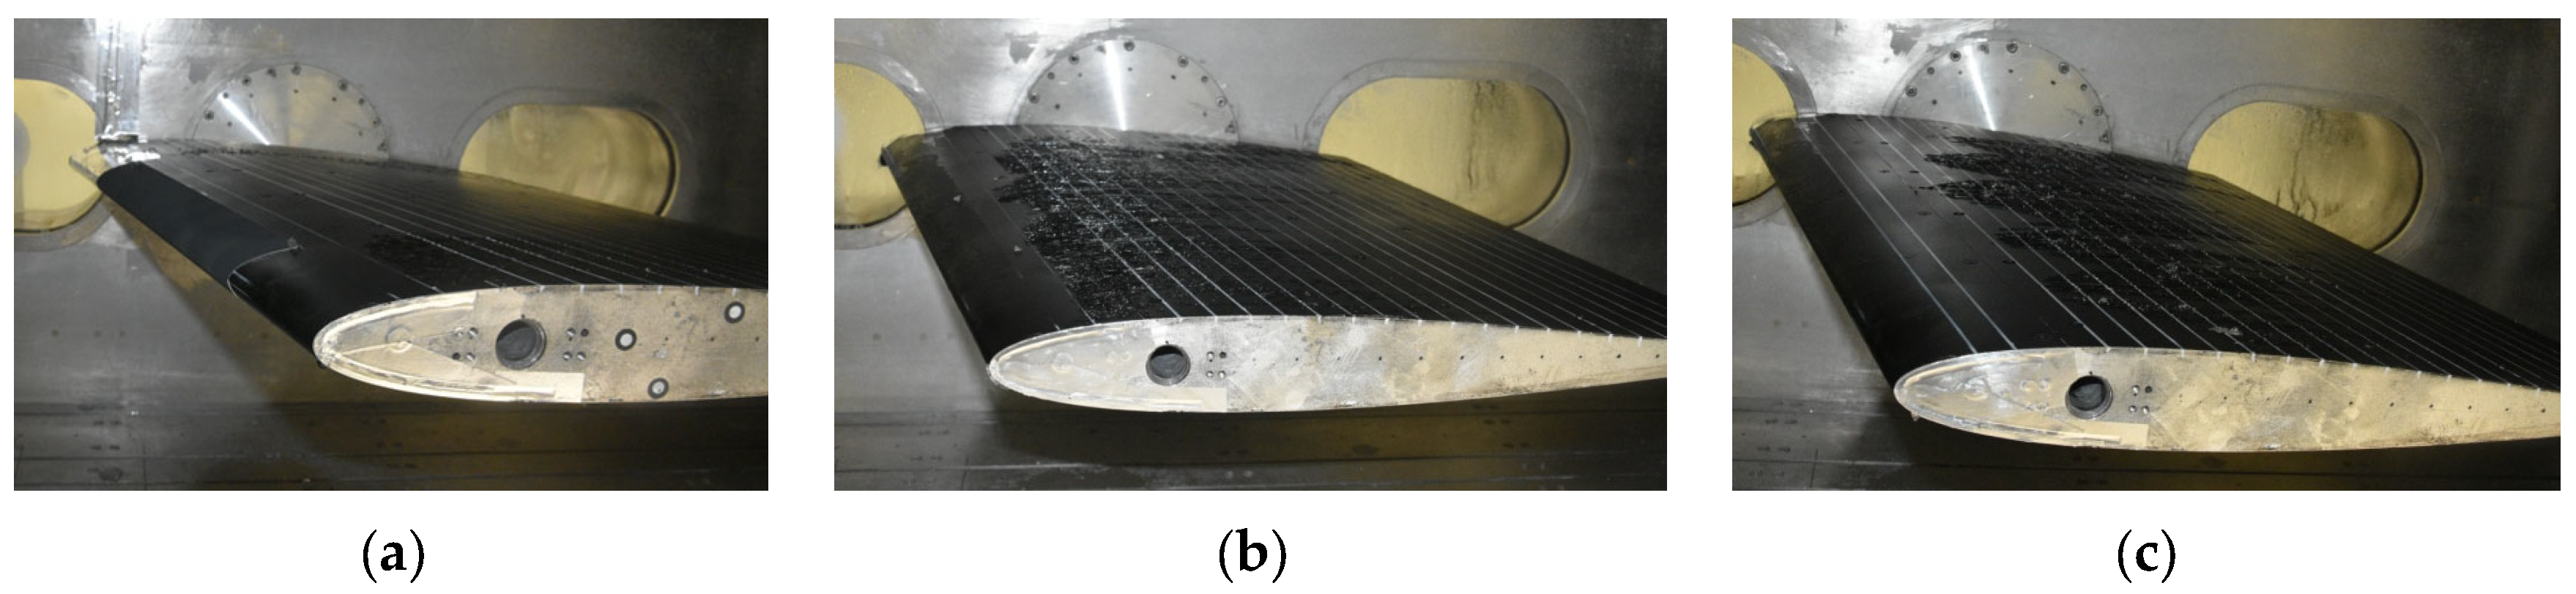
The protection area of basic configuration was designed based on MVD 20 μm. Comparing cases 1~3, the IPS prevented ice from forming when MVD was 30 μm. When MVD increased to 40 μm, ice appeared after the protection area but without rivulet characteristics, shown in Figure 7. An additional ice formation test under the same icing condition (Figure 8) showed that icing range exceeded the upper limit of the heating area (sheet B in this test). Thus, it could be inferred that the ice formation was due to the droplet impingement of MVD 40 μm that surpassed the protection range rather than runback water.
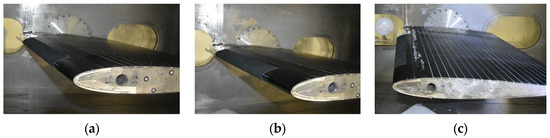
Figure 7.
Test results of various MVDs. (a)MVD 20 μm. (b) MVD 30 μm. (c) MVD 40 μm.
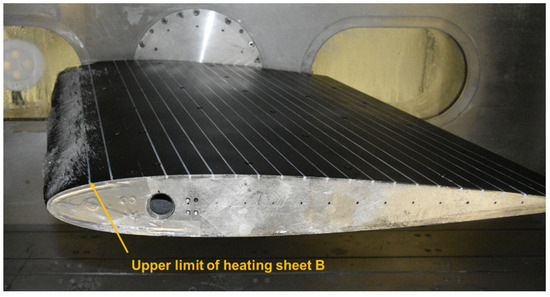
Figure 8.
Ice formation test in case 3 condition.
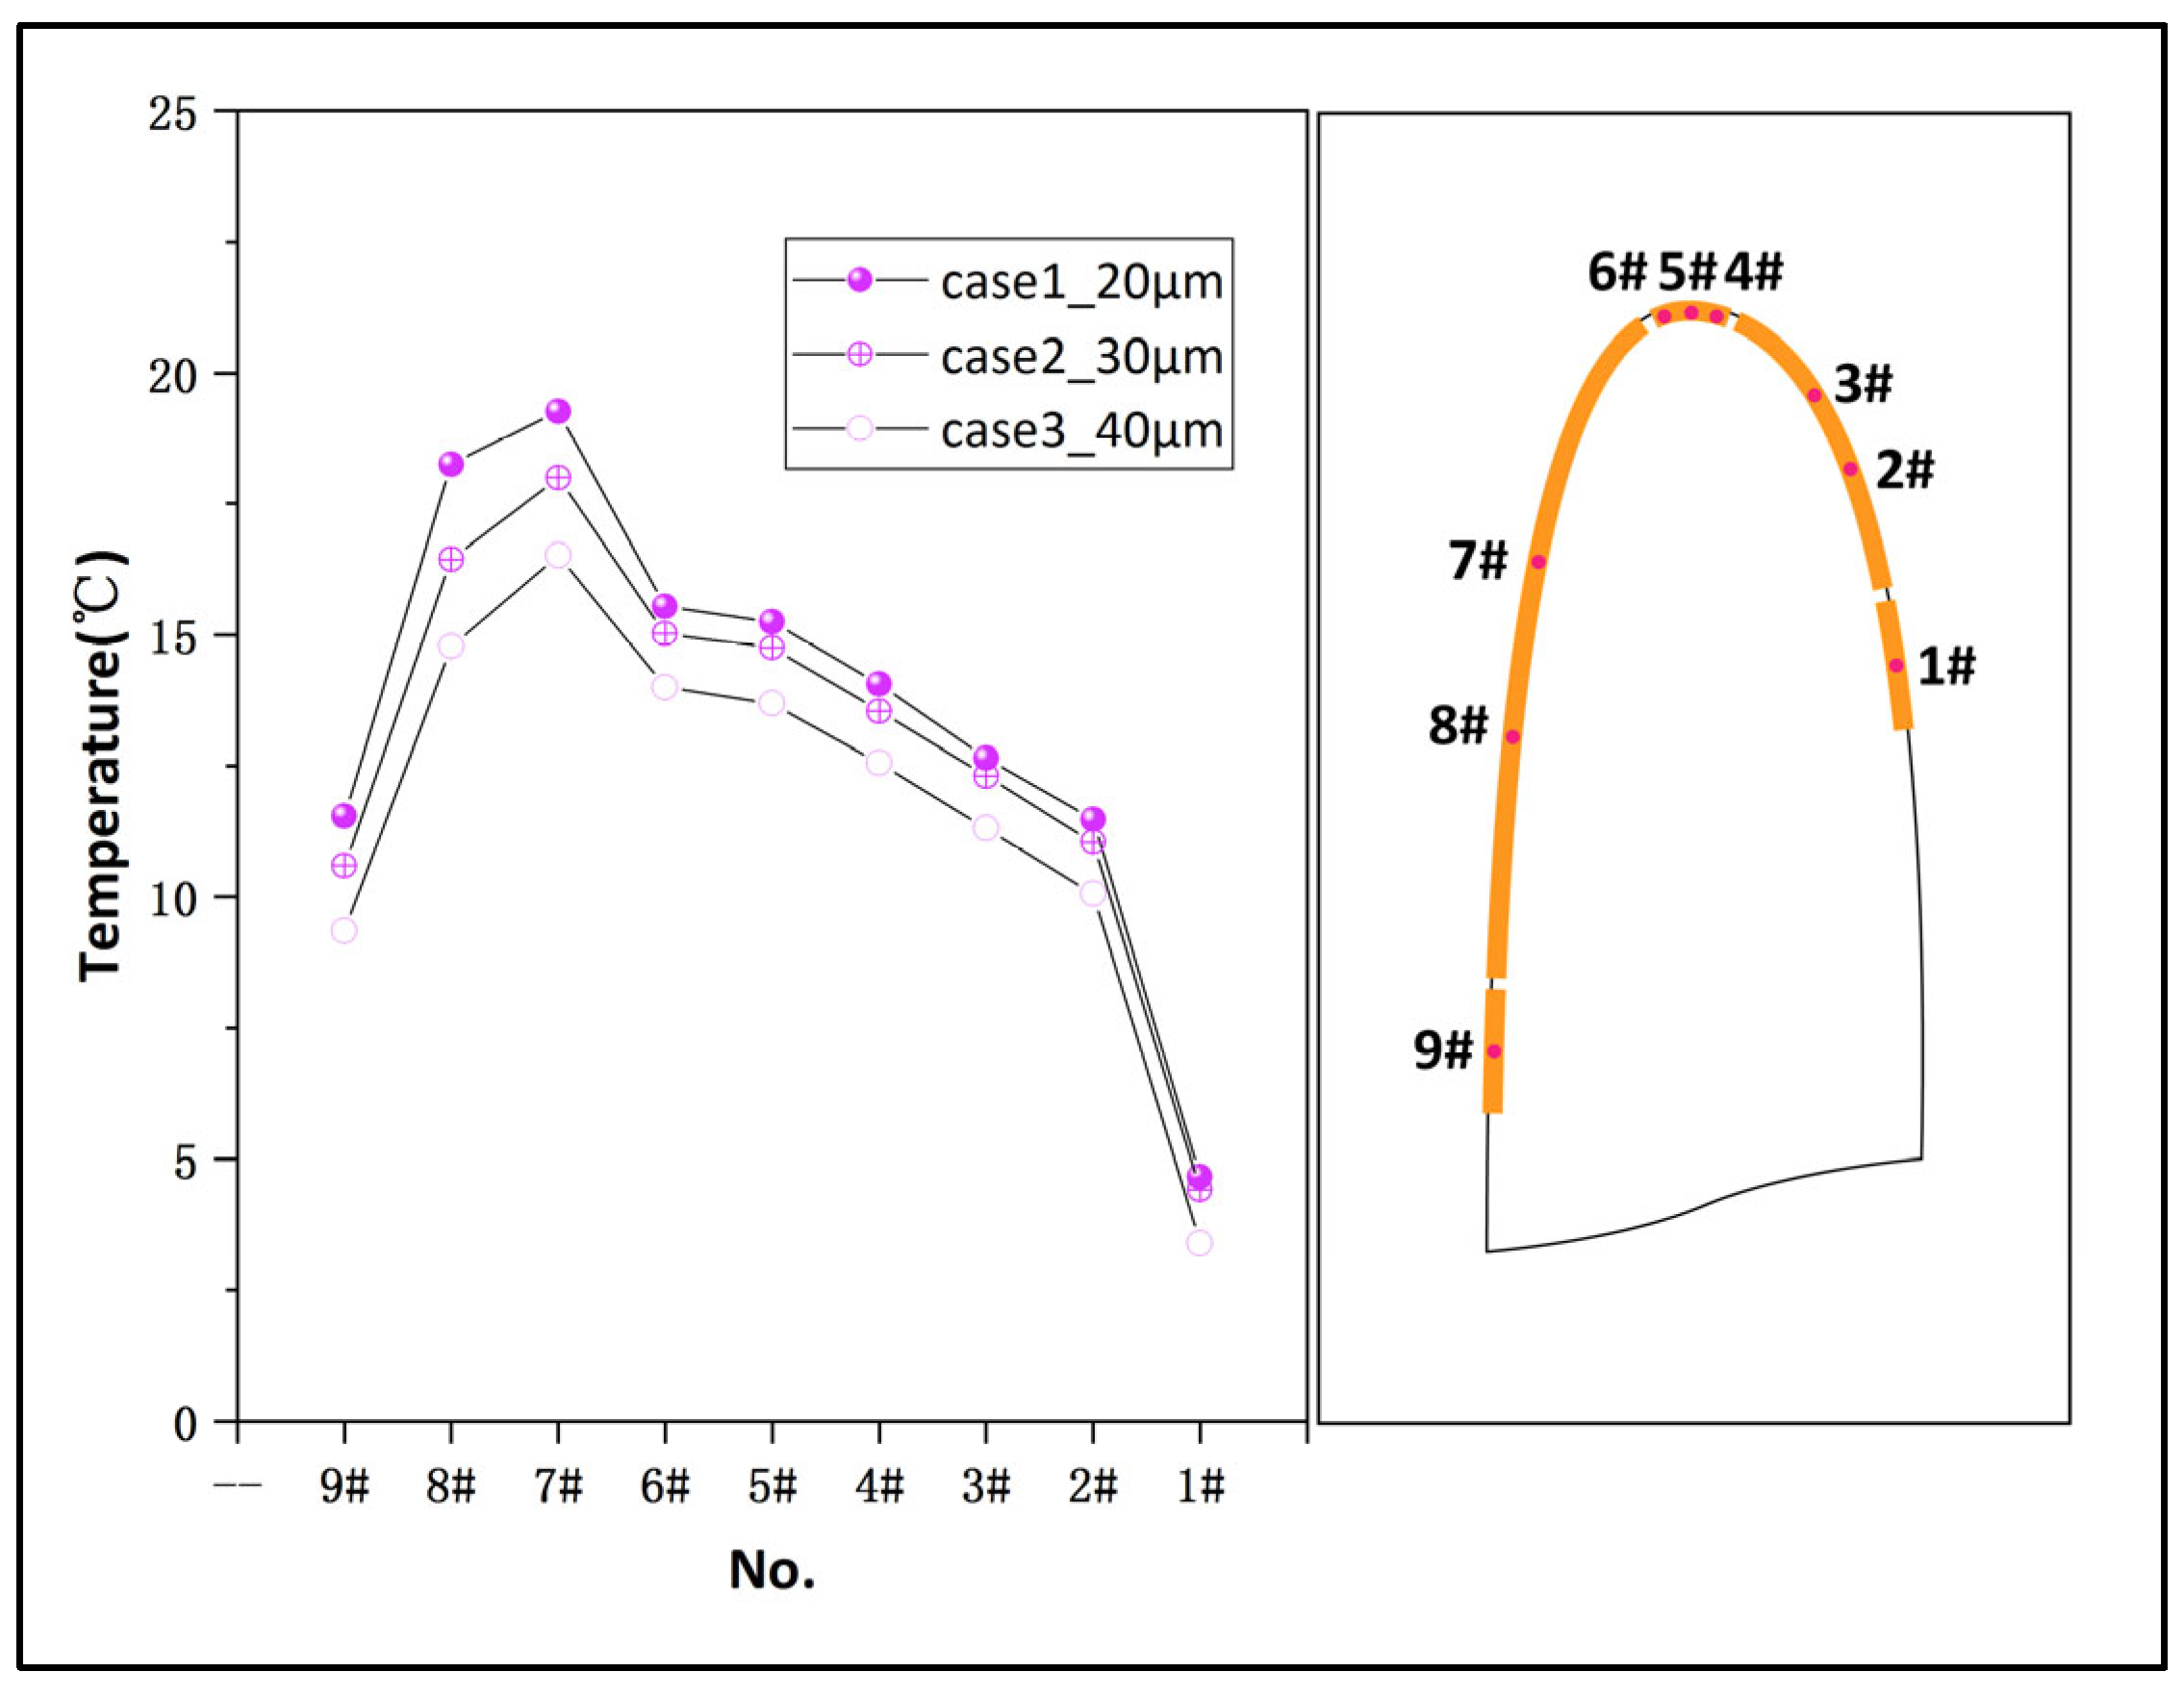
The surface temperature decreased when MVD increased from 20 μm to 40 μm, as shown in Figure 9. The lower surface temperature showed a linear decrease, while the upper surface temperature exhibited multiple decreasing trends, with the lower surface experiencing the most significant reduction. A maximum temperature decrease of 1.81 °C (about 9.93%) was observed when MVD increased from 20 μm to 30 μm and 3.47 °C (about 19.03% compared to MVD 20 μm) when MVD increased from 20 μm to 40 μm.
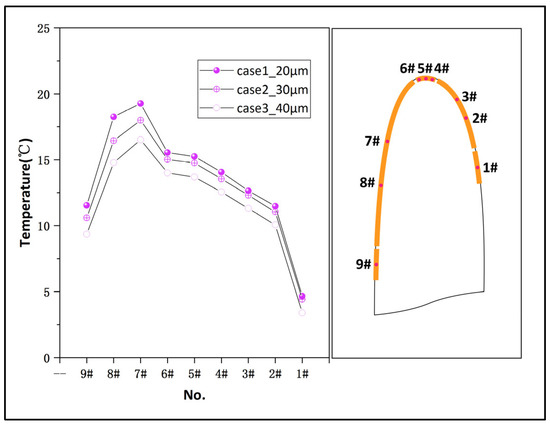
Figure 9.
Comparison of surface temperature with different MVDs.
The test utilized a symmetrical NACA0012 airfoil tested at 0° angle of attack. The difference in temperature between the upper and lower surfaces in this configuration resulted from their dissimilar protection areas. As such, an asymmetrical distribution of the protection areas of the upper and lower surfaces ultimately led to differences in temperature variation as MVD increased.
According to the results of this test, MVD affects the droplet impingement limit and becomes a factor to be considered in the design of IPS. An increase in MVD leads to an increase in water collected on the surface, which necessitates a simultaneous enhancement of the protection power required, as reflected in the decrease of surface temperature under the condition of constant heating power in this test.
In order to demonstrate the efficiency and low-energy consumption of IPS with a coating, a reference test of IPS without coatings was conducted under the same condition as case 1. The heating power densities of 5 kW/m2 and 10 kW/m2 were provided to prevent ice formation. As shown in Figure 10, runback ice formed after the heating area on the test model without coatings even when the heating power density was 10 kW/m2 which was twice as the power provided in case 1. IPS with a coating prevented runback ice formation and reduced power consumption by more than 50%.

Figure 10.
Test results of IPS with and without a coating in case 1 test condition. (a) The 5 kW/m2 with a coating. (b) The 5 kW/m2 without a coating. (c) The 10 kW/m2 without a coating.
3.1.2. LWC
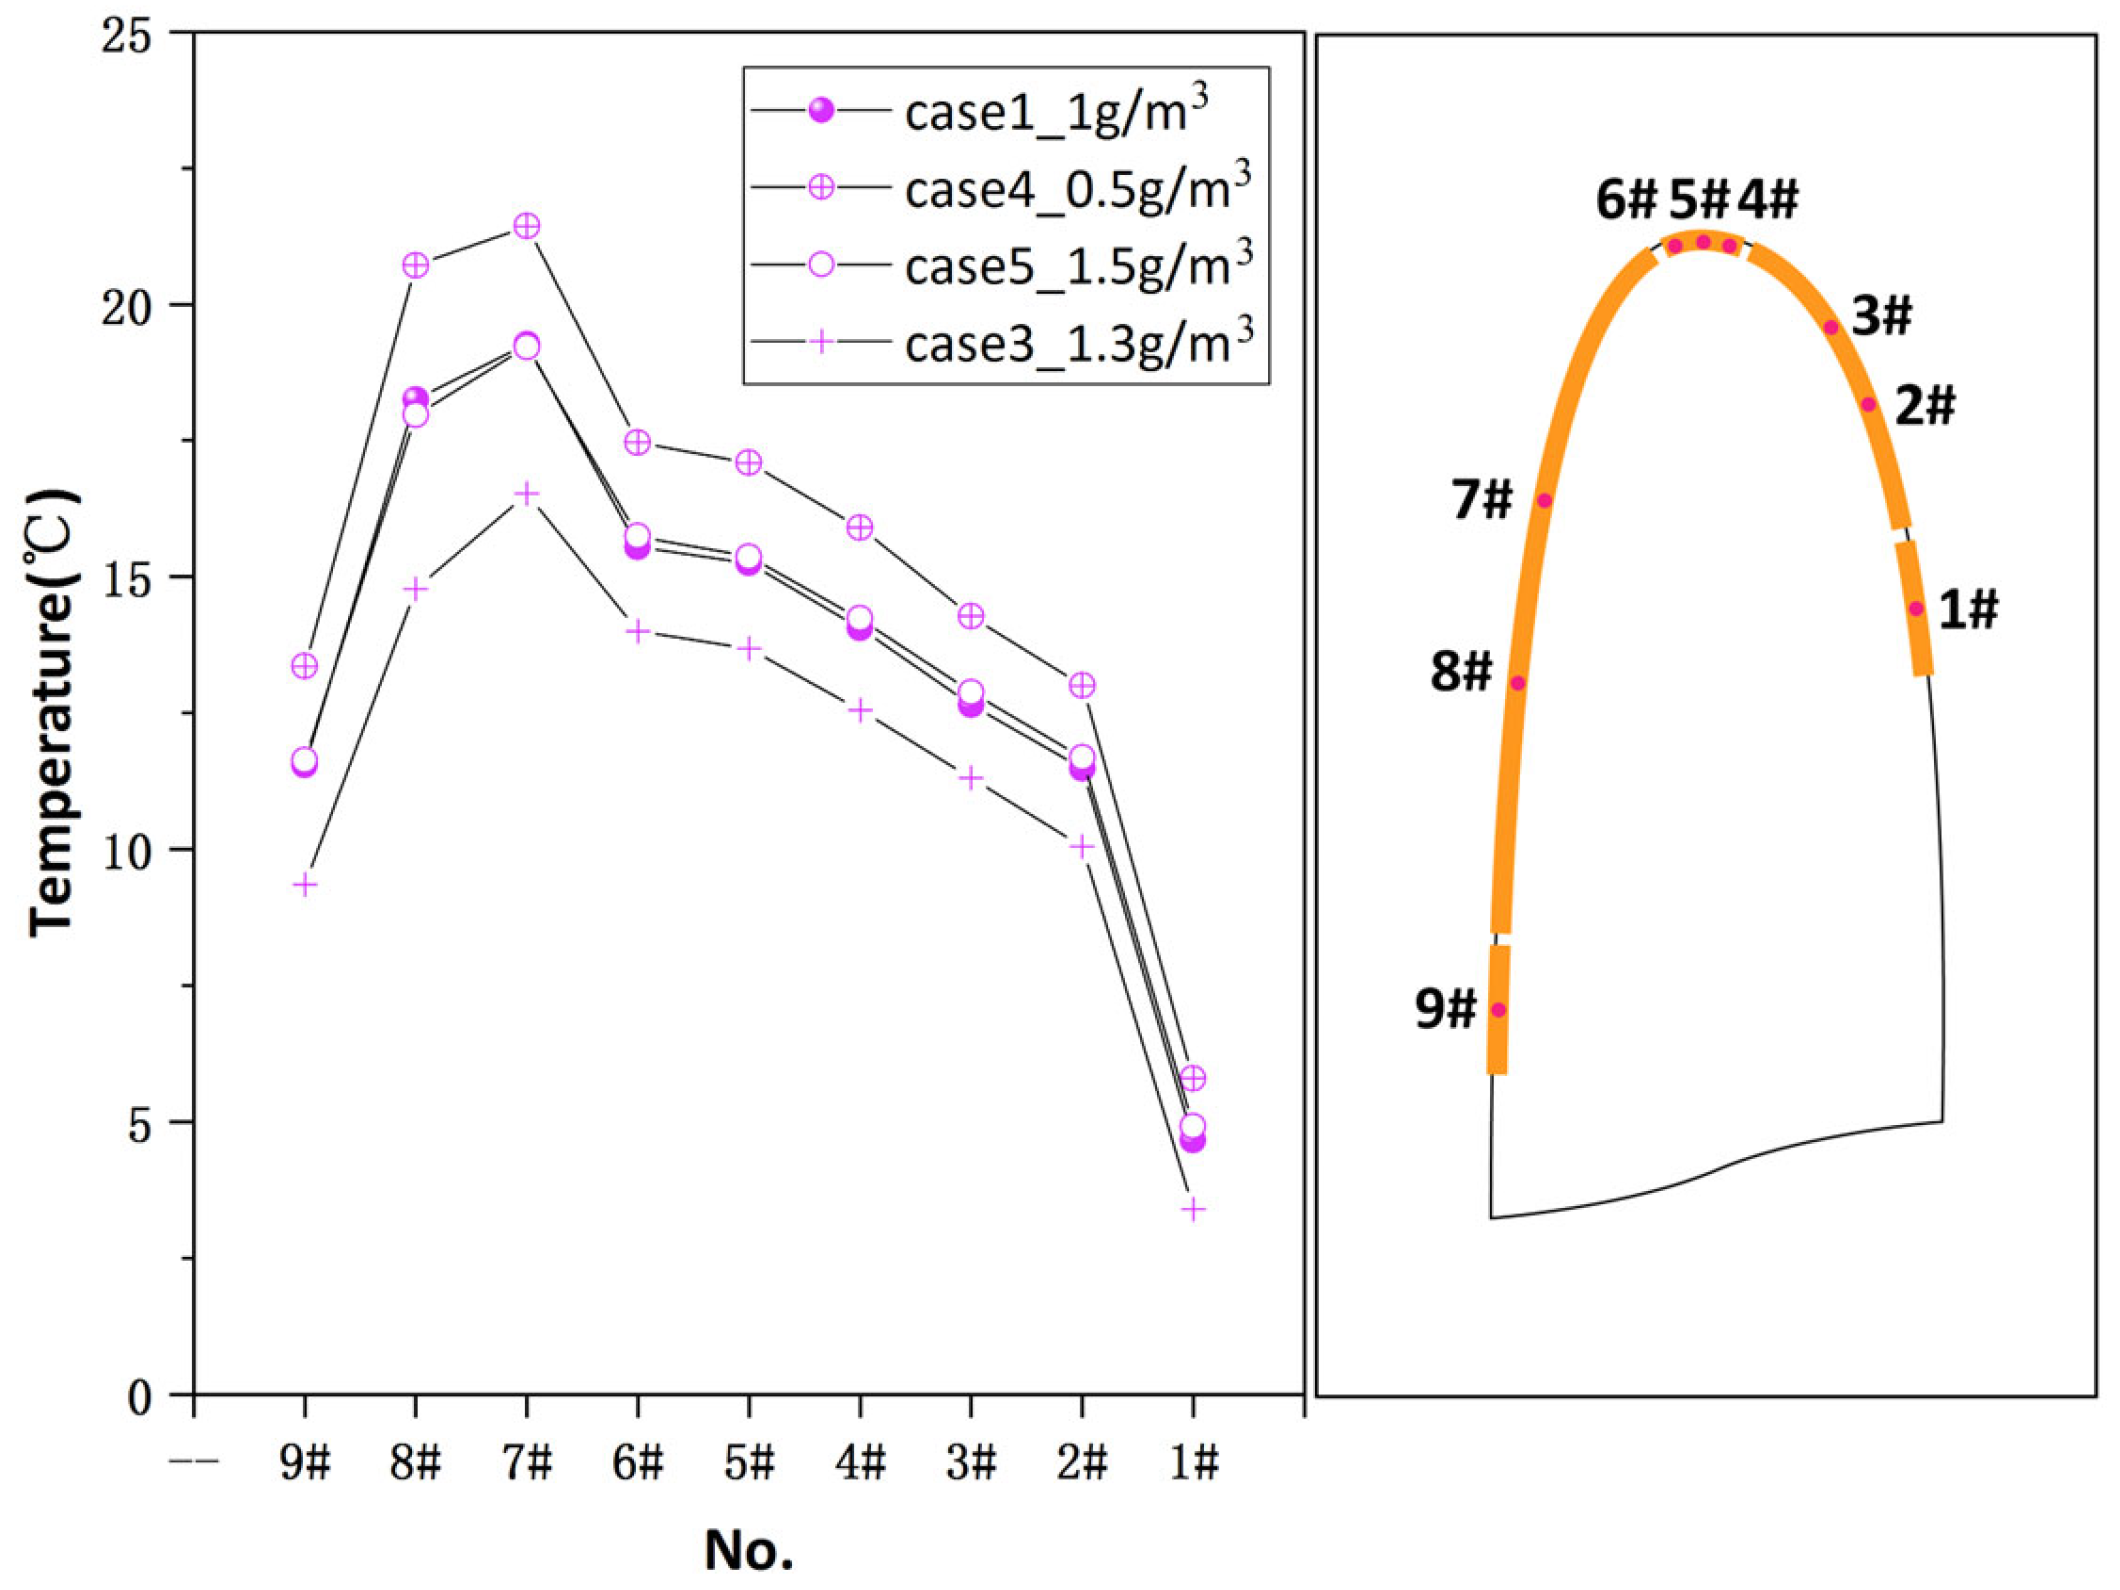
Through a comparative analysis of the test results for cases 1, 4 and 5, it was determined that a designed IPS prevented ice formation on the surface when LWC varied from 0.5 to 1.5 g/m3. As shown in Figure 11, the surface temperature decreased significantly when LWC increased from 0.5 to 1 g/m3 but did not decrease further when LWC increased further to 1.5 g/m3. The surface temperature of case 3, with LWC set to 1.3 g/m3, was lower than that of case 5 with LWC set to 1.5 g/m3 but revealed a temperature decrease compared to case 5. Since case 5 involved an increase in MVD to 40 μm, it could be reasoned that the decrease in surface temperature resulted from the combined effects of LWC and MVD.

Figure 11.
Comparison of surface temperature with different LWCs.
Based on the results of the tests, it was inferred that more power was required for heating with the increase of LWC, but once the LWC increased to a certain critical value, the power required would plateau. However, when coupled with an increased MVD, an expansion of droplet impingement area accompanied by more liquid water would lead to a considerable increase in power requirement.
3.1.3. Environment Temperature
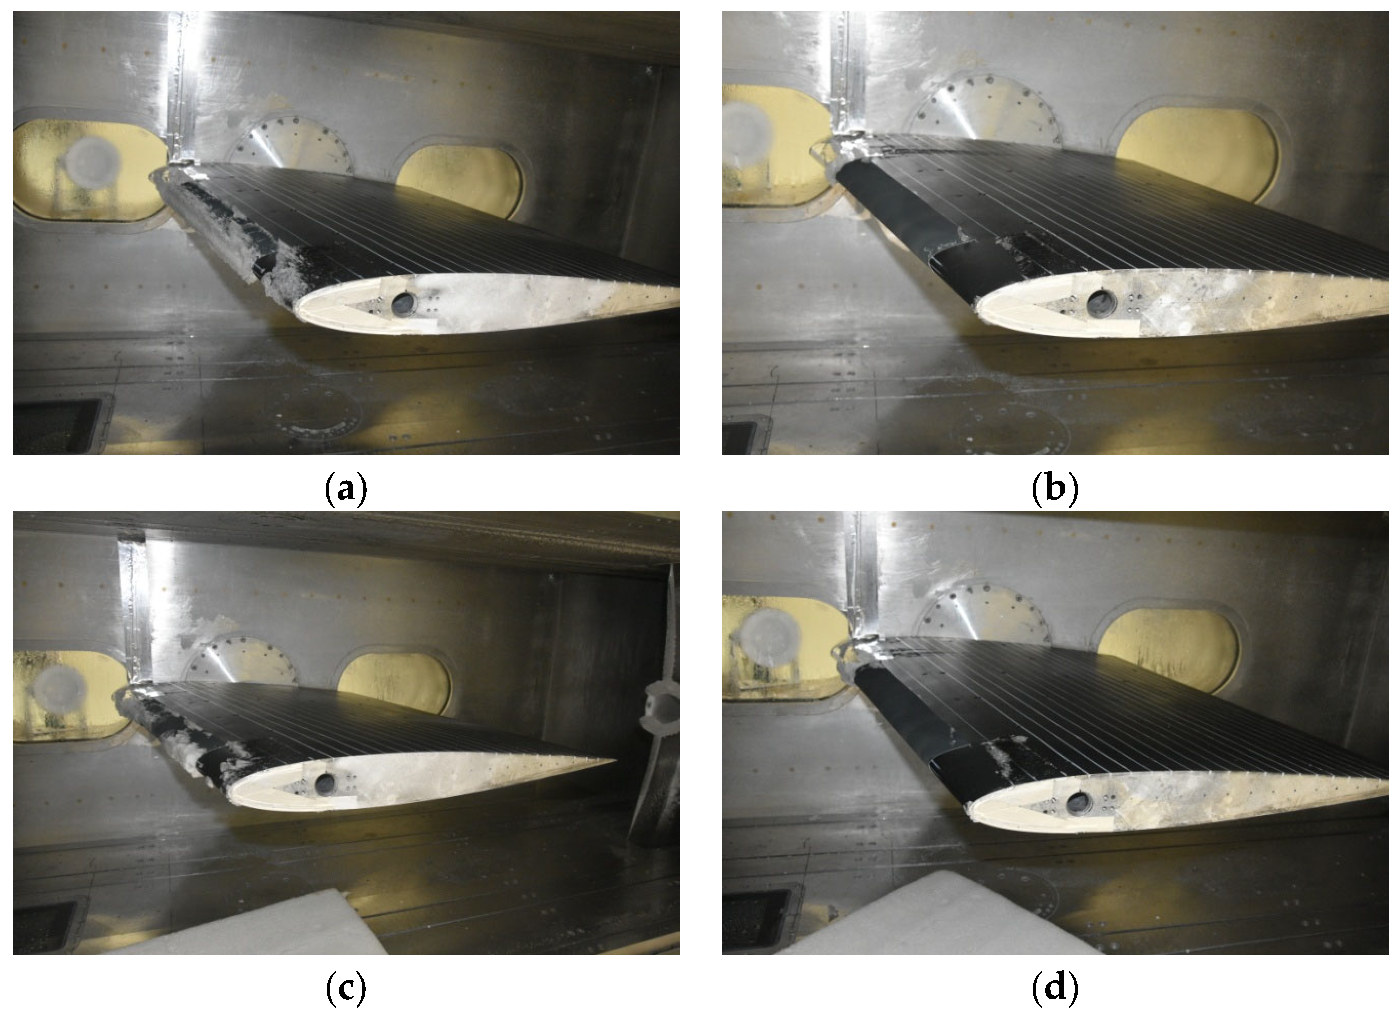
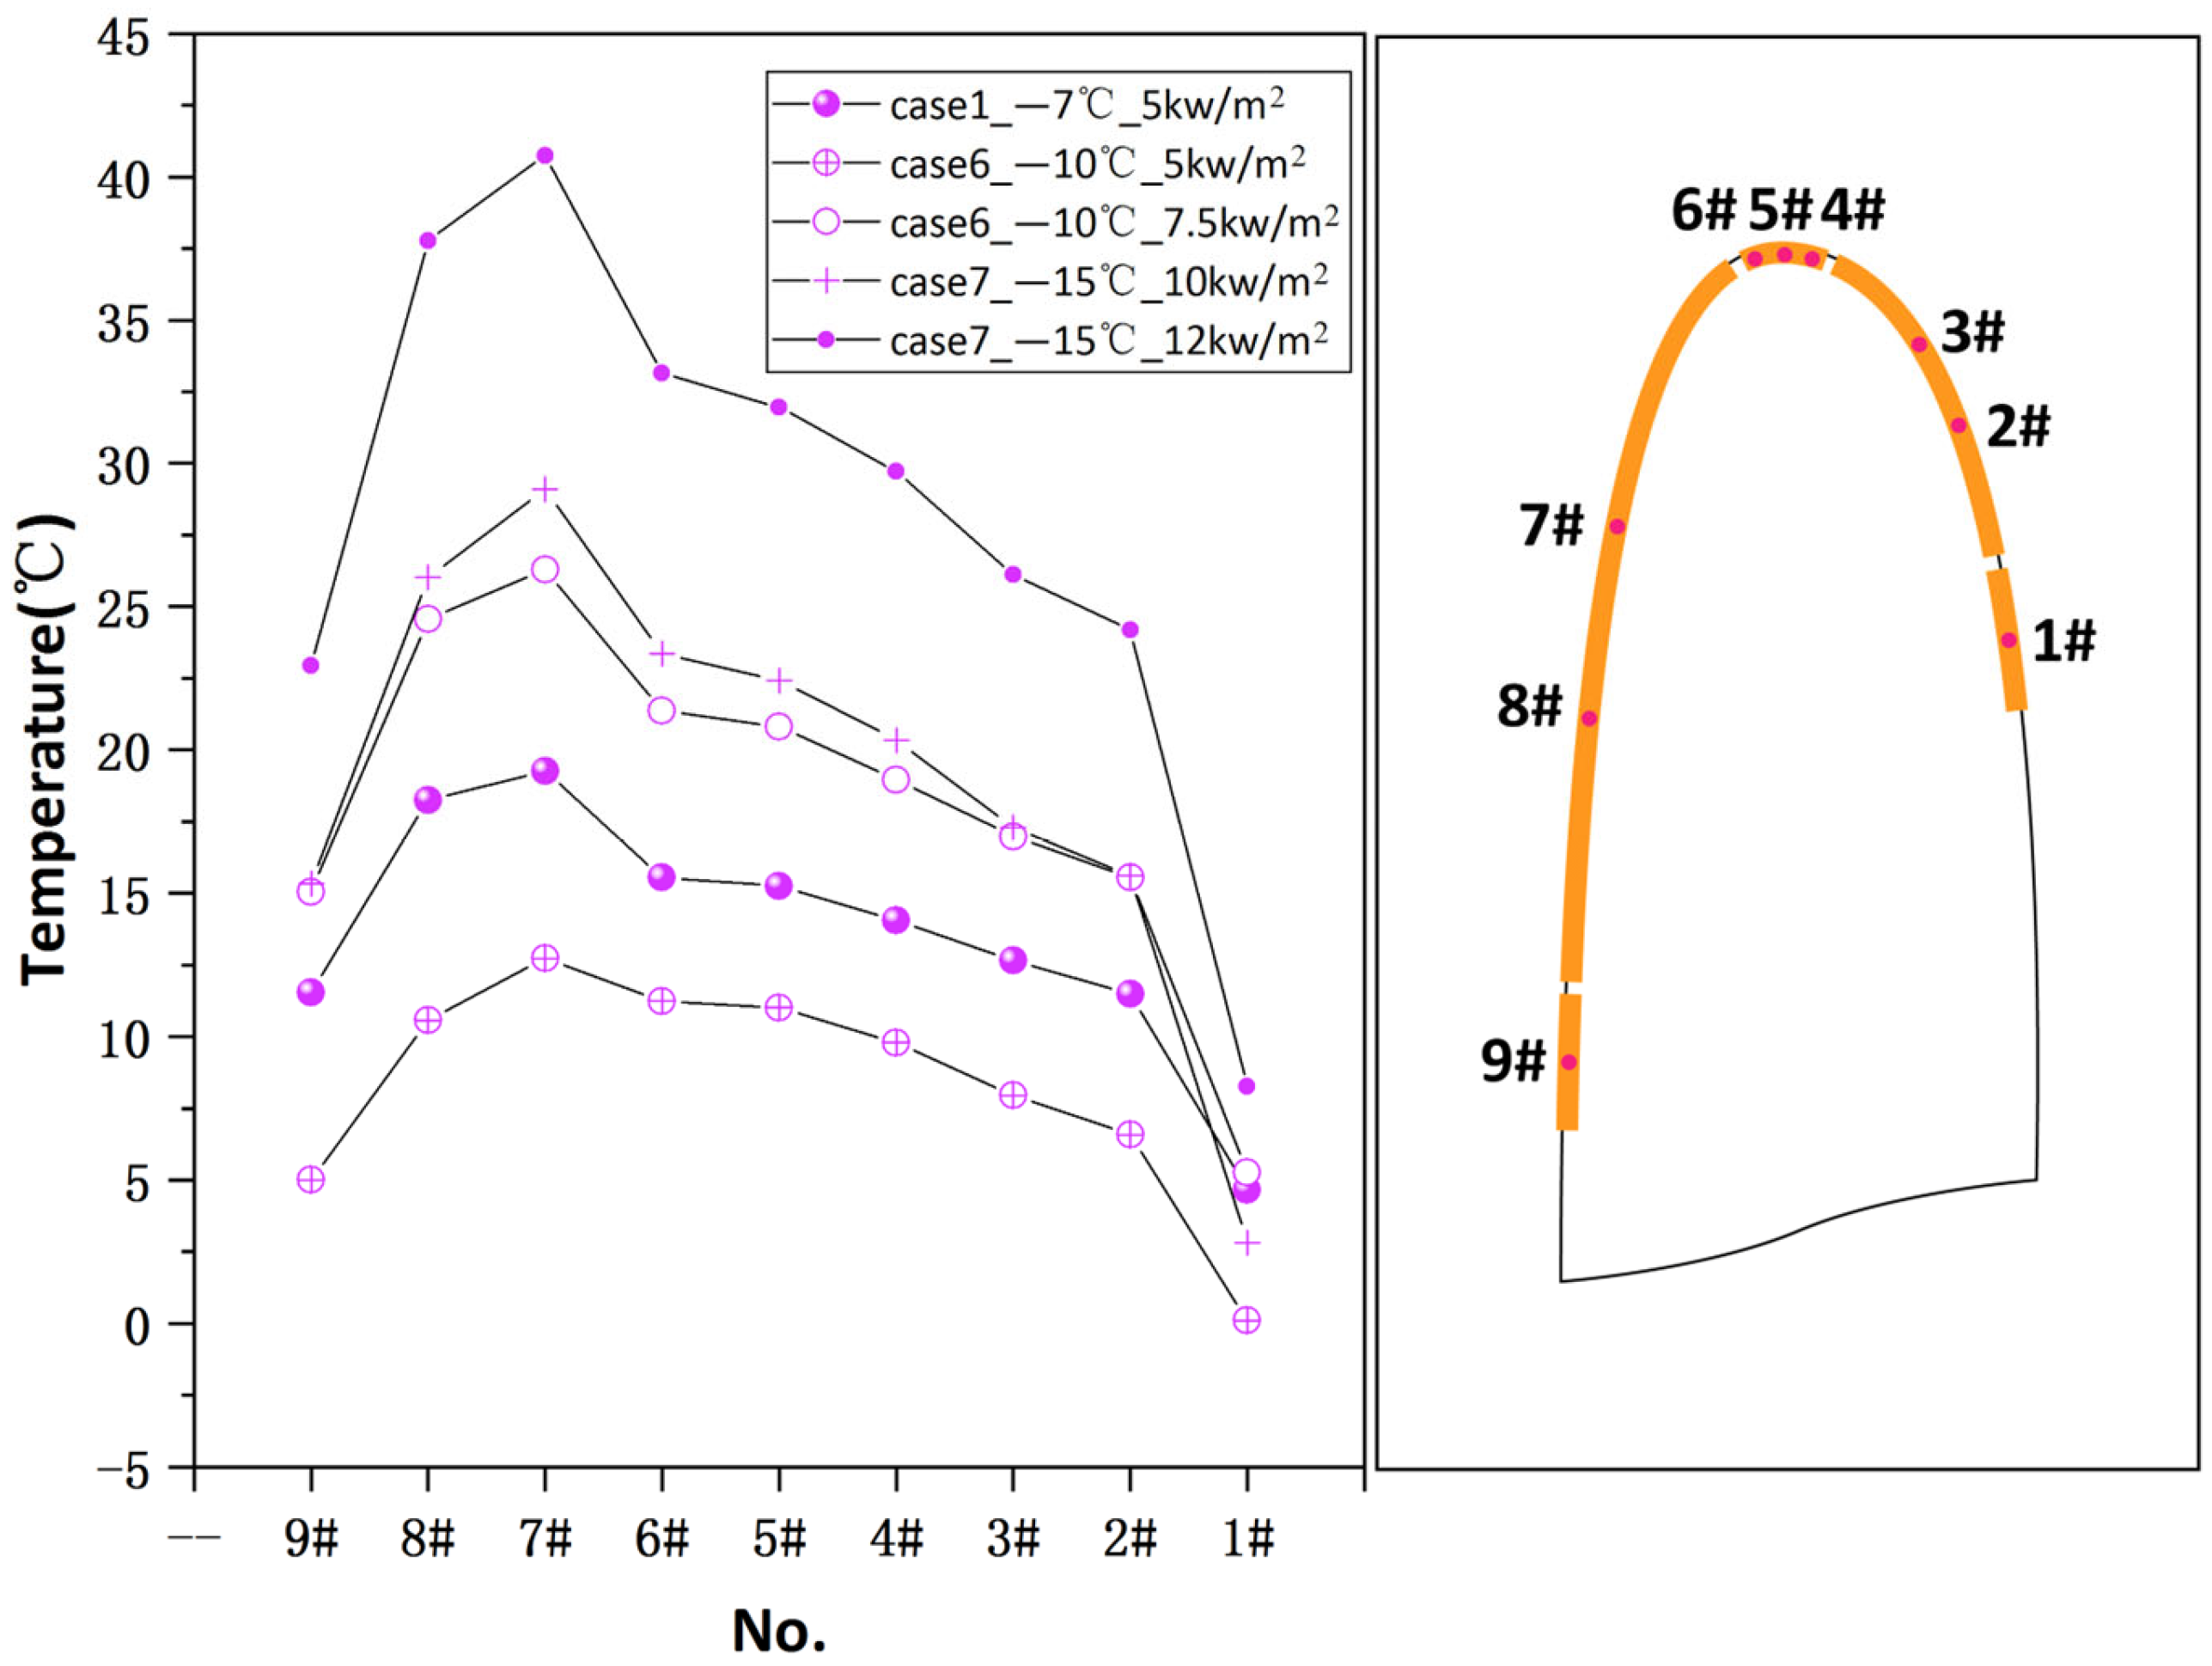
IPS heating power density of 5 kW/m2 was determined under an environment temperature of −7 °C. When the temperature dropped down to −10 °C and −15 °C, the power density 7.5 kW/m2 and 12 kW/m2, respectively, were required to protect the surface from icing, as test results suggest in Table 5 and as shown in Figure 12. In comparison to LWC and MVD, IPS was more sensitive to environment temperature. Therefore, when environment temperature drops, IPS must immediately provide more heating power for ice protection.
Table 5.
Heating power details in different environment temperatures.
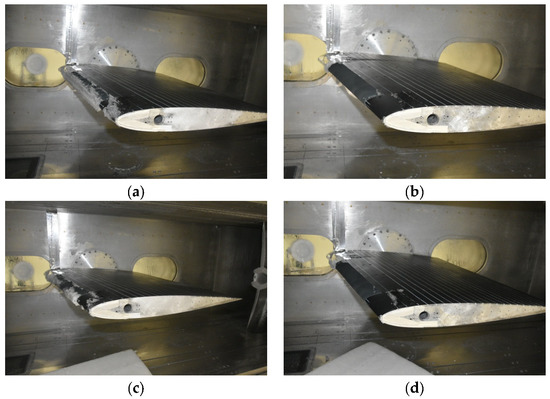
Figure 12.
Test results of various environment temperatures. (a) Case 6 (5 kW/m2). (b) Case 6 (7.5 kW/m2). (c) Case 7 (10 kW/m2). (d) Case 7 (12 kW/m2).
In this test, when the temperature dropped from −7 °C down to −10 °C and −15 °C, the needed IPS heating power density went from 5 kW/m2 to 7.5 kW/m2 and 12 kW/m2. Based on the results, the required heating power density was fitted linearly with the environment temperatures:
where T is environment temperature, with units in Kelvin (K), and q is heating power density, with units in kW/m2.
It is noteworthy that the thermocouples used for surface temperature measurement were positioned inside the model, rather than on the superhydrophobic coating surface. As a result, the surface temperature of the coating, which is crucial in IPS evaluation, would be lower than the measured temperature due to the heat transfer properties of superhydrophobic coatings. In the test, as shown in Figure 13, a heating power density of 10 kW/m2 at environment temperature −15 °C (case 7) maintained an internal temperature virtually identical to that provided by a heating power density of 7.5 kW/m2 at environment temperature of −10 °C (case 6) but could not prevent ice formation. It could be inferred that the coating surface temperature dropped below the freezing point. Therefore, it is necessary to study the heat transfer qualities between the airfoil skin and superhydrophobic coating in the future.
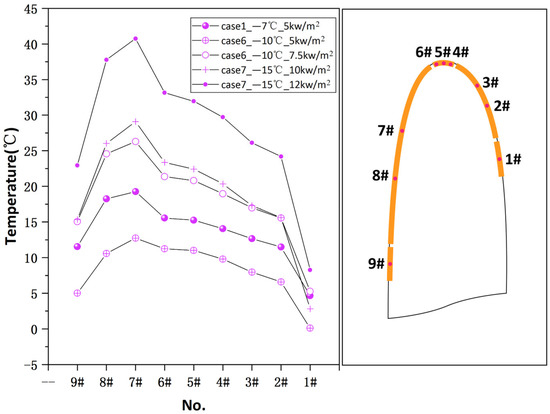
Figure 13.
Comparison of surface temperature with different environment temperatures and heating power densities.
3.2. IPS Parameters Effect
3.2.1. Heating Range and Powers
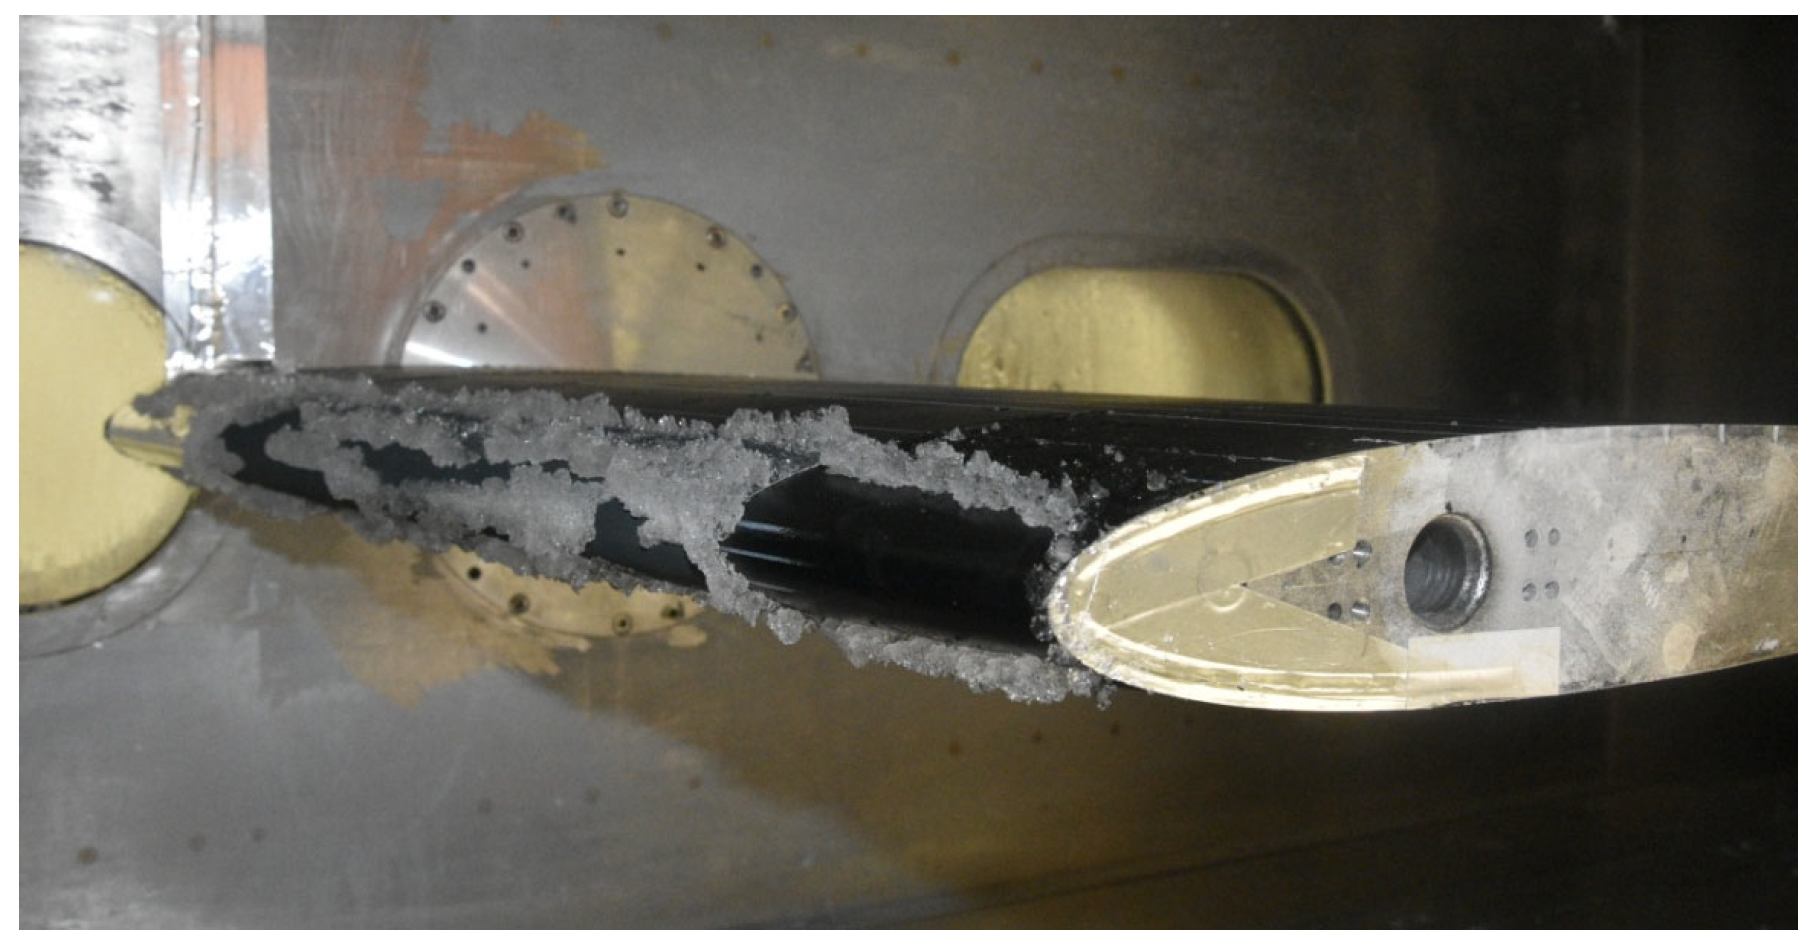
Case 8 entailed the activation of only sheet A with a considerable increase in power of 150 W to simulate Type (2) previously defined. Results (Figure 14) showed that this design could not prevent ice formation even near the stagnation point. The high power applied to sheet A led to a leading edge surface temperature approximately equal to that of Type (1) in case 1, as shown in Figure 15, but with a temperature fall rapidly after the heating area. It could be inferred that the temperature of the superhydrophobic surface here should have fallen below the freezing point. As a result, it is not advisable to reduce the heating area range since this could adversely impact efficient heat distribution in addition to the superhydrophobic coating’s poor heat transfer. The surface temperature on the superhydrophobic surface must be kept above the freezing point.
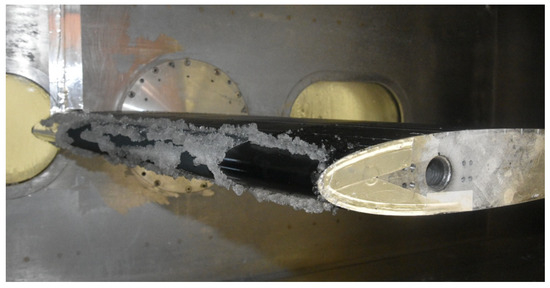
Figure 14.
Leading edge ice formation when only sheet A was turned on.
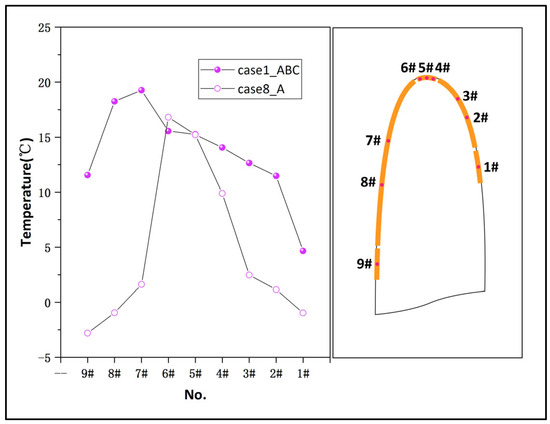
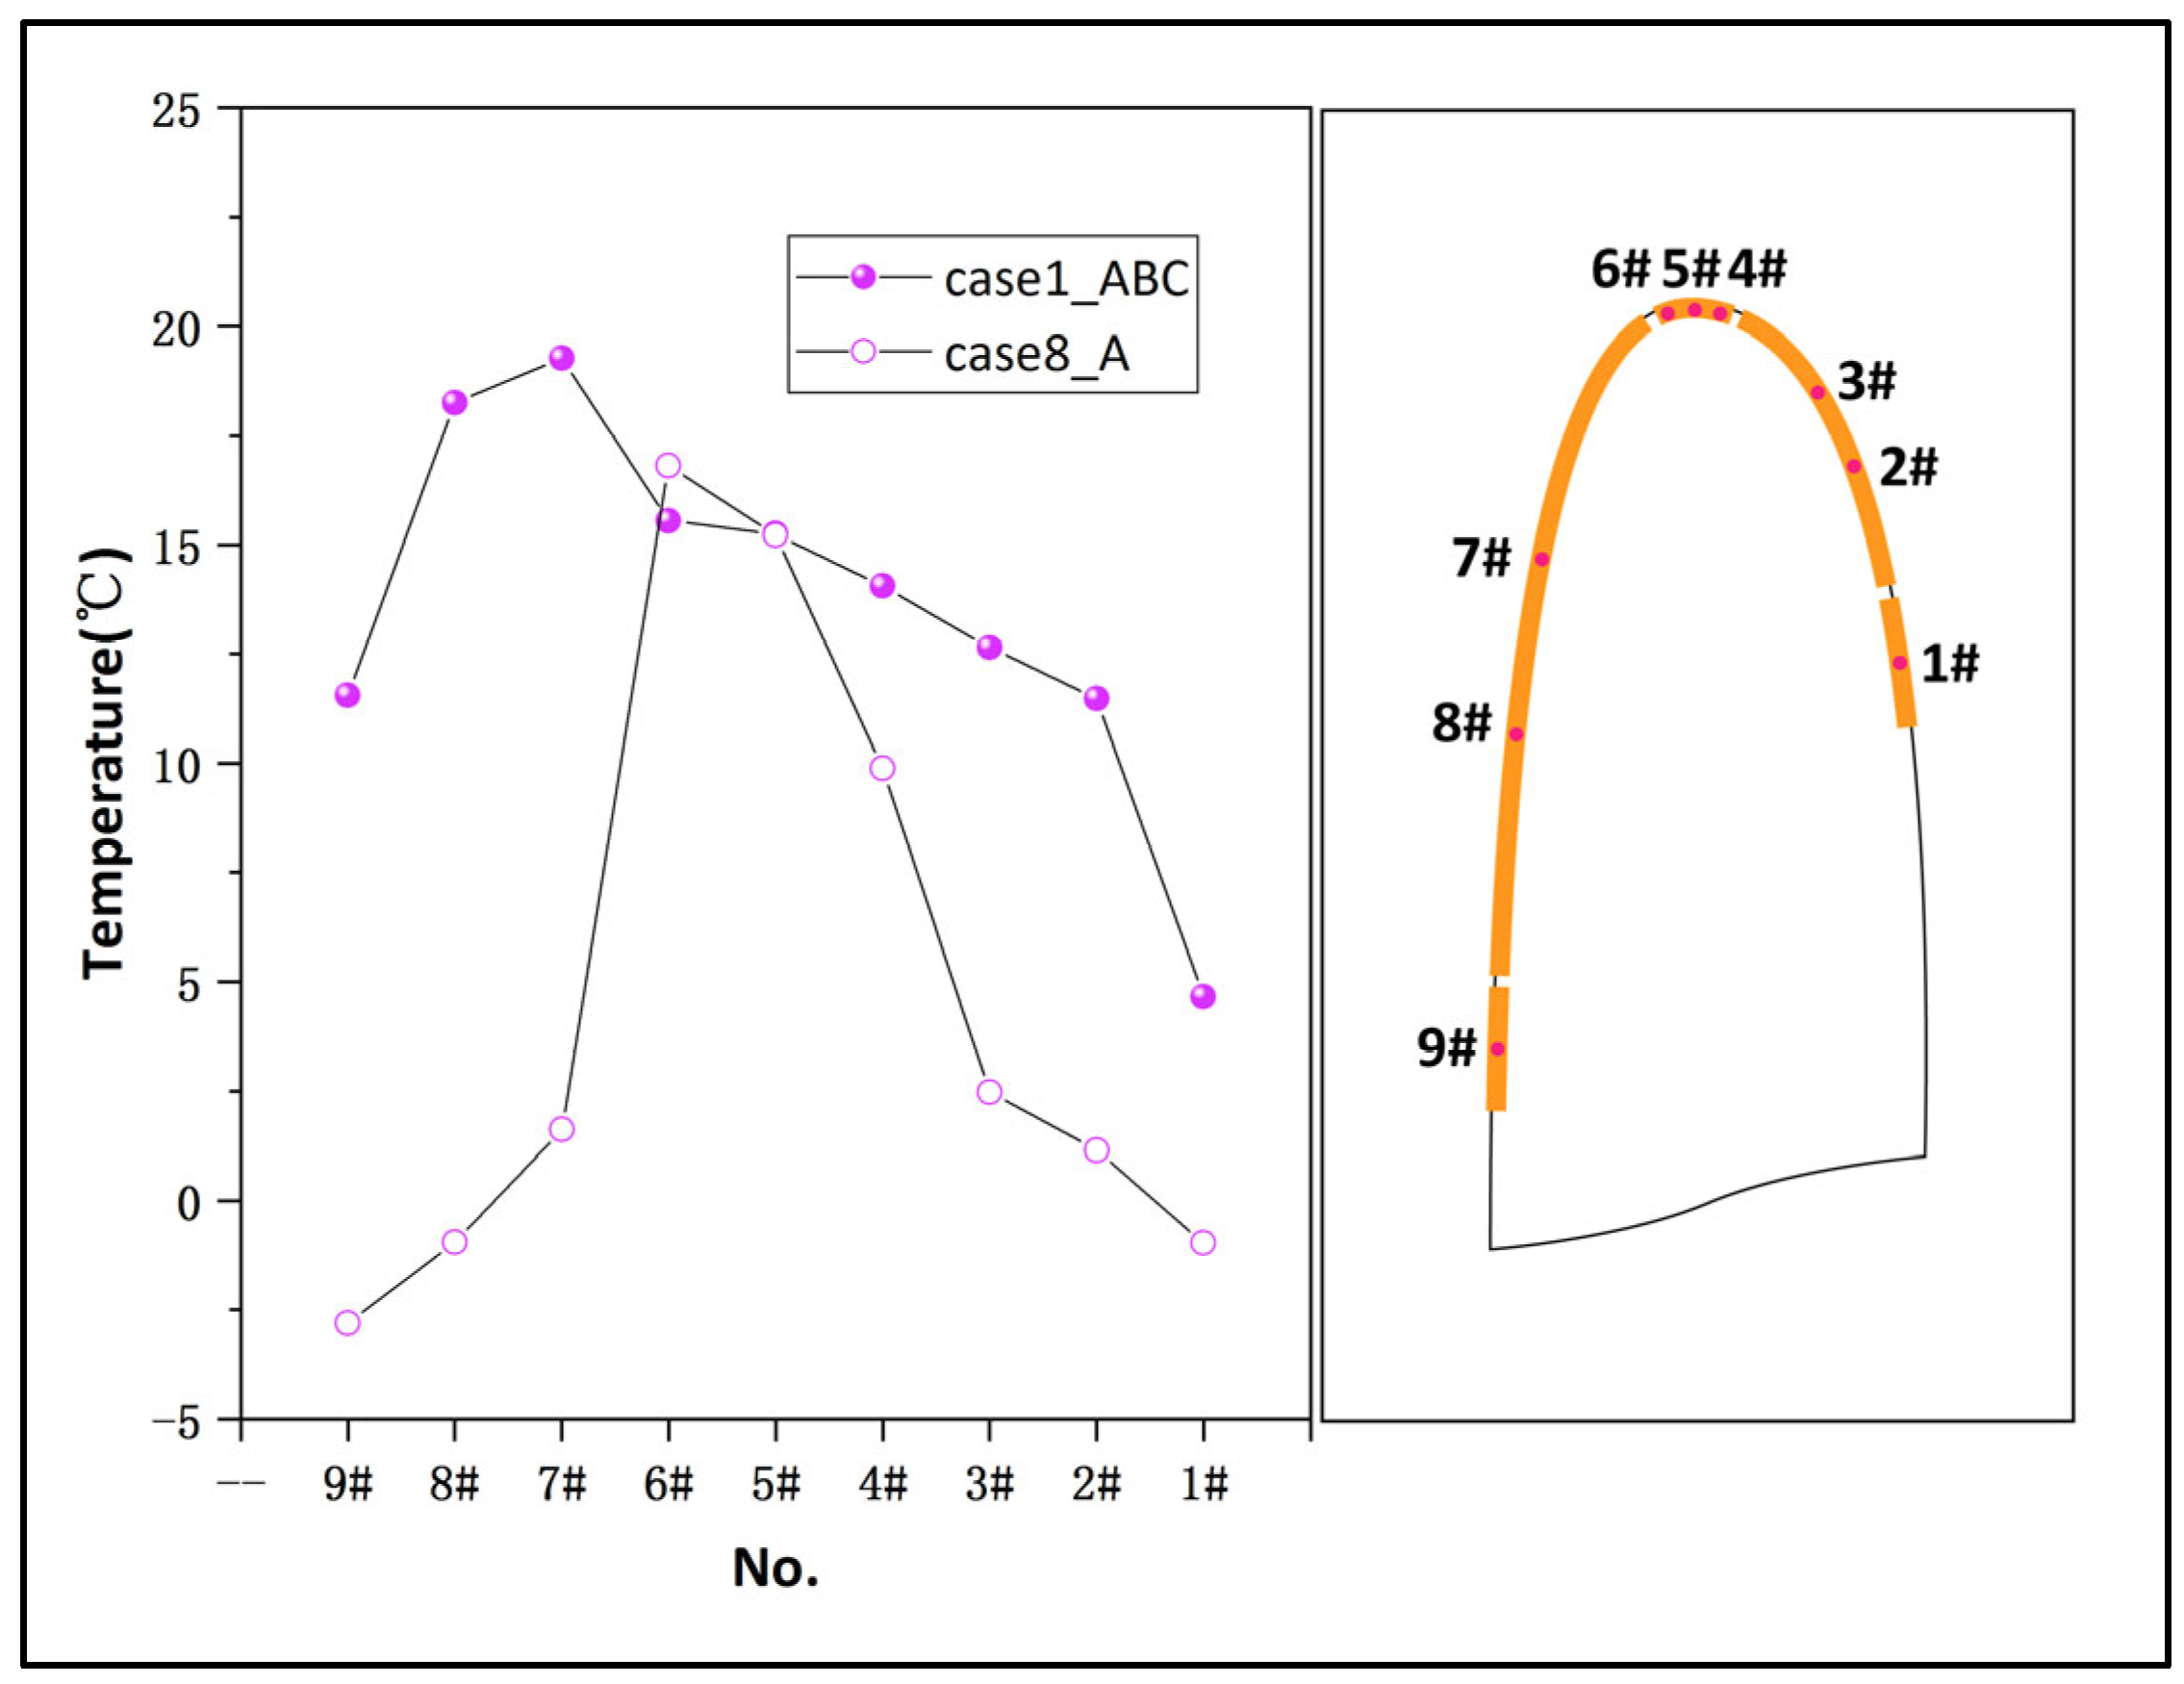
Figure 15.
Comparison of surface temperature with sheet A on and sheets A/B/C all on.
3.2.2. Coating Range
Type (3) layout was tested in case 9, where all the heating sheets A/B/C/D/E were turned on and covered with superhydrophobic coatings. Each heating sheet was provided with the same power density which decreased gradually during the test until ice formation occurred. Heating power details are shown in Table 6. On the first attempt, a power density of 5 kW/m2 was chosen based on the minimum power density obtained from the pre-tests described above. This was evidently sufficient to prevent ice formation due to the additional sheets D and E. However, when the provided power density fell to 4 kW/m2, ice appeared on the leading edge, as shown in Figure 16. The ice protection results are shown in Table 6. At a power density of 4.5 kW/m2, the total power of sheets A/B/C/D/E was 466 W, whereas the total power at a power density of 5 kW/m2 with sheets A/B/C on was 396 W. Increased coating range led to a decrease in heating power density but not in the total power.
Table 6.
Heating power details in case 9.
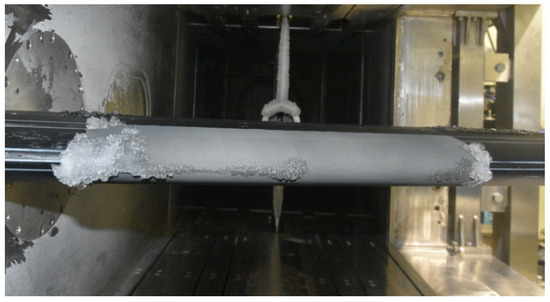
Figure 16.
Ice formation on the leading edge at a power density of 4 kW/m2.
It can be seen from this part of the study that increasing the range of superhydrophobic coating and heating, while decreasing the heating power density of heating sheets, cannot lead to a reduction in total heating power consumption. Efficient distribution of heating power remains the key consideration in IPS design, even with a superhydrophobic coating.
3.2.3. Water Fall-off Position
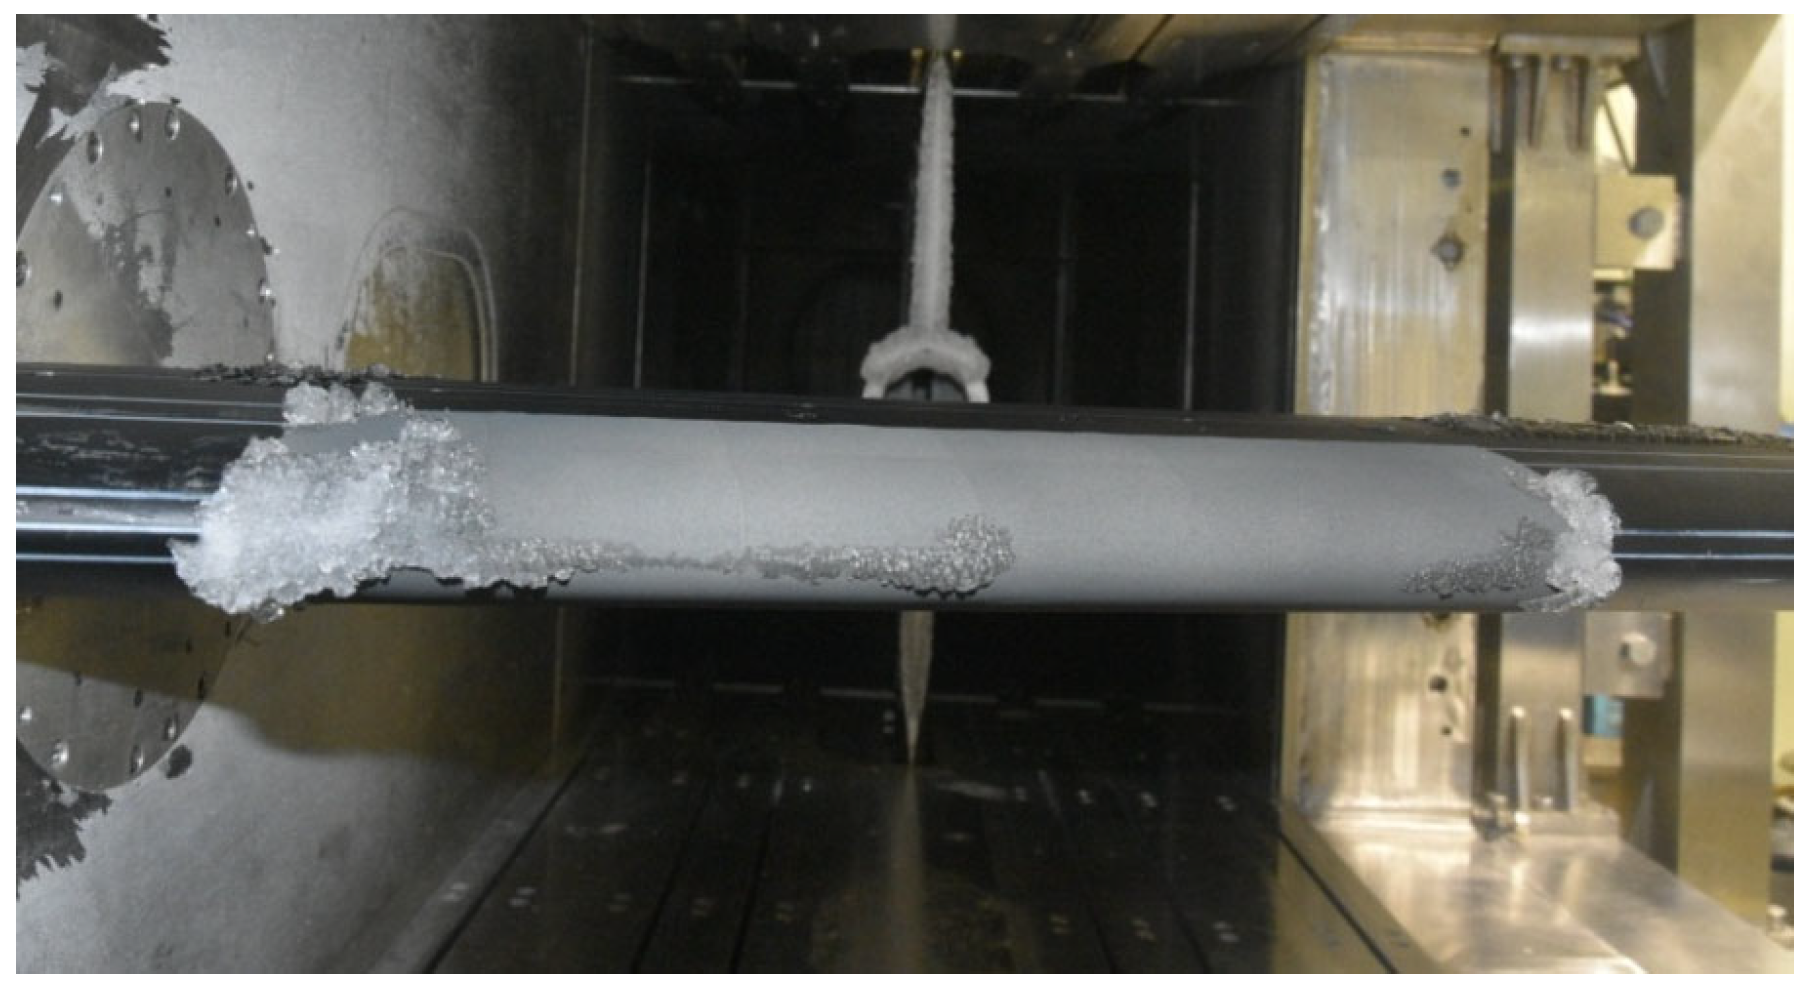
Type (4) layout was tested in case 10. Sheets A/B/C/D/E were provided a high heating power density of 10 kW/m2 to ensure that the water on the protection surface remained in its liquid state. Only sheets D and E were covered with superhydrophobic coating to investigate whether it led to runback water falling off beyond the droplet impingement limit. Aluminum plates covered the sheets A/B/C region to prevent steps between the two regions. Results in Figure 17 showed no ice formation on the heating protected surface, but runback ice formed thereafter. It indicates that the water collected on the sheets A/B/C region did not completely fall off the surface while passing through the sheets D/E region. In case 1, when superhydrophobic coatings covered the sheets A/B/C region, no runback ice formed, indicating that all liquid water fell off within the impingement area. It could be inferred from the comparison of the two test results that it was the droplet impingement area covered with the superhydrophobic coating that effectively impacted droplets falling off.
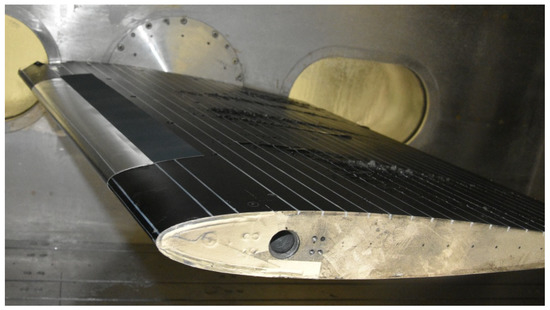
Figure 17.
Runback ice forms after droplet impingement limit.
4. Conclusions
This paper investigated the sensitivity of the superhydrophobic coating range, heating range and power to icing environmental parameters. Based on the results of the tests, the following conclusions were derived:
- IPS with a coating prevented runback ice formation and reduced the power consumption by more than 50% compared to IPS with no coatings.
- IPS is highly sensitive to environment temperature. A designed IPS might not work well when environment temperature is beyond the design point.
- IPS is sensitive to MVD which determines the area that needs to be protected and is less sensitive to LWC. Nonetheless, increased MVD and LWC at the same time may demand enhancing the IPS’s heating power.
- The droplet impingement area is where the superhydrophobic coating works. The coating cannot promote all the water falling off when situated outside the impingement area. Therefore, the superhydrophobic coating needs to cover the droplet impingement area only.
- Sufficient heating power is required to keep the surface temperature of the superhydrophobic coating above the freezing point. Effective heat distribution on the surface is critical to IPS design.
In general, when applying the new IPS method that combines thermoelectric and superhydrophobic coatings to an aircraft, the design of its protection range requires no additional consideration compared to conventional designs. In terms of energy consumption, it is necessary to ensure that the surface temperature is above 0 °C or slightly higher for optimal anti-icing performance. However, the addition of superhydrophobic coatings may result in a decrease in the heat transfer efficiency. Thus, the measured and adjustable temperature inside the model needs to be a little higher than the temperature one wants to achieve on the surface of the superhydrophobic coating. Detailed research on the heat transfer process and temperature variations is likely to be necessary in the future.
Author Contributions
Conceptualization, L.Y. and D.Z.; Methodology, L.Y.; Software, Y.W.; Validation, Y.W. and H.Z.; Data curation, H.Z.; Writing—original draft, L.Y.; Writing—review & editing, L.Y.; Supervision, D.Z.; Project administration, D.Z. All authors have read and agreed to the published version of the manuscript.
Funding
This research was funded by the National Key R&D Program of China, grant number 2022YFE0203700.
Data Availability Statement
Not applicable.
Acknowledgments
We acknowledge the Liaoning Provincial Key Laboratory of Aircraft Ice Protection, Joint Research Center for Advanced Materials and Anti-icing of Tsinghua University (SMSE)-AVIC ARI and the China-Italy Joint Laboratory on Green Aviation Technology for the support for this research.
Conflicts of Interest
The authors declare no conflict of interest.
References
- Thomas, S.K.; Cassoni, R.P.; MacArthur, C.D. Aircraft Anti-Icing and De-Icing Techniques and Modeling. J. Aircr. 1996, 33, 841–854. [Google Scholar] [CrossRef]
- Papadakis, M.; Wong, S.H. Parametric Investigation of a Bleed Air Ice Protection System. In Proceedings of the 44th AIAA Aerospace Sciences Meeting and Exhibit, Reno, NV, USA, 9–12 January 2006; p. 1013. [Google Scholar]
- Wright, W.B.; Keith, T.G. Numerical Simulation of Icing, Deicing and Shedding. In Proceedings of the 29th Aerospace Sciences Meeting, Reno, NV, USA, 7–10 January 1991; p. 665. [Google Scholar]
- Alegre, N.; Hammond, D. Experimental Setup for the Study of Runback Ice at Full Scale. J. Aircr. 2011, 48, 1978–1983. [Google Scholar] [CrossRef]
- Gent, R.W.; Ford, J.M.; Miller, D.R. SLD Research in the UK; SAE International: Montreal, QC, Canada, 2003. [Google Scholar]
- Rosen, K.M.; Potash, M.L. 40 years of helicopter ice protection experience at Sikorsky Aircraft. In Proceedings of the AIAA 19th Aerospace Sciences Meeting, St. Louis, MO, USA, 12–15 January 1981. [Google Scholar]
- Fortin, G.; Beisswenger, A.; Perron, J. Centrifuge Adhesion Test to Evaluated Icephobic Coatings. In Proceedings of the 2nd Atmospheric and Space Environment, Toronto, ON, Canada, 2–5 August 2010. [Google Scholar]
- Laforte, C.; Beisswenger, A. Icephobic Material Centrifuge Adhesion Test. In Proceedings of the 11th International Workshop on Atmospheric Icing on Structures, Montreal, QC, Canada, 12–16 June 2005. [Google Scholar]
- Fortin, G.; Perron, J. Spinning Rotor Blade Tests in Icing Wind Tunnel, American Institute of Aeronautics and Astronautics. In Proceedings of the 1st Atmospheric and Space Environment, San Antonio, TX, USA, 22–25 June 2009. [Google Scholar]
- Kimura, S.; Yamagishi, Y.; Sakabe, A.; Adachi, T.; Shimanuki, M. A new surface coating for prevention of icing on airfoils. In Proceedings of the SAE Aircraft and Engine Icing International Conference, Seville, Spain, 24–27 September 2007. [Google Scholar]
- Cao, L.; Jones, A.K.; Sikka, V.K.; Wu, J.; Gao, D. Anti-icing superhydrophobic coatings. Langmuir 2009, 25, 12444–12448. [Google Scholar] [CrossRef] [PubMed]
- Antonini, C.; Innocenti, M.; Horn, T.; Marengo, M.; Amirfazli, A. Understanding the effect of superhydrophobic coating on energy reduction in anti-icing systems. Cold Reg. Sci. Technol. 2011, 67, 58–67. [Google Scholar]
- Mangini, D.; Antonini, C.; Marengo, M.; Amirfazli, A. Runback Ice Formation Mechanism on Hydrophilic and Superhydrophobic Surfaces. Cold Reg. Sci. Technol. 2015, 109, 53–60. [Google Scholar] [CrossRef]
- Yin, L.; Zhu, L.; Wang, Q.; Ding, J.; Chen, Q. Superhydrophobicity of Natural and Artificial Surfaces under Controlled Condensation Conditions. ACS Appl. Mater. Interfaces 2011, 3, 1254–1260. [Google Scholar] [CrossRef] [PubMed]
- Fortin, G.; Adomou, M.; Perron, J. Experimental Study of Hybrid Anti-Icing Systems Combining Thermoelectric and Hydrophobic Coatings; SAE International: Montreal, QC, Canada, 2011. [Google Scholar]
- De Pauw, D.; Dolatabadi, A. Effect of Superhydrophobic Coating on the Anti-Icing and Deicing of an Airfoil. J. Aircr. 2017, 54, 490–499. [Google Scholar] [CrossRef]


Disclaimer/Publisher’s Note: The statements, opinions and data contained in all publications are solely those of the individual author(s) and contributor(s) and not of MDPI and/or the editor(s). MDPI and/or the editor(s) disclaim responsibility for any injury to people or property resulting from any ideas, methods, instructions or products referred to in the content. |
© 2023 by the authors. Licensee MDPI, Basel, Switzerland. This article is an open access article distributed under the terms and conditions of the Creative Commons Attribution (CC BY) license (https://creativecommons.org/licenses/by/4.0/).