Article

Response-Surface-Methodology-Based Optimization of High-Quality Salvia hispanica L. Seed Oil Extraction: A Pilot Study

by
Manee Saelee
1,
Bhagavathi Sundaram Sivamaruthi
2,3,
Periyanaina Kesika
2,3,
Sartjin Peerajan
4,
Chawin Tansrisook
2,
Chaiyavat Chaiyasut
2,* and
Phakkharawat Sittiprapaporn
1,*
1
Neuropsychological Research Laboratory, Neuroscience Research Center, School of Anti-Aging and Regenerative Medicine, Mae Fah Luang University, Bangkok 10110, Thailand
2
Innovation Center for Holistic Health, Nutraceuticals, and Cosmeceuticals, Faculty of Pharmacy, Chiang Mai University, Chiang Mai 50200, Thailand
3
Office of Research Administration, Chiang Mai University, Chiang Mai 50200, Thailand
4
Health Innovation Institute, Chiang Mai 50200, Thailand
*
Authors to whom correspondence should be addressed.
Appl. Sci. 2023, 13(11), 6600; https://doi.org/10.3390/app13116600
Submission received: 30 March 2023 / Revised: 26 May 2023 / Accepted: 27 May 2023 / Published: 29 May 2023
(This article belongs to the Special Issue Trends in Grain Processing for Food Industry)

Abstract

:

Featured Application

The present results provide the optimal conditions (size of the restriction die, pressing temperature, and duration of dry heat exposure) to extract chia seed oil via the screw press method.

Abstract

Chia seeds play an important role in human health and nutrition since they contain dietary fiber, lipids, protein, polyphenolic compounds, and polyunsaturated fatty acids. The present study aimed to evaluate the yield and quality of chia seed oil (extracted using the screw press method) in terms of total phenolic content, acid, and peroxide levels. A central composite design was used to optimize the extraction procedure, and the response surface methodology was used to assess the results. The restriction die size of 1 cm, pressing temperature of 53 °C, and no dry heat were the optimal conditions for extracting the desired quality of chia seed oil according to the predicted response surface methodology model. The conditions were evaluated and a 29.47% yield was achieved, with a TPC of 2.20 µg GAE/g of oil, acid content of 0.96 mg KOH/g of oil, and peroxide content of 2.87 mEq/Kg of oil. The extraction process exceeded 45.10 min. Antioxidant activities of 19.21 μg TE/g of oil (ABTS radical scavenging activity), 5.69 μg TE/g of oil (DPPH radical scavenging activity), and 186.68 μg CE/g of oil (nitric oxide free radical scavenging activity) were observed. The fatty acid composition of the chia seed oil samples is also reported herein. We report the optimal conditions for extracting oil from local cultivar chia seeds, thus helping to analyze changes in the composition and impact due to geographical differences in oil quality. The extracted chia seed oil could be utilized for functional foods, cosmetics, and pharmaceutical applications.

1. Introduction

Salvia hispanica L., popularly known as chia, is a member of the Lamiaceae family [1]. Chia is an annual plant widely cultivated because of its culinary and medicinal uses [2]. This plant can be grown in various climates, from tropical to subtropical [3]. The chia plant can reach a height of 1 m and has oppositely arranged leaves with small white or purple hermaphrodites. The oval, smooth, and shiny seeds can be gray, black, black spotted, or white, with sizes ranging from 1 to 2 mm [4]. When soaked in water, chia seeds become gelatinous and absorb much water [5].
An early study reported the composition of chia seeds grown in several geographical locations under different climatic conditions [6]. Chia seeds have high antioxidant potential [7] and are widely recognized for their high amounts of alpha-linolenic acid (ALA), dietary fiber, minerals, omega 3 (n − 3), proteins, phytochemicals such as phenolic compounds [8] (such as caffeic acid, daidzin, gallic acid, protocatechuic ethyl ester, and rosmarinic acid) [7], and vitamins [8]. Quercetin and kaempferol are the main substances in hydrolyzed and crude chia seed extracts, but caffeic and chlorogenic acids are only found in trace amounts [9]. Fatty acids, including alpha-linolenic acid, linoleic acid (L), oleic acid, palmitic acid, and stearic acid, are predominantly observed in chia seed oil (CSO) [3,6].
CSO is extracted using various methods, resulting in varying quality of the oil in terms of fatty acid content, antioxidant activity, and functional properties. Conventional solvent extraction, the cold-pressing method, the ultrasound-assisted method, and the supercritical fluid extraction are techniques used to extract CSO [10]. The cold-press extraction method is a mechanical extraction technique using a screw press without organic treatment or heat application on the expeller. This technique is a cheap, nontoxic, environmentally friendly, and green method. Some parameters such as barrel temperature, restriction die, screw press speed, and seed moisture content can affect CSO extraction [11].
The biochemical components of chia seeds increase the satiety index, improve serum lipid levels, prevent inflammation and cardiovascular diseases, and decrease the risk of chronic diseases due to chia’s antioxidant properties [2,12,13]. Chia has also been studied for its cosmetic benefits. Preliminary findings indicate that chia seed exhibits biological functions in the skin, including maintenance of the stratum corneum epidermal barrier, the prevention of transepidermal water loss, and disruption of melanogenesis in epidermal melanocytes [13].
However, many studies have also been conducted to assess the influencing factors of the quality and quantity of CSO. The results could be more consistent due to the variety of chia seeds and culture location. Currently, chia is popular in Thailand due to its health benefits, but there is no experimental design to extract the oil from local chia seeds. Thus, the purpose of this study was to extract CSO using the screw-pressing method and evaluate the quality of the oil. The response surface methodology (RSM) and central composite design (CCD) were used to optimize the conditions to achieve high-quality CSO.

2. Materials and Methods

2.1. Materials

Chia seeds were purchased from a local market in Chiang Mai province. The following chemicals were used in this study: Folin–Ciocalteu reagent, sulfanilamide, K2HPO4, and KH2PO4 were purchased from Loba Chemie (Maharashtra, India). Naphthyl ethylenediamine dihydrochloride and Na2CO3 were bought from HiMedia (Maharashtra, India) and RCI Labscan (Bangkok, Thailand), respectively. Merck (Darmstadt, Germany) supplied gallic acid, methanol, and phosphoric acid. Acetic acid, hexanes, sodium thiosulfate pentahydrate, NaCl, KI, ethanol, and KOH were purchased from RCI Labscan (Bangkok, Thailand). Lastly, 2,2′-azinobis (3-ethylbenzothiazoline-6-sulfonic acid) di-ammonium salt and 2,2-diphenyl-1-picrylhydrazyl (±)-6-hydroxy-2,5,7,8-tetramethyl were purchased from Sigma-Aldrich (Oakville, Canada).

2.2. Moisture Content, Extraction, and Variables

The moisture content of the chia seeds was analyzed before the experiments were designed. Seeds were incubated at 100 °C for 0, 15, and 30 min [14], and the moisture content was measured using a Moisture Analyzer (Moisture HC103, Mettler Toledo, Switzerland).
Chia seed oil (CSO) was obtained via the screw press extraction method (FEA-101ss-M-H-Tc-2015, Energy Friend Ltd., Chiang Mai, Thailand) [15].
The extraction conditions were optimized through a central composite design (CCD) with three independent variables: the restriction die size, the pressing temperature, and the duration of dry heat exposure at 100 °C. The influence of the variables on CSO extraction was studied through response surface methodology (RSM).
The levels of the duration of dry heat exposure at 100 °C (0, 15, and 30 min), size of the restriction die (1.0, 1.2, and 1.4 cm), and pressing temperature (40, 50, and 60 °C) were chosen as variable factors to attain a high yield and high quality of CSO. An experimental diagram of the chia seed oil extraction is shown in Figure 1. About 600 g of chia seeds were used for the extraction process.
The evaluated responses presented the yield and quality of the oil and time. The antioxidant activities (ABTS, DPPH, and nitric oxide radical scavenging assay) were evaluated by selecting a treatment that affected the total phenolic content (TPC).

2.3. RSM and CCD

To achieve the highest yield and quality of chia seed oil, RSM and CCD were used to optimize the conditions. Design Expert, version 10.0 (Stat-Ease Inc., Minneapolis, MN, USA), was used for the statistical analysis. The objective outcomes were the oil yield and quality. As mentioned previously, the duration of dry heat exposure at 100 °C (0, 15, and 30 min), the size of the restriction die (1.0, 1.2, and 1.4 cm), and the pressing temperature were chosen as the variable factors.
Seventeen tests were carried out, including 14 combinations and 3 center-point replicates (Table 1). The variation in the response values (Y) versus the independent variables was fit into a response surface model and presented (Equation (1)):
Y = β 0 + β i X i + β i i X i 2 + i j β i j X i X j
where Y is the dependent response; β0, βi, βii, and βij are the regression coefficients for the intercept, linear, quadratic, and interaction terms, respectively; and Xi and Xj are independent variables.

2.4. Extraction and Determination of Total Phenolic Content (TPC)

The phenolic compounds in CSO were extracted [16]. In brief, 2.5 g of CSO was mixed with 5 mL hexane and 3 mL of methanol/water (60:40, vol/vol) and vortexed for 2 min. The samples were centrifuged at 3500× g rpm for 10 min, and the methanolic phase was collected. The samples were further extracted twice with a methanol/water solution, and the methanolic phase was collected to determine the TPC [16].
The Folin–Ciocalteu colorimetric technique [17] was used to evaluate the TPC of CSO, and results are expressed as the mg gallic acid equivalent (mg GAE)/g of oil [17].

2.5. Acid and Peroxide Values of CSO

CSO’s acid and peroxide values were determined based on US Pharmacopeia 37, as detailed previously [14]. The acid values are expressed as the mg KOH equivalent/g of oil (Equation (2)) [14]:
mg KOH/g oil = V × 5.61/W
where V and W represent the volume of KOH (mL) and weight of oil (g), respectively, and 5.61 is a constant value (equivalent to a mass of 0.1 M KOH).
The peroxide value is expressed in milliequivalents of oxygen per kg of CSO (mEq/Kg) (Equation (3)) [14]:
mEq/kg = 2 × (A − B)/CSO sample (g).
where A and B represent the sodium thiosulfate (mL) volume in the test and blank, respectively.

2.6. Antioxidant Capacity of CSO

The free radical scavenging activities of CSO were determined using 1,1-diphenyl-2picrylhydrazyl (DPPH), 2,2-azino-bis-3-ethylbenzothiazoline-6-sulfonic acid (ABTS) [18], and a nitric oxide (NO) radical scavenging assay [19], as detailed in our previous studies.
The DPPH and ABTS radical scavenging activity of CSO is expressed as µg Trolox equivalent antioxidant capacity (TEAC)/g of oil. CSO’s nitric oxide scavenging activity is expressed in terms of the µg curcumin equivalent (CE)/g of oil.

2.7. Fatty Acid Content of CSO

As reported in our previous study, the fatty acid content of CSO was analyzed via gas chromatography [14]. The analysis was performed at the Halal Science Center of Chulalongkorn University, Bangkok, Thailand.

2.8. Statistics

The quality evaluation of CSO was performed in duplicate. All values were recorded as the mean ± standard deviation (SD). One-way ANOVA was used to evaluate the differentiation between groups. The differences were considered significant when p < 0.05.

3. Results

The results obtained for the extraction of CSO using the screw press method with different conditions such as the size of the restriction die, pressing temperature, and duration of dry heat exposure are shown in Table 2. Outlier trials were excluded from the analysis. The oil yield varied from 23.86% to 30.15%, and the maximum yield was observed in STD 17. However, when both the quality and amount of oil were considered, STD 13 was found to be suitable.

3.1. Moisture Content
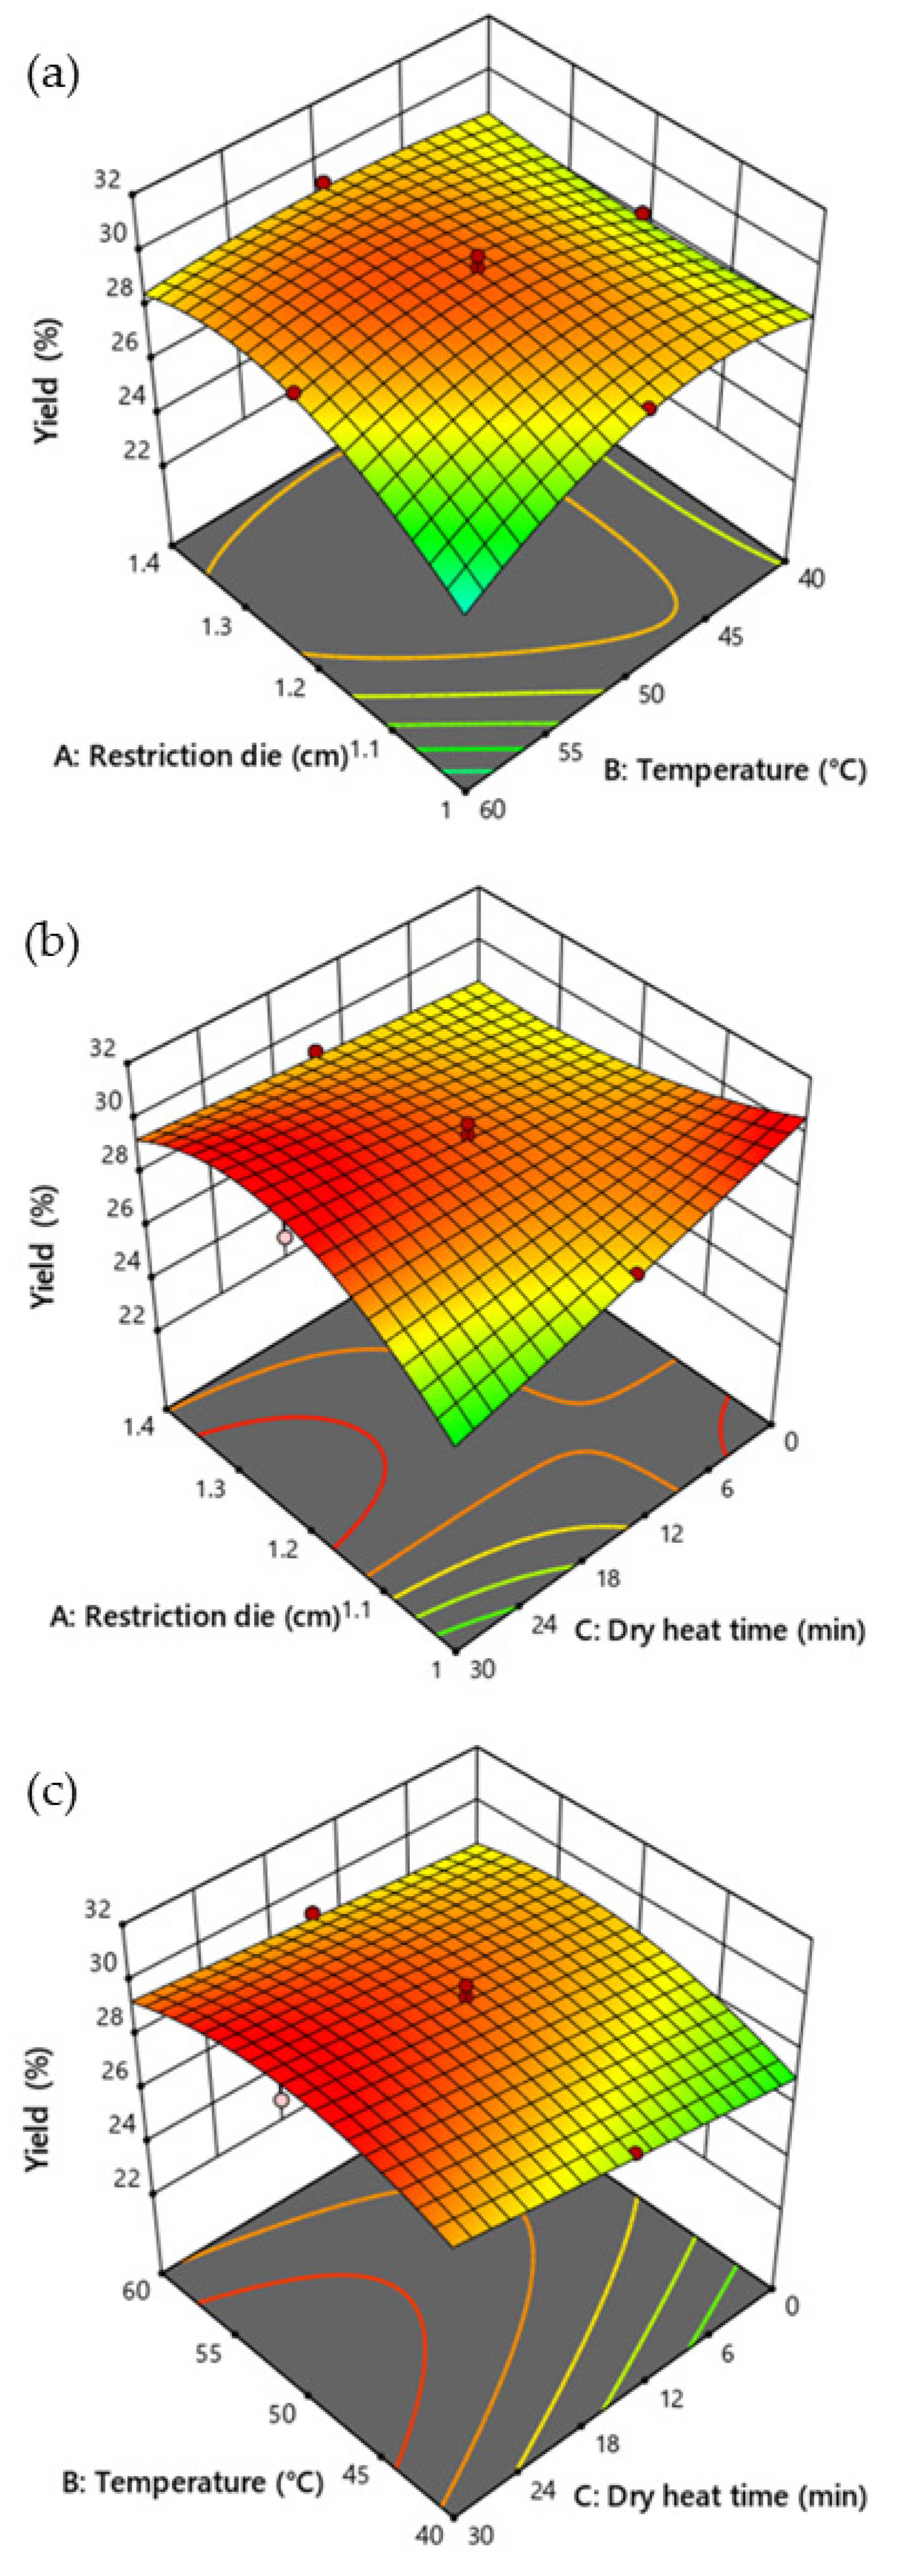
The moisture content of chia seeds was determined before the variables for RSM were designed. The seeds were dried at 100 °C for different durations. About 4.64 ± 0.17, 4.49 ± 0.18, and 4.01 ± 0.50 % MC was observed in the seeds dried for 0, 15, and 30 min, respectively. There were no significant changes observed in the moisture content of the seeds processed for 0 and 15 min, whereas seeds dried for 30 min showed a significant difference in their moisture content (Table 3).

3.2. Yield of CSO

The predicted yield of CSO in the three center-point STDs (size of the restriction die: 1.2 cm; pressing temperature: 50 °C; and duration of dry heat exposure at 100 °C: 15 min) was 29.58%. The observed yield of the three center-point STDs was 29.48, 29.75, and 30.15% (Table 2). The highest predicted yield was observed in STD 14, followed by STD 1. However, the observed maximum yield was obtained in STD 17, followed by STD 1. The changes between STDs 1 and 14 were insignificant. The lowest yield was observed (23.86%) and predicted (23.87%) in STD 7 (size of the restriction die: 1 cm; pressing temperature: 60 °C; and duration of dry heat exposure at 100 °C: 30 min) (Table 2). A reduced cubic model used to evaluate variance in the yield of CSO is presented in Table 4.
The reduced cubic model for oil extraction was significant (p = 0.0021) with adjusted R2 and predicted R2 values of 0.9268 and 0.7595, respectively, and a nonsignificant lack of fit (p = 0.2967). These results indicated that the reduced cubic model equation was appropriate for the prediction of oil extraction.
The CCD-generated reduced cubic model equation for the yield of CSO (%) was as follows (Equation (4)):
Yield = 1 ( 0.1545 + 1.1648 A 0.0031 B + 0.0144 C 0.0134 A B 0.0235 A C + 7.6562 × 10 6 B C 0.5828 A 2 + 0.0002 B 2 + 0.0104 A 2 B + 0.0092 A 2 C 0.0001 A B 2 ) 0.37
where A is the size of the restriction die, B is the pressing temperature, and C is the duration of dry heat exposure.
The size of the restriction die and temperature (p = 0.0059), size of the restriction die and dry heat exposure time (p = 0.0008), size of the restriction die2 (p = 0.0265), temperature2 (p = 0.0076), size of the restriction die2 and temperature (p = 0.0244), and size of the restriction die2 and dry heat exposure time (p = 0.0082) significantly affected the yield of CSO (Table 5). However, the restriction die, temperature, dry heat exposure time, and interaction between temperature and dry heat exposure time did not significantly affect the yield of CSO (Figure 2).

3.3. Total Phenolic Content of CSO
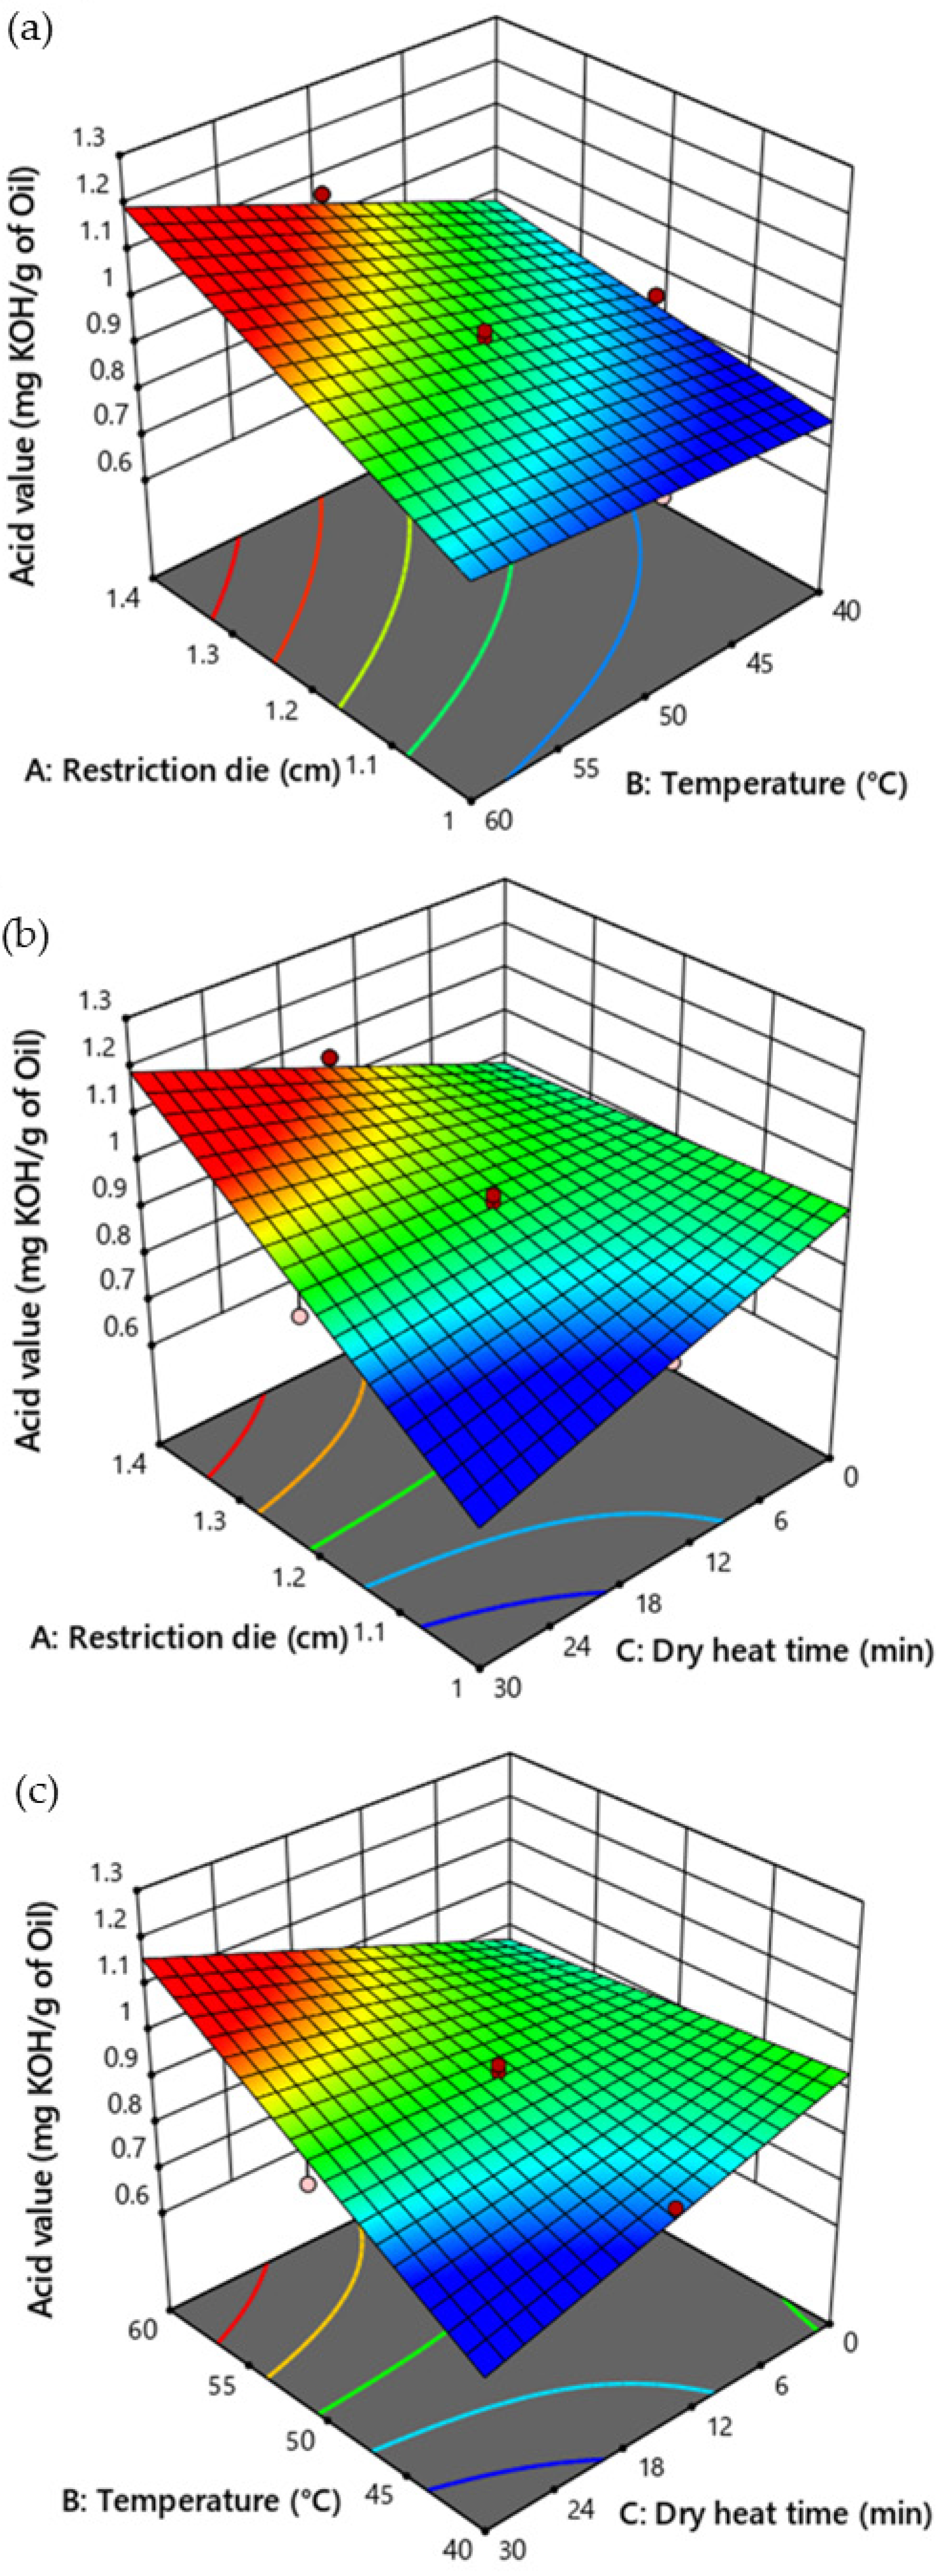
The predicted TPC of CSO in the three center-point STDs (size of the restriction die: 1.2 cm; temperature: 50 °C; and duration of dry heat exposure at 100 °C: 15 min) was 2.33 µg GAE/g of oil. The observed TPC of CSO center-point STDs was 2.86, 2.09, and 2.31 µg GAE/g of oil (Table 2). The maximum TPC was recorded in the predicted (2.57 µg GAE/g of oil) and observed values (2.60 µg GAE/g of oil) for STD 13 (size of the restriction die: 1.2 cm; temperature: 50 °C; and duration of dry heat exposure at 100 °C: 0 min) (Table 2). The reduced quadratic model used to evaluate variances in the TPC of CSO is presented in Table 4.
The reduced quadratic model for the TPC of CSO was significant (p = 0.0004) with adjusted R2 and predicted R2 values of 0.7553 and 0.5608, respectively, and a nonsignificant lack of fit (p = 0.7247). The results indicated that the reduced quadratic model equation was suitable for predicting the TPC of CSO.
The CCD-generated reduced quadratic model equation used for the TPC of CSO (µg GAE/g of oil) was as follows (Equation (5)):
Total   phenolic   acid = 1 ( 1.3199 0.0512 A + 0.1060 B 0.0015 C 0.0011 B 2 ) 0.2
where A is the size of the restriction die, B is the pressing temperature, C is the duration of the dry heat exposure.
The temperature (p = 0.0465), dry heat exposure time (p = 0.0470), and temperature2 (p < 0.0001) significantly affected the TPC of CSO (Table 5). An increase in the duration of dry heat exposure reduced the TPC of CSO. The low (40 °C) and high (60 °C) temperatures affected the TPC of CSO. High TPC was observed in the samples treated at 50 °C. The size of the restriction die did not influence the TPC of CSO (Figure 3).

3.4. Acidity of CSO

The predicted acid value of CSO in the three center-point STDs was 0.92 mg KOH/g of oil. The observed acid values of CSO center-point STDs were 1.18, 0.93, and 0.95 mg KOH/g of oil (Table 2). The smallest acid values of CSO were predicted (0.50 mg KOH/g of oil) and observed (0.85 mg KOH/g of oil) in STD 5 (size of the restriction die: 1 cm; temperature: 40 °C; and duration of dry heat exposure at 100 °C: 30 min), STD 8 (size of the restriction die: 1.4 cm; temperature: 60 °C; and duration of dry heat exposure at 100 °C: 30 min), and STD 9 (size of the restriction die: 1 cm; temperature: 50 °C; and duration of dry heat exposure at 100 °C: 15 min) (Table 2). The 2FI model was employed to evaluate variances in the acid value of CSO (Table 4).
The 2FI model for the acid value of CSO was significant (p = 0.0056) with adjusted R2 and predicted R2 values of 0.8279 and 0.6874, respectively, and a nonsignificant lack of fit (p = 0.2351). The results showed that the 2FI model equation was suitable for predicting the acid value of CSO.
The CCD-generated 2FI model equation for the acid value of CSO (mg KOH/g of oil) was as follows (Equation (6)):
Acid value = 2.9194 –1.5386A − 0.0377B − 0.0984C + 0.0286AB + 0.0467AC+ 0.0009BC
where A is the size of the restriction die, B is the pressing temperature, and C is the duration of dry heat exposure.
The size of the restriction die (p = 0.0007), temperature (p = 0.0032), size of the restriction die and temperature (p = 0.0058), size of the restriction die and dry heat exposure time (p = 0.0008), and temperature and dry heat exposure time (p = 0.0012) significantly affected the acid value of CSO (Table 5). RSM prediction indicated that a lower temperature and reduced size of the restriction die could produce CSO with a lower acid value. All factors greatly influenced the acid value, while dry heat exposure time was not an influencing factor for the acid value (Figure 4).

3.5. Peroxide Value of CSO
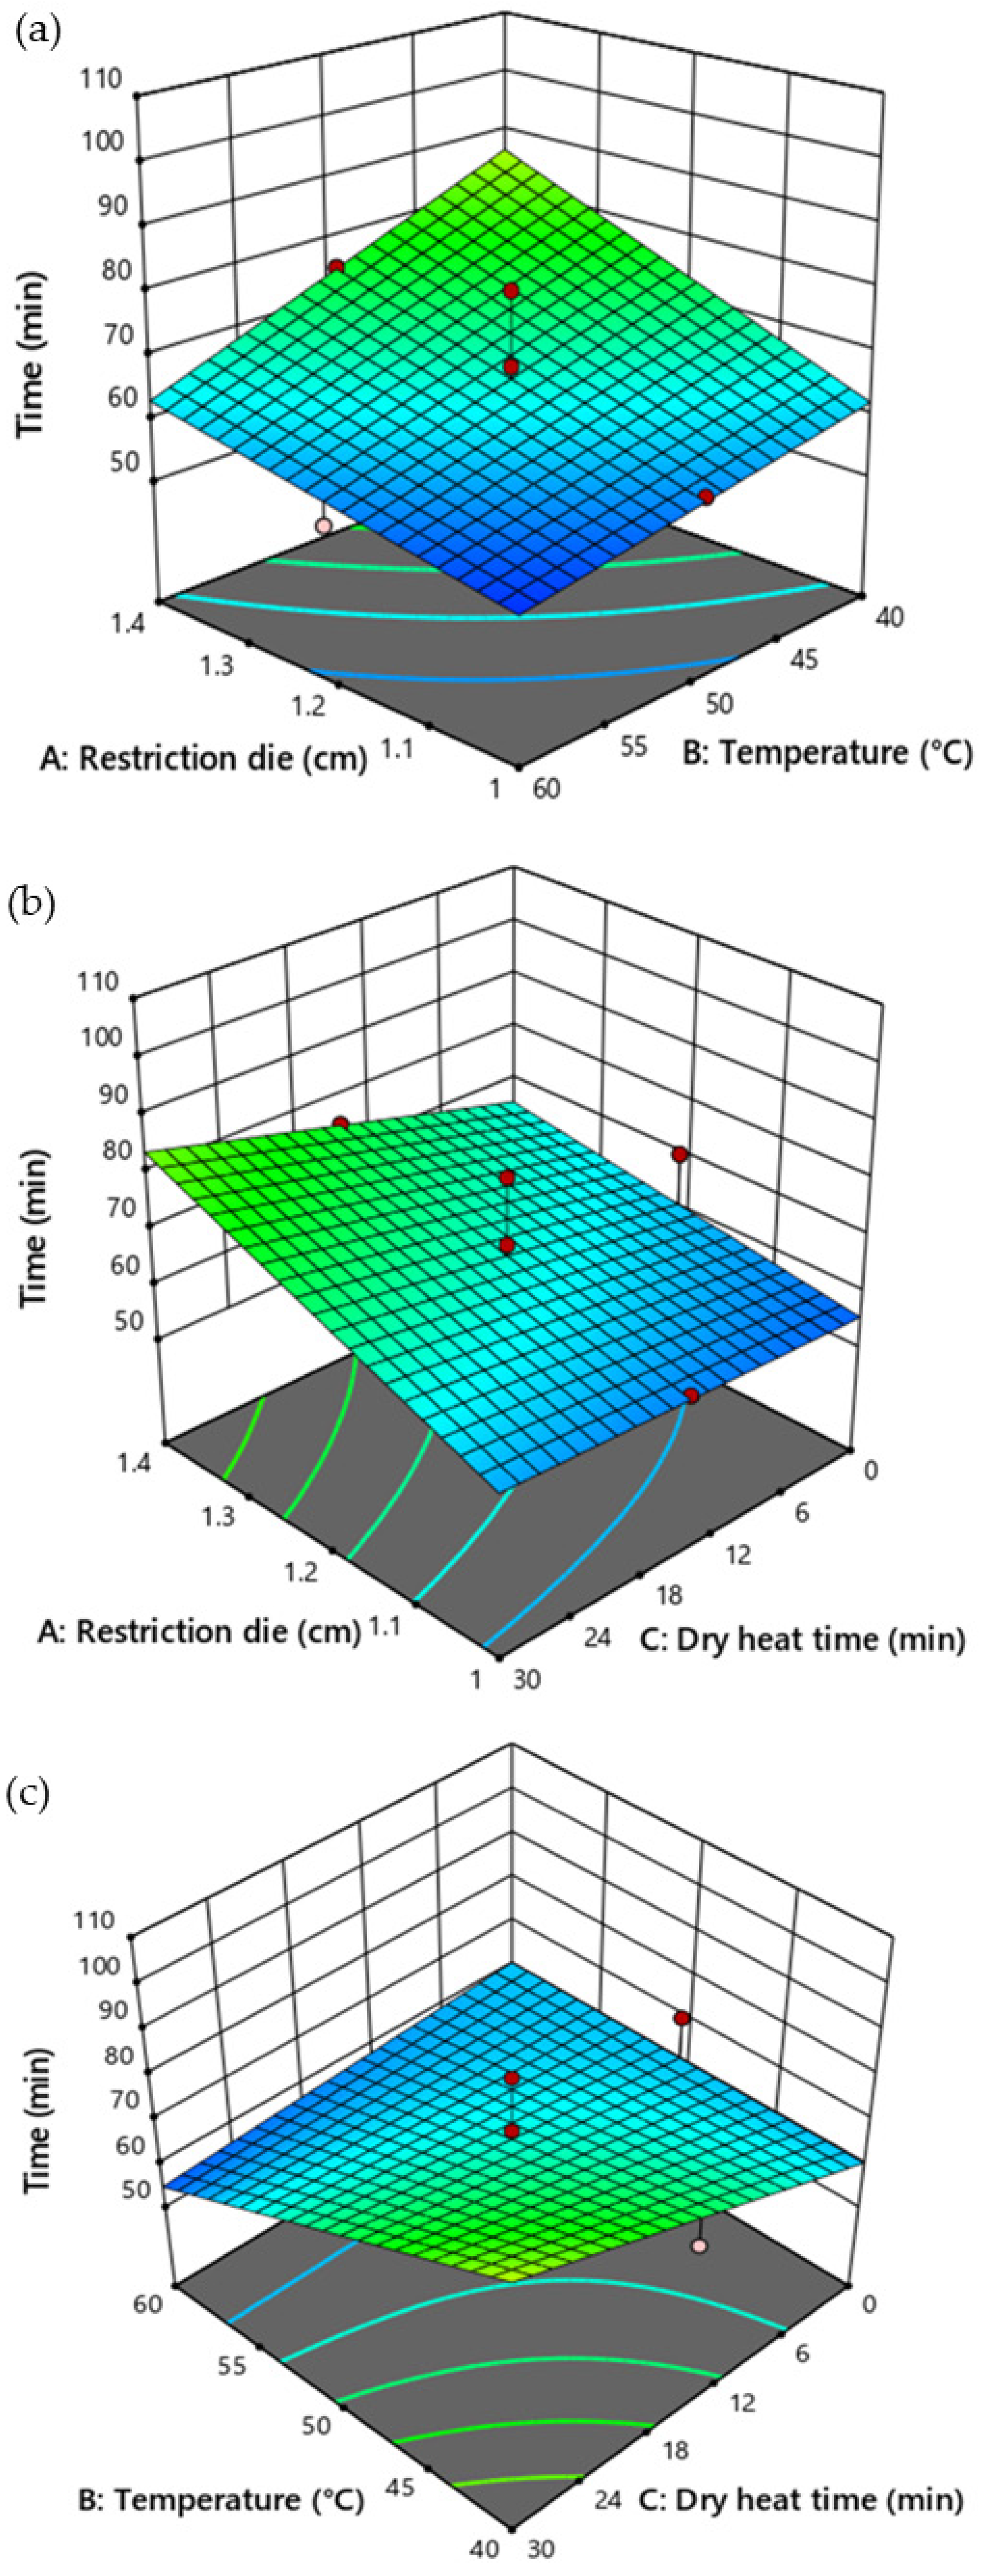
The predicted peroxide value of CSO in the three center-point STDs was 6.15 mEq/Kg of oil. The observed peroxide values of CSO center-point STDs were 6.37, 6.64, and 7.39 mEq/Kg of oil (Table 2). The smallest peroxide value of CSO was predicted (3.35 mEq/Kg of oil) and observed (3.53 mEq/Kg of oil) in STD 3 (size of the restriction die: 1 cm; temperature: 60 °C; and duration of dry heat exposure at 100 °C: 0 min) and STD 13 (size of the restriction die: 1.2 cm; temperature: 50 °C; and duration of dry heat exposure at 100 °C: 0 min) (Table 2). The reduced cubic model was employed to evaluate variances in the peroxide value of CSO (Table 4).
The reduced cubic model for the peroxide value of CSO was significant (p = 0.0005) with adjusted R2 and predicted R2 values of 0.8389 and 0.7110, respectively, and a nonsignificant lack of fit (p = 0.2604). The results revealed that the reduced cubic model equation was suitable for predicting the peroxide value of CSO.
The CCD-generated reduced cubic model equation for the acid value of CSO (mEq/Kg of oil) was as follows (Equation (7)):
Peroxide   value = 1 ( 0.4650 + 0.2438 A + 0.0063 B 0.0530 C 0.0059 A B + 0.0008 B C + 0.0018 C 2 3.0026 × 10 5 B C 2 ) 0.25
where A is the size of the restriction die, B is the pressing temperature, and C is the duration of dry heat exposure.
The temperature (p = 0.0039), dry heat exposure time (p = 0.0161), dry heat exposure time2 (p < 0.0001), and temperature and dry heat exposure time2 (p < 0.0017) significantly influenced the peroxide value of CSO (Table 5). RSM prediction indicated that a high temperature could produce CSO with a lower peroxide value. Additionally, the high (30 min) and low (0 min) durations of dry heat exposure presented lower peroxide values. However, the size of the restriction die did not significantly affect the peroxide values (Figure 5).

3.6. Pressing Time

The pressing time for CSO extraction in the three center-point STDs was 66.03 min. The observed pressing times for CSO extraction in center-point STDs were 80.00, 51.00, and 68.00 min (Table 2). The lowest pressing times for CSO extraction were predicted (46 min) and observed (80.00 min) in STD 7 (size of the restriction die: 1 cm; temperature: 60 °C; and duration of dry heat exposure at 100 °C: 30 min) and STD 1 (size of the restriction die: 1 cm; temperature: 40 °C; and duration of dry heat exposure at 100 °C: 0 min) (Table 2). The 2FI model was utilized to evaluate variances in the pressing time for CSO extraction (Table 4).
The 2FI model for the pressing time of CSO extraction was significant (p = 0.0233) with adjusted R2 and predicted R2 values of 0.6175 and 0.5119, respectively, and a nonsignificant lack of fit (p = 0.9798). The results revealed that the 2FI model equation was suitable for predicting the pressing time of CSO extraction.
The CCD-generated 2FI model equation for the pressing time of CSO extraction (min) was as follows (Equation (8)):
Time = –79.6031 + 116.5072A + 2.1827B + 1.7049C − 1.8126AB + 1.2082AC − 0.0558BC
where A is the size of the restriction die, B is the pressing temperature, and C is the duration of dry heat exposure.
The size of the restriction die (p = 0.0258) and temperature (p = 0.0328) influenced the extraction time of CSO significantly (Table 5). RSM prediction showed that the reduced size of the restriction die and high temperature could reduce the pressing time needed for CSO extraction. However, the duration of dry heat exposure time did not affect the pressing time (Figure 6).

3.7. Fatty Acid Composition

CSO extracted under optimal conditions (based on the design-expert-recommended conditions for the desirable traits) and STD 13 (based on the observed desirable traits) were selected for the fatty acid analysis. The fatty acid composition of the representative CSO samples was reported (Table 6). The order of fatty acid abundance in CSO observed in the study was as follows: α-linolenic acid > linoleic acid > palmitic acid > oleic acid > stearic acid > eicosenoic acid > palmitoleic acid > myristic acid. About 1.49% and 1.54% of unidentified peaks were observed in the CSO extracted under optimal conditions and STD 13, respectively. Other fatty acids were not detected.

3.8. Antioxidant Capacity of CSO

The treatments that had an impact on the TPC were selected to evaluate their antioxidant capacity. STD 13 (size of the restriction die: 1.2 cm; temperature: 50 °C; and duration of dry heat time: 0 min) presented the greatest ABTS and DPPH scavenging activities. The maximum value of 19.21 μg TE/g of oil was observed in the ABTS assay, and the values were significantly different from those of other STDs. The smallest value of 8.18 μg TE/g of oil was observed in STD 5 (size of the restriction die: 1.0 cm; temperature: 40 °C; and duration of dry heat time: 30 min) (Figure 7A). In the DPPH assay, the highest (STD 13) and lowest (STD 4) values of 5.69 ± 0.21 and 2.66 μg TE/g of oil, respectively, were detected (Figure 7B). The maximum NO scavenging activity of 186.68 μg CE/g of oil was observed in STD 7 (size of the restriction die: 1 cm; temperature: 60 °C; and duration of dry heat time: 30 min). The NO scavenging activity of the CSO samples of STD 7 did not differ significantly from that of the other STDs (Figure 7C).

4. Discussion

Previous studies reported the influence of several factors in CSO extraction and its quality. Fernandes et al. (2012) reported the influence of different methods on the yield of CSO. The cold solvent, pressing, and supercritical CO2 methods yielded 19.28 ± 0.74, 20.01 ± 0.95, and 24.64% of oil, respectively [20]. Similarly, the effects of different extraction methods (solvent extraction, Soxhlet extraction, and screw-pressing methods) were reported. The results showed that solvent extraction was the optimal method for high-quality oil extraction [21]. Maximum (92.8%) oil yield was obtained from Mexican chia seed using the supercritical CO2 method (with a pressure of 450 bar and extraction time of 300 min) [22]. Uribe et al. (2011) reported that high oil yield was obtained from chia seeds via the supercritical CO2 method (at a pressure of 408 bar and temperature of 80 °C). The study stated that pressure had a greater influence on oil yield [23]. The type of solvents and solvent and seed ratio affected the yield of CSO [24].
The optimal conditions to extract the maximum residual oil from partially defatted chia flour were 10.2% moisture content and a 58.5 °C pressing temperature [25]. Ghafoor et al. (2020) reported that roasting temperature affects the yield of CSO. Maximum oil was extracted from chia seeds roasted at a high temperature (180 °C) [2]. Martínez et al. (2012) [11] discovered that seed moisture and pressing speed affected oil yield when using a Komet screw press but that the pressing temperature and restriction die had no effect. Chia seed by-products (chia seed meal and fibrous fractions) subjected to the pressing extraction method produced a high yield of residual oil [26]. The maximum yield (30.15%) of CSO was observed with the following conditions: size of the restriction die: 1.2 cm; temperature: 50 °C; and duration of dry heat exposure at 100 °C: 15 min (Table 2). The size of the restriction die, temperature, and duration of dry heat exposure had no effect on the yield, while the interaction and quadratic model influenced the yield (Figure 2). Additionally, the moisture content of the chia seed did not affect the CSO yield.
Martínez-Cruz and Paredes-López (2014) [7] reported on chia seed extract (from chia powder) containing 1.63 mg GAE/g of chia seed and revealed that the primary phenolic compounds were rosmarinic, protocatechuic, caffeic, and gallic acids and daidzin. Chia seeds roasted at different temperatures were subjected to oil extraction. The TPC of CSO varied depending on the roasting temperature. TPC was found to be decreased in samples undergoing high-temperature roasting [2]. The TPC of roasted CSO was lower than that of non-roasted oil, although cold-press extraction was not different from Soxhlet extraction in terms of TPC [27]. However, Ixtaina et al. (2011) reported that total polyphenolic compounds were higher in CSO extracted using the pressing method than those obtained via the solvent extraction method [3]. The size of the restriction did not affect the TPC of CSO. The increase in the duration of dry heat exposure reduced the TPC of CSO, indicating that prolonged heat exposure might degrade the phytocompounds in the oil. Pressing temperature also affected the TPC (Figure 3). The experimental data revealed that maximum TPC was observed in one of the center-point STDs. In detail, the restriction die size (1.2 cm), temperature (50), and duration of dry heat treatment (15 min) aided in producing CSO with a TPC of 2.86 μg GAE/g of oil (Table 2).
The breakdown of triacylglycerol could contribute to an increase in the total acidity of CSO [2]. CSO had higher acid values when extracted with a solvent (using a Soxhlet apparatus and thermal cycles at 80 °C for 8 h) than when extracted via pressing (using a Komet screw press at 25 to 30 °C) [3]. This result could be explained by the fact that heating causes oil oxidation, which raises the acid value. The results demonstrated that high temperatures influenced the acid values. Acid values of CSO extracted by the cold solvent, pressing, and supercritical methods were 1.13 ± 0.21, 1.18 ± 0.06, and 1.41 ± 0.46 mg KOH/g oil, respectively [20]. However, in the present study, none of the samples exceeded the upper limit of the acid value (4 mg KOH/g of oil) established by the Thai community product standards (Thailand Ministry of Public Health (No. 421), B.E. 2564 Issued under the Food Act B.E. 2522 on oils and fats) (Table 2). RSM prediction showed that a low temperature, lowered restriction die size, and high dry heat exposure time (i.e., low moisture content) aided in the extraction of CSO with a lower acid value (Figure 4). The experimental data indicated that die size (1 or 1.4 cm), temperature (50 or 60), and dry heat time (15 or 30 min) produced CSO with 0.80 mg KOH/g of oil (Table 2).
According to the study on oil quality, the peroxide value trends for canola, corn, and sunflower oils fluctuate. This fluctuation is caused by the primary oxidation products of lipid oxidation and hydroperoxides, which are formed from unsaturated fatty acids. The initial increase in the peroxide value demonstrated a larger concentration of hydroperoxides. However, the peroxide value was reduced in the secondary oxidation products [28,29]. The peroxide values of oil decreased with an increase in temperature under microwave treatments [30]. According to Ghafoor et al. (2020) [2], increasing the roasting temperature led to a rise in the peroxide values of CSO from 3.21 meqO2/kg (control) to 18.42 meqO2/kg (180 °C). Peroxide content was used to estimate the degree of oxidation of edible oils. Applying heat during chia seed roasting may influence the oxidation reaction, thus increasing the peroxide index of CSO [2]. CSO extracted from pretreated (water boiling, microwave roasting, oven drying, and autoclaving) chia seeds with pressing methods presented peroxide values ranging from 0.69 to 2.67 mEq/Kg oil [12]. The peroxide index values of CSO ranged from 3.12 to 8.08 mEq/Kg of oil (Table 2), which were higher than the values previously reported [31]. These changes may be associated with the cultivar of chia and processing conditions. The peroxide values of CSO extracted using the cold solvent, pressing, and supercritical methods were 0, 10.98 ± 0.61, and 0.37 meq O2/Kg oil, respectively [20], indicating that CSO extracted via pressing had a higher peroxide value. These results indicated that the extraction methods greatly influenced the quality of CSO.
However, further comparative studies are required to confirm the above statement. In the present study, none of the samples exceeded the upper limit of the peroxide index value (10.0 mEq active oxygen/kg oil) established by the Thai community product standards (Thailand Ministry of Public Health (No. 421), B.E. 2564, issued under the Food Act B.E. 2522 on oils and fats) (Table 2). Additionally, the RSM prediction showed that a high temperature would aid in the extraction of CSO with a lower peroxide value. The moisture content of the seed also affected the peroxide value, while the size of the restriction die had no effect on the peroxide value (Figure 5). The experimental data indicated that a die size of 1.2 cm, a temperature of 50 °C, and no dry heat treatment helped extract CSO with 3.12 mEq/Kg of oil (Table 2).
The restriction die and temperature significantly affected the pressing time (Figure 5). The pressing time increased as the size of the restriction die was raised, while the pressing time decreased as the temperature was raised. Because of insufficient friction during pressing, high seed moisture content resulted in poor oil recovery. This effect could be attributed to the development of an external gelatinous structure with water-retaining properties [11]. According to Santoso and Inggrid (2014) [32], the average oil yield increases as pressing time increases. In the present study, the RSM prediction demonstrated that a reduced size of the restriction die (1 cm), no dry heat exposure, and high temperature might reduce the pressing time needed for CSO extraction (Figure 6). The experimental data also demonstrated the above statement (Table 2).
Several studies have indicated that Mexican CSO extracted via solvent and supercritical CO2 methods is rich in α-linolenic acid, linoleic acid, palmitic acid, oleic acid, and stearic acid [22,23,33]. Fernandes et al. (2019) revealed that Brazilian CSO extracted via different extraction methods (cold solvent, pressing, and supercritical CO2) also showed high α-linolenic acid content, followed by linoleic and oleic acids and saturated fatty acids [20]. Chilean CSO contains about 62.8% α-linolenic acid; other fatty acids include linoleic, oleic, palmitic, and stearic acids [31]. The present study also revealed that Thai CSO had a high content of α-linolenic acid, followed by linoleic acid, palmitic acid, oleic acid, stearic acid, eicosenoic acid, palmitoleic acid, and myristic acid (Table 6), indicating that the fatty acid profile of Thai CSO was also like that in the previous report.
Compared to the other oils (sunflower, safflower, canola, and soybean oil), CSO presented the lowest DPPH and ABTS radical scavenging capabilities [33,34]. The composition and proportion of fatty acids, including myristic, palmitic, palmitoleic, stearic, oleic, linoleic, linolenic, behenic, arachidonic, lignoceric, trianoic, and arachidic acids [2,3,11,27,33,35], as well as tocopherols and phenolic compounds, in CSO may affect its NO scavenging activities. Roasting harmed the TPC and antioxidant activity of CSO, as these properties were significantly lower in oil extracted from roasted chia seeds using the Soxhlet and cold-press extraction methods compared to non-roasted seeds, which could be attributed to the degradation or polymerization of phytocompounds during thermal treatments [27]. CSO extracted through solvent extraction (n-hexane) had an antioxidant activity of 33.94 IC50 mg/mL (DPPH assay) and 28.51 IC25 mg/mL (ABTS assay) [33]. Our data also revealed that avoiding dry heat treatment produced high-quality CSO in terms of ABTS, DPPH, and NO radical scavenging activities. Additionally, pressing temperature affected the ABTS and DPPH values of CSO (Figure 7).
The literature revealed that the seed cultivar; extraction methods; extraction conditions such as pretreatments, temperature, and pressure; and seed physical conditions such as moisture influenced the yield and quality of CSO. The quality and quantity of oil extracted by the solvent or through physical methods varied. Thus, the results are inconsistent, and a single optimal condition to achieve high-quality CSO has yet to be determined. However, the results suggest that edible oil could be stored with natural antioxidants to prevent oxidation and reduce acid and peroxide values.

5. Conclusions

This study reported the influence of the restriction die size, temperature, and dry heat exposure time on the quantity and quality of Thai CSO. The restriction die size of 1 cm, pressing temperature of 53 °C, and absence of dry heat were the optimal conditions for extracting the desired quality of CSO, according to the predicted RSM model. The result showed that the average yield, TPC, acid value, peroxide value, and pressing time were 29.47%, 2.20 μg GAE/g of oil, 0.96 mg KOH/g of oil, 2.87 mEq/Kg of oil, and 45.10 min, respectively. The size of the restriction die influenced the extraction time and acid value of CSO. The pressing temperature affected the extraction time, acid and peroxide values, and TPC of CSO. The duration of dry heat exposure affected the TPC and peroxide value of CSO. The fatty acid composition did not change significantly between the predicted and real-time experimental setup. The fatty acid composition of Thai CSO was comparable to that of previously reported studies. The results obtained from the present study demonstrated that chia seeds contain several phytochemicals, some of which are sensitive to heat treatment and thus require proper attention when selecting a processing technique. Further studies are required to confirm these findings and evaluate other parameters influencing CSO quality and quantity.

Author Contributions

Conceptualization, C.C. and P.S.; methodology, M.S.; software, M.S., C.T. and B.S.S.; validation, C.C., C.T. and B.S.S.; formal analysis, M.S. and C.T.; investigation, P.S.; resources, C.C.; data curation, M.S. and C.T.; writing—original draft preparation, M.S., B.S.S., P.K., P.S. and C.C.; writing—review and editing, M.S., B.S.S., P.K. and C.C.; visualization, P.S.; supervision, C.C. and P.S.; project administration, S.P.; funding acquisition, C.C., M.S. and P.S. All authors have read and agreed to the published version of the manuscript.

Funding

The study was partially funded by Chiang Mai University, Chiang Mai, Thailand. M.S. was funded by the Postdoctoral Fellowship (No. 03/2022) from Mae Fah Luang University, Thailand.

Institutional Review Board Statement

Not applicable.

Informed Consent Statement

Not applicable.

Data Availability Statement

The data presented in this study are available within the article.

Acknowledgments

The authors gratefully acknowledge the Chiang Mai University, Chiang Mai, Thailand, and Mae Fah Luang University, Chiang Rai, Thailand.

Conflicts of Interest

The authors declare no conflict of interest.

References

  1. Baginsky, C.; Arenas, J.; Escobar, H.; Garrido, M.; Valero, N.; Tello, D.; Pizarro, L.; Valenzuela, A.; Morales, L.; Silva, H. Growth and yield of chia (Salvia hispanica L.) in the Mediterranean and desert climates of Chile. Chil. J. Agric. Res. 2016, 76, 255–264. [Google Scholar] [CrossRef]
  2. Ghafoor, K.; Ahmed, I.A.M.; Özcan, M.M.; Al-Juhaimi, F.Y.; Babiker, E.E.; Azmi, I.U. An evaluation of bioactive compounds, fatty acid composition and oil quality of chia (Salvia hispanica L.) seed roasted at different temperatures. Food Chem. 2020, 333, 127531. [Google Scholar] [CrossRef] [PubMed]
  3. Ixtaina, V.Y.; Martínez, M.L.; Spotorno, V.; Mateo, C.M.; Maestri, D.M.; Diehl, B.W.; Nolasco, S.M.; Tomás, M.C. Characterization of chia seed oils obtained by pressing and solvent extraction. J. Food Compos. Anal. 2011, 24, 166–174. [Google Scholar] [CrossRef]
  4. Orona-Tamayo, D.; Valverde, M.E.; Paredes-López, O. Chia—The new golden seed for the 21st century: Nutraceutical properties and technological uses. In Sustainable Protein Sources; Elsevier: Amsterdam, The Netherlands, 2017; pp. 265–281. [Google Scholar]
  5. Weber, C.W.; Gentry, H.S.; Kohlhepp, E.A.; McCrohan, P.R. The nutritional and chemical evaluation of chia seeds. Ecol. Food Nutr. 1991, 26, 119–125. [Google Scholar] [CrossRef]
  6. Coates, W. Protein content, oil content and fatty acid profiles as potential criteria to determine the origin of commercially grown chia (Salvia hispanica L.). Ind. Crops Prod. 2011, 34, 1366–1371. [Google Scholar]
  7. Martínez-Cruz, O.; Paredes-López, O. Phytochemical profile and nutraceutical potential of chia seeds (Salvia hispanica L.) by ultra high performance liquid chromatography. J. Chromatogr. A 2014, 1346, 43–48. [Google Scholar] [CrossRef]
  8. Enes, B.N.; Moreira, L.P.; Silva, B.P.; Grancieri, M.; Lúcio, H.G.; Venâncio, V.P.; Mertens-Talcott, S.U.; Rosa, C.O.; Martino, H.S. Chia seed (Salvia hispanica L.) effects and their molecular mechanisms on unbalanced diet experimental studies: A systematic review. J. Food Sci. 2020, 85, 226–239. [Google Scholar] [CrossRef]
  9. Reyes-Caudillo, E.; Tecante, A.; Valdivia-Lopez, M.A. Dietary fibre content and antioxidant activity of phenolic compounds present in Mexican chia (Salvia hispanica L.) seeds. Food Chem. 2008, 107, 656–663. [Google Scholar] [CrossRef]
  10. Akinfenwa, A.O.; Cheikhyoussef, A.; Cheikhyoussef, N.; Hussein, A.A. Cold pressed chia (Salvia hispanica L.) seed oil. In Cold Pressed Oils; Elsevier: Amsterdam, The Netherlands, 2020; pp. 181–190. [Google Scholar]
  11. Martínez, M.L.; Marín, M.A.; Faller, C.M.S.; Revol, J.; Penci, M.C.; Ribotta, P.D. Chia (Salvia hispanica L.) oil extraction: Study of processing parameters. LWT-Food Sci. Technol. 2012, 47, 78–82. [Google Scholar] [CrossRef]
  12. Muhammad, I.; Muhammad, N.; Manzoor, M.; Amna, J.; Zafar, A.; Akhtar, M.; Muhammad, A.; Yasir, H. Fatty acids characterization, oxidative perspectives and consumer acceptability of oil extracted from pre-treated chia (Salvia hispanica L.) seeds. Lipids Health Dis. 2016, 15. [Google Scholar] [CrossRef]
  13. Sosa, A.; Ruiz, G.; Rana, J.; Gordillo, G.; West, H.; Sharma, M.; Liu, X.; Torre, R. Chia crop (Salvia hispanica L.): Its history and importance as a source of polyunsaturated fatty acids omega-3 around the world: A review. J Crop Res Fert 2016, 1, 1–9. [Google Scholar] [CrossRef]
  14. Sirilun, S.; Sivamaruthi, B.S.; Pengkumsri, N.; Saelee, M.; Chaiyasut, K.; Tuntisuwanno, N.; Suttajit, M.; Peerajan, S.; Chaiyasut, C. Impact of different pre-treatment strategies on the quality of fatty acid composition, tocols content & metabolic syndrome related activities of Perilla frutescens seed oil. J. Appl. Pharm. Sci. 2016, 6, 001–008. [Google Scholar]
  15. Saelee, M.; Sivamaruthi, B.S.; Tansrisook, C.; Duangsri, S.; Chaiyasut, K.; Kesika, P.; Peerajan, S.; Chaiyasut, C. Response Surface Methodological Approach for Optimizing Theobroma cacao L. Oil Extraction. Appl. Sci. 2022, 12, 5482. [Google Scholar] [CrossRef]
  16. Fuentes, E.; Báez, M.E.; Bravo, M.; Cid, C.; Labra, F. Determination of total phenolic content in olive oil samples by UV–visible spectrometry and multivariate calibration. Food Anal. Methods 2012, 5, 1311–1319. [Google Scholar] [CrossRef]
  17. Thitipramote, N.; Pradmeeteekul, P.; Nimkamnerd, J.; Chaiwut, P.; Pintathong, P.; Thitilerdecha, N. Bioactive compounds and antioxidant activities of red (Brown Red Jasmine) and black (Kam Leum Pua) native pigmented rice. Int. Food Res. J. 2016, 23, 410. [Google Scholar]
  18. Sivamaruthi, B.S.; Pengkumsri, N.; Saelee, M.; Kesika, P.; Sirilun, S.; Peerajan, S.; Chaiyasut, C. Impact of physical treatments on stability and radical scavenging capacity of anthocyanidins. Health 2016, 1, 2. [Google Scholar]
  19. Pengkumsri, N.; Chaiyasut, C.; Saenjum, C.; Sirilun, S.; Peerajan, S.; Suwannalert, P.; Sirisattha, S.; Sivamaruthi, B.S. Physicochemical and antioxidative properties of black, brown and red rice varieties of northern Thailand. Food Sci. Technol 2015, 35, 331–338. [Google Scholar] [CrossRef]
  20. Fernandes, S.S.; Tonato, D.; Mazutti, M.A.; de Abreu, B.R.; da Costa Cabrera, D.; D’Oca, C.D.R.M.; Prentice-Hernández, C.; de las Mercedes Salas-Mellado, M. Yield and quality of chia oil extracted via different methods. J. Food Eng. 2019, 262, 200–208. [Google Scholar] [CrossRef]
  21. Noshe, A.S.; Al-Bayyar, A.H. Effect of extraction method of Chia seeds Oil on its content of fatty acids and antioxidants. Int. Res. J. Eng. Technol. 2017, 234, 1–9. [Google Scholar]
  22. Ixtaina, V.Y.; Vega, A.; Nolasco, S.M.; Tomás, M.C.; Gimeno, M.; Bárzana, E.; Tecante, A. Supercritical carbon dioxide extraction of oil from Mexican chia seed (Salvia hispanica L.): Characterization and process optimization. J. Supercrit. Fluids 2010, 55, 192–199. [Google Scholar] [CrossRef]
  23. Uribe, J.A.R.; Perez, J.I.N.; Kauil, H.C.; Rubio, G.R.; Alcocer, C.G. Extraction of oil from chia seeds with supercritical CO2. J. Supercrit. Fluids 2011, 56, 174–178. [Google Scholar] [CrossRef]
  24. Silva, C.; Garcia, V.; Zanette, C. Chia (Salvia hispanica L.) oil extraction using different organic solvents: Oil yield, fatty acids profile and technological analysis of defatted meal. Int. Food Res. J. 2016, 23, 998–1004. [Google Scholar]
  25. Aranibar, C.; Pigni, N.B.; Martínez, M.L.; Aguirre, A.; Ribotta, P.D.; Wunderlin, D.A.; Borneo, R. Influence of the extraction conditions on chia oil quality and partially defatted flour antioxidant properties. J. Food Sci. Technol. 2021, 59, 1982–1993. [Google Scholar] [CrossRef] [PubMed]
  26. Capitani, M.; Spotorno, V.; Nolasco, S.M.; Tomás, M.C. Physicochemical and functional characterization of by-products from chia (Salvia hispanica L.) seeds of Argentina. LWT-Food Sci. Technol. 2012, 45, 94–102. [Google Scholar] [CrossRef]
  27. Özcan, M.M.; Al-Juhaimi, F.Y.; Ahmed, I.A.M.; Osman, M.A.; Gassem, M.A. Effect of soxhlet and cold press extractions on the physico-chemical characteristics of roasted and non-roasted chia seed oils. J. Food Meas. Charact. 2019, 13, 648–655. [Google Scholar] [CrossRef]
  28. Kaleem, A.; Aziz, S.; Iqtedar, M. Investigating changes and effect of peroxide values in cooking oils subject to light and heat. FUUAST J. Biol. 2015, 5, 191–196. [Google Scholar]
  29. Guillén, M.A.D.; Cabo, N. Fourier transform infrared spectra data versus peroxide and anisidine values to determine oxidative stability of edible oils. Food Chem. 2002, 77, 503–510. [Google Scholar] [CrossRef]
  30. Cerretani, L.; Bendini, A.; Rodriguez-Estrada, M.T.; Vittadini, E.; Chiavaro, E. Microwave heating of different commercial categories of olive oil: Part I. Effect on chemical oxidative stability indices and phenolic compounds. Food Chem. 2009, 115, 1381–1388. [Google Scholar] [CrossRef]
  31. da Silva Marineli, R.; Moraes, É.A.; Lenquiste, S.A.; Godoy, A.T.; Eberlin, M.N.; Maróstica Jr, M.R. Chemical characterization and antioxidant potential of Chilean chia seeds and oil (Salvia hispanica L.). LWT-Food Sci. Technol. 2014, 59, 1304–1310. [Google Scholar] [CrossRef]
  32. Santoso, H.; Inggrid, M. Effects of temperature, pressure, preheating time and pressing time on rubber seed oil extraction using hydraulic press. Procedia Chem. 2014, 9, 248–256. [Google Scholar] [CrossRef]
  33. Shen, Y.; Zheng, L.; Jin, J.; Li, X.; Fu, J.; Wang, M.; Guan, Y.; Song, X. Phytochemical and biological characteristics of mexican chia seed oil. Molecules 2018, 23, 3219. [Google Scholar] [CrossRef] [PubMed]
  34. Xuan, T.D.; Gangqiang, G.; Minh, T.N.; Quy, T.N.; Khanh, T.D. An overview of chemical profiles, antioxidant and antimicrobial activities of commercial vegetable edible oils marketed in Japan. Foods 2018, 7, 21. [Google Scholar] [CrossRef] [PubMed]
  35. Ayerza, R.; Coates, W. Ground chia seed and chia oil effects on plasma lipids and fatty acids in the rat. Nutr. Res. 2005, 25, 995–1003. [Google Scholar] [CrossRef]
Figure 1. The procedure followed for chia seed oil extraction.
Applsci 13 06600 g001
Figure 2. Response surface plot illustrating the influence of restriction die size, temperature, and duration of dry heat time on the yield of CSO. (a) Influence of restriction die and temperature (b) restriction die and dry heat time, and (c) temperature and dry heat time on the yield of the CSO.
Applsci 13 06600 g002
Figure 3. Response surface plot illustrating the influence of restriction die size, temperature, and duration of dry heat time on the total phenolic content of CSO. (a) Influence of restriction die and temperature (b) restriction die and dry heat time, and (c) temperature and dry heat time on the total phenolic content of the CSO.
Applsci 13 06600 g003
Figure 4. Response surface plot illustrating the influence of restriction die size, temperature, and duration of dry heat time on the acid value of CSO. (a) Influence of restriction die and temperature (b) restriction die and dry heat time, and (c) temperature and dry heat time on the acid value of the CSO.
Applsci 13 06600 g004
Figure 5. Response surface plot illustrating the influence of restriction die size, temperature, and duration of dry heat time on the peroxide value of CSO. (a) Influence of restriction die and temperature (b) restriction die and dry heat time, and (c) temperature and dry heat time on the peroxide value of the CSO.
Applsci 13 06600 g005
Figure 6. Response surface plot illustrating the influence of restriction die size, temperature, and duration of dry heat time on the pressing time for CSO extraction. (a) Influence of restriction die and temperature (b) restriction die and dry heat time, and (c) temperature and dry heat time on the pressing time for CSO extraction.
Applsci 13 06600 g006
Figure 7. Antioxidant capacity of CSO: (A) ABTS, (B) DPPH, and (C) NO radical scavenging assays. a–d: Significant differences (p < 0.05) between the standard runs.
Applsci 13 06600 g007
Table 1. Details of the standard orders (STDs), size of the restriction die, pressing temperature, and duration of dry heat exposure at 100 °C.
STDSize of the Restriction Die (cm)Temperature (°C)Duration of Dry Heat Exposure at 100 °C (min)
11400
21.4400
31600
41.4600
514030
61.44030
716030
81.46030
915015
101.45015
111.24015
121.26015
131.2500
141.25030
151.25015
161.25015
171.25015
Table 2. The observed and predicted oil yields, acid and peroxide values, total phenolic content, and time.
STDYield (%)Acid Value
(mg KOH/g of Oil)
Peroxide Value
(mEq/Kg of Oil)
TPC
(µg GAE/g of Oil)
Pressing Time
(min)
ObservedPredictedObservedPredictedObservedPredictedObservedPredictedObservedPredicted
129.8629.881.021.023.583.541.601.8750.0051.71
227.7427.810.850.863.713.471.611.7169.0069.31
327.5927.660.840.843.533.351.721.5258.0059.11
428.4428.460.910.914.384.261.391.3860.0062.21
526.7026.770.850.503.893.961.941.5274.0072.10
629.1629.170.910.913.943.871.291.38105.00104.20
723.8623.870.850.844.234.500.971.2280.0046.00
828.5228.600.801.486.225.831.211.1065.0063.60
928.8228.630.800.805.975.791.232.4458.0057.23
1029.1128.921.061.045.476.552.292.2475.0074.83
1128.2428.060.850.828.088.711.661.6168.0074.33
1229.0828.890.901.024.204.471.291.3054.0057.73
1328.3528.840.880.913.123.642.602.5770.0060.58
1429.8330.350.880.934.484.461.872.1159.0071.48
1529.4829.581.180.926.376.152.862.3380.0066.03
1629.7529.580.930.926.646.152.092.3351.0066.03
1730.1529.580.950.927.396.152.312.3368.0066.03
Table 3. The average moisture content (% MC) of chia seeds.
Duration (min)Moisture Content (% MC)
04.64 ± 0.17 a
154.49 ± 0.18 a
304.01 ± 0.50 b
a,b indicates a significant difference (at p < 0.05) between times analyzed using Duncan’s multiple range test.
Table 4. Analysis of variance for the studied variables.
ResponseModelsModel
(p-Value)
Lack of Fit (p-Value)R2Adjusted R2Predicted R2Adequate Precision
Yield (%)Reduced Cubic0.00210.29670.97710.92680.759518.9895
Acid value2FI0.00560.23510.91390.82790.687410.5796
Peroxide valueReduced Cubic0.00050.26040.90940.83890.711011.7801
TPCReduced Quadratic0.00040.72470.82050.75530.560810.2480
Pressing time2FI0.02330.97980.78140.61750.51198.9976
Table 5. Estimated coefficients of coded factors for CSO extraction and other desirable factors.
VariableYieldp-ValueAcid Valuep-ValuePeroxide Valuep-ValueTPCp-ValueTimep-Value
A−0.00050.66730.11870.0007−0.00980.1463−0.01020.37428.79980.0258
B−0.00160.23780.09680.00320.05280.0039−0.02330.0465−8.29980.0328
C−0.00270.06800.01210.3457−0.01810.0161−0.02320.04705.44780.1623
AB−0.00270.00590.05730.0058−0.01170.1223 −3.62530.3600
AC−0.00420.00080.14000.0008 3.62470.3601
BC0.00110.10560.12970.0012−0.00810.2680 −8.37470.0552
A20.00290.0265
B20.00410.0076 −0.1082<0.0001
C2 0.0712<0.0001
A2B0.00410.0244
A2C0.00550.0082
AB2−0.00260.1070
BC2 −0.06760.0017
A: size of the restriction die; B: pressing temperature; C: dry heat exposure time; TPC: total phenolic content.
Table 6. The fatty acid content of representative CSO samples.
Fatty AcidFatty Acid Content (%)
Oil Extracted under the Optimal Condition *Oil Extracted under the Condition of STD 13 **
α-Linolenic acid (C18:3 n − 3)58.6258.46
Linoleic acid (C18:2 n − 6 cis)20.8120.93
Palmitic acid (C16:0)7.847.73
Oleic acid (C18:1 n − 9 cis)7.497.52
Stearic acid (C18:0)3.553.64
Eicosenoic acid (C20:1 n − 9)0.130.10
Palmitoleic acid (C16:1)0.040.04
Myristic acid (C14:0)0.030.03
* Optimal condition: size of the restriction die = 1 cm, temperature = 53 °C, and no dry heat. ** STD 13: restriction die size = 1.2 cm, temperature = 50 °C, and no dry heat.
Disclaimer/Publisher’s Note: The statements, opinions and data contained in all publications are solely those of the individual author(s) and contributor(s) and not of MDPI and/or the editor(s). MDPI and/or the editor(s) disclaim responsibility for any injury to people or property resulting from any ideas, methods, instructions or products referred to in the content.

