Abstract
This work deals with the evaluation of adhesive single-lap joints using ultrasound guided waves; in particular, it is intended to characterize the signal propagation when defects are present in the adhesive joint by simulation and experimental approaches. The propagation of guided waves in the joint is developed from matrix formulations. The behavior of the guided wave modes that exist in the bonded region is characterized. It is found that its amplitudes can be estimated from the properties of the incoming wave that propagates in the non-bonded region. It is verified that the excitation of these modes is related to the degree to which the shapes of both modes match each other. A 3D simulation of two aluminum-bonded plates using 500 kHz ultrasonic transducers in a pitch-and-catch configuration was implemented using the Matlab k-Wave toolbox. Scattering effects, due to some defects located in the bond line of the joints, were simulated. The experimental setup with some artificial defects produced in the aluminum joints was used in order to compare it with the simulation. Qualitative agreement was observed between the two approaches. The observed deviation can be due to the different characteristics of the experimental and simulated defects.
1. Introduction
Adhesively bonded joints have been widely used with success in several fabrication processes because they give rise to a more even stress distribution when compared to other conventional joints, such as bolting, riveting, and spot welding, where high stress concentrations can occur. The possibility of obtaining lighter and waterproof structures with reduced corrosion risks contributes greatly to the use of adhesive joints, which work as an alternative to conventional joints in several industries, including aerospace, automotive, and energy.
The fabrication of adhesive bond joints can originate defects of different types: adhesive defects related to the weak bonding between the adhesive and the adherend, cohesive defects related to the mechanical properties of the adhesive, and gross defects, such as cracking, disbonding, porosity, delaminations, and voids [1,2,3,4]. The formation of voids or the absence of adhesive in the bond line is a great concern in industry [5], so such defects will be studied and characterized in this work.
Non-destructive methods are essential for the condition monitoring of bonded structures [6,7,8,9]. Probably one of the most commonly used methods is based on ultrasound guided waves. When compared to the conventional point-by-point method, guided waves are more attractive because, once generated, they propagate over considerable distances with low attenuation, which allows inspecting large parts with considerable time savings. Several recent works evidencing this advantage can be found in the literature [10,11,12].
Guided waves have often been used for the detection of defects in slender structures like strips, plates, or pipes [13,14,15,16,17,18,19,20]. They have also proven to be effective for inspecting adhesive joints [11,12,13,14,15,16,17,18,19,20,21,22,23,24,25] and adhesive bonds of composites [26,27], and for adhesion level evaluation [28]. Several studies using ultrasound guided waves to assess the bonding quality of metal/epoxy/metal joints can be found in the literature, such as comparison between air coupling and immersion techniques [29], analysis of the spectra of the lowest-order antisymmetric (A0) Lamb wave mode for tangential bond stiffness evaluation [30], defect detection in the adhesive films and evaluation of their geometry by means of a weighted root mean square damage imaging algorithm [31,32], evaluation of interference effects of elastic waves generated by piezo sensors, excited with tone bursts of different extensions, with the length of the disbond [33], study of the non-linear Lamb wave behavior [34,35], and development of a finite difference model for simulation and validation experiments using PZTs in bonded aluminum plates [36].
Simulation allows predicting the ultrasound wave propagation in a particular medium and can be used to prove analytical and experimental approaches. Nowadays, the implementation of numerical or grid-based methods is easy due to the advances in computational resources. Several recent works use finite element methods (FEM) to accurately simulate wave propagation through bonded lap joints [29,33,36,37,38,39]. One of the major drawbacks of elastic wave models based on low-order finite differences or finite elements is the large number of grid points per wavelength necessary to avoid numerical dispersion. The k-Wave, which is a third-party MATLAB toolbox, uses a Fourier domain pseudo spectral method for faster simulation and reconstruction of photoacoustic wave fields and can be used alternatively. It uses less memory and is user-friendly [40,41]. Several authors have used the k-Wave toolbox in diverse NDT applications, such as nonlinear ultrasound propagation in absorbing media [42], attenuation in ultrasonic computed tomography [43], time domain power law attenuation in tissues [44], one-sided ultrasonic nondestructive evaluation [45], high intensity focused ultrasound [46], ultrasonic transducer field modeling [47], 3-D ultrasound imaging [48], simulation of A-scan signals in ophthalmology [49], microflaw detection in carbon fiber reinforced polymers [50], and guided waves in layered structures [51,52].
In the present paper, the authors intend to implement a 3D simulation model of two aluminum plates bonded by an epoxy adhesive, using the k-Wave tool, which, to the best of their knowledge, is a novel approach to characterizing the propagation in lap joints with defects. Simulated defects of different sizes are introduced in the adhesive. A pitch-and-catch experimental setup is also used to detect and characterize the same type of defect. The simulated results are then compared with the experimental ones.
2. Theory
2.1. Ultrasound Guided Wave Propagation in a Single Plate
Lamb waves are a type of guided ultrasound wave existing in plate structures placed in a vacuum that can propagate relatively long distances. They are very useful to detect disbonds, corrosion, and delaminations efficiently [53,54,55,56]. If plates are immersed in water, these waves are called leaky Lamb waves, due to the energy leakage into the surrounding fluid. The well-known dispersion equations that govern symmetrical (Equation (1)) and antisymmetric (Equation (2)) leaky Lamb wave modes were introduced by Viktorov [53],
where i is the unit imaginary number, h is half the thickness of the plate, , , where , , , , ω is the angular frequency, is the longitudinal velocity in the plate, the transversal velocity in the plate, is the phase velocity of a certain propagation mode, and is the velocity in the surrounding fluid. The plate and fluid densities are and , respectively.
The transcendental Equations (1) and (2) give rise to an infinite number of solutions that correspond to the propagation modes. The imaginary part of each equation represents the fluid influence. If this is not present, the equations characterize the plate in vacuum. The leakage of the fluid causes attenuation, which is highly dependent on the ratio of in-plane and out-of-plane displacements at the plate surfaces for a certain mode. For a particular propagation mode the phase velocity is complex, , which gives rise to a complex wavenumber, [57]. The real part represents the propagation properties of the wave and is related to leakage attenuation. Considering that usually , after some manipulation, the complex wavenumber can be represented as
The absolute value of the imaginary part of Equation (3) represents an exponential decay, known as the attenuation coefficient, α (Np/m). The solutions of the dispersion equations for a plate in vacuum are very similar to the real part of the solutions for an immersed plate, because it has been shown that the surrounding fluid gives rise to very small variations in the wave velocity [58].
The particle displacement variation as a function of the plate thickness for each propagation mode is very important. If the plate is immersed and long-range propagation is needed, then a low out-of-plane displacement should be used to maintain low attenuation values, due to leakage to the fluid. The displacements can be obtained using the method of potentials and the boundary conditions at the plate surface. For a plate in vacuum oriented in the X direction and with the thickness in Z direction, coincident with the wave propagation direction, the in-plane (uxs) and out-of-plane (uzs) displacements of symmetric modes are given by [53,54]
and the displacements for the anti-symmetric modes (uxa) and (uza) by
For the case of a water immersed plate, Equations (4)–(7) become complex, which can be interpreted physically as a small-angle rotation of the ellipse displacement axes from the reference coordinate system [59]. Nevertheless, the real part of the displacements practically coincides with the displacements obtained from Equations (4)–(7) [54]. So, as an approximation, these equations can be used to represent the displacements as a function of plate thickness in immersion cases.
In analogy with optical phenomena, when an ultrasound wave reaches a boundary between two different media obliquely, refracted waves can occur with different transmission angles than the incident one. The incident () and transmitted () angles related to the normal plane are correlated by the well-known Snell’s law, given by
where and are the propagation velocities in the different media. In practice, if one intends exciting a specific propagation mode in a plate, the phase velocity (obtained from the dispersion curves) coincides with , and in this case, , since the propagation develops along the plate. Then, knowing the value, which corresponds to the propagation velocity in the fluid (), the angle of incidence can be easily obtained, to generate the desired propagation mode:
For each mode, there is a re-emission angle, that by reciprocity is equal to the angle of incidence.
2.2. Propagation of Ultrasonic Guided Waves in Adhesively Bonded Joints
Ultrasound guided wave propagation in a bonded lap joint can be modeled as propagation in a multilayer structure, composed of two adherents and one adhesive. The transfer matrix method is one of the most important techniques used to study this problem and find the complex phase velocity of each propagation mode. First used by Haskell [60] for modeling propagation in seismology, the method was later adapted for studying ultrasound guided wave propagation by several researchers [61,62,63,64,65]. The method considers that there are four generic waves in each layer, such as two longitudinal waves (L+, L−) and two transversal ones (T+, T−), where the sign (+) means upward direction, and (−) downward direction. So, a field matrix (D) that describes the relationship between the displacements (u), stresses (σ), and wave amplitudes (A) at any location in a layer can be established as
The relations between the displacements and stresses at the inner interfaces are then eliminated, and the fields in all layers are described only in terms of the external boundary conditions. The solutions can be obtained by solving the resulting matrix system for each mode. The behavior of these guided modes is like that obtained through Equations (1) and (2). Details about the method are described elsewhere [66].
3. Materials and Methods
3.1. Simulation Model
The k-Wave functions used for simulation need different input structures, namely, the properties of the computational grid (representing the medium through which the acoustic waves propagate) and the properties and locations of both acoustic sources and sensors. A perfectly matched layer (PML), commonly used to truncate computational regions in numerical methods, is used to absorb acoustic waves in the limits of the computational domain. The schematic of the 3D simulation setup is presented in Figure 1, and its dimensions are: X = 126 mm, Y = 32 mm, and Z = 18 mm. The spatial resolution is 150 µm. Each plate is 90 mm in length, 30 mm in width, and 4 mm in thickness. The section of the bonded region is 60 mm × 30 mm. The adhesive thickness is 150 µm. The emitter and receiver transducers are identical, measuring 25 mm in diameter. The incidence and reception angles are equal and given by Equation (9). The defects were simulated by introducing air (in the absence of adhesive) in a circular shape in the center of the joint region.
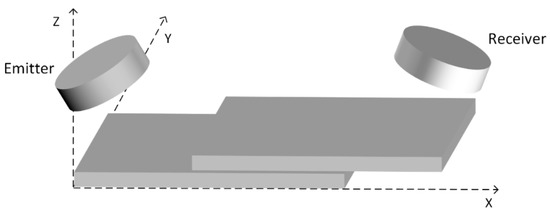
Figure 1.
Schematic of the simulation setup for an adhesively bonded single-lap joint inspection using the pitch-and-catch configuration and guided waves.
The acoustic properties of the materials used in the simulation are presented in Table 1. For water and air, the values were taken from literature [67]. For aluminum and epoxy, the properties were obtained experimentally using a conventional pulse echo technique. For aluminum, a 10 MHz transducer was used due to the small thickness of the plates. As the thickness of the epoxy layer is very small, a cylinder with a 20 mm height and a 30 mm diameter was constructed to allow velocity measurements. The densities were taken from the manufacturer’s specifications.

Table 1.
Acoustic properties of the materials used in simulation.
3.2. Experimental Setup
The ultrasonic experimental setup shown in Figure 2 was used to evaluate the defects. It is composed of a Panametrics pulser/receiver model 5800, a pair of immersion broadband transducers (Imasonic model IM 0.5 25 P) with a 500 kHz central frequency and a 25 mm active diameter, and a Tektronix digital oscilloscope (model TDS1002B). The aluminum alloy (5083-O) plates are 200 mm in length, 125 mm in width, and 4 mm in thickness. The size of the bonded region is 60 mm × 125 mm (whole width). The bonded zone has the same dimensions as the one presented in the simulation model described in the previous section.
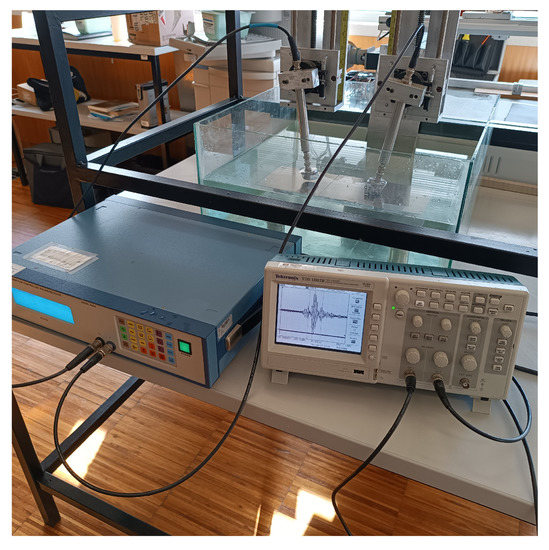
Figure 2.
Experimental setup.
The plates were bonded together with an epoxy adhesive (Araldite 2014, Vantico, Duxford, Cambridge, UK), of 150 μm in thickness, achieved by a uniform pressure of 0.1 Kg/m2. The adhesive was then cured according to the manufacturer’s instructions at room temperature (25 °C) for 24 h.
The approach used to produce artificial defects in the bonded line consisted of removing a circular portion of aluminum equal to the adhesive thickness in one of the plates, and then that zone was covered with sticky tape to avoid adhesive penetration, as described in [57].
4. Results
4.1. Phase Velocities and Displacements in a Single Plate in Water
The solutions for the phase velocity were obtained from Equations (1) and (2) using an iterative optimization algorithm. The first four propagation modes that correspond to the real part of the solutions for the aluminum plates used in this study are shown in Figure 3. Figure 4 presents the leakage attenuation due to water for the fundamental modes S0 and A0, obtained from the imaginary part of Equation (3). According to the used frequency (500 kHz), the propagation mode S0 was selected, due to the high spatial separation compared to the other modes and the low attenuation compared to A0, allowing easier amplitude measurements.
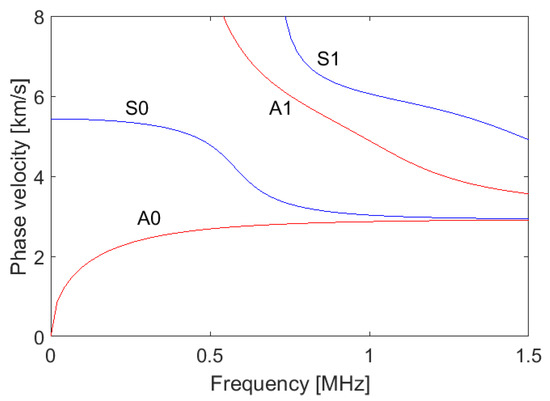
Figure 3.
Phase velocity of the first four propagation-guided modes for an aluminum plate of 4 mm thickness immersed in water.
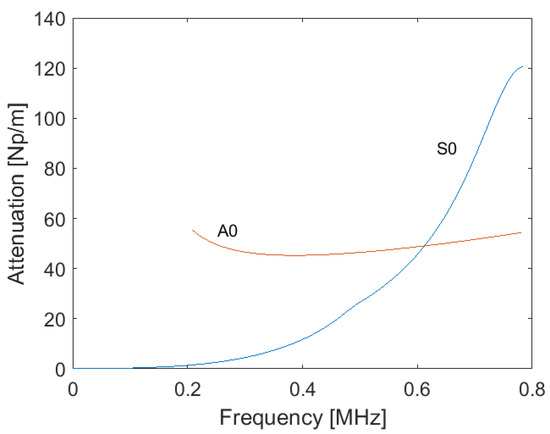
Figure 4.
Leaky attenuation of the fundamental modes S0 and A0 in an aluminum plate of 4 mm thickness immersed in water.
From Equations (4)–(7), the in-plane (ux) and out-of-plane (uz) displacements for S0 and A0 were obtained, which are presented in Figure 5. The higher value of uz for A0 mode, when compared to S0 mode, justifies the high value of leakage attenuation observed in Figure 4.
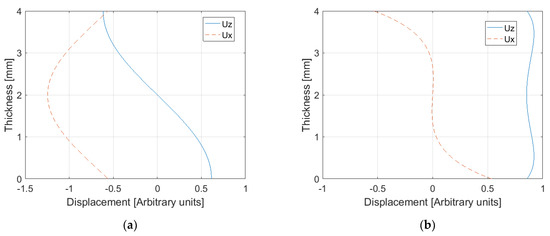
Figure 5.
Displacements of the fundamental modes in an aluminum plate of 4 mm thickness: (a) S0; (b) A0.
4.2. Phase Velocities and Displacements in a Bonded Lap Joint in Water
For the bonded region, the transfer matrix method introduced in Section 2.2 was used to obtain the modal solutions of the matrix system. The real part of the solutions, which is the phase velocity of the different modes, is presented in Figure 6.
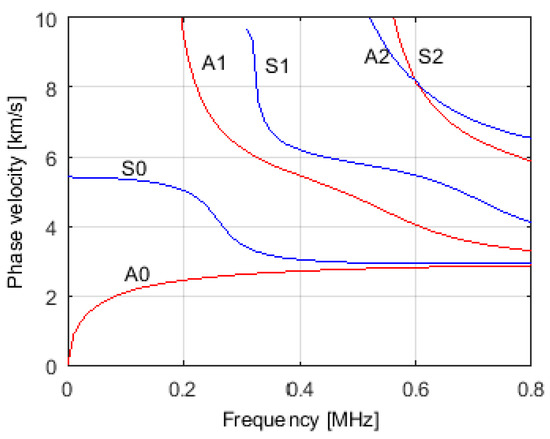
Figure 6.
Phase velocity dispersion curves for two bonded aluminum plates immersed in water.
The total thickness of the system is 8.15 mm (two 4 mm aluminum plates and 0.15 mm adhesive), so for the working frequency, four different modes coexist: A0, S0, A1, and S1. The behavior is very similar to that previously obtained for the single plate, which is justified by the fact that the system is mostly composed of aluminum with a very small amount of epoxy. The behavior difference is characterized by an increase in the number of propagation modes, which is related to the increase in thickness. The attenuation values due to leakage for 500 kHz were obtained in the same way as previously for the single plate and are presented in Table 2.
Table 2.
Attenuation due to leakage to the fluid in the bonded plate region for the different propagation modes.
The displacements for the mentioned modes can also be obtained using the transfer matrix method [66]. Considering the boundary conditions for all interfaces, a matrix composed of the amplitude coefficients for the three layers is obtained. As the system is immersed, there are two additional unknowns corresponding to the amplitude of the longitudinal waves at the bottom and top of the plate. By solving the matrix system, the displacement values in arbitrary units as a function of the thickness were evaluated and are presented in Figure 7. There is now a more complex pattern when compared with the single plate, which is due to the epoxy adhesive layer. Looking at the displacements at the surface of the system that are in contact with the water, the relation between the out-of-plane and in-plane values agrees with the attenuation values presented in Table 2. For example, in the S1 mode, the displacement is essentially in-plane, giving rise to extremely low attenuation values. For the A1 mode, the two types of displacements are similar, giving rise to already noticeable attenuation values. Finally, for A0 and S0 modes, the out-of-plane displacements are greater than the in-plane ones, leading to higher attenuations.
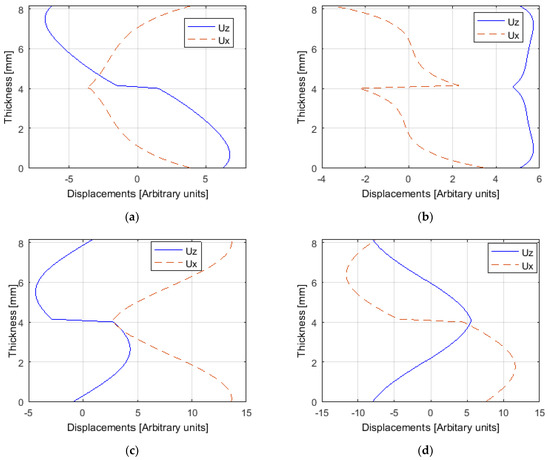
Figure 7.
Displacements of the four existing modes in the bonded region: (a) S0; (b) A0; (c) S1; (d) A1.
4.3. Guided Wave Propagation Simulation
The k-Wave function used for the simulation is pstdElastic3D, based on the pseudo spectral time domain (PSTD) method, which is able to simulate the time-domain propagation of elastic waves through a three-dimensional homogeneous or heterogeneous medium [68]. The simulation model presented in Section 3.1 was implemented on a computer with an Intel® Core™ i7-4790 processor and 16 GB RAM, and a Nvidea GeForce GTX1080 Ti GPU, 11.26 GB RAM. For the available hardware and the presented geometry, the maximum resolution (minimum grid point spacing) was limited to 150 μm. This resolution gave rise to 21.47 × 10⁶ voxels (840 × 213 × 120). The source was excited with a three-cycle burst at 500 kHz central frequency, as shown in Figure 8a. Figure 8b illustrates the respective spectrum.
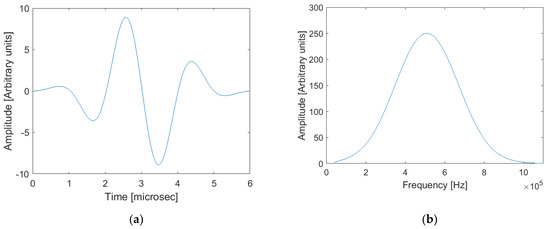
Figure 8.
Excitation signal: (a) time domain; (b) frequency domain.
For model validation, first the propagation in an aluminum single plate was tested. For that purpose, the theoretical phase velocity extracted from Figure 3 for 500 kHz was used in Equation (9). The resulting incident angle for S0 mode, which is the same as the receiving angle, is 18.2°.
The signal collected at the receiver is presented in Figure 9. It is observed that there is an increase in the pulse length due to the dispersion behavior of the S0 mode phase velocity, when compared with the original three-cycle excitation burst (Figure 8a). Besides the direct signal propagated between the transmitter and the receiver, there is also an interference signal corresponding to the round trip in the water path at the emitter. To avoid that interference, the distance between the emitter transducer and the plate should be increased; however, such an increase was not possible in the present simulation due to limited computational resources. Nevertheless, this fact has not prevented the peak-to-peak amplitude value from being correctly evaluated.
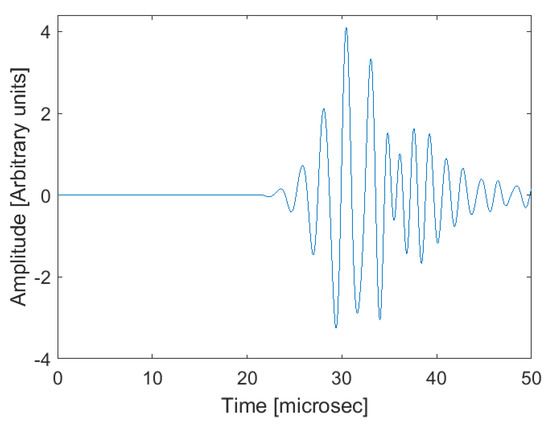
Figure 9.
Received signal after propagation in the bonded plate.
To prove that the excited propagation mode is indeed S0, the phase velocity was calculated through the phase spectrum approach [66], as
where f is the frequency, L is the path difference between two collected signals, and Δφ is the respective difference in the phase spectrum. Figure 10 illustrates the phase velocity obtained by this method for L = 20 mm. There is a clear agreement between the presented phase velocity in Figure 10 and the theoretical one shown in Figure 3.
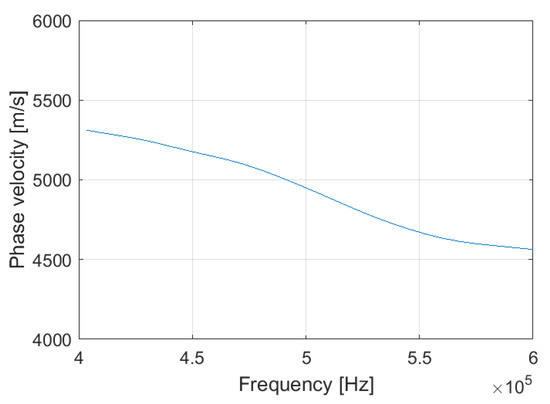
Figure 10.
Phase velocity obtained according to Equation (11).
Comparing the peak-to-peak amplitudes of the two above-mentioned signals, the attenuation was also computed, resulting in 27.5 Np/m. Again, this value is in full agreement with the theoretical one shown in Figure 4.
The same methodology was used to simulate the propagation of S0 mode in the aluminum-bonded plates presented in Figure 1.
Figure 11 illustrates snapshots of the normalized normal and shear stresses in the XZ plane during the simulation. The emitter transducer is represented by a dashed line on the left. It is clear from the high stress values inside the plates. It is also evident from the energy leakage surrounding the plates and the absence of shear stress in the water.
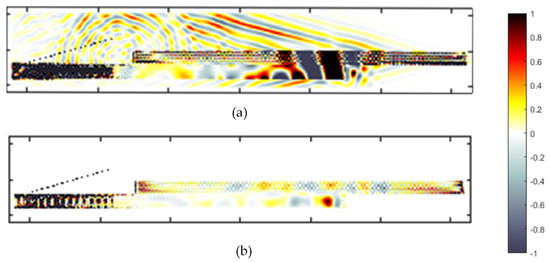
Figure 11.
Snapshots of normal (a) and shear (b) stresses in aluminum-bonded plates.
The received signal amplitudes corresponding to the propagation in a single plate and in the bonded plates obtained using the same test conditions were compared. An amplitude decrease of about 10% was observed for the bonded plates compared with the single plate, which can be justified by the higher attenuation values in the bonded region when compared to the attenuation of S0 mode in a single plate. This high attenuation is related to the behavior of existing modes in the bonded zone as a result of mode conversion, when the wave in the transmitter plate converts to one or more modes at the location where it first meets the adhesive layer. Those modes, which then travel in the bonded region, are the natural modes (A0, S0, A1, and S1) of the three-layer system aluminum/adhesive/aluminum. Theoretically, it is expected that to excite a specific mode in the bonded zone, the mode shape in the bottom plate of the bonded zone should be similar to the mode shape in the single transmitter plate [23,69]. Comparing S0 displacement in the single plate (Figure 5a) with the natural modes in bonded plates (Figure 7), it can be said that A1 and S1 modes have completely different shapes, so their amplitude should be very low. The same comparison was made with A0 and S0 mode shapes. Now, despite not being perfectly equal, they have great similarities with S0 in the transmitter plate, which allows us to say that these are the dominant modes in the bonded zone. As the mode shape in the bottom plate of the bonded zone is more or less the same for A0 and S0, it can be admitted that there is the same conversion degree for both modes, and using the data in Table 2, the average attenuation is 30 Np/m. This value is higher than the one for the single plate, which justifies the smaller amplitude measured for the bonded plates.
To evaluate the presence of voids and their influence on the received signal, round air defects (bubbles) with different diameters were simulated, indicating the absence of the adhesive component between the plates. Figure 12 presents the peak-to-peak amplitude of the receiving signal as a function of void dimensions, normalized with respect to the small void considered (3 mm). There is a signal amplitude increase with the void dimensions. The justification for this behavior can be explained because, in the presence of a defect, the dominant modes that exist in the bonded joint give rise to additional modes (by mode conversion) that propagate around the defect. In this case, this zone could be considered as two isolated semi-immersed plates (on one side there is water and on the other side there is air), where only A0 and S0 modes are allowed to propagate. Figure 13 schematically describes this situation. So, the propagation in the defective bonded joint in this zone is similar to that observed in a single plate, and two phenomena contribute to the increase in amplitudes as the defect size increases: (a) as shown previously, the attenuation in the single plate is lower than in the bonded plates; (b) as one side of the plate is in contact with air, the leakage is half of what is verified when the plate is immersed. The experimental results are also presented in Figure 12. Qualitatively, there is reasonable agreement between the simulated and experimental results. The observed deviation can be due to the different characteristics of the experimental and simulated defects, which inevitably do not have the same scattering effects.
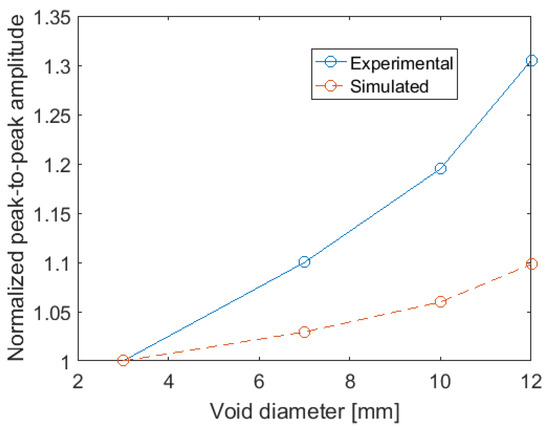
Figure 12.
Normalized peak-to-peak amplitude of the received signal versus defect diameter.
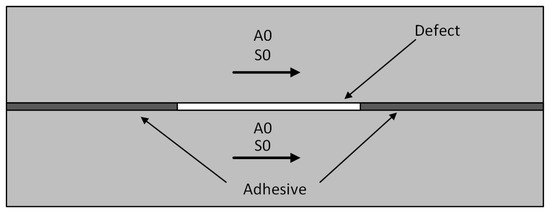
Figure 13.
Schematic diagram of existing modes in the overlap region in the presence of a defect.
5. Discussion
In this work, the authors present an analytical, simulated, and experimental study about the behavior of ultrasound guided waves propagating in a single plate and in two plates of aluminum, bonded by an epoxy adhesive layer. Both configurations were immersed in water.
For a single plate, a classical iterative optimization algorithm was used to solve the complex dispersion equations in order to obtain the phase velocity, the leakage attenuation, and the displacement curves of each propagation mode. It was verified that the high out-of-plane displacement values on the plate surfaces give rise to high attenuation values. For the bonded plates, the transfer matrix method was used to obtain the same parameters as above. Similar correlations between attenuation and out-of-plane displacements were obtained, as were the ones for the single plates. A 3D simulation using the k-Wave MATLAB toolbox was implemented, and the results proved its effectiveness to characterize the propagation of guided waves in single and bonded structures, concerning the correct excitation of a certain mode, and the phase velocity and attenuation measurements. Simulated and experimental air voids with different dimensions were produced in the adhesive region of the bonded joint. An increase in the amplitude of the received signal was observed as the defect size also increased for both simulated and experimental approaches. That behavior is justified by the fact that the defective region can be considered a single plate with lower attenuation in terms of guided wave propagation. Additionally, as only one plate surface is in contact with water (the other one is in contact with air), the leakage to water is smaller. The experimental results are in qualitative agreement with the simulated ones. The deviation is related to the inevitable impossibility of reproducing the same defects exactly in simulations and experiments.
Author Contributions
Conceptualization, M.S. and J.S.; methodology, M.S. and J.S.; software, M.S.; validation, M.S. and J.S.; formal analysis, M.S. and J.S.; investigation, M.S. and J.S.; writing—original draft preparation, M.S.; writing—review and editing, M.S. and J.S. All authors have read and agreed to the published version of the manuscript.
Funding
This research is sponsored by national funds through FCT—Fundação para a Ciência e a Tecnologia, under the project UIDB/00285/2020 and LA/P/0112/2020.
Institutional Review Board Statement
Not applicable.
Informed Consent Statement
Not applicable.
Data Availability Statement
Not applicable.
Conflicts of Interest
The authors declare no conflict of interest.
References
- Adams, R.D.; Drinkwater, B.W. Nondestructive testing of adhesively-bonded joints. NDT&E 1997, 30, 93–98. [Google Scholar] [CrossRef]
- Ghabezi, P.; Farahani, M. Trapezoidal traction–separation laws in mode II fracture in nano-composite and nano-adhesive joints. J. Reinf. Plast. 2018, 37, 731–794. [Google Scholar] [CrossRef]
- Wencai, L.; Harry, F.; Genevieve, P. Multifunctional films for thermoplastic composite joints: Ultrasonic welding and damage detection under tension loading. Compos. Part A Appl. Sci. Manuf. 2021, 141, 106221. [Google Scholar] [CrossRef]
- Stetco, C.; Sam-Daliri, O.; Faller, L.M.; Zangl, H. Piezocapacitive Sensing for Structural Health Monitoring in Adhesive Joints. In Proceedings of the 2019 IEEE International Instrumentation and Measurement Technology Conference (I2MTC), Auckland, New Zealand, 20–23 May 2019. [Google Scholar] [CrossRef]
- Allin, J.M.; Cawley, P.; Lowe, M.J. Adhesive disbond detection of automotive components using first mode ultrasonic resonance. NDT&E 2003, 36, 503–514. [Google Scholar] [CrossRef]
- Li, W.; Palardy, G. Damage monitoring methods for fiber-reinforced polymer joints: A review. Compos. Struct. 2022, 299, 116043. [Google Scholar] [CrossRef]
- Sam-Daliri, O.; Faller, L.; Farahani, M.; Roshanghias, A.; Araee, A.; Baniassadi, M.; Oberlercher, H.; Zangl, H. Impedance analysis for condition monitoring of single lap CNT-epoxy adhesive joint. Int. J. Adhes. Adhes. 2019, 88, 59–65. [Google Scholar] [CrossRef]
- Gao, L.; Thostenson, E.; Zhang, Z.; Chou, T. Coupled carbon nanotube network and acoustic emission monitoring for sensing of damage development in composites. Carbon 2009, 47, 1381–1388. [Google Scholar] [CrossRef]
- Sam-Daliri, O.; Faller, L.; Farahani, M.; Zangl, H. Structural health monitoring of adhesive joints under pure mode I loading using the electrical impedance measurement. Eng. Fract. Mech. 2021, 245, 107585. [Google Scholar] [CrossRef]
- Jagadeeshwar, T.; Kalyani, S.; Rajagopal, P.; Srinivasan, B. Statistics-based baseline-free approach for rapid inspection of delamination in composite structures using ultrasonic guided waves. Struct. Health Monit. 2022, 21, 2719–2731. [Google Scholar] [CrossRef]
- Olisa, S.; Khan, M.A.; Starr, A. Review of Current Guided Wave Ultrasonic Testing (GWUT) Limitations and Future Directions. Sensors 2021, 21, 811. [Google Scholar] [CrossRef]
- Serey, V.; Quaegebeur, Q.; Micheau, P.; Masson, P.; Castaings, M.; Renier, M. Selective generation of ultrasonic guided waves in a bi-dimensional waveguide. Struct. Health Monit. 2019, 18, 1324–1336. [Google Scholar] [CrossRef]
- Mansfield, T.L. Lamb wave inspection of aluminium sheet. Mater. Eval. 1975, 33, 96–100. [Google Scholar]
- Ball, D.F.; Shewring, D. Some problems in the use of Lamb waves for the inspection of cold-rolled steel sheet coil. Nondestruct. Test 1976, 39, 138–145. [Google Scholar] [CrossRef]
- Alleyne, D.N.; Cawley, P. Optimization of Lamb wave inspection techniques. NDT&E 1992, 25, 11–22. [Google Scholar] [CrossRef]
- Alleyne, D.N.; Cawley, P. The interaction of Lamb waves with defects. IEEE Trans. Ultrason. Ferroelectr. Freq. Control. 1992, 39, 381–397. [Google Scholar] [CrossRef]
- Thompson, R.; Alers, G.; Tennison, M. Application of direct electromagnetic Lamb wave in generation to gas pipeline inspection. In Proceedings of the IEEE Ultrasonic Symposium Proceedings, Boston, MA, USA, 4–7 October 1972. [Google Scholar] [CrossRef]
- Rose, J.L.; Jiao, D.; Spanner, J. Ultrasonic guided wave NDT for piping. Mater. Eval. 1996, 54, 1310–1313. [Google Scholar]
- Quarry, M.; Rose, J.L. Multimode guided wave inspection of piping using comb transducers. Mater. Eval. 1999, 57, 1089–1090. [Google Scholar]
- Jung, Y.; Kundu, T.; Ehsani, M. Internal discontinuity detection in concrete by Lamb waves. Mater. Eval. 2001, 59, 418–423. [Google Scholar]
- Rokhlin, S. Lamb wave interaction with lap-shear adhesive joints: Theory and experiment. J. Acoust. Soc. Am. 1991, 89, 2758–2765. [Google Scholar] [CrossRef]
- Rose, J.L.; Rajana, K.M.; Hansch, M.K.T. Ultrasonic guided waves for NDE of adhesively bonded structures. J. Adhes. 1995, 50, 71–82. [Google Scholar] [CrossRef]
- Lowe, M.J.S.; Challis, R.E.; Chan, C.W. The transmission of Lamb waves across adhesively bonded lap joints. J. Acoust. Soc. Am. 2000, 107, 1333–1345. [Google Scholar] [CrossRef] [PubMed]
- Di Scalea, F.L.; Bonomo, M.; Tuzzeo, D. Ultrasonic guided wave inspection of bonded lap joints: Noncontact method and photoelastic visualization. J. Res. Nondestruct. Eval. 2001, 13, 153–171. [Google Scholar] [CrossRef]
- Rokhlin, S.I.; Xie, B.; Baltazar, A. Quantitative ultrasonic characterization of environmental degradation of adhesive bonds. J. Adhes. Sci. Technol. 2004, 18, 327–359. [Google Scholar] [CrossRef]
- Baiyang, R.C.; Lissenden, J. Ultrasonic guided wave inspection of adhesive bonds between composite laminates. Int. J. Adhes. Adhes. 2013, 45, 59–68. [Google Scholar] [CrossRef]
- Matt, H.; Bartoli, I.; Di Scalea, F.L. Ultrasonic guided wave monitoring of composite wing skin-to-spar bonded joints in aerospace structures. J. Acoust. Soc. Am. 2005, 118, 2240–2252. [Google Scholar] [CrossRef]
- Gauthier, C.; El-Kettani, M.; Galyc, J.; Predoi, M.; Leduc, D.; Izbicki, J. Lamb waves characterization of adhesion levels in aluminum/epoxy bi-layers with different cohesive and adhesive properties. Int. J. Adhes. Adhes. 2017, 74, 15–20. [Google Scholar] [CrossRef]
- Yilmaz, B.; Asokkumar, A.; Jasiunien, E.; Kažys, R. Air-Coupled, Contact, and Immersion Ultrasonic Non-Destructive Testing: Comparison for Bonding Quality Evaluation. Appl. Sci. 2020, 10, 6757. [Google Scholar] [CrossRef]
- Mori, N.; Wakabayashi, D.; Hayashi, T. Tangential bond stiffness evaluation of adhesive lap joints by spectral interference of the low-frequency A0 lamb wave. Int. J. Adhes. Adhes. 2022, 113, 103071. [Google Scholar] [CrossRef]
- Rucka, M.; Wojtczak, E.; Lachowicz, J. Damage Imaging in Lamb Wave-Based Inspection of Adhesive Joints. Appl. Sci. 2018, 8, 522. [Google Scholar] [CrossRef]
- Wojtczak, E.; Rucka, M. Wave Frequency Effects on Damage Imaging in Adhesive Joints Using Lamb Waves and RMS. Materials 2019, 12, 1842. [Google Scholar] [CrossRef]
- Nicassio, F.; Carrino, S.; Scarselli, G. Elastic waves interference for the analysis of disbonds in single lap joints. Mech. Syst. Signal. Process. 2019, 128, 340–351. [Google Scholar] [CrossRef]
- Nicassio, F.; Carrino, S.; Scarselli, G. Non-linear Lamb Waves for Locating Defects in Single-Lap Joints. Front. Built Environ. Sec. Comput. Methods Struct. Eng. 2020, 6, 45. [Google Scholar] [CrossRef]
- Wang, K.; Liu, M.; Su, Z.; Guo, S.; Cui, F. Mode-mismatching enhanced disbond detection using material nonlinearity in guided waves at low frequency. J. Sound Vib. 2021, 490, 115733. [Google Scholar] [CrossRef]
- Carrino, S.; Nicassio, F.; Scarselli, G.; Vitolo, R. Finite difference model of wave motion for structural health monitoring of single lap joints. Int. J. Solids Struct. 2019, 161, 219–227. [Google Scholar] [CrossRef]
- Moria, N.; Kusaka, T. Reflection and transmission characteristics of Lamb waves at an adhesive lap joint of plates. J. Acoust. Soc. Am. 2019, 145, 3075–3085. [Google Scholar] [CrossRef] [PubMed]
- Liu, N.; Chen, S.; Wong, Z.; Yao, K.; Cui, F. In situ disbond detection in adhesive bonded multi-layer metallic joint using time-of-flight variation of guided wave. Ultrasonics 2020, 102, 106062. [Google Scholar] [CrossRef]
- Pereira, D.; Le Duff, A.; Painchaud-April, G.; Belanger, P. Simulation-Based Inversion for the Characterization of Adhesively Bonded Joints Using Ultrasonic Guided Waves. IEEE Trans. Ultrason. Ferroelectr. Freq. Control 2022, 69, 2400–2407. [Google Scholar] [CrossRef]
- Treeby, B.; Cox, B. k-Wave: MATLAB toolbox for the simulation and reconstruction of photoacoustic wave-fields. J. Biomed. Opt. 2010, 15, 21314. [Google Scholar] [CrossRef]
- Treeby, B.; Jaros, J.; Rendell, A.; Cox, B. Modeling nonlinear ultrasound propagation in heterogeneous media with power law absorption using a k-space pseudospectral method. J. Acoust. Soc. Am. 2012, 131, 4324–4336. [Google Scholar] [CrossRef]
- Wang, K.; Teoh, E.; Jaros, J.; Treeby, B. Modelling nonlinear ultrasound propagation in absorbing media using the k-Wave toolbox: Experimental validation. In Proceedings of the 2012 IEEE International Ultrasonics Symposium, Dresden, Germany, 7–10 October 2012. [Google Scholar] [CrossRef]
- Pérez-Liva, M.; Herraiz, J.; Udías, J.; Miller, E.; Cox, B.; Treeby, B. Time domain reconstruction of sound speed and attenuation in ultrasound computed tomography using full wave inversion. J. Acoust. Soc. Am. 2017, 141, 1595–1604. [Google Scholar] [CrossRef]
- Zhao, X.; McGougha, R. Time-domain analysis of power law attenuation in space-fractional wave equations. J. Acoust. Soc. Am. 2018, 144, 467–477. [Google Scholar] [CrossRef] [PubMed]
- Almansourin, H.; Venkatakrishnan, S.; Bouman, C.; Santos-Villalobos, H. Model-Based Iterative Reconstruction for One-Sided Ultrasonic Nondestructive Evaluation. IEEE Trans. Comput. Imaging 2019, 5, 150–164. [Google Scholar] [CrossRef]
- Matsui, K.; Azuma, T.; Fujiwara, K.; Takeuchi, H.; Itani, K.; Wang, J.; Sakuma, I. Improving high-intensity focused ultrasound beam imaging via a backscattering suppression algorithm. Jpn. J. Appl. Phys. 2017, 56, 57301. [Google Scholar] [CrossRef]
- Acquaticci, F.; Guarracino, J.; Gwirc, S.; Lew, S. A polydimethylsiloxane-based axicon lens for focused ultrasonic brain stimulation techniques. Acoust. Sci. Technol. 2019, 40, 116–126. [Google Scholar] [CrossRef]
- Cui, W.; Qin, K. Fast 3-D Ultrasonic Imaging Using Time-Domain Synthetic Aperture Focusing Techniques Based on Circular Scan Conversions. IEEE Trans. Comput. Imaging 2018, 4, 632–639. [Google Scholar] [CrossRef]
- Petrella, L.; Perdigão, F.; Caixinha, M.; Santos, M.; Lopes, M.; Gomes, M.; Santos, J. A-scan ultrasound in ophthalmology: A simulation tool. Med. Eng. Phys. 2021, 97, 18–24. [Google Scholar] [CrossRef]
- Santos, M.; Santos, J.; Petrella, L. Computational simulation of microflaw detection in carbon-fiber-reinforced polymers. Electronics 2022, 11, 2836. [Google Scholar] [CrossRef]
- Brill, T.; Klieber, C. Reflection and mode-conversion of ultrasonic leaky Lamb waves at inaccessible discontinuities in layered structures. In Proceedings of the 2016 IEEE International Ultrasonics Symposium, Tours, France, 18–21 September 2016. [Google Scholar] [CrossRef]
- Klieber, C.; Brill, T. Mapping of ultrasonic Lamb-wave field in elastic layered structures using laser probes. In Proceedings of the 173rd Meeting of Acoustical Society of America and 8th Forum Acusticum, Boston, MA, USA, 25–29 June 2017. [Google Scholar] [CrossRef]
- Viktorov, A. Rayleigh and Lamb Waves—Physical Theory and Applications; Plenum: New York, NY, USA, 1967; pp. 117–118. [Google Scholar]
- Rose, J. Ultrasonic Waves in Solid Media; Cambridge University Press: Cambridge, UK, 1999; pp. 113–115. [Google Scholar]
- Cawley, P.; Alleyne, D. The Use of Lamb Waves for the Long Range Inspection of Large Structures. Ultrasonics 1996, 34, 287–290. [Google Scholar] [CrossRef]
- Carboni, M.; Gianneo, A.; Giglio, M. A Lamb Waves Based Statistical Approach to Structural Health Monitoring of Carbon Fibre Reinforced Polymer Composites. Ultrasonics 2015, 60, 51–64. [Google Scholar] [CrossRef] [PubMed]
- Santos, M.; Perdigão, J. Leaky Lamb waves for the detection and sizing of defects in bonded aluminium lap joints. NDT&E Int. 2005, 38, 561–568. [Google Scholar] [CrossRef]
- Chimenti, D.; Rokhlin, S. Relationship between leaky Lamb modes and reflection coefficient zeroes for a fluid-coupled elastic layer. J. Acoust. Soc. Am. 1990, 88, 1603–1611. [Google Scholar] [CrossRef]
- Bernard, A.; Lowe, M.; Deschamps, M. Guided waves energy velocity in absorbing and non-absorbing plates. J. Acoust. Soc. Am. 2001, 110, 186–196. [Google Scholar] [CrossRef]
- Haskell, N. Dispersion of surface waves on multilayered media. Bull. Seismol. Soc. Am. 1953, 43, 17–34. [Google Scholar] [CrossRef]
- Lowe, M. Matrix techniques for modeling ultrasonic waves in multilayered media. IEEE Trans. Ultrason. Ferroelectr. Freq. Control 1995, 42, 525–542. [Google Scholar] [CrossRef]
- Wang, L.; Rokhlin, S. Stable reformulation of transfer matrix method for wave propagation in layered anisotropic media. Ultrasonics 2001, 39, 413–424. [Google Scholar] [CrossRef]
- Lee, C.; Xu, Y. A modified transfer matrix method for prediction of transmission loss of multilayer acoustic materials. J. Sound. Vib. 2009, 326, 290–301. [Google Scholar] [CrossRef]
- Rose, J. Ultrasonic Guided Waves in Solid Media; Cambridge University Press: Cambridge, UK, 2014; pp. 227–230. [Google Scholar] [CrossRef]
- Armin, H.; Sause, M. Classification of solutions for guided waves in anisotropic composites with large numbers of layers. J. Acoust. Soc. Am. 2018, 144, 3236–3256. [Google Scholar] [CrossRef]
- Santos, M.; Faia, P. Propagation of Ultrasonic Lamb Waves in Aluminium Adhesively Bonded Lap Joints and in Single Plates. Res. Nondestruct. Eval. 2009, 20, 178–191. [Google Scholar] [CrossRef]
- Krautkramer, J.; Krautkramer, H. Ultrasonic Testing of Materials; Springer: Berlin/Heidelberg, Germany, 1990; p. 561. [Google Scholar] [CrossRef]
- Treeby, B.; Wise, E.; Cox, B. Nonstandard Fourier Pseudospectral Time Domain (PSTD) Schemes for Partial Differential Equations. Commun. Comput. Phys. 2018, 24, 623–634. [Google Scholar] [CrossRef]
- Auld, B.; Kino, G. Normal mode theory for acoustic waves and its application to the interdigital transducer. IEEE Trans. Electron. Devices 1971, 18, 898–908. [Google Scholar] [CrossRef]
Disclaimer/Publisher’s Note: The statements, opinions and data contained in all publications are solely those of the individual author(s) and contributor(s) and not of MDPI and/or the editor(s). MDPI and/or the editor(s) disclaim responsibility for any injury to people or property resulting from any ideas, methods, instructions or products referred to in the content. |
© 2023 by the authors. Licensee MDPI, Basel, Switzerland. This article is an open access article distributed under the terms and conditions of the Creative Commons Attribution (CC BY) license (https://creativecommons.org/licenses/by/4.0/).