Abstract
The rapid development of the additive manufacturing industry is a great opportunity both for the development of the industry in the context of rapid prototyping and for hobbyists using 3D printers at home. At the same time, such a rapid technological development poses a significant challenge for specialists dealing with sources of pollutant emissions to the environment as well as for Occupational Health and Safety (OHS) specialists dealing with the assessment of chemical hazards in the workplace. In this article, the authors demonstrate the legitimacy of the concern regarding issues relating to emissions from the 3D printing process, in particular FFF (fused filament fabrication). We carried out tests on the emission of volatile organic compounds from the printer chamber and compared them with the results of analyses conducted for the same materials in laboratory conditions by heating in a vial. They showed that the spectrometric analysis differed in both cases, which proved a clear influence of the parameters of additive manufacturing on both the amount and type of the emitted substances. The article also presents the sizes and shapes of the solid particles emitted during the process and aggregated during pollutant analyses.
1. Introduction
Additive manufacturing, fused filament processing, and 3D printers are becoming increasingly widespread. Rapid developments in technology have led to the production of better and more modern printers, which, in turn, have become less expensive and more readily available. There are many manufacturers and many different types of printers available. Some have open or closed printing chambers. Many people can now afford home printers, especially since they are not complicated to operate. Many FFF printers are used for educational purposes in schools and for training purposes in offices [1,2]. They are also used at home for small-scale needs and hobbies.
Three-dimensional printers are used to print objects with complex shapes. Unlike subtractive manufacturing, this object can be easily, inexpensively, and very quickly produced using additive techniques. Additive manufacturing is used in medicine, nanomedicine, radiology, surgery, diagnostics, prosthetics, orthopedics, and any other field where individual adjustment of a single product and manufacturing time are critical [2,3,4,5,6,7,8]. Ankle braces, foot braces, wrist braces, artificial pelvises, and mandibles can be printed with 3D printers. Preoperative support and surgeon preparation using additive manufacturing technology, especially in complex cases, may help to create more accurate treatment plans and assist with performing simulated surgery [9]. Future orthopedic surgeons or general surgeons can train on organs printed in such a way. Doctors can simulate difficult surgeries on printed organs.
Different types of filaments are used for printing, including ABS, PLA, PET, HIPS, and PS, in a variety of color combinations. In melt filament printing, the nozzle through which the material passes is heated to 180–270 °C. In some cases, in addition to the nozzle, the heat bed is also heated to 40–240 °C. In some cases, in addition to the nozzle, the heat bed is also heated to temperatures in the 40–110 °C range. The heating of the nozzles and plastics releases gases and solid particles that are harmful to the natural environment (Figure 1). The volatile organic compounds released in the process are also indifferent to the human body [10,11,12].
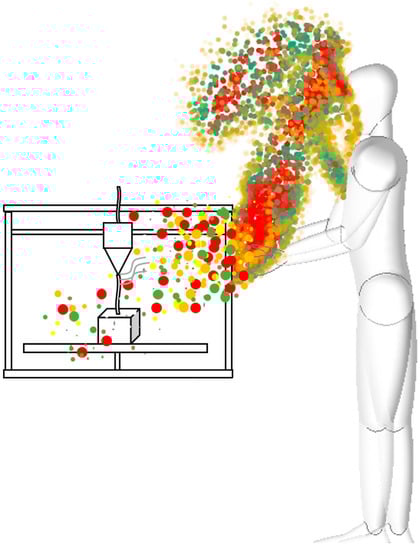
Figure 1.
Schematic diagram of particle formation, growth, and disappearance processes.
Numerous researchers have demonstrated that 3D printers are a source of many volatile organic compounds and particles that are released into the air of the room where additive manufacturing takes place during printing [13,14,15,16,17]. These are solid or volatile particles that penetrate the human body during respiration. These ultrafine particles can even penetrate the bloodstream through the skin. Researchers emphasize that the concentration of printers in one room further multiplies and intensifies the pollution that adversely affects human health.
PM consists of solid or liquid particles that are uniformly distributed in the air. Their size ranges from 1 to 10,000 nm, and they remain in the air for a long time. The smaller the particles, the more difficult they are to measure and control. PM10 includes all particles less than 10 µm in diameter. These particles can affect the environment and can be hazardous to human health. The primary route of exposure to these particles is inhalation; large molecules such as PM10 are expelled from the body by sneezing, coughing, or swallowing. Molecules smaller than 10 μm in diameter can penetrate deep into the lungs and enter the bloodstream. The greatest health threat is fine particles (less than 2.5 μm in diameter), or PM2.5. Inhalation of these solid particles can cause asthma, lung cancer, respiratory disease, cardiovascular disease, birth defects, low birth weight, and premature death. Figure 2 is characterized by small particles, ultrafine particles, and nanoparticles compared to a human hair.
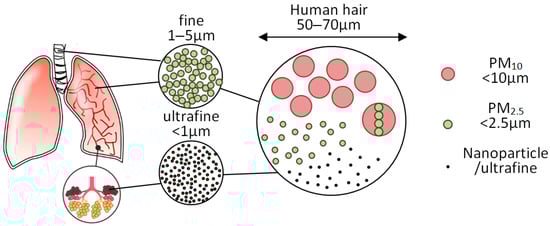
Figure 2.
Schematic comparison of dimensions of particles and the cross-section of a human hair [12].
The research conducted by the authors [12] showed that the printers operated by students in their apartments were located in the bedroom, living room, kitchen, and general purpose room. This indicates that many people are unaware of the harmfulness of the fumes emitted during fused filament fabrication. In recent years, many research teams have addressed the problem of the emission of solids from the FFF process. Tests have also been conducted on the respiratory effects of emitted contaminants [14], and studies have shown a toxic response to particulate matter released from different types of plastics used in 3D printers. Scientists have studied the chemical composition of the particles and their potential toxicity in detail. The FFF process requires that the filament be quickly heated to its melting point in a heating block just before the extruder. After leaving it, the molten plastic is rapidly cooled by the external temperature or by a blast of air. Such violations of the temperature of the material cause numerous physical and chemical changes in the substances contained in the plastic. These changes may include thermal depolymerization of the basic ingredient, oxidation of additives to the material, or the release of plasticizers and non-pyrolytic agents. As a result of these changes, it is possible for both VOCs (volatile organic compounds) and various particles to be emitted. A major threat to humans is the emission of particles in the PM10, PM5, and PM2.5 ranges and below. Diameter is the most important of the many parameters of solid particles. Depending on their values, particles are classified into predetermined types (Figure 3).
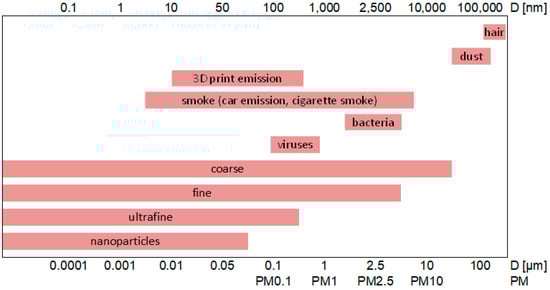
Figure 3.
Classifications and sizes of solid particles and their presence in the environment, based on [18,19,20].
SPME (solid phase microextraction) is an extraction technique developed in 1990. This technique is particularly useful when the purpose of the analysis is to identify and quantify volatile and intermediate volatile organic compounds, and the matrix is very complex. It is often used to analyze volatile compounds released from various plant materials, environmental samples, foods, insects, etc. SPME is a sample preparation method that is fast, economical, and versatile. The fibers that adsorb the analytes are coated with a polymeric material. SPME consists of adsorbing volatile compounds on a quartz fiber covered with a suitable sorption material (stationary phase). This method has many advantages over conventional extraction methods. The most important advantages of this technique are its simplicity, low cost of analysis, and the possibility of field use, and most importantly, it is not a time-consuming technique and does not require the use of solvents, high sensitivity, small-sized SPME fibers, or sorbing of volatile and medium-volatile analytes. One of the stages of each analytical procedure is extraction, which consists of separating the components of the mixture. Gases, liquids, or solids can be used for extraction. For example, solvent extraction involves the transfer of analytes from a matrix to an immiscible liquid phase. Typically, organic solvents such as methanol, chloroform, hexane, dichloromethane, petroleum ether, or mixtures thereof are used for this type of extraction. One technique that uses solids to isolate analytes is SPME. During extraction, the fiber can be placed directly into the aqueous sample to be tested, and the analytes are transferred directly from the sample matrix to the stationary phase (direct immersion, DI-SPME) or to the headspace above the liquid or solid sample (headspace, HS-SPME). SPME proceeds in two basic stages. The first one is the adsorption of analytes on the surface of the sorbent. The fiber is exposed to the components of the sample, and the compounds present in it are partitioned between the sorbent and the matrix. The amount of adsorbed analyte depends on the values of the analyte partition constants between the sample matrix and the headspace and between the sorbent covering the fiber and the headspace. The second stage is the desorption of the analytes under the influence of the high temperature of the gas chromatograph dispenser. Analytes are released into the gas phase and, together with the carrier gas, are transported to the chromatographic column, where they are separated and then detected by an appropriate detector [21,22,23,24,25].
GC (gas chromatography) is an analytical chromatographic technique in which the mobile phase is gas (usually helium, argon, high-purity nitrogen, and, less often, hydrogen), and the stationary phase is an adsorbent or absorbent covering the carrier (filling of the column or its walls). The GC technique makes it possible to determine the percentage composition of mixtures of chemical compounds, of which there are several hundred. Using classical detection (e.g., with the use of catarometers) it is possible to approximate the identification of mixture components based on their retention times. Using a mass spectrometer as a detector, almost univocal identification is possible (gas chromatography–mass spectrometry, GC-MS). Gas chromatography is the most commonly used method to rapidly analyze complex mixtures of compounds and to assess the purity of these compounds. Gas chromatography is based on the phenomena of molecular interactions between the chemical compounds that are components of the mixture to be analyzed and the packing material in the column. In gas chromatography, the mixture to be analyzed is first converted to the gas phase in a vaporizer, an important element of the injection system. If the sample to be analyzed is a gas, it can be added to the column, bypassing the vaporizer. The sample is entrained in a carrier gas (usually helium or hydrogen) and passes through a long column, where the mixture is separated into individual chemicals. At the outlet is a detector that detects and measures the concentration of subsequent components of the mixture in the carrier gas. The time it takes for a given chemical to pass through the entire column is called the retention time. The retention time is strongly influenced by the conditions of the analysis, such as temperature and the flow rate of the carrier gas, which is forced by the pressure applied to the top of the column. The retention time under certain conditions is a specific value for each component of the mixture being analyzed. This allows for a very good approximation of the identification of the components by comparison with known pure substances. An identification obtained in this way should be treated with great care, as it may be the case that there is also another substance with the same retention time. A more reliable result can be obtained by analyzing the sample using several different columns (with different properties of the stationary phase). The most reliable result is obtained by combining gas chromatography with other analytical techniques, most often with mass spectrometry (GC-MS). The components of the sample to be analyzed by gas chromatography must be volatile and stable at the temperature of analysis. Most often, these are various gas mixtures and solutions containing volatile chemical compounds [26,27,28,29,30].
2. Materials and Methods
The aim of the study was to identify organic compounds emitted into the air during 3D printing. The technique used was solid phase microextraction (SPME), in combination with gas chromatography coupled with mass spectrometry (GC-MS).
The first research object was a Zortrax M200 3D printer with a closed chamber and without a cleaning filter, made from Olsztyn, from Poland. This printer had one printing nozzle and a heated table. Four objects from four different materials were printed. The manufacturing of each sample lasted for, on average, 90 min. The emission tests were conducted with a standard setup for each material based on the manufacturers’ suggestion. The research sample was manufactured from the following filaments: black ABS, colorless PET-G, black PLA, and natural PVA. The print parameters are included in Table 1.

Table 1.
Print parameters of the tested material.
The measuring station (Figure 4) consisted of the Zortrax M200 printer that printed the research object (Figure 5).
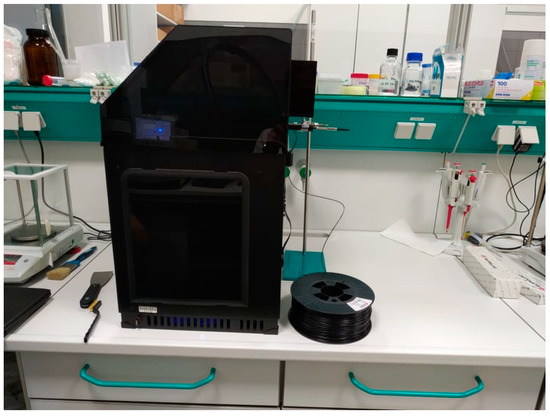
Figure 4.
Measuring station, Zortrax M200.
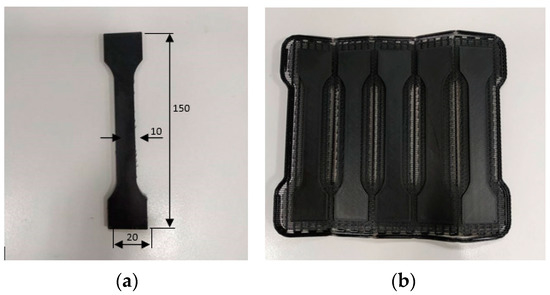
Figure 5.
Dogbone manufactured for the purpose of the research; (a) finished product (150 mm × 10–20 mm × 8 mm); (b) printed product before post-processing.
Research was carried out in two variations. In the first method (Figure 6), the research sample was collected with an SPME fiber made of PDMS (polydimethylsiloxane). The SPME fiber was exposed in the printer chamber during the 3D printing process for 1 h. The desorption was carried out in the chromatograph dispenser for 10 min.
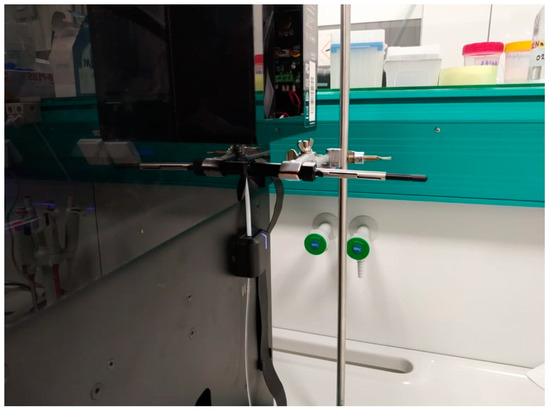
Figure 6.
Sample collection with the SPME fiber during the 3D printing process.
In the second method, the research sample was collected with SPME fiber made of PDMS. For this experiment, 3 g of crushed plastic was placed in a headspace vial and conditioned at 200 °C for 25 min. The SPME fiber was then exposed inside the test vial for 5 min, and the desorption was carried out in the chromatograph dispenser for 10 min.
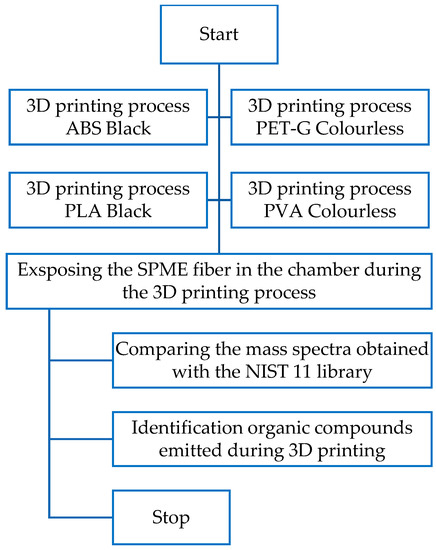
Figure 7.
Flow chart of the research plan of the first method.
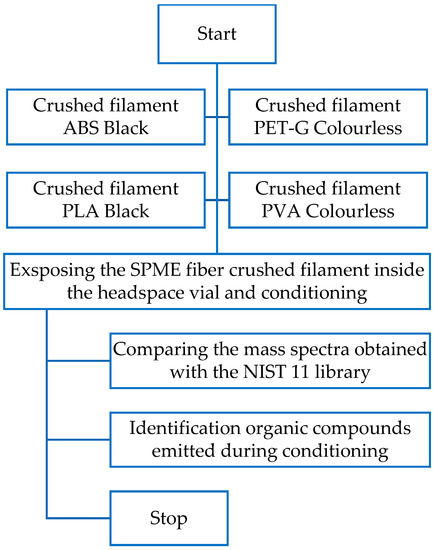
Figure 8.
Flow chart of the research plan of the second method.
The designation was carried out using the Bruker 436-GC gas chromatograph coupled with the Bruker Scion SQ mass spectrometer (single quadrupole, EI ion ionization), made from Mannheim, from Germany. The chromatograph and mass spectrometer settings are given in Table 2.
Table 2.
Technical data of the chromatograph and mass spectrometer.
3. Results
Chromatographic signals were identified on the basis of a comparison of the mass spectra obtained with the NIST 11 library. Identification results are shown in Table 3, Table 4, Table 5, Table 6, Table 7, Table 8 and Table 9.
Table 3.
Black ABS—compounds emitted during the process.
Table 4.
PLA Black—compounds emitted during the process.
Table 5.
Colorless PVA—compounds emitted during the process.
Table 6.
Black ABS heating in headspace vial—compound identification.
Table 7.
Colorless PET-G heating in headspace vial—compound identification.
Table 8.
Black PLA heating in headspace vial—compound identification.
Table 9.
PVA colorless heating in headspace vial—compound identification.
3.1. Process Emissions
The compounds emitted during the 3D printing process are shown in Table 3, Table 4 and Table 5. The test sample was taken with the SPME fiber made of PDMS (polydimethylsiloxane). The SPME fiber was exposed in the printer chamber during the 3D printing process for 1 h, and the desorption was carried out in the chromatograph dispenser for 10 min.
In the collected sample of the black ABS filament, the best visible spectrum was that of an aromatic compound, benzene (Figure 9).
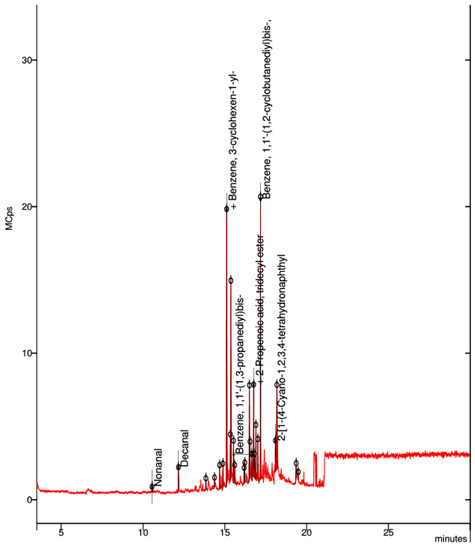
Figure 9.
Elemental composition of ultrafine particles emitted by the 3D printer using black ABS premium filament.
In the collected sample of the black PLA filament, the best visible spectrum was that of the cyclic ethers dioxan of the sulfoxide dimethyl (Figure 10).
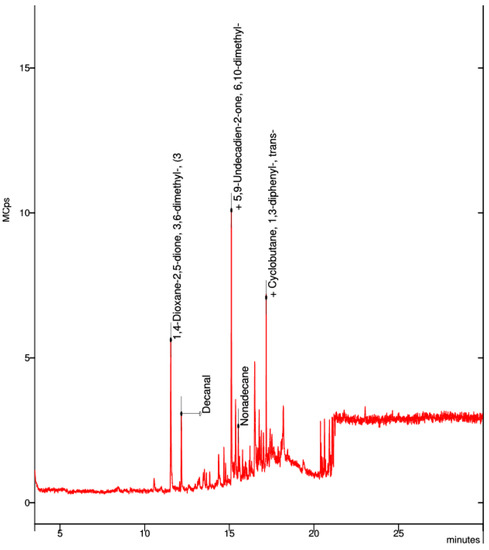
Figure 10.
Elemental composition of ultrafine particles emitted by the 3D printer using black PLA filament.
In the collected sample of the natural PVA filament, the best visible spectrum was that of propanetriol (Figure 11).
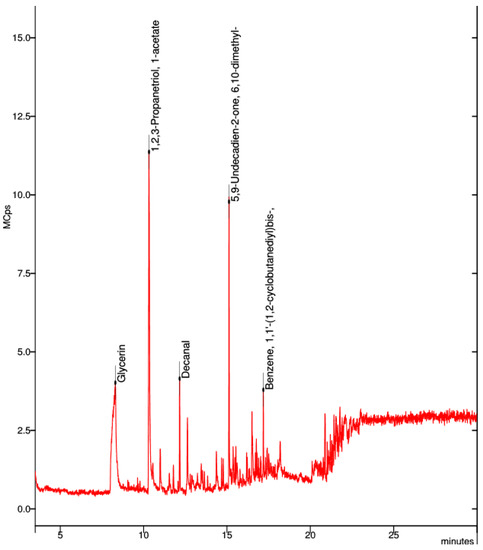
Figure 11.
Elemental composition of ultrafine particles emitted by the 3D printer using natural PVA filament.
Unfortunately, samples from colorless PET-G could not be obtained with this method.
3.2. Material Emissions
The compounds emitted while heating the chipped filament are shown in Table 6, Table 7, Table 8 and Table 9. The test sample was collected with the SPME fiber made of PDMS (polydimethylsiloxane). A sample consisting of 3 g of shredded plastic was placed into a headspace vial and conditioned at 200 °C for 25 min. The SPME fiber was then exposed inside the headspace vial for 5 min, and the desorption was carried out in the chromatograph dispenser for 10 min.
In the collected sample of the black ABS premium filament, the visible spectrum were benzene, styrene, acetophenone, and cyclohexene (Figure 12).
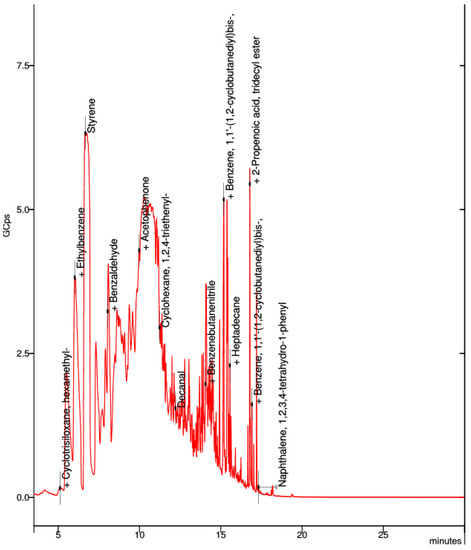
Figure 12.
Elemental composition of ultrafine particles emitted by black ABS premium filament.
In the collected sample of the natural PET-G filament, the visible spectra were decanal, dodecyl acrylate, cycloheptasiloxane, and tetradecamethyl (Figure 13).
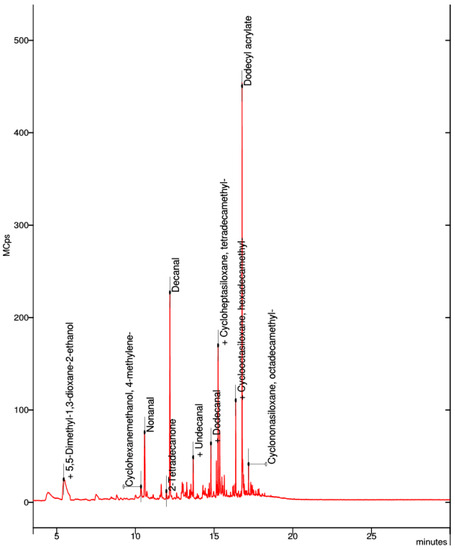
Figure 13.
Elemental composition of the ultrafine particles emitted by natural PET-G filament.
In the collected sample of the black PLA filament, the visible spectra were toluene, styrene, benzaldehyde, and hexadecane (Figure 14).
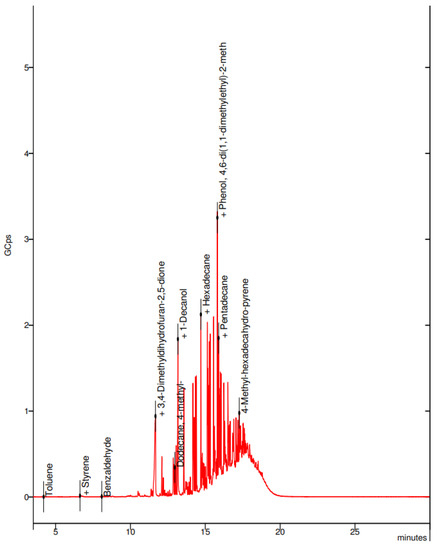
Figure 14.
Elemental composition of the ultrafine particles emitted by black PLA filament.
In the collected sample of the neutral PVA filament, the best visible spectra were acetophenone, acetic acid, phenylmethyl ester, heptadecanol, and pentadecanal (Figure 15).
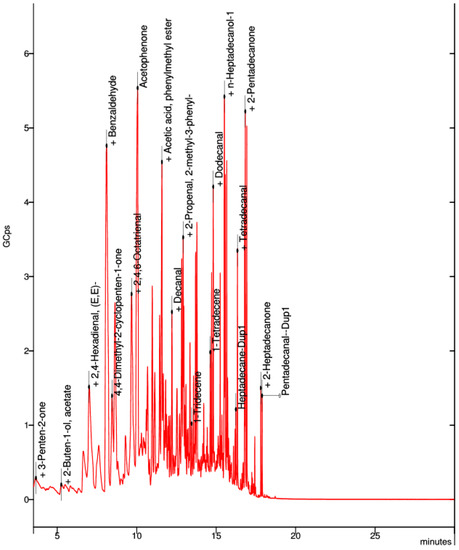
Figure 15.
Elemental composition of ultrafine particles emitted by neutral PVA filament.
3.3. Solid Particles Emitted during the Process
Pictures of aggregated particles emitted during the FFF process are shown in Figure 16. The particles were embedded in an organic solvent and then photographed with a scanning electron microscope (SEM).
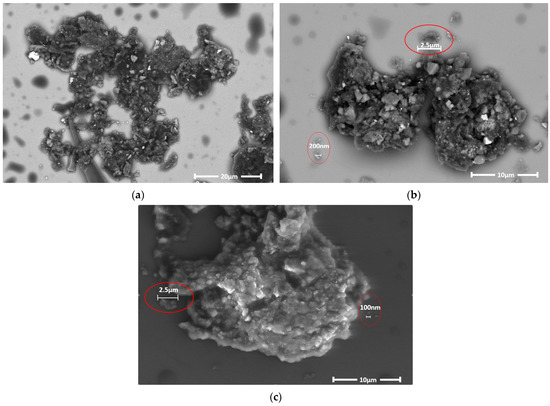
Figure 16.
(a–c) Aggregated particles emitted during the FFF process.
As shown in Figure 14, particles emitted during 3D printing aggregate relatively easily in organic solvents, forming larger clusters. Individual particles and their clusters have porous and irregular structures, in many cases with numerous acute angles. Such a configuration may significantly facilitate their entry into the bloodstream. Importantly, there is a reasonable risk that nanoparticles released during 3D printing may enter the alveoli or bloodstream directly, where they may aggregate, posing a significant health risk to the operator exposed to the emissions.
4. Discussion
In the course of their research, the authors have found that the tested plastics are a source of many volatile chemicals, and that these compounds are emitted into the air during 3D printing. The detected volatile substances can be classified into the following groups: aliphatic hydrocarbons, aromatic hydrocarbons, aldehydes, alcohols, ketones, esters, and siloxanes. Due to the very large number of detected substances and their strong coelution (overlap), in many cases, it has not been possible to precisely identify them. The chemical compounds given in Table 3, Table 4, Table 5, Table 6, Table 7, Table 8 and Table 9 should, therefore, be treated as selected, exemplary substances, the presence of which is subject to identification error.
Among the organic compounds mentioned in the study, particular attention was paid to substances harmful to health, such as toluene, ethylbenzene, xylenes, styrene, benzaldehyde, and other aldehydes, as well as harmful substances (not directly detected), the presence of which is very likely: benzene, acrylates, phenol derivatives, and polycyclic aromatic hydrocarbons (PAHs). The test samples emitting the most potentially harmful substances were ABS Premium in black and PLA in black; to a lesser extent, colorless PET-G; and to the least extent, natural PVA.
5. Conclusions
An important element of the presented research is the comparison of the emissions from the same material, tested with the same method, but released as a result of 3D printing and simple heating of the material to a given temperature. The resulting differences may be due to special conditions in the heat block and nozzle of the 3D printer. Rapid thermodynamic changes, including a very rapid increase in temperature and pressure, may lead to changes in the composition of waste gases formed during the process. This piece of information is important for the methodology of future research on emissions from the additive manufacturing process, in particular, fused filament fabrication.
Such a significant discrepancy between the results of emission measurements from the same substances and those made with different methods may also be the reason for the discrepancies in comparison with the results obtained by authors who conducted research on emissions from the 3D printing process earlier [31]. This state of affairs requires a thorough review of the available measurement methods and the development of a unified methodology for the analysis of emissions from the printout preparation to the completion of the analyses. The lack of a unified methodology for emission analysis significantly hinders the comparison of various results of studies carried out by different authors using various process parameters. As a result, it is not possible to clearly indicate the impact of pollution from the additive manufacturing process on the health of the operators and on the environment, which, in turn, prevents the development of an effective method to reduce this risk.
Author Contributions
Conceptualization, E.D., F.O. and A.K.; methodology, E.D., F.O. and A.K.; validation, F.O. and A.K.; formal analysis, F.O. and A.K.; investigation, F.O. and A.K.; resources, F.O. and A.K.; data curation, F.O. and A.K.; writing—original draft preparation, F.O. and A.K.; writing—review and editing, E.D. and A.K.; visualization, F.O. and A.K.; supervision, E.D., F.O. and A.K.; project administration, E.D., F.O. and A.K.; funding acquisition, E.D., F.O. and A.K. All authors have read and agreed to the published version of the manuscript.
Funding
The studies were conducted with support from statutory activity financed by the Polish Ministry of Science and Higher Education (0613/SBAD/4770).
Institutional Review Board Statement
Not applicable.
Informed Consent Statement
Not applicable.
Data Availability Statement
Not applicable.
Conflicts of Interest
The authors declare no conflict of interest.
References
- Bernat, Ł.; Kroma, A. Application of 3D Printing Casting Models for Disamatch Forming Method. Arch. Foundry Eng. PAN 2019, 19, 95–98. [Google Scholar] [CrossRef]
- Żukowska, M.; Górski, F.; Wichniarek, R.; Kuczko, W. Methodology of Low Cost Rapid Manufacturing of Anatomical Models with Material Imitation of Soft Tissues. Adv. Sci. Technol. Res. J. 2019, 13, 120–128. [Google Scholar] [CrossRef]
- Łukaszewski, K.; Wichniarek, R.; Górski, F. Determination of the Elasticity Modulus of Additively Manufactured Wrist Hand Orthoses. Materials 2020, 13, 4379. [Google Scholar] [CrossRef]
- Wierzbicka, N.; Górski, F.; Wichniarek, W.; Kuczko, W. Prototyping of individual ankle orthosis using additive manufacturing technologies. Adv. Sci. Technol. Res. J. 2017, 11, 283–288. [Google Scholar] [CrossRef]
- Kalaskar, D.M. 3D Printing in Medicine; Woodhead Publishing: Sawston, UK, 2017. [Google Scholar]
- Ahmad, N.; Gopinath, P.; Dutta, R. 3D Printing Technology in Nanomedicine; Elsevier: Amsterdam, The Netherlands, 2019. [Google Scholar]
- Mitsouras, D.; Liacouras, P.C.; Wake, N.; Rybicki, F.J. RadioGraphic Update: Medical 3D Printing for the Radiologist. RadioGraphics 2020, 40, E21–E23. [Google Scholar] [CrossRef]
- Górski, F.; Wichniarek, R.; Kuczko, W.; Banaszewski, J.; Pabiszczak, M. Application of low-cost 3D printing for production of CT-based individual surgery supplies. In Proceedings of the World Congress on Medical Physics and Biomedical Engineering, Prague, Czech Republic, 3–8 June 2018; Springer: Singapore, 2019; Volume 68, pp. 249–253. [Google Scholar] [CrossRef]
- Stephens, B.; Azimi, P.; Orch, Z.E.; Ramos, T. Ultrafine particle emissions from desktop 3D printers. Atmos. Environ. 2013, 79, 334–339. [Google Scholar] [CrossRef]
- Gu, J.; Wensing, M.; Uhde, E.; Salthammer, T. Characterization of particulate and gaseous pollutants emitted during operation of a desktop 3D printer. Environ. Int. 2019, 123, 476–485. [Google Scholar] [CrossRef]
- Zhang, Q.; Wong, J.P.S.; Davis, A.Y.; Black, M.S.; Weber, R.J. Characterization of particle emissions from consumer fused deposition modeling 3D printers. Aerosol Sci. Technol. 2017, 51, 1275–1286. [Google Scholar] [CrossRef]
- Karwasz, A.; Osiński, F.; Łukaszewski, K. Pollutants Emitted from 3D Printers onto Operators. Sustainability 2022, 14, 1400. [Google Scholar] [CrossRef]
- Pośniak, M. Diesel engine exhaust—Principles and methods of occupational exposure assessment. Med. Pr. 2003, 54, 389–393. (In Polish) [Google Scholar]
- Davis, A.Y.; Zhang, Q.; Wong, J.P.S.; Weber, R.J.; Black, M.S. Characterization of volatile organic compound emissions from consumer level material extrusion 3D printers. Build. Environ. 2019, 160, 106209. [Google Scholar] [CrossRef]
- Zhang, Q.; Pardo, M.; Rudich, Y.; Kaplan-Ashiri, I.; Wong, J.P.S.; Davis, A.Y.; Black, M.S.; Weber, R.J. Chemical composition and toxicity of particles emitted from a consumer-level 3D printer using various materials. Environ. Sci. Technol. 2019, 53, 12054–12061. [Google Scholar] [CrossRef]
- Bravia, L.; Murmura, F.; Santos, G. Additive Manufacturing: Possible Problems with Indoor Air Quality. Procedia Manuf. 2019, 41, 952–959. [Google Scholar] [CrossRef]
- Khaki, S.; Rio, M.; Marin, P. Monitoring Indoor Air Quality in Additive Manufacturing environment. Procedia CIRP 2020, 90, 455–460. [Google Scholar] [CrossRef]
- Pielecha, J.; Merkisz, J. Opportunities to evaluate emission of particulate matter from the combustion engines of rail vehicles. Rail Veh. 2019, 3, 1–14. [Google Scholar] [CrossRef]
- Gruber, M.; Klawatsch, D. Influence of motor parameters and fuel quality on particulate emissions. In Proceedings of the Vehicle Systems Technology for the Next Century, European Automotive Congress, Barcelona, Spain, 30 June–2 July 1999. [Google Scholar]
- Brook, R.D.; Franklin, B.; Cascio, W.; Hong, Y.; Howard, G.; Lipsett, M.; Luepker, R.; Mittleman, M.; Samet, J.; Smith, S.C.; et al. Air pollution and cardiovascular disease. Circulation 2004, 109, 2655–2671. [Google Scholar] [CrossRef]
- Arthur, C.L.; Pawliszyn, J. Solid phase microextraction with thermal desorption using fused silica optical fibers. Anal. Chem. 1990, 62, 2145–2148. [Google Scholar] [CrossRef]
- Lu, Y.; Niu, W.; Zou, X.; Shen, C.; Xia, L.; Huang, C.; Wang, H.; Jiang, H.; Chu, Y. Glass bottle sampling solid phase microextraction gaschromatography mass spectrometry for breath analysis of drugmetabolites. J. Chromatogr. A 2017, 1496, 20–24. [Google Scholar] [CrossRef]
- Nawała, J.; Czupryński, K.; Popiel, S.; Dziedzic, D.; Bełdowski, J. Development of the HS-SPME-GC-MS/MS method for analysis of chemical warfare agent and their degradation products in environmental samples. Anal. Chim. Acta 2016, 933, 103–116. [Google Scholar] [CrossRef]
- Niu, Y.; Hardy, G.; Agarwal, M.; Hua, L.; Ren, Y. Characterization of volatiles Tribolium castaneum (H.) in flour using solidphase microextraction–gas chromatography mass spectrometry (SPME–GCMS). Food Sci. Hum. Wellness 2016, 5, 24–29. [Google Scholar] [CrossRef]
- Tomkins, B.A.; Ilgner, R.H. Determination of atrazine and four organophosphorus pesticides in ground water using solid phase microextraction (SPME) followed by gas chromatography with selected-ion monitoring. J. Chromatogr. A 2002, 972, 183–194. [Google Scholar] [CrossRef]
- Dungan, R.S.; Reeves, J.B. Pyrolysis of foundry sand resins: A determination of organic products by mass spectrometry. J. Environ. Sci. Health 2010, 40, 1557–1567. [Google Scholar] [CrossRef]
- Zięba-Palus, J.; Zadora, G.; Milczarek, J.M. Differentiation and evaluation of evidence value of styrene acrylic urethane topcoat car paints analysed by pyrolysis-gas chromatography. J. Chromatogr. A 2008, 1179, 47–58. [Google Scholar] [CrossRef]
- Żymankowska-Kumon, S. The BTEX emission from moulding sands with furan resin dependence on the VOC content and loss on ignition. Metalurgija 2015, 54, 607–610. [Google Scholar]
- Szymański, Ł.; Żymankowska-Kumon, S. Chromatographic analysis in foundry processes. Arch. Foundry Eng. 2013, 13, 167–170. [Google Scholar]
- Milczarek, J.M.; Zieba-Palus, J.; Piechowicz, M. Development of computer application for identification and comparison of car paint samples analysed by pyrolysis-gas chromatography-mass spectrometry (Py-GC/MS). Chem. Listy 2008, 102, 619–630. [Google Scholar]
- Karwasz, A.; Osinski, F. Literature review on emissions from additive manufacturing by FDM method and their impact on human health. Manag. Prod. Eng. Rev. 2020, 11, 65–73. [Google Scholar] [CrossRef]
Disclaimer/Publisher’s Note: The statements, opinions and data contained in all publications are solely those of the individual author(s) and contributor(s) and not of MDPI and/or the editor(s). MDPI and/or the editor(s) disclaim responsibility for any injury to people or property resulting from any ideas, methods, instructions or products referred to in the content. |
© 2023 by the authors. Licensee MDPI, Basel, Switzerland. This article is an open access article distributed under the terms and conditions of the Creative Commons Attribution (CC BY) license (https://creativecommons.org/licenses/by/4.0/).