Article

Are You Depressed? Analyze User Utterances to Detect Depressive Emotions Using DistilBERT

1
Department of Artificial Intelligence Convergence, Sungkyunkwan University, Seoul 03063, Republic of Korea
2
College of Computing and Informatics, Sungkyunkwan University, Seoul 03063, Republic of Korea
*
Author to whom correspondence should be addressed.
Appl. Sci. 2023, 13(10), 6223; https://doi.org/10.3390/app13106223
Submission received: 6 April 2023 / Revised: 14 May 2023 / Accepted: 16 May 2023 / Published: 19 May 2023
(This article belongs to the Topic Artificial Intelligence in Healthcare - 2nd Volume)

Abstract

:
This paper introduces the Are u Depressed (AuD) model, which aims to detect depressive emotional intensity and classify detailed depressive symptoms expressed in user utterances. The study includes the creation of a BWS dataset using a tool for the Best-Worst Scaling annotation task and a DSM-5 dataset containing nine types of depression annotations based on major depressive disorder (MDD) episodes in the Diagnostic and Statistical Manual of Mental Disorders (DSM-5). The proposed model employs the DistilBERT model for both tasks and demonstrates superior performance compared to other machine learning and deep learning models. We suggest using our model for real-time depressive emotion detection tasks that demand speed and accuracy. Overall, the AuD model significantly advances the accurate detection of depressive emotions in user utterances.

1. Introduction

Although people enjoy a higher standard of living today, new challenges such as rapid changes in living and working environments and human relationships can contribute to mental fatigue, leading to depression [1] and negative impacts on physical health. To address this issue, we aim to develop a method for early detection of depressive symptoms based on people’s conversations.
Many studies have been conducted on detecting depressive symptoms from users using user interviews and social media. Shen et al. [2] used Twitter to build depressed and non-depressed datasets, and Cohan et al. [3] constructed a dataset with nine categories related to the DSM-5 from Reddit. Other researchers focus on developing new models for detecting depression based on text, such as Jain et al. [4], who analyzed data from the subreddits ‘r/SuicideWatch’ and ‘r/depression’ using machine learning techniques, and Cha et al. [5], who developed a deep-learning-based prediction model for early detection of depression using social media data. Some studies explore multi-modal datasets, such as Lin et al. [6], who proposed an automated depression detection method that uses voice signals and language content from patient interviews.
However, previous studies detecting depressive emotions focus on binary classification problems, i.e., whether users are depressed. Consequently, the datasets are primarily structured in this way, and there are relatively few studies on predicting the intensity of depression or classifying complex depressive emotions. To address this gap, in this paper, we introduce two new datasets: the Best-Worst Scaling [7] (BWS) dataset and the DSM-5 dataset, which are designed for detecting the intensity of depressive emotions and complex depressive emotions, respectively, labeled according to the Diagnostic and Statistical Manual of Mental Disorders, Fifth Edition [8] (DSM-5) criteria. We also develop a Best-Worst Scaling annotation tool [9] using Flask and MySQL to assist in annotation. We employ the DistilBERT [10] language model to train and infer these datasets and compare their performance with other machine learning and deep learning algorithms. Our proposed model architecture, AuD, is designed to quickly deduce depression intensity, complex depressive emotions, and high attention score tokens. We show the superiority of our model through performance comparisons with other algorithms, such as BERT [11] and ELECTRA [12]. Given that fast inference speed and superior performance are critical in real-time service environments such as chatbots, we suggest that the AuD model is well-suited for depression-related detection tasks.
Table 1 shows a sample of the Best-Worst Scaling (BWS) dataset. In this dataset, each user utterance consists of a single sentence and is assigned a score between 0 and 1. These scores are then converted to a scale of 0 to 16 to prepare the dataset for training the model.
Our classification system for depression is based on the DSM-5 guidelines published by the American Psychiatric Association (APA) in 2013. Specifically, we categorize depression into nine distinct types corresponding to the symptoms listed in the DSM-5. To be diagnosed with major depressive disorder [13] (MDD), a person must exhibit at least five symptoms for two weeks or longer. Table 2 represents the nine symptoms that form the basis of our complex depressive emotion categories. In addition, we add a daily label to classify user utterances that are unrelated to depression.
Table 3 shows a sample of the DSM-5 dataset. Each user utterance in this dataset consists of a single sentence and is assigned a label based on the DSM-5 classification system presented in Table 2.
This paper is organized into six sections. Section 1 serves as the introduction, providing an overview of the research problem and objectives. Section 2 presents a comprehensive literature review, discussing previous work on our research topic. Section 3 describes the process we used to construct our dataset. Section 4 provides a detailed description of the proposed model, including its architecture, training process, and attention mechanisms. In Section 5, we compare the performance of different models and use the best-performing model to predict a virtual conversation. Finally, Section 6 presents the results of our study and outlines potential avenues for future research based on our findings.

2. Literature Review

This section presents a literature review focusing on detecting depressive emotions in three parts: mental illness datasets, text-based mental illness detection, and multi-modal mental illness detection. In terms of depression-related datasets, most studies utilize binary classification datasets that determine whether the user is depressed or not. In text-based mental illness detection, multiple machine learning algorithms are typically utilized. Finally, multi-modal mental illness detection tasks use a combination of text, audio, and image data to detect depression.

2.1. Mental Illness Datasets

In detecting mental illness, researchers attempt to detect depression using social media platforms such as Twitter and Reddit and construct new datasets based on them. For example, based on Twitter, Shen et al. [2] construct two datasets, D1, and D2, collecting tweets between 2009 and 2016. They label tweets that contain the pattern “I am/I was/I have been diagnosed with depression” as depression data, D1, and those from users who have never posted any tweet containing the word “depress” as non-depression data, D2. Similarly, Yates et al. [14] collect data from the Reddit platform between 2006 and 2016 to create the Reddit Self-reported Depression Diagnosis (RSDD) dataset. They divide users into depression and non-depression groups (control group) and filter out false-positive posts containing hypotheticals, negations, and quotes.
Similar to this, most social media datasets only have two labels: depression and non-depression. On the other hand, Cohan et al. [3] further expand on the RSDD dataset through constructing the Self-reported Mental Health Diagnoses (SMHD) dataset with nine categories. They use the DSM-5 to select top-level disorders, such as schizophrenia, bipolar disorder, depression, anxiety, obsessive compulsive disorder (OCD), eating disorders, post-traumatic stress disorder (PTSD), autism, and attention deficit hyperactivity disorder (ADHD). Although the SMHD dataset includes nine categories of mental health disorders, it does not focus on specific symptoms of depression. Therefore, we create our new dataset that explicitly targets depression and its symptoms.

2.2. Text-Based Mental Illness Detection

Several studies use various Natural Language Processing (NLP) and machine learning algorithms to analyze social media data for detecting depression and other mental illnesses. For example, Choudhury et al. [15] analyze Twitter data of users diagnosed with MDD using the Center for Epidemiologic Studies Depression Scale (CES-D) questionnaire and develop an MDD classifier to predict which users are susceptible to depression. Similarly, Jain et al. [4] use machine learning algorithms, including regression analysis, Naïve Bayes (NB), and Support Vector Machines (SVM) to analyze data collected from the subreddits ‘r/SuicideWatch’ and ‘r/depression’. Nasrullah et al. [16] also use Reddit data to classify mental illnesses such as anxiety, bipolar disorder, dementia, and psychosis and develop an ensemble model combining Long Short-Term Memory (LSTM) and a Convolutional Neural Network (CNN). Amanat et al. [17] propose a Recurrent Neural Network (RNN) to analyze text data and detect depression early. Moreover, Cha et al. [5] develop a deep-learning-based prediction model for the early detection of depression in high-risk groups using social media data. The model consisting of Bi-LSTM and 1-D CNNs classifies depressed and non-depressed posts.
In recent years, pre-trained language models such as Bidirectional Encoder Representations from Transformers (BERT) have gained popularity in detecting depression based on social media data. For instance, Kabir et al. [18] employ BERT and DistilBERT models to classify depression and its severity in four categories (non-depressed, mild, moderate, and severe) using tweets. Kim et al. [19] used two separate BERT-based classifiers to detect users’ depression based on social media texts. In another study, Ji et al. [20] customize BERT and RoBERTa models for the mental health care domain through training them on mental-health-related subreddits, including ‘r/depression’, ‘r/SuicideWatch’, ‘r/Anxiety’, ‘r/offmychest’, ‘r/bipolar’, ‘r/mentalillness’, and ‘r/mentalhealth’, resulting in improved performance in mental health detection tasks.

2.3. Multi-Modal Mental Illness Detection

Several studies propose automated methods for detecting depression using multi-modal data such as voice signals, language content, and video-based evaluation metrics. For example, Lin et al. [6] develop a novel approach to depression detection via simultaneously processing voice signals and text data using Bi-LSTM networks with attention layers and 1-D CNNs. Similarly, Makiuchi et al. [21] propose a multi-modal fusion of speech and speech representations for detecting depressive disorders and inferring Patient Health Questionnaire (PHQ) scores through each model. They use deep spectral features extracted from pre-trained Visual Geometry Group (VGG-16) networks for speech processing, a Gate Convolutional Neural Network (GCNN) consisting of LSTM layers, and BERT for text embedding, and use CNNs consisting of LSTM layers. In addition, Saidi et al. [22] propose a novel method for the automated detection of depression using an audio-based hybrid model. The model uses a CNN for automatic feature extraction and an SVM for classification.

3. Dataset

This paper utilizes 1600 depression intensity data and 138,867 specific depressive states obtained through preprocessing the DailyDialog [23] dataset and collecting data from the subreddit ‘r/depression’ [24] on Reddit. This section describes the process of curating the BWS and DSM-5 datasets.

3.1. Curation of the Reddit Data

In this paper, we utilize Reddit to obtain text data about depression. The subreddit ‘r/depression’ provides a space for individuals suffering from depression to connect and support one another. This subreddit opened in 2009 and has been actively operated. It enforces a basic rule for its users: posts and comments must be related to depression and written in a sympathetic tone when responding to others seeking help.
Using the Reddit Archive [25], we collect data through extracting posts and comments from ‘r/depression’ written between January 2010 and December 2016. Figure 1 shows the distribution of token lengths in the Reddit dataset, with the x-axis representing the token length and the y-axis representing the number of data points.

3.1.1. Remove Cross Post, URL, and Null

A cross-post refers to a post not only on the ‘r/depression’ subreddit but also on another subreddit. We discover that some of these cross-posts do not relate to depression. Therefore, we filter out posts with null posts and posts containing URLs leading to other sites.

3.1.2. Remove Comments without Posts

During data processing, we discover that specific comments in our dataset do not have corresponding root posts. As a result, we remove any comments that do not have a matching ID value with a post.

3.1.3. Sentence-by-Sentence Segmentation

The posts and comments gathered from the Reddit archive consist of multiple sentences. We segment shorter passages into individual sentences using the period symbol ‘.’ to facilitate annotation work.

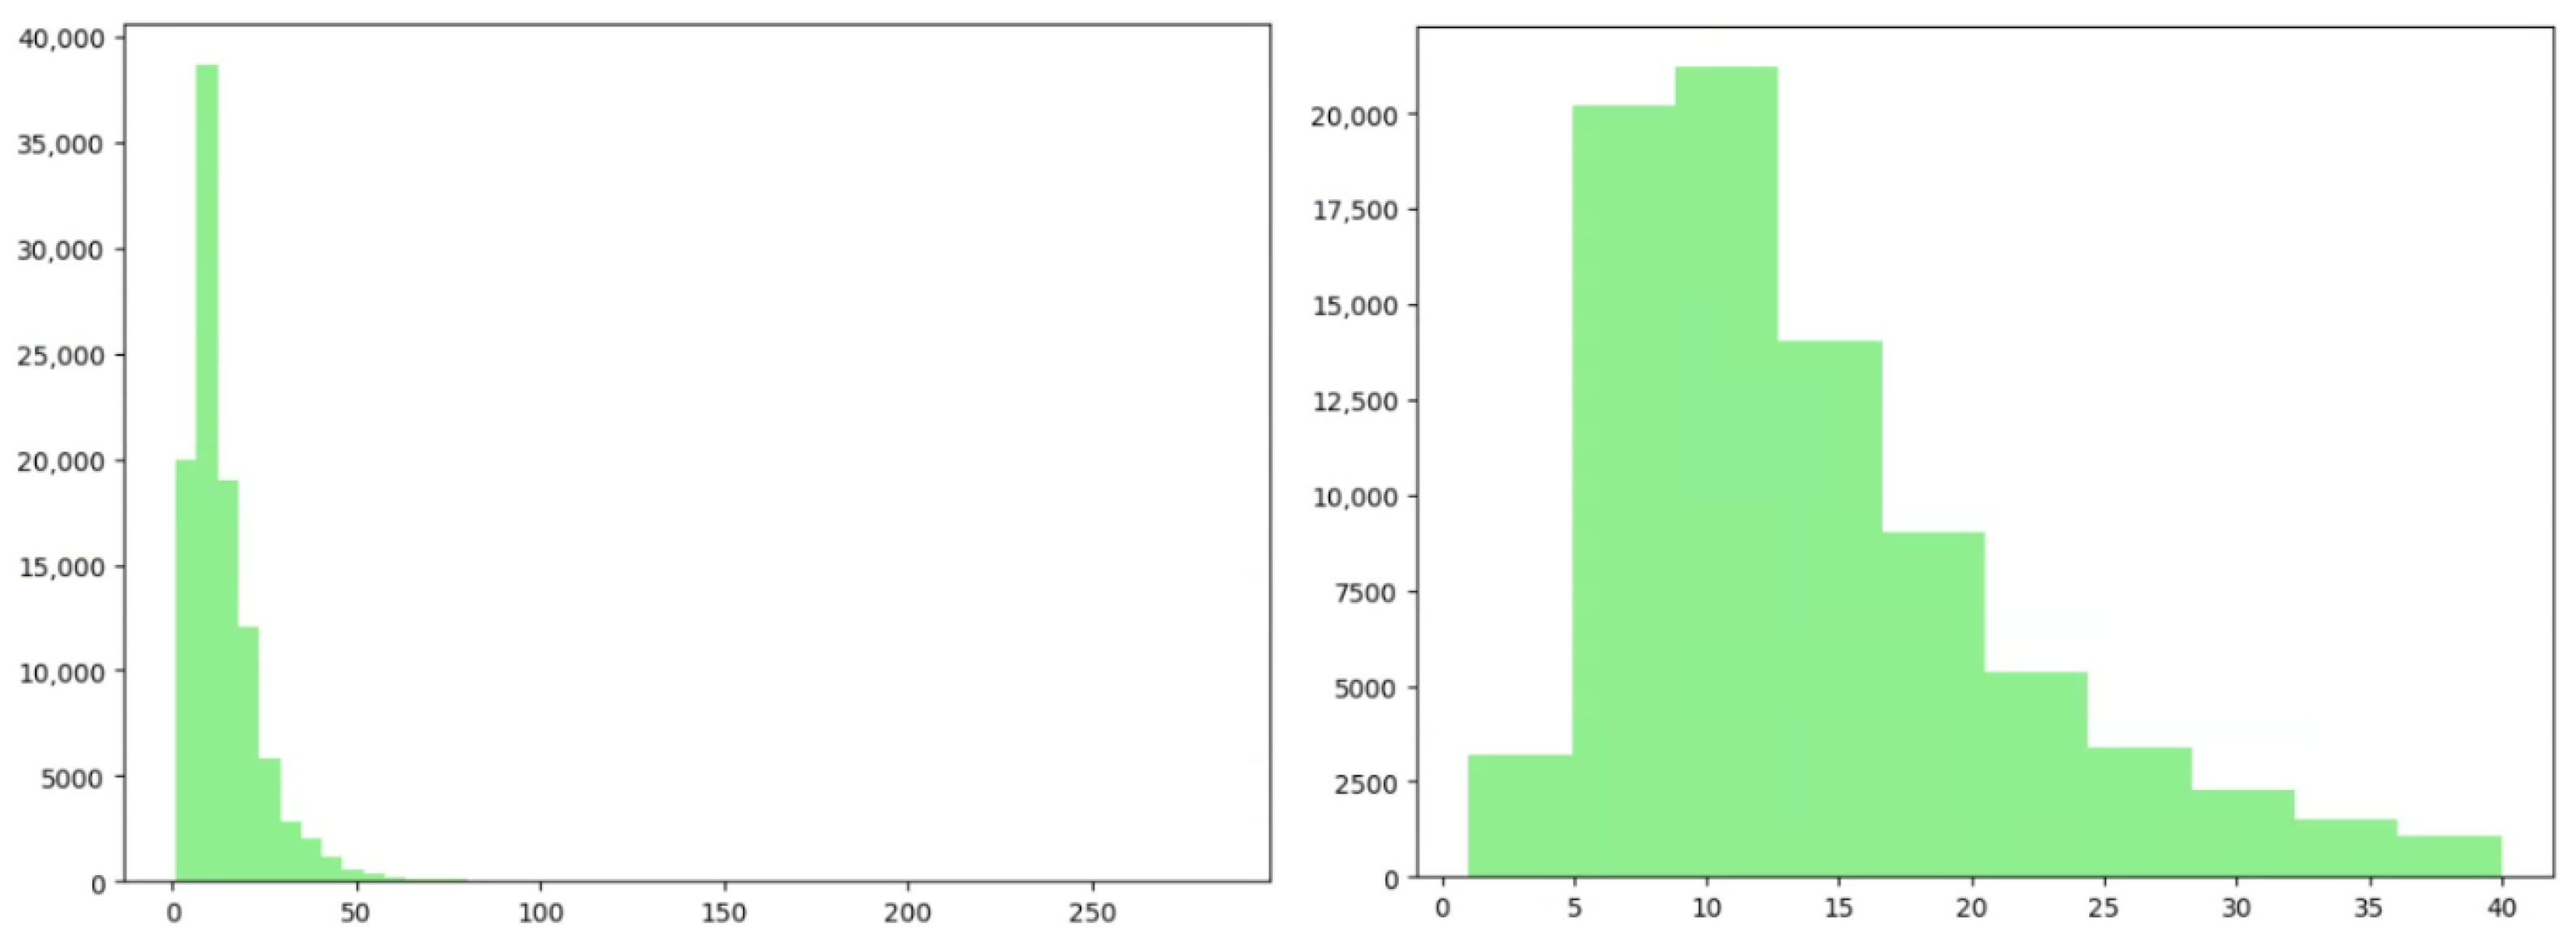
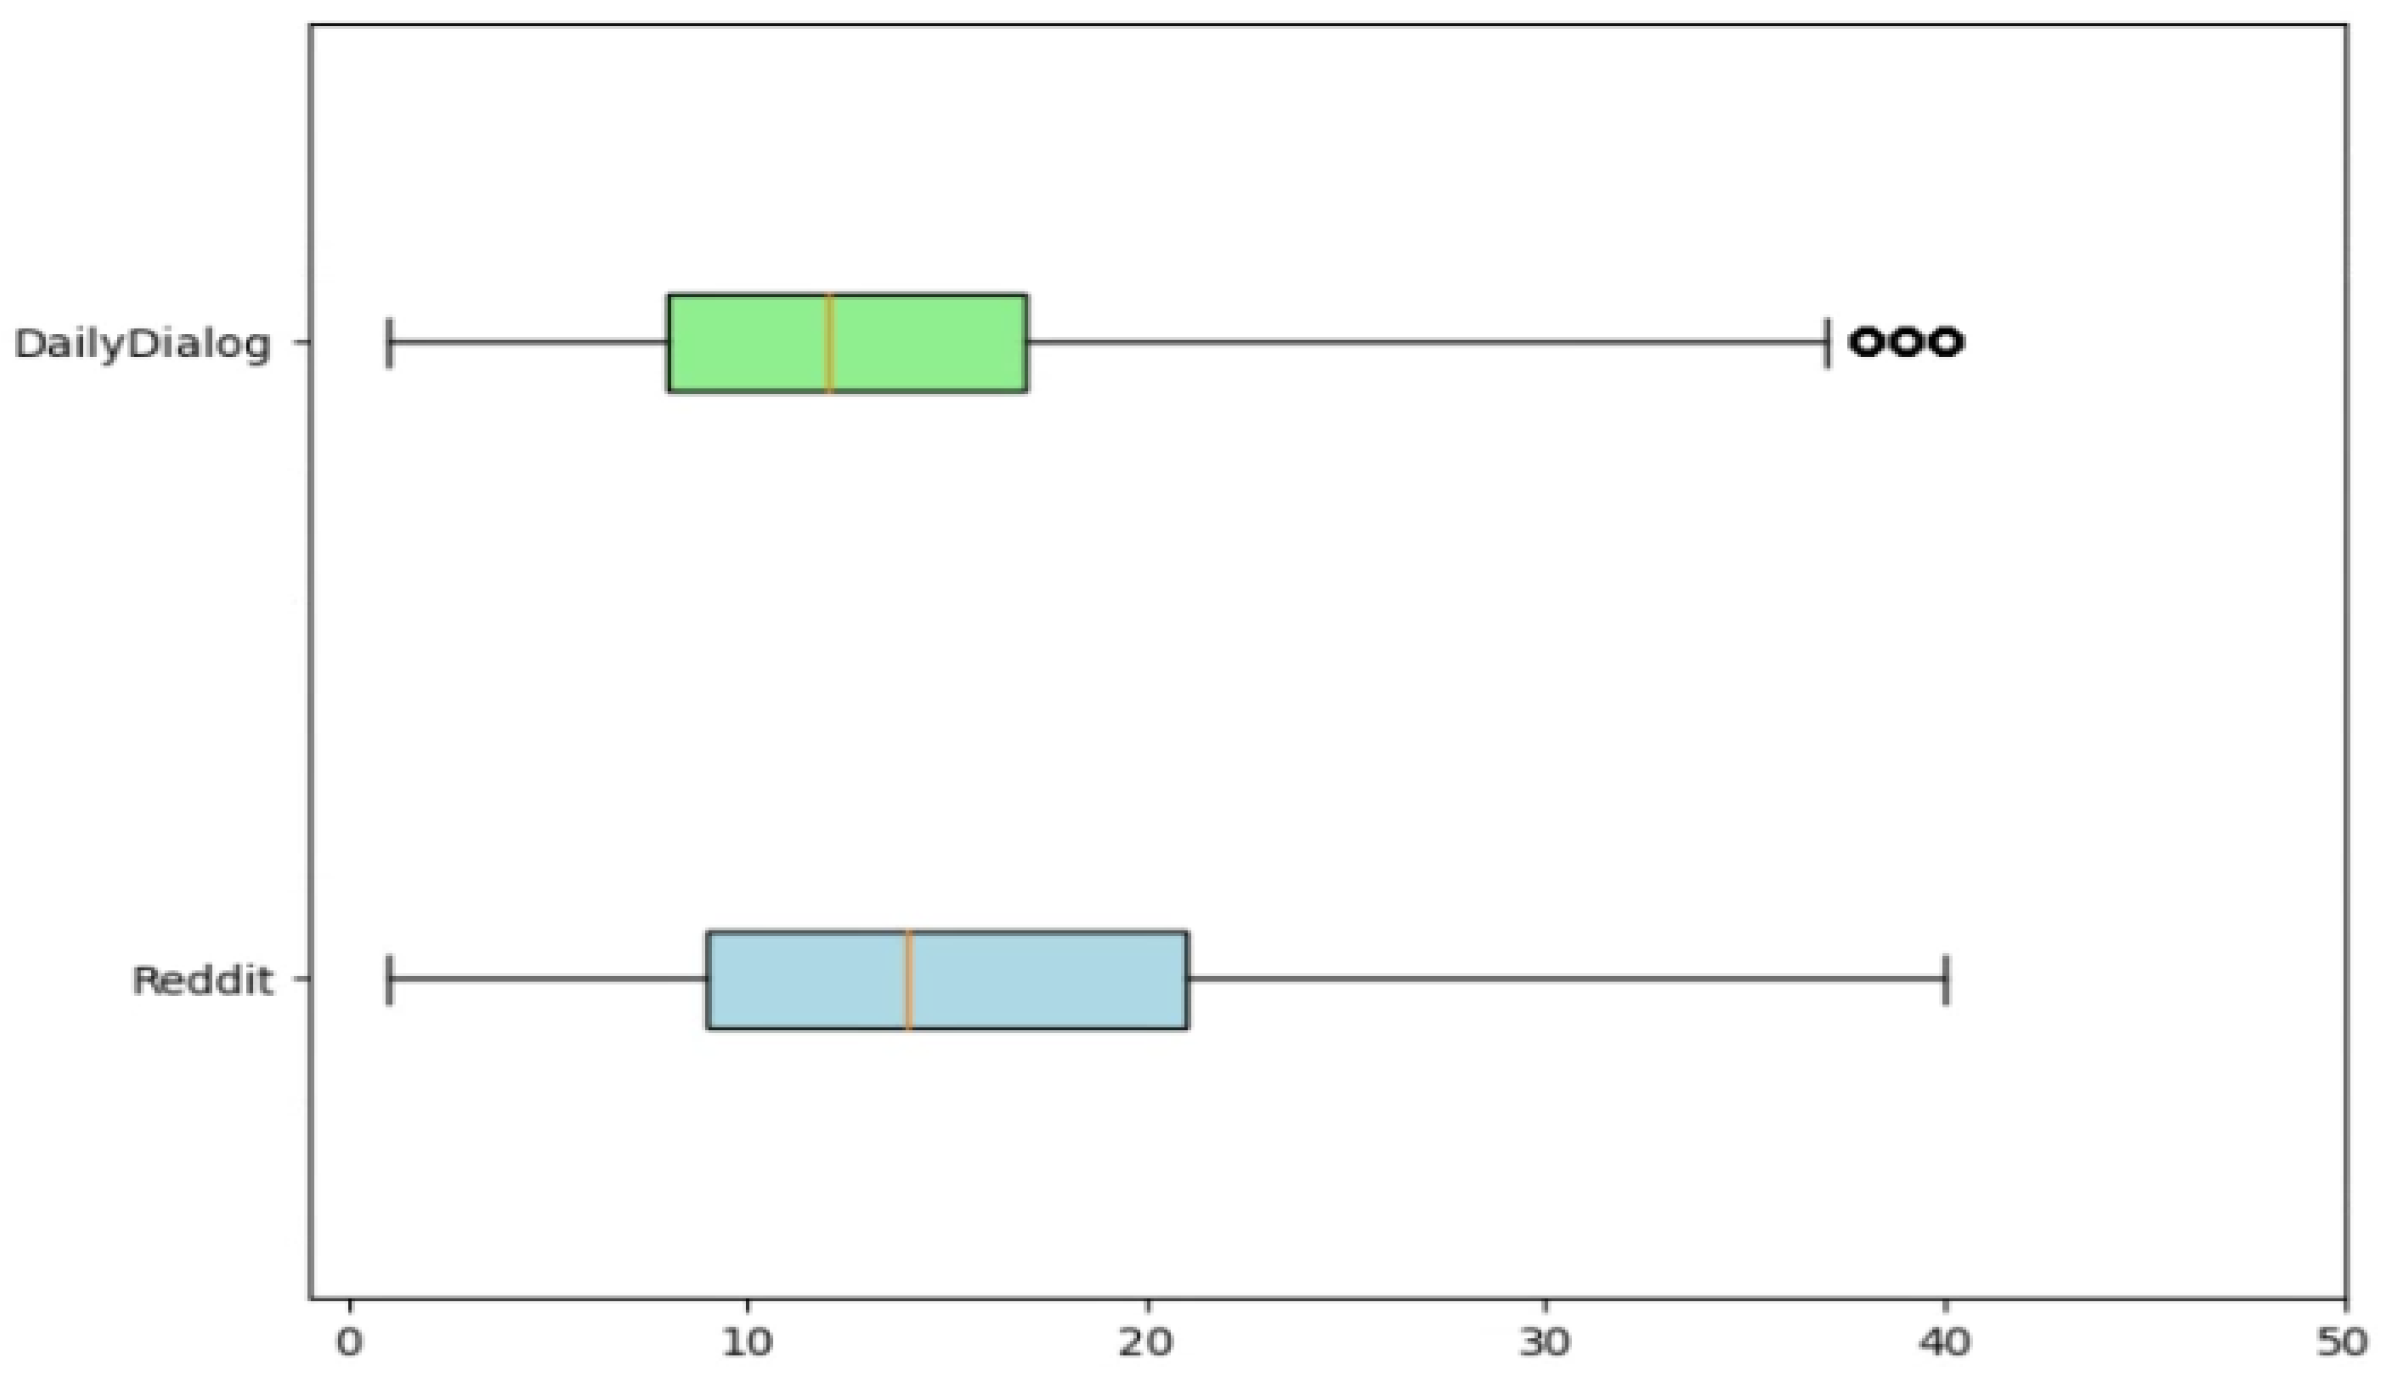
3.1.4. Length Filtering

We use the Natural Language Toolkit (NLTK) to tokenize our text data. However, some of our data has unusually long token lengths, as shown in Figure 1. To address this issue, we use quartiles to identify and eliminate outliers, where the token length of the Reddit data exceeds the upper boundary (41 tokens).

3.1.5. Remove Non-English Text

We utilize the Papago API [26], the language detection feature, to filter out non-English text from our dataset. This API can detect up to 18 languages and return ‘en’ if the text is identified as English. Using this language detection feature, we remove all non-English text and meaningless characters from the dataset.

3.1.6. Remove Personal Information Data

The BERT-base-NER [27] model can recognize four entity names: place (LOC), organization (ORG), person (PER), and other (MISC). We utilize the NER model to depersonalize our data through removing any instances that include an individual’s name.

3.2. Curation of the DailyDialog Data

The DailyDialog dataset is a high-quality, multi-turn, open-domain English dialogue dataset that contains 13,118 dialogues. The dataset is split into a training set with 11,118 dialogues and validation and test set s with 1000 dialogues each. We use this dataset to detect not only depressive utterances but also daily utterances in depression-related emotion classification models. Figure 2 shows the distribution of token lengths in the DailyDialog dataset, with the x-axis representing the token length and the y-axis representing the number of data points.
To ensure that the distributions of the two datasets are comparable, we adjust the token length of the DailyDialog data to match the maximum token length of the Reddit data, which is 41 tokens. Figure 3 displays a boxplot of the token length distribution of the Reddit data and the DailyDialog data after curation. The x-axis represents the token length, the y-axis represents the dataset name, and the orange line within each box represents the median token length value.

3.3. Best-Worst Scaling

The Best-Worst Scaling [7] method extends the pairwise comparison approach to multiple options, where participants are asked to select all the least attractive options from a set of choices. In this method, annotators receive a collection of n items (n-tuple, n > 1) and are asked to identify the best and worst things among them.
To ensure efficiency, we adopt a four-item scale for BWS annotation, following the recommendations of Mohammad et al. [28,29] and Kiritchenko et al. [30]. In their study, they annotate an average of 1774 texts to calculate emotion intensities for anger, fear, joy, and sadness. Our study annotates 1600 sentences from Reddit and the DailyDialog dataset to build the BWS dataset. Figure 4 illustrates the process of creating the BWS dataset.

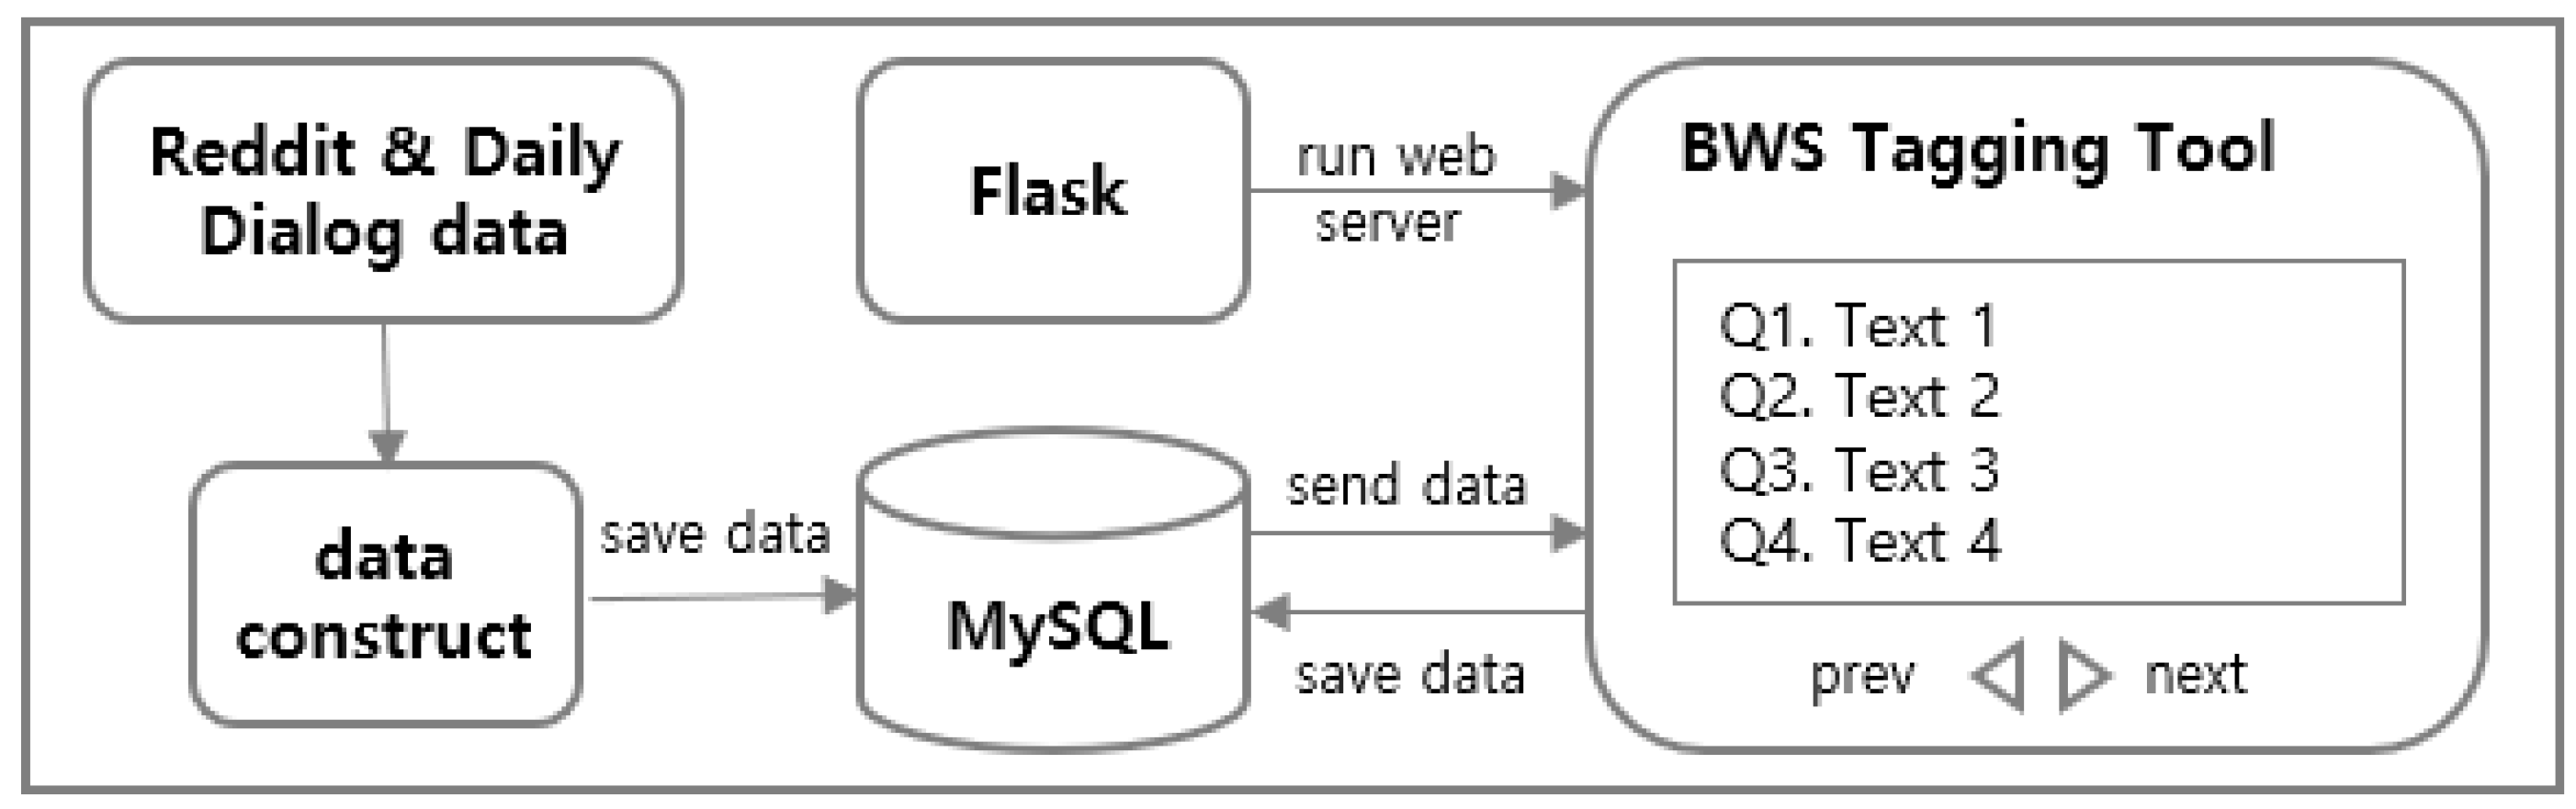
3.3.1. Data Construction for Best-Worst Scaling

Before applying the BWS task, we create two separate datasets: one containing sentences with depressed emotions and the other without them. To create the former, we filter sentences from the Reddit dataset containing reference words or similar words corresponding to the A1 category. Details of these words are mentioned in Section 3.4.1. We refer to this dataset as the A1 dataset. Next, we apply an additional filter to the A1 dataset to extract sentences in which the user explicitly expresses being depressed (e.g., “I am depressed” or “I feel depressed”), resulting in the depressed dataset.
To further refine the depressed dataset, we remove sentences that contain negative expressions indicating the user is not depressed (e.g., “am not,” “do not feel”), as described in the filter criteria listed in Section 3.4.2. The resulting subset is referred to as the not-depressed dataset. We merge this dataset with the sample of 360 sentences from the DailyDialog dataset to create the final not-depressed dataset. Figure 5 depicts the overall process.

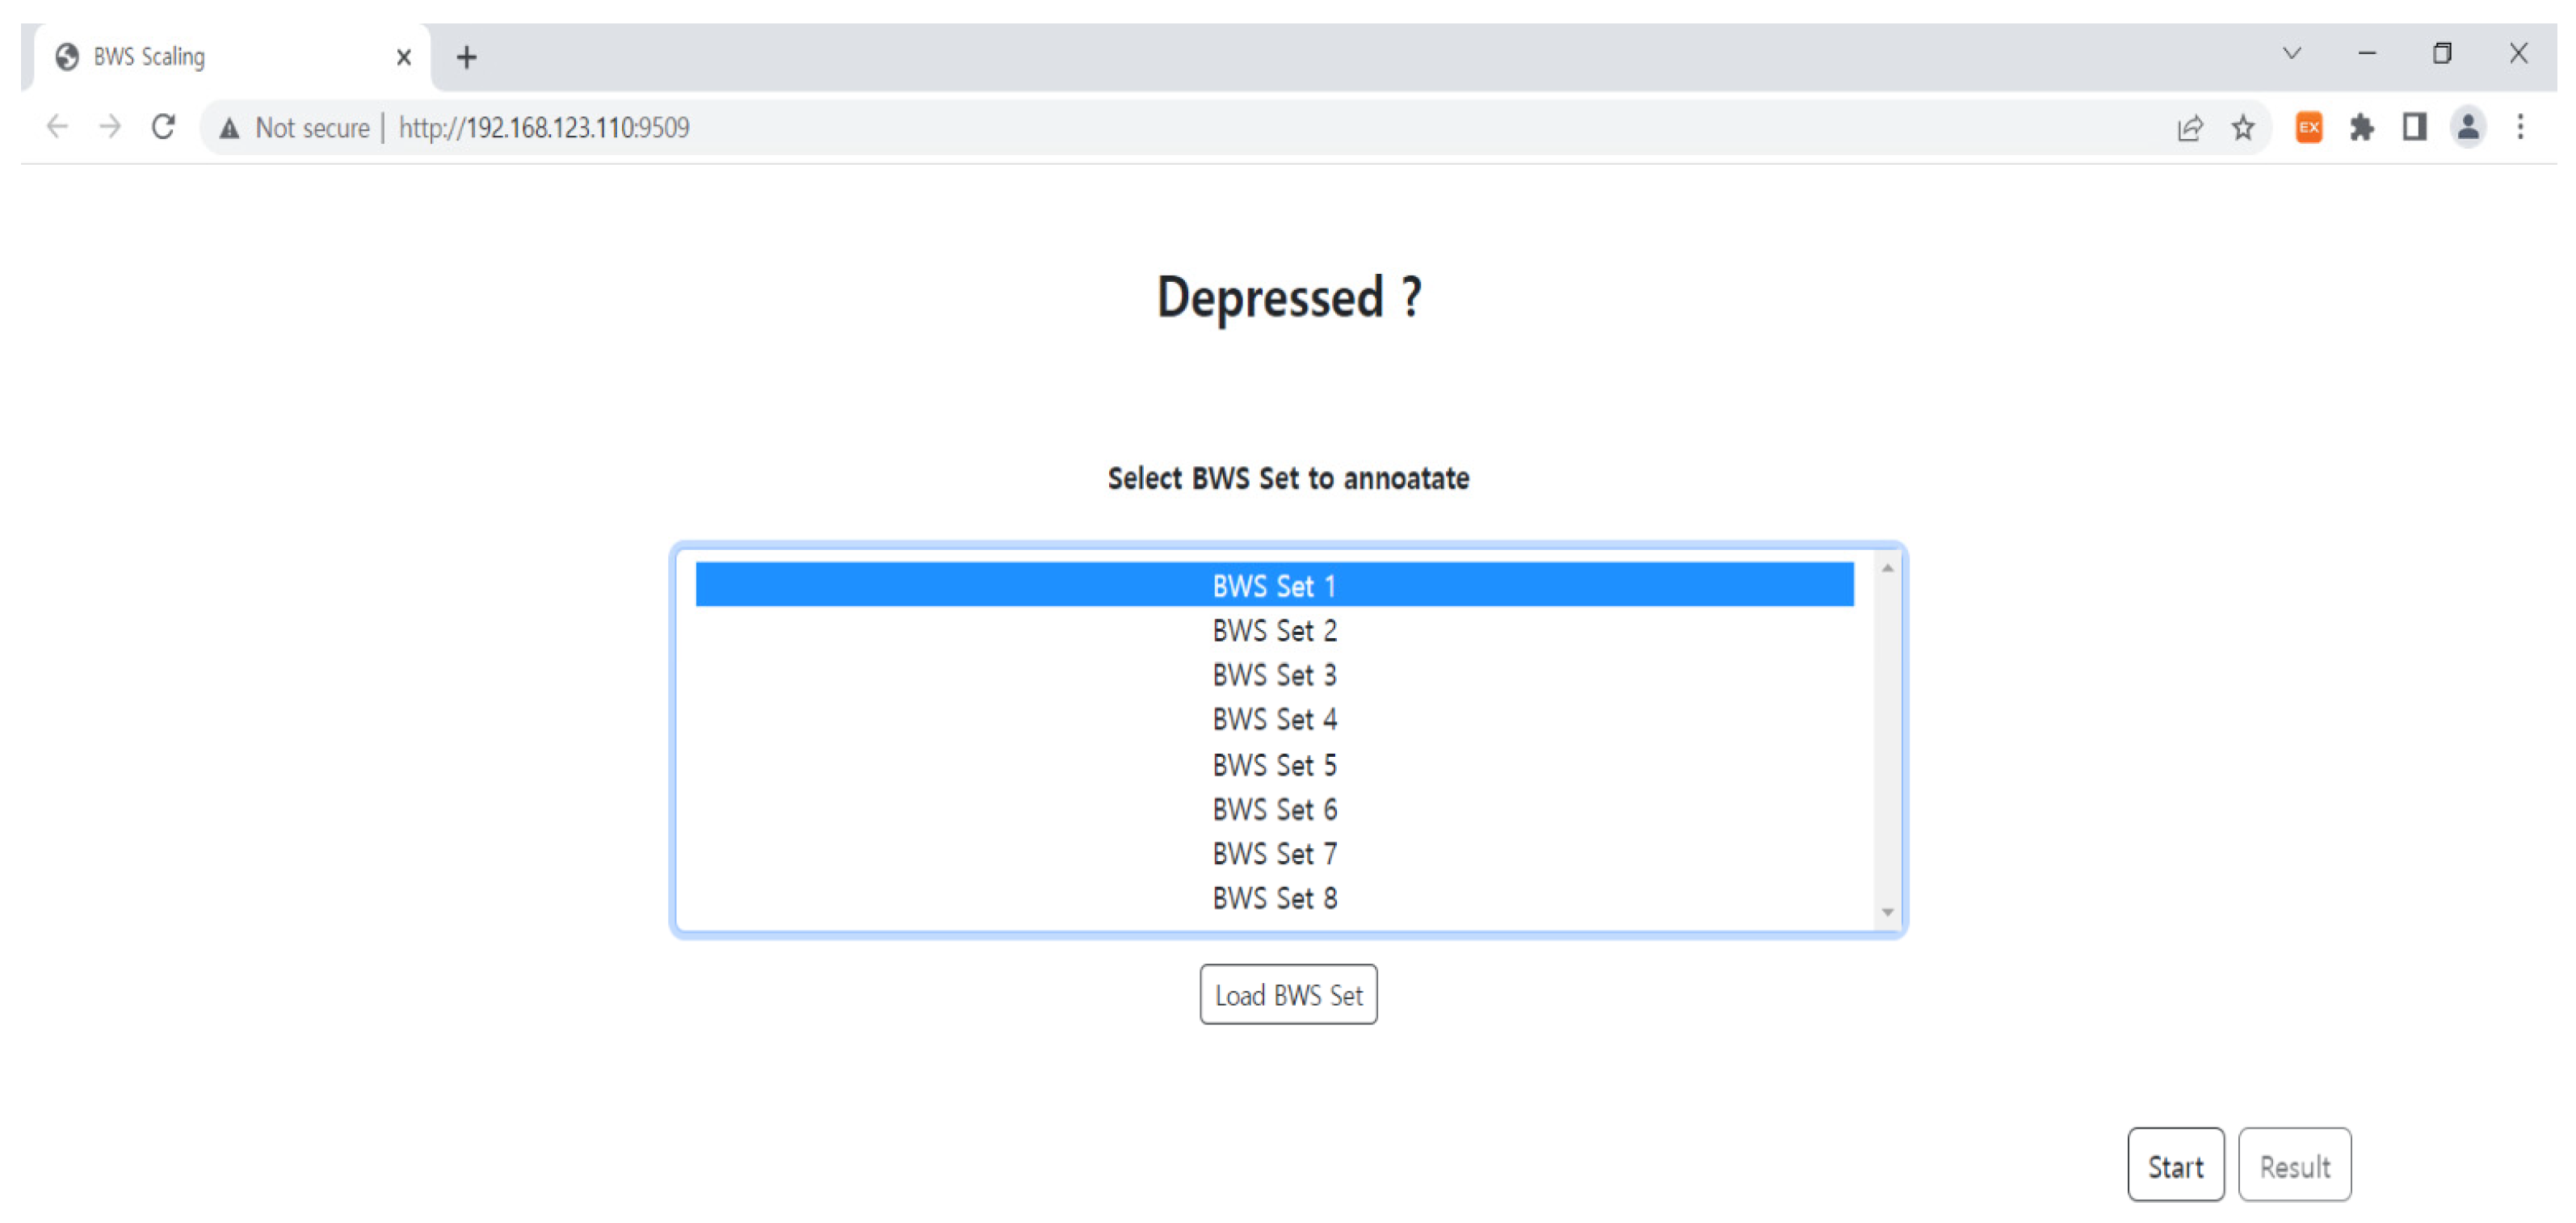
3.3.2. Annotation Work with Best-Worst Scaling

The BWS annotation task involves selecting the strongest and weakest sentences from four given items. During the annotation process, we instruct an annotator to choose the sentence with the strongest intensity from the depressed dataset and the sentence with the weakest intensity from the not-depressed dataset. To construct the BWS dataset, we randomly select 1200 sentences from the depressed dataset and 400 sentences from the not-depressed dataset, resulting in 1600 sentences. We include all 360 sentences from the DailyDialog data among the 400 selected sentences to ensure easy selection of the weakest intensity from the not-depressed dataset.
We create eight BWS sets to create the BWS tagging dataset using the quadruple generation criteria outlined in Mohammad et al. [28,29]. Each set consists of 400 questions, with four items (sentences) per question and 1600 sentences across all sets. Once the sets are constructed, we ensure each question contains four unique sentences. We then divide the sentences into short and long sentences based on the median sentence length of 77 characters, ensuring that questions are aligned with sentences of similar length. Finally, we set the maximum number of identical tokens allowed based on the sentence length. We allow up to five identical tokens for short sentences, while for long sentences, we allow up to eight identical tokens.
We utilize a tool [9] built with Flask and MySQL to complete the BWS annotation task. As shown in Figure 6, the tool’s main screen allows the annotator to select the BWS tagging set they wish to work. After choosing a set, the annotator is taken to the BWS annotation work page, as depicted in Figure 7. They select the sentences with the strongest and weakest depressive intensity among the four sentences provided and store their selections in the database.

3.3.3. Best-Worst Scaling Scoring
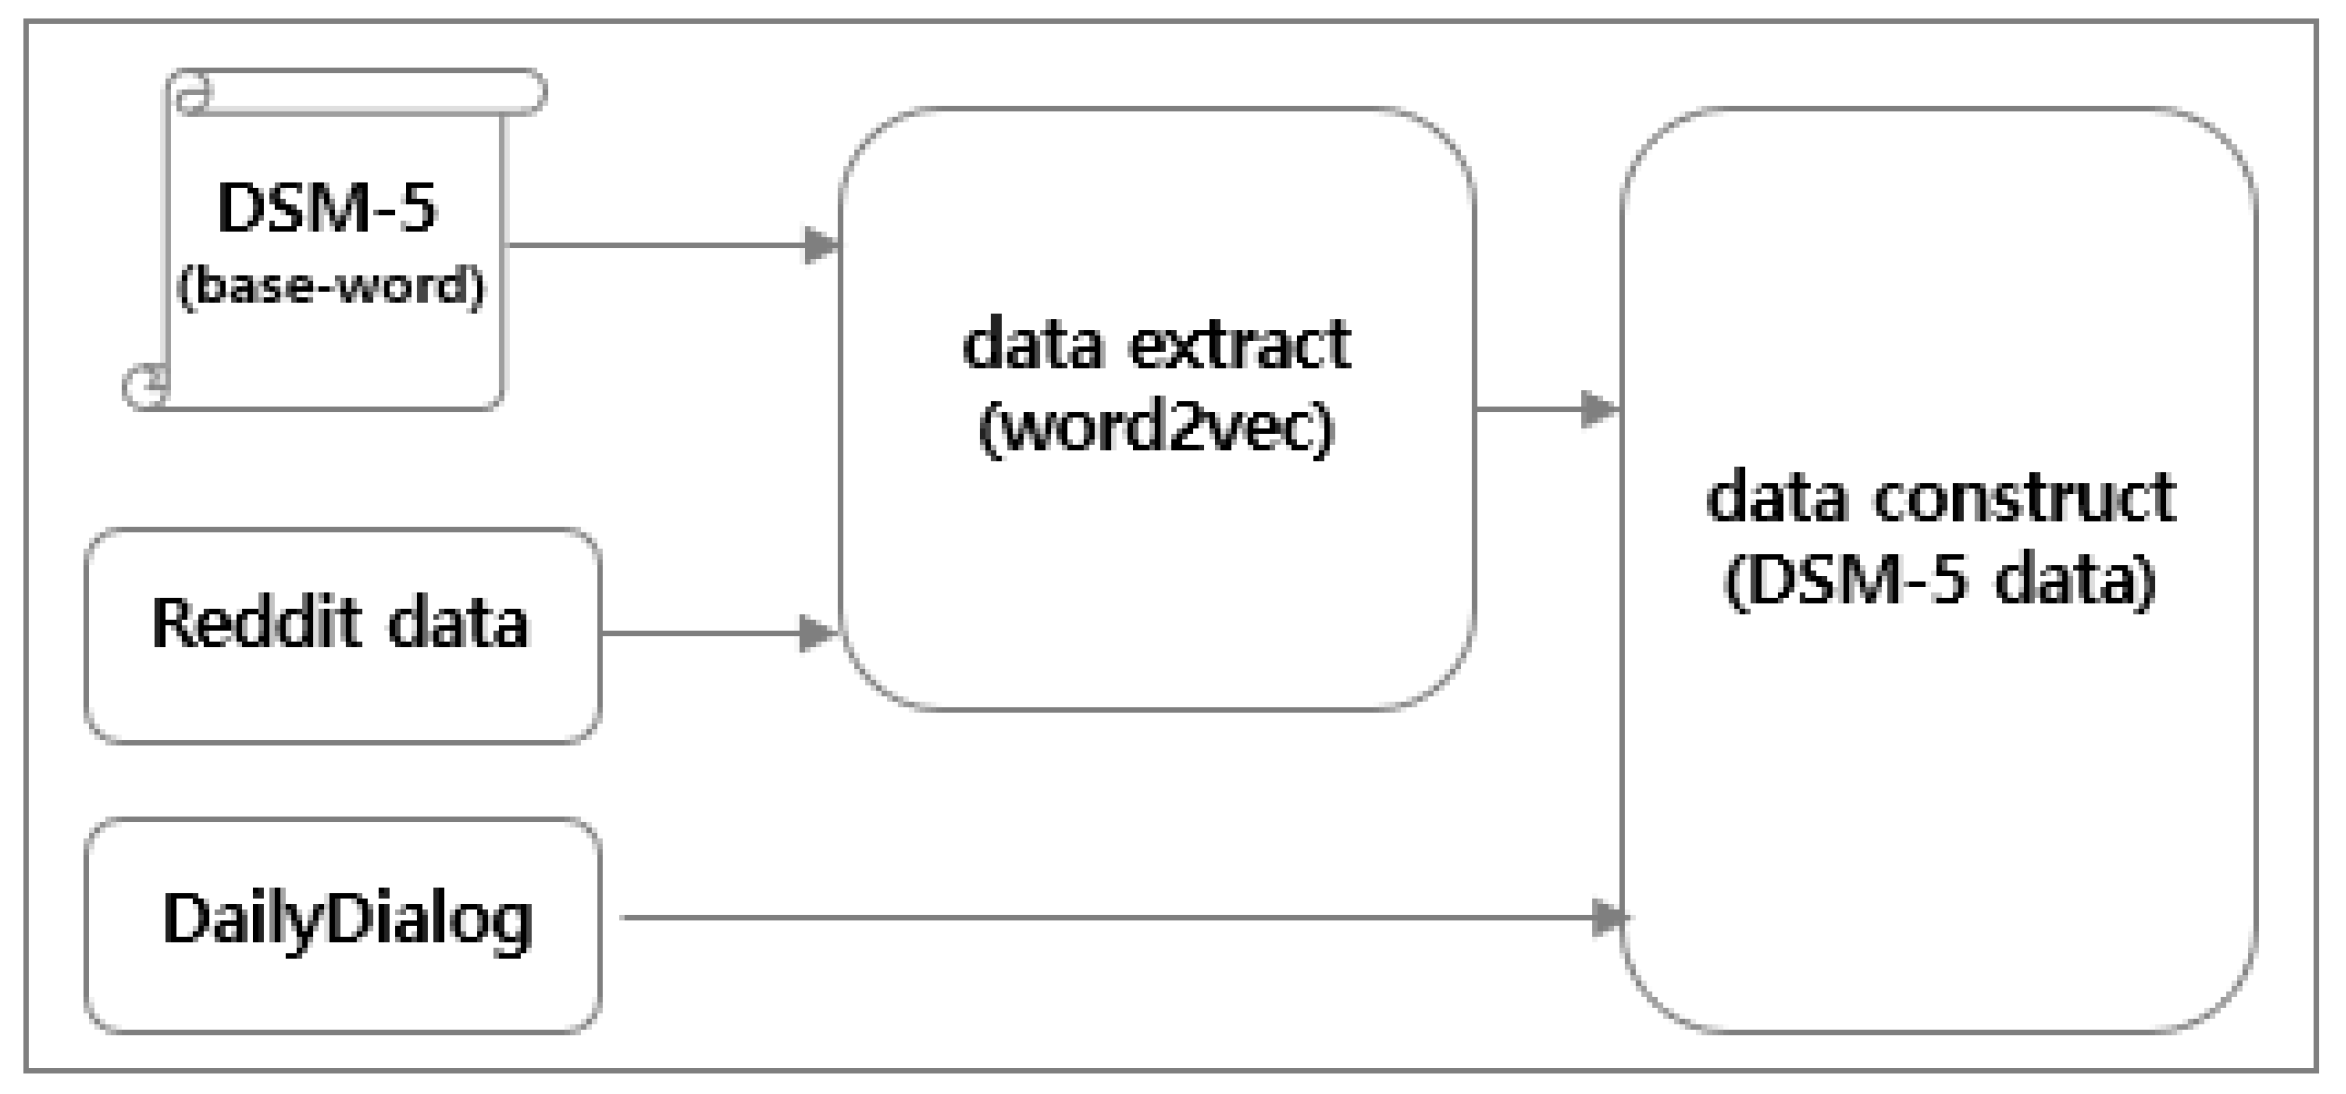
Table 4 displays a sample of the BWS score data obtained through annotation work. The BWS score data includes the 1600 sentences used in the BWS annotation task, as well as the number of times each sentence appeared in the task (eight times), the number of times chosen as the strongest depressive intensity, and the number of times selected as the weakest depressive intensity.
The process for calculating depression intensity using the BWS score data is explained by Equation (1). The equation uses the variables i n t e n s i t y D , c n t S , c n t W , and c n t T , where c n t refers to the number of appearances, and s, w, and T correspond to the strongest, weakest, and total scores, respectively.
i n t e n s i t y D = c n t S c n t W c n t T
Although the BWS score is calculated as between −1 and 1, a negative value is inappropriate for representing emotional intensity. Therefore, we use a linear conversion process to convert the score to a range between 0 and 1 [31,32,33]. This conversion process is illustrated in Equation (2), where a and b correspond to the minimum and maximum values of 0 and 1, respectively. Table 1 displays a sample of scores obtained through this linear conversion process.
x = a + ( x min ( x ) ) ( b a ) max ( x ) min ( x )  

3.4. DSM-5 Dataset

The DSM-5 dataset is designed for classifying complex depressive emotions. We leverage Reddit and DailyDialog data to create the DSM-5 dataset containing nine depression-related symptoms described in the MDD [13] section of the DSM-5 and daily utterances. The process for constructing the DSM-5 dataset is depicted in Figure 8 below.

3.4.1. Data Extraction

To extract data related to complex depressive emotions, we identify reference words corresponding to the nine significant symptoms of MDD. Using a Word2Vec [34] model trained on the Reddit data, we generate a list of ten highly similar words for each reference word. To ensure accuracy, we cross-reference these words with their definitions in a dictionary and add any identical words to the list of similar words. Table 5 provides the nine reference words and their corresponding similar words. We note that some terms listed as equal are typos for the reference word. Using the reference words and the list of similar words, we can extract relevant data from the Reddit dataset.

3.4.2. Data Construction Using Filters

In order to construct the DSM-5 dataset, we begin by extracting sentences that contain words related to MDD based on a pre-defined word list. However, some of these sentences may be irrelevant to MDD despite containing related words. Table 6 provides examples of unrelated sentences encountered during the process.
We define two filters to obtain highly related data on MDD as outlined in Table 7. Using filter 1 for each symptom, we extract the relevant data. However, it can be challenging to distinguish between positive and negative emotions using only filter 1. For example, it is difficult to differentiate between “I feel depressed” and “I do not feel depressed.” To address this issue, we develop filter 2 to identify sentences with negative connotations. This process enables us to classify users who express negative emotions as not depressed if the model receives a sentence such as “I do not feel depressed” as input. In the case of the fifth criterion, medical terms are included, and therefore filter 1 is not applied; only filter 2 is used.
To classify non-depressed users, we add a daily label and merge the DailyDialog dataset. Table 8 shows the distribution of the DSM-5 dataset by label.

4. Model

The overall model architecture proposed in this paper is depicted in Figure 9. We train the language model using the BWS and DSM-5 datasets we create. When a user’s utterance is input into the model, the BWS model identifies the intensity of depression. The DSM-5 model classifies the specific type of depressive emotion the user expresses. We apply attention operations to each model to return the output values and tokens with high attention scores for each model.
We use DistilBERT [10] as our language model, which leverages knowledge distillation during the pre-training phase. Studies show that it is possible to reduce the size of a BERT model by 40% while retaining 97% of its language understanding capabilities and being 60% faster. We use this model to increase our applicability to real-time services such as chatbots requiring fast response with better performance.
To train our model, we partition the BWS and DSM-5 datasets into three subsets: train, validate, and test. Initially, we divide each dataset into train and test sets using an 8:2 ratio. Subsequently, we split each dataset’s train set into train and validation subsets using a 9:1 ratio. Table 9 presents the resulting data distribution across the different subsets. For performance comparison with other models, we have set the number of epochs (5), batch size (8), and learning rate (5 × 10⁻⁵) of all models to be the same.

4.1. Prediction of Depressive Emotional Intensity

We train the DistilBERT model for BWS data; the resulting model is AuD BWS. To compare the model’s performance in predicting the intensity of depressive emotions, we use the deflated and non-deflated data to build the BWS data to train a binary classification model. A comparison of the predictive results of the AuD BWS and the binary classification model can be found in Section 5.

4.1.1. BWS Model

To prepare the BWS data score for model training, we convert it into an integer type through multiplying it by 16 since the score ranges between 0 and 1. This conversion process results in an integer data type with a minimum value of 0 and a maximum value of 16, making the data easier to handle. We train the BWS model to minimize the root mean square error (RMSE) value. The algorithm for the BWS model is outlined below (Algorithm 1).
Algorithm 1 BWS model
LOAD BWS data
SET BWS data (score) = INT(BWS data(score) × 16)
SPLIT data (train, val, test)
LOAD pretrained language model, tokenizer, config
ADD regression layer to pretrained model
SET training config
TRAIN BWS model (train, val data)
TEST BWS model (test data)
The training results of the AuD BWS model, including the RMSE values for each train and validation set, are illustrated in Figure 10.

4.1.2. BWS Binary Model

To compare with the BWS model, we also construct a binary classification model using the same BWS data, consisting of 1200 depressed and 400 not-depressed data points. We refer to this model as the BWS binary model. We maintain the same training environment for both models. However, for the BWS binary model, we assign a label of 0 to depressed data and 1 to non-depressed data during training. The algorithm for the BWS binary model is provided below (Algorithm 2).
Algorithm 2 BWS binary model
LOAD depressed data (1200), not depressed data (400)
SET LABEL depressed: 0, not depressed: 1
SPLIT data (train, val, test)
LOAD pretrained language model, tokenizer, config
ADD regression layer to pretrained language model
SET training config
TRAIN BWS binary model (train, val data)
TEST BWS binary model (test data)
The training results for the BWS binary model, including the RMSE values for the train and validation sets, are illustrated in Figure 11.

4.2. Classification of Complex Depressive Emotions

We train the DistilBERT model for the DSM-5 data, and the resulting model is AuD DSM-5. To address the issue of class imbalance in the DSM-5 dataset, we randomly select and utilize 30,000 samples from A1, 20,000 from A7, 10,000 from A8, 25,000 from A9, and 20,000 from the daily label. We train the DSM-5 model using categorical cross-entropy loss minimization. The algorithm for the DSM-5 model is provided below (Algorithm 3).
Algorithm 3 DSM-5 model
LOAD DSM-5 data
DOWN SAMPLE DSM-5 data (A1, A7, A8, A9, daily)
SPLIT DSM-5 data (train, val, test)
LOAD pretrained language model, tokenizer, config
SET training config
TRAIN DSM-5 model (train, val data)
TEST DSM-5 model (test data)
The training results of the AuD DSM-5 model, including categorical cross-entropy loss values for the train and validation sets, are illustrated in Figure 12.

4.3. Utilization of Attention Information

We incorporate attention information [35,36] to analyze the model’s output. We begin with summing the weight values of all attention heads in the final output of the model as expressed in Equation (3), where L represents a language model’s layer, A represents the weight value of attention heads, and n represents the number of attention heads.
A l a s t = L l a s t ( i = 1 n A i )
We obtain Alast as a two-dimensional array in the form of (seq_len, seq_len), which we convert into a one-dimensional array through column-wise summation to simplify further analysis. Using this value, we determine the tokens with the highest weights, excluding the [CLS], [SEP], “.”, and “,” tokens. Additionally, we limit the number of tokens returned to a maximum of half the number of input sentence tokens.
We can visualize the attention information using BertViz [37]. Figure 13 shows the result of visualizing the attention values generated through passing the sentence “I cannot sleep well these days” to the AuD DSM-5 model. This visualization focuses on the attention heads presented in the last layer. The thickness of each line represents the attention score, with thicker lines indicating higher scores. Each color represents each attention head. Figure 13 shows that the model pays the most attention to the “sleep” token when updating the [CLS] token.

5. Analysis of Results

In this section, we evaluate the performance of the two models discussed in Section 4: AuD BWS and AuD DSM-5. We conduct performance comparisons of our models with other machine learning algorithms and deep learning models. Additionally, we examine the embedding visualization results of the DSM-5 model for the Reddit test data. Finally, we share the prediction results of the model for the user–chatbot virtual conversation.

5.1. Comparison with Other Algorithms

We conduct performance evaluations of the BWS and DSM-5 models using 27,774 Reddit test data points and compare them with other machine learning and deep learning algorithms. All models have been trained with the same epoch (5), learning rate (5 × 10⁻⁵), and batch size (8). The performance evaluation results of each model are presented in Table 10. Our findings indicate that the BERT model outperforms other models for regression problems, while the DistilBERT model is the best for classification problems. Furthermore, the deep learning models perform better than the machine learning models. Among the deep learning models, the pre-trained models, such as BERT, DeBERTa [38], RoBERTa [39], and ELECTRA, perform better than non-pre-trained models, such as DNN, BiLSTM, and CNN. We select the DistilBERT model for our tasks based on these results.
We conduct an inference speed evaluation for each model on the same GPU environment. The dataset used for the evaluation is the size of 27,774 Reddit DSM-5 test data points, and the results are presented in Table 11. Our findings show that the DistilBERT model has a faster inference speed than half of the other pre-trained deep learning models, indicating that our model can be applied even in real-time environments that require a fast response.

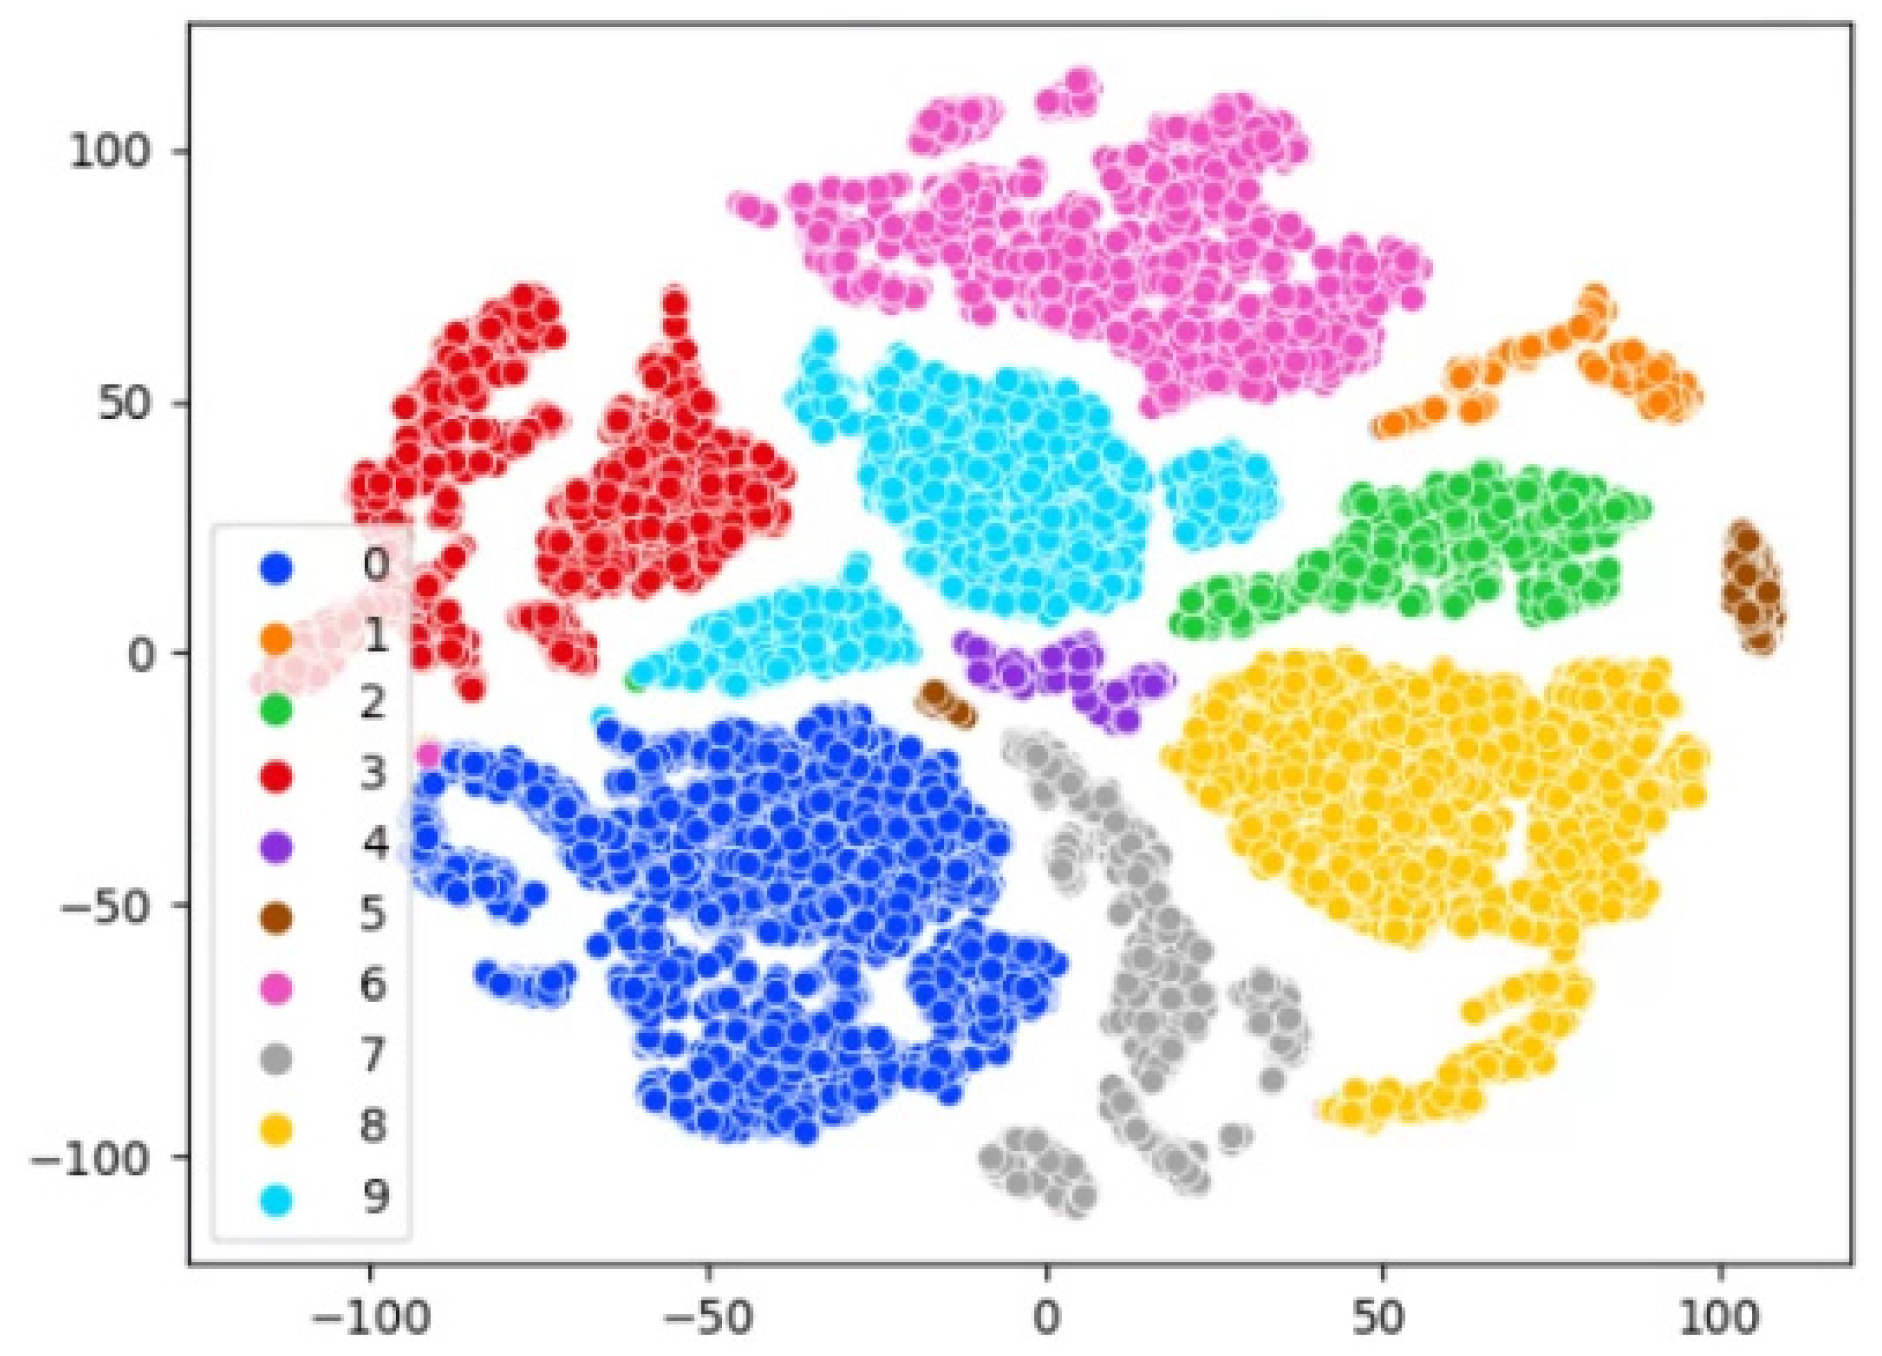
5.2. Visualization of Embedding Vectors

Two commonly used techniques for reducing high-dimensional vectors into low-dimensional vectors are Principal Component Analysis (PCA) [45] and t-distributed Stochastic Neighbor Embedding (t-SNE) [46,47]. In Maaten et al.’s work [48], a 768-dimensional vector is first reduced to a 30-dimensional vector using the PCA method and then reduced to a 2-dimensional vector using t-SNE.
In our study, the AuD DSM-5 model returns a 768-dimensional vector, and we visualize the embedding vector for the DSM-5 test data using the model’s hidden state value. The 768-dimensional vector is first reduced to a 30-dimensional vector using the PCA method and then reduced to a 2-dimensional vector through t-SNE. Figure 14 shows a 2D visualization, and it is evident that the text belonging to each label is well distinguished.

5.3. Experiment on a Virtual Conversation

We design a virtual conversation to evaluate the performance of the AuD model. The conversation follows a specific order: an introduction, the user expressing their feelings of depression, sharing their current state, and concluding the conversation. The conversation structure is presented in Table 12. We use only the user’s utterance portion of the virtual conversation for model prediction.

5.3.1. Prediction of the BWS Model

The depression intensity values predicted using the BWS model for each utterance in the virtual conversation are presented in Table 13. The model provides detailed predictions for depression intensity, and the outputs of turn 4 and turn 5 indicate that specific tokens, such as “very,” impact the intensity of depression.
Table 14 displays the prediction of depressive emotion intensity for the virtual conversation using the BWS binary model. This model predicts utterances with depressed emotions close to 0 and non-depressed emotions close to 1. However, as the model only outputs values near 0 or 1, it is difficult to obtain detailed depression intensity scores.

5.3.2. Prediction of the DSM-5 Model

The results of classifying complex depression-related emotions for the virtual conversations using the DSM-5 model are represented in Table 15. The table shows that the model performs well in organizing depression-related feelings, specifically for the utterances in turns 4, 5, and 6.
In turn 6 of the user’s utterance, the DSM-5 model detects two depression-related emotions: loss of appetite and sleep disorder. However, the model classifies them into a single label. To address this, we perform multi-label classification through modifying the output format to return all labels whose output logit value exceeds the threshold (>3), as shown in Table 16. Since the AuD model proposed in this paper is not designed explicitly for multi-label classification, it is only suitable for single-label classification tasks.

5.3.3. Attention Tokens

During a virtual conversation, we identify tokens with high weights when the user’s utterances contain three or more tokens. We then display these tokens to the user to highlight important words or phrases that may indicate the source of their depressive emotions. This approach can help the user gain insight into their emotional state and understand the factors contributing to their feelings. Table 17 shows the resulting output of this process.

6. Conclusions

6.1. Results

Our study uses data collected from two sources, Reddit and DailyDialog, and involves building two models to predict depression intensity and classify complex depressive emotions.
To create the DSM-5 dataset, we develop a set of 10 detailed depressive emotion labels based on the MDD criteria in the DSM-5, as outlined by the American Psychiatric Association. Additionally, we create a Best-Worst Scaling annotation task tool that can be used to generate a depressive emotion intensity dataset. Using this dataset, we develop two models—the AuD BWS model and the AuD DSM-5 model—which predict depressive emotion intensity and provide an attention token with a high attention score and the model output results.
We compare our model’s performance with other machine learning algorithms and deep learning models and find that DistilBERT provides fast speed and excellent prediction/classification performance. Therefore, we suggest using the DistilBERT model for real-time services where response rates are essential, such as chatbots.

6.2. Future Research Plan

Our future research plans are based on the limitations we encountered during our study. One of our primary goals is to develop a depression detection model that considers the conversation history between users and chatbots. Currently, the model is designed to receive a single sentence as input, but conversations are ongoing and continuous in real-world scenarios. Through incorporating conversation history, we aim to improve the accuracy of our depression detection model.
We also plan to explore multi-label classification for depressive emotions. People often experience multiple complex emotions simultaneously, such as depression and lethargy, but our current model is focused only on single-label classification. To address this limitation, we aim to develop a detailed depressive-emotion-related multi-label model that can independently predict and provide emotion intensity for each label simultaneously. The model will enable us to understand better the complex emotions associated with depression and provide more accurate predictions.

Author Contributions

Investigation, J.O. and M.K.; Conceptualization, J.O.; Methodology, J.O.; Data curation, J.O. and M.K.; Software, J.O.; Validation, J.O.; Visualization, J.O.; Writing-original draft preparation, J.O.; Writing-review and editing, M.K. and H.P.; Supervision, H.O.; Administration, H.O. All authors have read and agreed to the published version of the manuscript.

Funding

This work was supported by the National Research Foundation of Korea (NRF) grant funded by the Korean government (MSIT) (No. NRF-2022R1F1A1074696) and Hippo T&C.

Institutional Review Board Statement

Not applicable.

Informed Consent Statement

Not applicable.

Data Availability Statement

The data presented in this study are available from the corresponding author, upon reasonable request. The data are not publicly available due to privacy.

Conflicts of Interest

The authors declare no conflict of interest.

References

  1. A Red Light for Modern Mental Health and Stress Management Are Essential. Available online: http://www.medical-tribune.co.kr/news/articleView.html?idxno=100431 (accessed on 28 December 2022).
  2. Guangyao, S.; Jiang, J.; Liqiang, N.; Fuli, F.; Cunjun, Z.; Tianrui, H.; Tat-Seng, C.; Wenwu, Z. Depression detection via harvesting social media: A multimodal dictionary learning solution. In Proceedings of the 26th International Joint Conference on Artificial Intelligence (IJCAI'17), Sidney, Australia, 19–25 August 2017; AAAI Press: Washington, DC, USA; 2017; pp. 3838–3844. [Google Scholar]
  3. Cohan, A.; Desmet, B.; Yates, A.; Soldaini, L.; MacAvaney, S.; Goharian, N. SMHD: A Large-Scale Resource for Exploring Online Language Usage for Multiple Mental Health Conditions. In Proceedings of the 27th International Conference on Computational Linguistics, Association for Computational Linguistics, Santa Fe, NM, USA, 20–26 August 2018; pp. 1485–1497. [Google Scholar]
  4. Pratyaksh, J.; Srinivas, K.R.; Vichare, A. Depression and suicide analysis using machine learning and NLP. J. Phys. Conf. Series 2022, 2161, 1. [Google Scholar]
  5. Cha, J.; Kim, S.; Park, E. A lexicon-based approach to examine depression detection in social media: The case of Twitter and university community. Humanit. Soc. Sci. Commun. 2022, 9, 325. [Google Scholar] [CrossRef] [PubMed]
  6. Lin, L.; Chen, X.; Shen, Y.; Zhang, L. Towards Automatic Depression Detection: A BiLSTM/1D CNN-Based Model. Appl. Sci. 2020, 10, 8701. [Google Scholar] [CrossRef]
  7. Louviere, J.J.; Flynn, T.N.; Marley, A.A.J. Best-Worst Scaling: Theory, Methods and Applications; Cambridge University Press: Cambridge, MA, USA, 2015. [Google Scholar]
  8. American Psychiatric Association. Diagnostic And Statistical Manual of Mental Disorders, 5th ed.; American Psychiatric Association: Philadelphia, PA, USA, 2013. [Google Scholar]
  9. BWS Tagging Tool Github. Available online: https://github.com/Jaedong95/BWS-Tagging (accessed on 20 April 2023).
  10. Sanh, V.; Debut, L.; Chaumond, J.; Wolf, T. DistilBERT, a distilled version of BERT: Smaller, faster, cheaper and lighter. arXiv 2019, arXiv:1910.01108. [Google Scholar]
  11. Devlin, J.; Chang, M.-W.; Lee, K.; Toutanova, K. BERT: Pre-training of Deep Bidirectional Transformers for Language Understanding. In Proceedings of the 2019 Conference of the North American Chapter of the Association for Computational Linguistics: Human Language Technologies, Volume 1 (Long and Short Papers), Minneapolis, MI, USA, 2–7 June 2019; Association for Computational Linguistics: Toronto, Canada, 2019; pp. 4171–4186. [Google Scholar]
  12. Clark, K.; Luong, M.-T.; Le Quoc, V.; Christopher, D. Manning: Electra: Pre-training text encoders as discriminators rather than generators. arXiv 2020, arXiv:2003.10555. [Google Scholar]
  13. Major Depressive Disorder (Diagnosis). Available online: https://chsciowa.org/sites/chsciowa.org/files/resource/files/7_-_depression_dsm-5_checklist.pdf (accessed on 10 January 2023).
  14. Yates, A.; Cohan, A.; Goharian, N. Depression and Self-Harm Risk Assessment in Online Forums. In Proceedings of the 2017 Conference on Empirical Methods in Natural Language Processing, Copenhagen, Denmark, 9–11 September 2017; Association for Computational Linguistics: Toronto, ON, Canada, 2017; pp. 2968–2978. [Google Scholar]
  15. De Choudhury, M.; Gamon, M.; Counts, S.; Horvitz, E. Predicting Depression via Social Media. Proceed. Int. AAAI Conf. Web Soc. Media 2021, 7, 128–137. [Google Scholar] [CrossRef]
  16. Nasrullah, S.; Jalali, A. Detection of Types of Mental Illness through the Social Network Using Ensembled Deep Learning Model. Computat. Intel. Neurosci. 2022, 2022, 9404242. [Google Scholar] [CrossRef] [PubMed]
  17. Amanat, A.; Rizwan, M.; Javed, A.R.; Abdelhaq, M.; Alsaqour, R.; Pandya, S.; Uddin, M. Deep learning for depression detection from textual data. Electronics 2022, 11, 676. [Google Scholar] [CrossRef]
  18. Mohsinul, K.; Ahmed, T.; Hasan, M.B.; Laskar, M.T.R.; Joarder, T.K.; Mahmud, H.; Hasan, K. DEPTWEET: A typology for social media texts to detect depression severities. Comput. Human Behav. 2023, 139, 107503. [Google Scholar]
  19. Kim, N.H.; Kim, J.M.; Park, D.M.; Ji, S.R.; Kim, J.W. Analysis of depression in social media texts through the Patient Health Questionnaire-9 and natural language processing. Digital Health 2022, 8, 20552076221114204. [Google Scholar] [CrossRef] [PubMed]
  20. Ji, S.; Zhang, T.; Ansari, L.; Fu, J.; Tiwari, P.; Cambria, E. MentalBERT: Publicly Available Pretrained Language Models for Mental Healthcare. In Proceedings of the Thirteenth Language Resources and Evaluation Conference, Marseille, France, 20–25 June 2022; European Language Resources Association: Paris, France, 2022; pp. 7184–7190. [Google Scholar]
  21. Rodrigues Makiuchi, M.; Warnita, T.; Uto, K.; Shinoda, K. Multimodal Fusion of BERT-CNN and Gated CNN Representations for Depression Detection. In Proceedings of the 9th International on Audio/Visual Emotion Challenge and Workshop (AVEC’19), Nice, France, 21 October 2019; Association for Computing Machinery: New York, NY, USA, 2019; pp. 55–63. [Google Scholar] [CrossRef]
  22. Afef, S.; Othman, S.B.; Saoud, S.B. Hybrid CNN-SVM classifier for efficient depression detection system. In Proceedings of the 4th International Conference on Advanced Systems and Emergent Technologies (IC_ASET), Hammamet, Tunisia, 15–18 December 2020; IEEE: New York, NY, USA, 2020; pp. 229–234. [Google Scholar]
  23. Li, Y.; Su, H.; Shen, X.; Li, W.; Cao, Z.; Niu, S. DailyDialog: A Manually Labelled Multi-turn Dialogue Dataset. In Proceedings of the Eighth International Joint Conference on Natural Language Processing (Volume 1: Long Papers), Taipei, Taiwan, 27 November–1 December 2017; Asian Federation of Natural Language Processing: Taipei, Taiwan, 2017; pp. 986–995. [Google Scholar]
  24. Subreddit r/Depression. Available online: https://www.reddit.com/r/depression/ (accessed on 8 January 2023).
  25. Reddit Archive Data. Available online: https://files.pushshift.io/reddit/ (accessed on 8 January 2023).
  26. Papago API. Available online: https://developers.naver.com/docs/papago/papago-detectlangs-overview.md (accessed on 5 March 2023).
  27. Bert-Base-NER Model. Available online: https://huggingface.co/dslim/bert-base-NER (accessed on 28 February 2023).
  28. Mohammad, S.; Bravo-Marquez, F. Emotion Intensities in Tweets. In Proceedings of the 6th Joint Conference on Lexical and Computational Semantics (*SEM 2017), Vancouver, BC, Canada, 3–4 August 2017; Volume 1, pp. 65–77. [Google Scholar]
  29. Tweet Emotion Intensity Dataset Webpage. Available online: https://saifmohammad.com/WebPages/TweetEmotionIntensity-dataviz.html (accessed on 10 March 2023).
  30. Kiritchenko, S.; Saif, M.M. Capturing Reliable Fine-Grained Sentiment Associations by Crowdsourcing and Best–Worst Scaling. In Proceedings of the 2016 Conference of the North American Chapter of the Association for Computational Linguistics: Human Language Technologies, San Diego, CA, USA, 12–17 June 2017; Association for Computational Linguistics: Toronto, ON, Canada, 2016; pp. 811–817. [Google Scholar]
  31. MaxDiff Analysis: Simple Counting, Individual-Level Logit, and HB. Available online: https://sawtoothsoftware.com/resources/technical-papers/maxdiff-analysis-simple-counting-individual-level-logit-and-hb (accessed on 14 March 2023).
  32. Min-Max Scale Using Sklearn. Available online: https://scikit-learn.org/stable/modules/generated/sklearn.preprocessing.MinMaxScaler.html (accessed on 14 March 2023).
  33. How to Scale into the 0–1 Range Using Min-Max Normalization. Available online: https://androidkt.com/how-to-scale-data-to-range-using-minmax-normalization/ (accessed on 19 February 2023).
  34. Mikolov, T.; Chen, K.; Corrado, G.; Dean, J. Efficient estimation of word representations in vector space. arXiv 2013, arXiv:1301.3781. [Google Scholar]
  35. Clark, K.; Khandelwal, U.; Levy, O.; Manning. C, D. What Does BERT Look at? An Analysis of BERT’s Attention. In Proceedings of the 2019 ACL Workshop BlackboxNLP: Analyzing and Interpreting Neural Networks for NLP, Florence, Italy, 1 August 2019; Volume 1, pp. 276–286. [Google Scholar]
  36. About BERT. Available online: https://heekangpark.github.io/nlp/huggingface-bert (accessed on 22 February 2023).
  37. BertViz Github. Available online: https://github.com/jessevig/bertviz (accessed on 24 February 2023).
  38. He, P.; Liu, X.; Gao, J.; Chen, W. Deberta: Decoding-enhanced bert with disentangled attention. arXiv 2020, arXiv:2006.03654. [Google Scholar]
  39. Liu, Y.; Ott, M.; Goyal, N.; Du, J.; Joshi, M.; Chen, D.; Levy, O.; Lewis, M.; Zettlemoyer, L.; Stoyanov, V. Roberta: A robustly optimized bert pretraining approach. arXiv 2019, arXiv:1907.11692. [Google Scholar]
  40. Mariette, A.; Khanna, R.; Awad, M.; Khanna, R. Support vector regression. In Efficient Learning Machines: Theories, Concepts, and Applications for Engineers and System Designers; Springer: Berlin/Heidelberg, Germany, 2015; pp. 67–80. [Google Scholar]
  41. Peterson, L.E. K-nearest neighbor. Scholarpedia 2009, 4, 1883. [Google Scholar] [CrossRef]
  42. Leung, K.M. Naive Bayesian Classifier; Polytechnic University Department of Computer Science/Finance and Risk Engineering: New York, NY, USA, 2007; pp. 123–156. [Google Scholar]
  43. Breiman, L. Random Forests. Mach. Learn. 2001, 45, 5–32. [Google Scholar] [CrossRef]
  44. Siino, M.; Di Nuovo, E.; Tinnirello, I.; La Cascia, M. Fake News Spreaders Detection: Sometimes Attention Is Not All You Need. Information 2022, 13, 426. [Google Scholar] [CrossRef]
  45. Abdi, H.; Williams, L.J. Principal component analysis. Wiley Interdiscip. Rev. Comput. Stat. 2010, 2, 433–459. [Google Scholar] [CrossRef]
  46. About t-SNE. Available online: https://lvdmaaten.github.io/tsne/ (accessed on 24 April 2023).
  47. PCA vs. t-SNE. Available online: https://skyeong.net/284 (accessed on 25 December 2022).
  48. Maaten, L.V.D.; Hinton, G. Visualizing Data using t-SNE. J. Mach. Learn. Res. 2008, 9, 2579–2605. [Google Scholar]
Figure 1. Distribution of the Reddit data token length before (left) and after (right) data preprocessing.
Applsci 13 06223 g001
Figure 2. Distribution of the DailyDialog data token length before (left) and after (right) data preprocessing.
Applsci 13 06223 g002
Figure 3. Box plot of each dataset’s token distribution after data curation.
Applsci 13 06223 g003
Figure 4. Architecture of Best-Worst Scaling data.
Applsci 13 06223 g004
Figure 5. Data construction for Best-Worst Scaling.
Applsci 13 06223 g005
Figure 6. Main page of the Best-Worst Scaling tagging tool.
Applsci 13 06223 g006
Figure 7. Annotation work with Best-Worst Scaling tagging tool.
Applsci 13 06223 g007
Figure 8. Construction of the DSM-5 dataset.
Applsci 13 06223 g008
Figure 9. Overall model architecture.
Applsci 13 06223 g009
Figure 10. AuD BWS model’s training log.
Applsci 13 06223 g010
Figure 11. BWS binary model’s training log.
Applsci 13 06223 g011
Figure 12. AuD DSM-5 model’s training log.
Applsci 13 06223 g012
Figure 13. Visualization of attention weights using BertViz.
Applsci 13 06223 g013
Figure 14. Visualization of the DSM-5 test data’s embedding vector.
Applsci 13 06223 g014
Table 1. Sample of the BWS dataset.
Sample TextScore (0~1)
I have tried to ignore my feelings but I really am depressed0.875
I need to realize I am unhappy for no reason0.6875
I don’t feel sad I just don’t really feel0.0625
They want to change it because it’s too sour0
Table 2. Labels for major depressive disorder episodes.
CriteriaLabel
A1depressed
A2lethargic
A3appetite/weight problem
A4sleep disorder
A5emotional instability
A6fatigue
A7excessive guilt/worthlessness
A8cognitive problems
A9suicidal thoughts
Etcdaily (not depressed)
Table 3. Sample of the DSM-5 dataset.
Sample TextLabel
I am not happy, I always feel saddepressed
I lost my appetite, I haven’t eaten anything but two hard boil eggsappetite/weight problem
It made me insane with insomniasleep disorder
I am so fatigued and tired of waiting to be happyfatigue
One day I am going to die by my own willsuicidal thoughts
Table 4. Sample of the BWS score data.
TextTotalStrongestWeakest
I need to realize I am unhappy for no reason830
I want to be alone but I am lonely840
I am depressed I hate myself880
Do you have lessons with me?808
Table 5. Related words to DSM-5.
CriteriaBase WordSimilar Word
A1depresseddeppressed, sad, unhappy, lonely, unwell, moody, distressed
A2lethargicfatigued, sluggish, groggy, unmotivated, listless, despondent, demotivated
A3appetite, weightapetite, lbs, kg, metabolism, apatite
A4insomnia, hypersomnia, sleepmigraines, bruxism, nausea, ibs, tinnitus, sleeplessness, diarrhea, narcolepsy, sleepiness, drowsniess, disturbances, sleeping, bed, asleep
A5agitation, retardationirritability, restlessness, nervousness, vertigo, impairment, instability psychomotor, unwellness
A6fatiguetiredness
A7worthless, guiltuseless, pathetic, unlovable, unloveable, inadequate, helpless, miserable, talentless, hopeless, subhuman, shame, resentment, selfhatred, jealously, selfoathing, selfhate, frustration
A8concentrate, indecisivefocus, concentrate, concentrating, focusing, refocus, focused, forgetful, picky, forgetful, pessimistic
A9suicidal, diesucidal, homicidal, sucidial, suicial, suicidial, selfharm, scuicidal, disappear, kill, starve, cease, dissappear
Table 6. Data not related to depressive episodes.
CriteriaText
A1a fellow depressed stranger
A3not some overweight guy who has not been laid
A7being anti-social does not make you worthless
Table 7. DSM-5 data filters.
CriteriaFilter 1Filter 2
A1am, is, are, feelnot, do(es)n’t feel
A2am, is, are, feelnot, do(es)n’t feel
A3loss, lost, gain, surge-
A4too much, not much, can’t-
A5-not, do(es)n’t feel
A6am, is, are, feelnot, do(es)n’t feel
A7am, is, are, feelnot, do(es)n’t feel
A8(can’t), am, is, are(can), not, do(es)n’t feel
A9(want, go, will, try, have) + tonot, do(es)n’t + have, want, go, will, try + to
Table 8. Data distribution of DSM-5.
A1A2A3A4A5
A6A7A8A9Daily
DSM-5152,7343041898417,7602217
186599,98823,15437,40981,290
Table 9. Number of instances in each dataset.
TrainValTestAll
BWS data11521283201600
DSM-5 data88,87422,21927,774138,867
Table 10. Performance evaluation of machine learning and deep learning algorithms.
ModelsRegressionClassification
RMSER2PrecisionRecallSpecificityF1
Machine LearningSupport Vector Regressor [40]3.9440.3518----
K-NN [41] Regression3.91810.3603----
Naïve-Bayes [42]--0.91560.5730.97630.8089
K-NN Classification--0.85040.65060.96990.7483
Random Forest [43]--0.95860.87950.99270.9396
Deep LearningDNN3.44720.50480.97180.96020.99560.9631
DNN + Bi-LSTM2.590.720.98930.98740.99830.9863
CNN-1D
[44]
3.76230.41010.97230.96420.99630.969
BERT2.05570.82390.99840.99840.99980.9987
DeBERTa2.30200.77920.99830.99770.99980.9988
RoBERTa2.65580.70610.99740.9970.99970.9981
ELECTRA2.51730.73600.99760.99830.99980.9983
DistilBERT
(ours)
2.16010.80560.99890.99880.99980.999
Table 11. Inference speed evaluation of each Language Model.
BERTDeBERTaRoBERTaELECTRADistilBERT (Ours)
Inference Time (s)62.765(s)110.813(s)60.226(s)60.561(s)29.348(s)
Table 12. Virtual conversation.
TurnSpeakerText
1UserHey
1ChatbotHello, nice to meet you
2UserWho are you?
2ChatbotI am a psychological counseling chatbot.
3UserAh-huh
3ChatbotHow are you?
4UserI am very depressed today
4ChatbotWhat is the matter?
5UserI do not know why but just depressed
5ChatbotWhen you are depressed, you have to move
6UserAlso I lost 30 pounds and I feel lethargic
6ChatbotThat sounds too bad
7UserAnyway, thanks for listening
7ChatbotYes, see you next time
Table 13. AuD BWS model’s intensity prediction.
TurnTextIntensity
1Hey0.1015
2Who are you?0.0346
3Ah-huh0.0195
4I am very depressed today12.7464
5I do not know why but just depressed8.6879
6Also I lost 30 pounds and I feel lethargic8.6295
7Anyway, thanks for listening0.0038
Table 14. BWS binary model’s intensity prediction.
TurnTextIntensity
1Hey1.0265
2Who are you?1.0167
3Ah-huh1.0157
4I am very depressed today0.0003
5I do not know why but just depressed0.0012
6Also I lost 30 pounds and I feel lethargic0.0616
7Anyway, thanks for listening1.0158
Table 15. Label classification of the AuD DSM-5 model.
TurnTextLabel
1Heydaily
2Who are you?daily
3Ah-huhdaily
4I am very depressed todaydepressed
5I do not know why but just depresseddepressed
6Also I lost 30 pounds and I feel lethargiclethargic
7Anyway, thanks for listeningdaily
Table 16. Multi-label Classification of the AuD DSM-5.
TurnTextLabel
1Heydaily
2Who are you?daily
3Ah-huhdaily
4I am very depressed todaydepressed
5I do not know why but just depresseddepressed
6Also I lost 30 pounds and I feel lethargiclethargic, appetite/weight problem
7Anyway, thanks for listeningdaily
Table 17. Tokens with high attention weights.
TurnTextAttention Tokens
1Hey-
2Who are you?‘?’, ‘you’
3Ah-huh-
4I am very depressed today‘depressed’, ‘i’
5I do not know why but just depressed‘depressed’, ‘i’, ‘but’
6Also I lost 30 pounds and I feel lethargic‘##har’, ‘##gic’, ‘let’
7Anyway, thanks for listening‘listening’, ‘thanks’
Disclaimer/Publisher’s Note: The statements, opinions and data contained in all publications are solely those of the individual author(s) and contributor(s) and not of MDPI and/or the editor(s). MDPI and/or the editor(s) disclaim responsibility for any injury to people or property resulting from any ideas, methods, instructions or products referred to in the content.

