Article

Assessment of DPPC Liposome Disruption by Embedded Tocopheryl Malonate

by
Grażyna Neunert
1,*,
Jolanta Tomaszewska-Gras
2,
Marlena Gauza-Włodarczyk
3,
Stanislaw Witkowski
4 and
Krzysztof Polewski
1
1
Department of Physics and Biophysics, Faculty of Food Science and Nutrition, Poznan University of Life Sciences, Wojska Polskiego 38/42, 60-637 Poznań, Poland
2
Department of Food Safety and Quality Management, Faculty of Food Science and Nutrition, Poznan University of Life Sciences, Wojska Polskiego 31/33, 60-624 Poznań, Poland
3
Department of Biophysics, Faculty of Medical Sciences, Poznan University of Medical Sciences, Grunwaldzka 6, 60-780 Poznań, Poland
4
Faculty of Chemistry, University of Bialystok, Ciolkowskiego 1K, 15-245 Bialystok, Poland
*
Author to whom correspondence should be addressed.
Appl. Sci. 2023, 13(10), 6219; https://doi.org/10.3390/app13106219
Submission received: 20 April 2023 / Revised: 11 May 2023 / Accepted: 16 May 2023 / Published: 19 May 2023
(This article belongs to the Section Food Science and Technology)

Abstract

:
In this study, the effect of α-tocopheryl malonate (TM) on physical and structural properties of DPPC liposomes was investigated using ANS fluorescence, DPH, and TMA–DPH anisotropy fluorescence and differential scanning calorimetry (DSC) methods. The presence of embedded TM in DPPC liposomes caused alteration in its phase transition temperatures, structural order, dynamics, and hydration of head groups increasingly with growing TM concentration. The ANS fluorescence results demonstrated that increasing TM presence in the DPPC gel phase due to interrupted membrane structure caused the formation of new binding sites. Temperature investigations in the range of 20 °C to 60 °C showed that increasing temperature rises ANS fluorescence which reaches local and global maxima at 36 °C and 42 °C, respectively. The rising TM concentration at the phase transition temperature of DPPC led to the lowering of ANS fluorescence, indicating a decreased binding of ANS. Simultaneously, during heating, a roughly 10-nm shift of ANS emission maximum was observed. The results indicated that in the fluid phase, the observed quenching appears as a result of increasing accessibility of water molecules into ANS in this region. The DPH results indicated that in the gel phase presence of TM introduced disorder in the hydrophobic acyl chain region led to its fluidization. The TMA–DPH results indicated an increasing disorder in the interface region and an increasing hydration of head group atoms at the surface of the membrane. The increasing concentration of TM results in the formation of multicomponent DSC traces, suggesting the formation of another structural phase. The applied methods proved that the incorporation of TM into DPPC membrane results in the interaction of malonate moiety with DPPC head group atoms in the interphase layer and induces the interruption in the membrane packing order, leading to its structural changes. The presented results show that TM presence could regulate the membrane properties, thus it may indicate one of the possible mechanisms responsible for the effective disruption of cell membranes by TM. The knowledge of molecular mechanism how TM interacts with the membrane will help to elucidate its possible pharmacological activity.

1. Introduction

α-Tocopherol (Toc) is commonly regarded as a strong lipophilic antioxidant protecting phospholipid membrane in cells against destructive peroxidation. Toc also plays numerous nonantioxidant biological functions in cells [1,2]. These effects are a result of specific interactions of Toc with membranes, the main components of the cells [3]. These in turn depend on the type of phospholipids and the concentration of Toc [4,5]. For a small amount of Toc < 4 mol%, no significant change is observed in the structure of the membrane [6]. Some reports show that Toc influences the phase behaviour of phospholipids in a similar way as cholesterol [7]. Due to Toc limitations in solubility and bioavailability, some tocopherol derivatives containing the oxalate, malonate, and succinate moieties have been formulated based on their antioxidant properties, and it appeared they exhibit biological functions [8,9]. The malonic acid ester of Toc, α-tocopheryl malonate (TM), belongs to Toc derivatives that cause the apoptosis of cancer cells; such biomimetic actions of malonate have been recognized by Kogure [8,9]. TM action is very close to that detected for Toc succinate, which, in preclinical studies performed on animals, inhibited tumor growth (breast, bladder, prostate, and neck) [9,10,11,12,13].
Liposomes are spherical-shaped vesicles that are composed of one or more phospholipid bilayer, which closely resembles the structure of cell membranes. Thereby, they are an ideal model of a biological membrane used in the studies on the influence of biologically active molecules on its fluidity, stability, or permeability. Due to their amphiphilic properties and capacity to encapsulate hydrophilic drugs in the vesicle interior or lipophilic molecules inside of the bilayer, liposomes are also permitted to be used as drug-delivery systems [14,15,16]. Depending on the temperature, water content, and the type of lipid, lipid bilayers can exist in different lamellar forms, like crystal, gel, or the liquid–crystal phase. The structural transition between the two last forms occurs over a melting transition temperature (Tm), leading to the changes in the membrane properties, like fluidity or permeability. An influence on the membrane transformation can also have different additives, which are incorporated inside the bilayer. A number of investigations have been completed with many different methods have been used to follow those transitions [17,18], such as differential scanning calorimetry (DSC) [19], fluorescence, and anisotropy methods [8,20,21].
The parameters derived from DSC analysis include the onset temperature of the transition (Tp), the peak maximum of the thermogram corelated to Tm, the width of the main peak at the half-peak height (ΔT1/2), the enthalpy of transition (ΔHm), and the cooperativity unit (CU) [22,23]. Lai showed that changes in DSC parameters can be applied to characterize interactions between the succinate moiety and phospholipids [24].
1-anilino-8-naphtalene sulphonate (ANS) is a fluorescence probe commonly used to test the hydrophobicity of proteins [12,25]. The fluorescence of ANS is very sensitive to the microenvironment and can report conformational changes in the polar head group region of phospholipids induced by ligands. Thus, ANS has also been applied in many studies of the structural changes in liposomes and membranes [26,27,28,29,30,31,32,33]. Similarly, two other fluorescence probes, 1,6-diphenyl-1,3,5-hexatriene (DPH) and its trimethylammonium derivative (TMA–DPH), are used extensively to examine structural and dynamic properties of lipid bilayers. A steady-state fluorescence anisotropy of DPH indicates lipid order or the viscosity of the acyl chain bilayer interior, which is also called fluidity [34,35,36,37]. Due to the cationic moiety of TMA–DPH, which acts as an anchor on the membrane surface, it reports structural changes in the interphase region between glycerol and ionic moieties in the region with a dielectric constant of ε ~ 60 [38].
With the present study, we address the effect of TM, a Toc derivative that is characterized by a long malonate tail moiety at 6 position of the chromanol ring, on DPPC liposomes. To add information about the molecular mechanisms underlying the strong cytotoxic potential of this ester derivative on tumour cells [9], the fluorescence probes ANS and DPH, as well as the TMA–DPH and DSC methods, were applied. By analyzing the intensity, emission wavelength, and fluorescence anisotropy of applied fluorophores, which are the parameters that are sensitive to membrane ordering and hydrophobicity, we propose a possible mechanism to explain the interactions between TM and DPPC membranes.

2. Materials and Methods

2.1. Chemicals

Chemicals include 1,2-Dipalmitoyl-sn-glycero-3-phosphocholine (DPPC), 1-anilino-8-naphtalene sulphonate (ANS), 1,6-diphenyl-1,3,5-hexatriene (DPH), 1-(4-trimethylammoniumphenyl)-6-phenyl-1,3,5-hexatriene p-toluenesulfonate (TMA-DPH), and chloroform (spectroscopic grade), all reagents from SIGMA Chemical Co. (SIGMA Chemical Corp., St. Louis, MO, USA). The synthesis procedures of DL-α-tocopherol (Toc) and DL-α-Tocopheryl malonate (TM) were given in [39,40]. The chemical structures of the tocopherols are shown in Figure 1. Double deionised water was obtained using a MicroPure Water System (TKA, Niederelbert, Germany).

2.2. Preparation of Liposomes

The methodology of liposome formation was similar as given previously [21]. In short, after dissolution of dry DPPC with weighted amounts of Toc or TM in chloroform, the obtained suspensions under rotary evaporator formed DPPC dry film, which was hydrated with deionised water. To obtain liposomes, all samples were extruded 11 times through a 100-nm pore polycarbonate filter using a LiposoFast Basic LF-1 extruder (Avestin, Mannheim, Germany). The concentration of lipids during fluorescence measurements was 0.08 mg/mL, with liposome mean size of 100 nm, which did not change significantly in the present of tocopherols as obtained from DLS measurements using a Zetasizer Nano (Malvern Instruments, Worcestershire, UK) at 20 °C at an angle of 90°. A 2 mg/mL phospholipid concentration was used during DSC measurements. The samples were stored at 0–4 °C for at least 12 h before the measurements.
The probes of ANS, DPH, or TMA–DPH were added to suspension at such concentrations to maintain lipid/fluorescent probe ratio in the range at least of 100:1 or less. Such concentration relations are much lower compared to the binding of ANS, DPH, or TMA–DPH with DPPC. In the case of DPH and TMA–DPH, to assure their binding with liposomes, the samples were incubated at least 30 min before measurements. Our preliminary results confirmed that bound probes caused negligible interference to the measured spectroscopic properties and DSC traces of DPPC. Analogous conclusions regarding binding of fluorescent probes with DPPC have been published by others [33].

2.3. Fluorescence Measurements of ANS

The steady-state fluorescence spectra of ANS excited at 380 nm wavelength were measured with Shimadzu RF 5001PC fluorimeter (Shimadzu Corp., Kyoto, Japan) in a 1 cm × 1 cm quartz cuvette. Temperature of the sample was changing in the range of 20 °C to 60 °C using temperature controller. Temperature resolution for the data readout was taken every 2 °C.

2.4. Steady-State Fluorescence Anisotropy of DPH and TMA–DPH

The exact procedure of the anisotropy measurements of DPH and TMA–DPH was thoroughly described in our previous articles [23]. Steady-state fluorescence anisotropy of DPH and TMA–DPH in DPPC liposomes (excited at 360 nm and emission set at 430 nm) were obtained using a PerkinElmer LS555 (Perkin Elmer Corp., Norwalk, CT, USA).
The obtained data of anisotropy (r) versus temperature (T) were fitted using a formula given by Equation (1):
r T = r g r c 1 + exp T T m n
where: T is the actual temperature; Tm is the temperature of the main phase transition; rg and rc are the limiting anisotropy values in the gel and liquid-crystalline state, respectively; and n—the slope of the fitted curve, which is correlated to the transition rate.

2.5. Differential Scanning Calorimetry (DSC)

The differential scanning calorimetry (DSC) measurements were performed with a DSC 7 (Perkin Elmer Corp., Norwalk, CT, USA) equipped with an Intracooler II and Pyris Software 10.1. The details of the performance of these experiments have been published previously [23].

2.6. Fitting Procedures

All graphical presentations, calculations, and data statistics were arranged using the Origin program (OriginLab Corp., Northampton, MA, USA, ver. 8.5). The experiments were carried out at least in triplicate.

3. Results

3.1. The ANS Emission in DPPC Liposomes

The spectroscopic properties of ANS change with the polarity and viscosity according to its location [41]. The ANS fluorescence emission spectrum in DPPC liposomes show an emission maximum at about 477 nm. That position of the fluorescence maximum is characteristic for ANS when this fluorescence probe is located in hydrophobic surroundings. However, the fluorescence intensity (FI) and the position of the emission maximum (λmax) changes with the temperature and additionally depends on TM concentration. Thus, FI and λmax, which are related to the ANS microenvironment, may serve as sensors to monitor DPPC structural changes caused by its interactions with a TM.

3.1.1. Kinetics of ANS Adsorption on DPPC

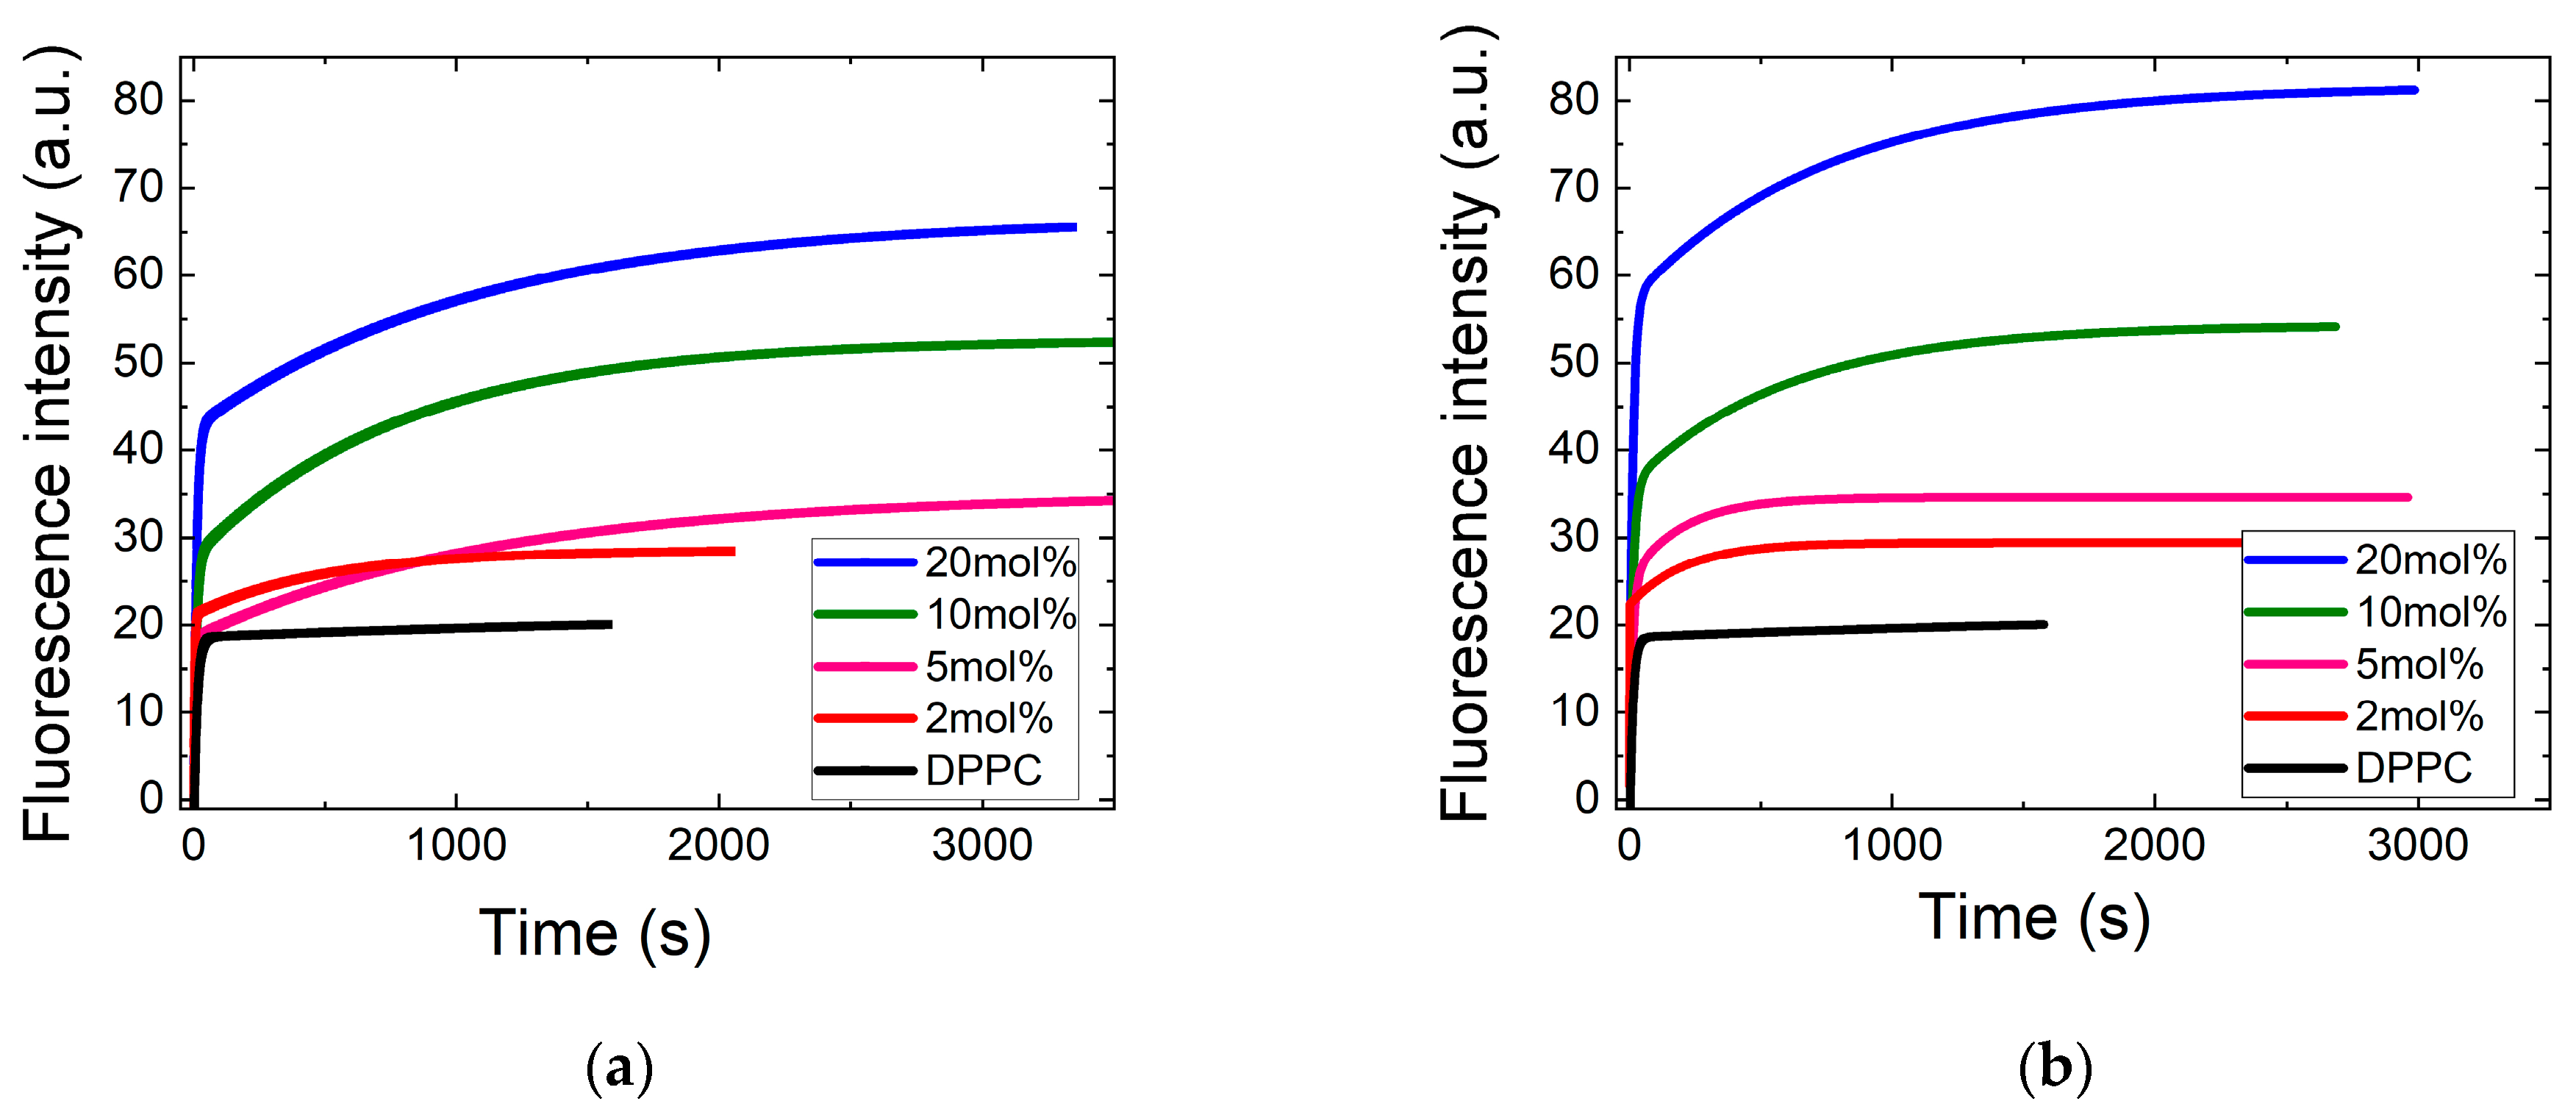
The time-dependent Fl changes of ANS during its interaction with DPPC liposomes in the gel phase without and with TM or Toc at different concentrations are presented on Figure 2. In the case of pure DPPC adding of ANS to the membranes, this causes the rapid increase of Fl, which occurs almost instantly and then remains at a constant level. When tocopherols are embedded into DPPC liposomes, the kinetics of ANS fluorescence changes to the biphasic character. In the presence of Toc or TM, we first observe sharp FI raising (fast component) and then slowly increasing component, leading to its plateau. FI of first fast component grows proportionally with increasing tocopherol concentration, whereas the slower component reaches its plateau at longer times with increasing tocopherols concentrations. A similar behavior of ANS kinetics was observed for the liposome systems containing other tocopherol derivatives [21,42].
The recorded kinetics were fitted to two models: a double exponential component and bidose response model. In both models, the data were well-fitted to two components, which suggests the existence of two independent binding sites for ANS in DPPC. The first sharp component with obtained times on the order of a tenth of a second is related to the binding of ANS molecules to the available sites on the outer liposome leaflet; it is a diffusion-controlled process. The second, slower component, with the time in the range from 200 to 800 s, describes the motion process of ANS molecules deeper into the inner leaflets of the bilayer connected with the disruption of the membrane structure due to the presence of tocopherols molecules. Similar assumptions regarding the presence of two of the ANS-binding mechanisms to liposomes have also been reported by other authors [33,43]. In both stages, the observed increasing fluorescence intensity with a rising amount of TM or Toc reflects the formation of more binding sites, which depend on the tocopherols concentration. However, the same amount of ANS added to the liposome suspension with TM exhibits lower FI compared to Toc, indicating that fewer ANS molecules bind to the liposomes with Toc. It is correlated with limited access of ANS molecules to the DPPC structure because of bigger structural changes in DPPC caused by embedded TM.

3.1.2. Hydrophobicity and Water Permeability Evaluation in DPPC Using ANS Fluorescence

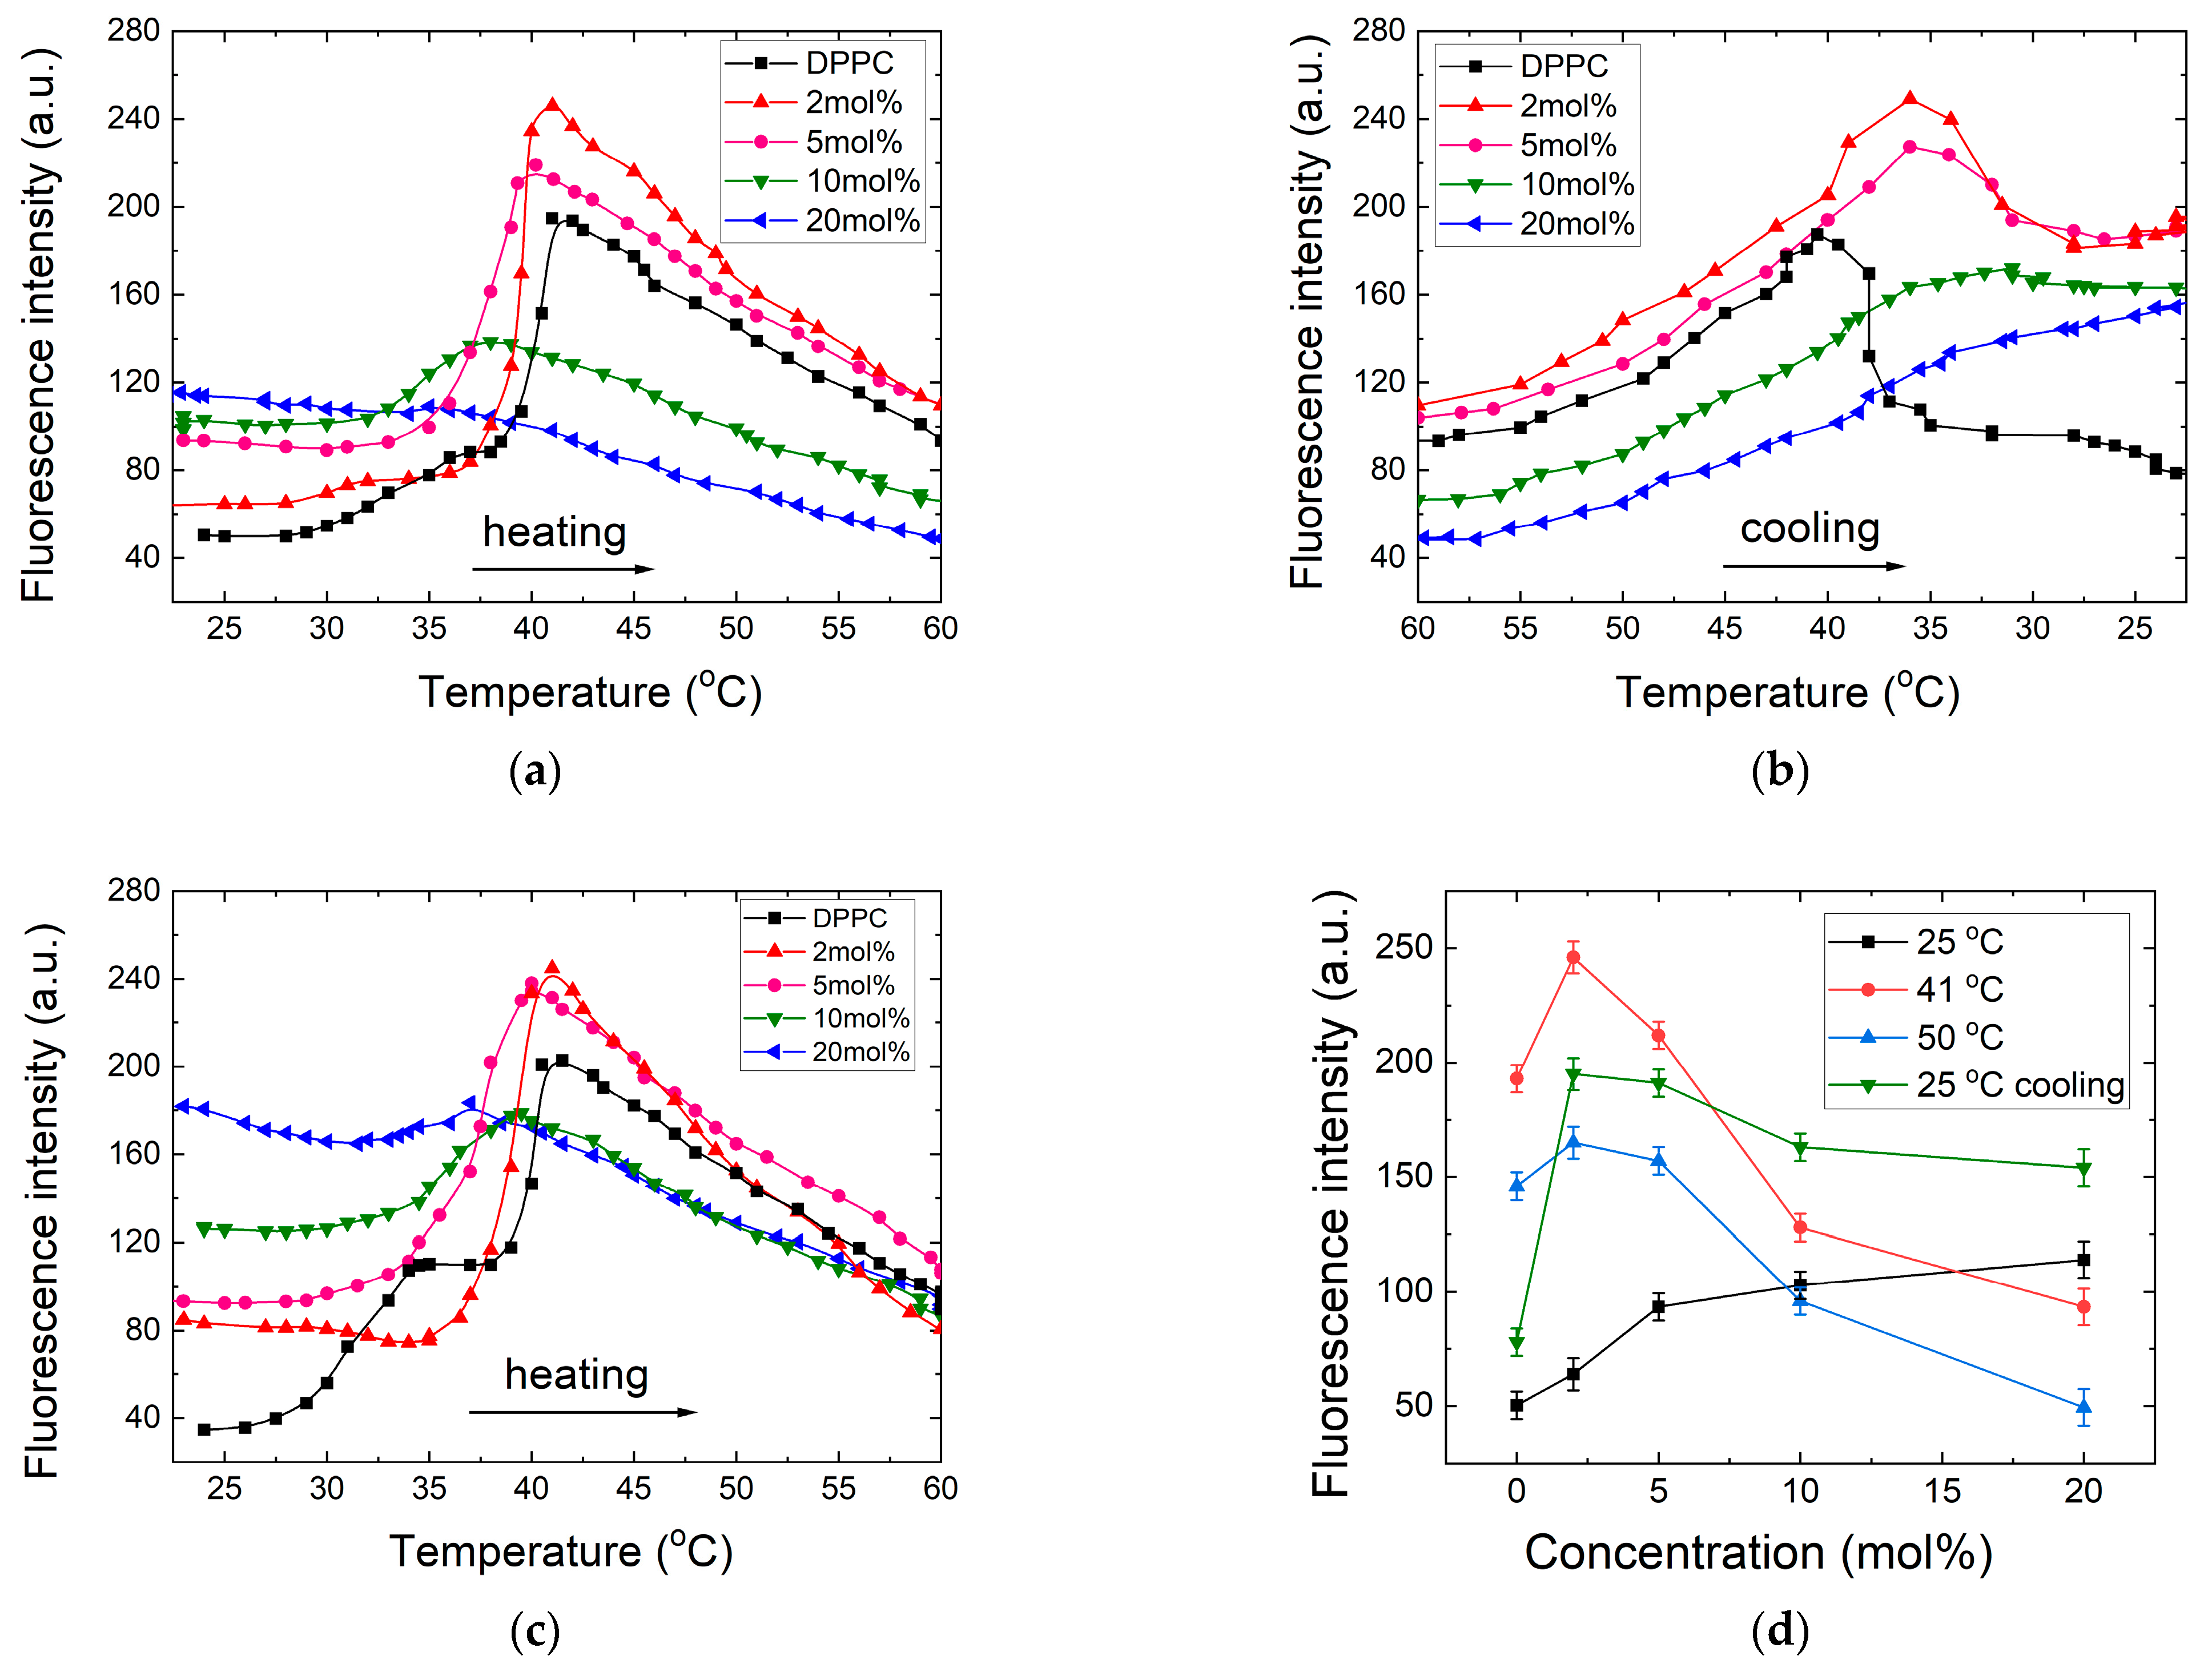
The temperature dependencies of Fl of ANS during heating and cooling of DPPC liposomes at different amounts of TM are presented in Figure 3a,b. As a reference to the results obtained for TM, we performed the same experiments for its parent compound the Toc; the results for the heating cycles are presented in Figure 3c. In pure DPPC during heating, we observe two maxima at 36 ºC and at 42 ºC, at temperatures that are characteristic for DPPC liposomes and assigned as the pretransition Tp and the main phase transition Tm temperatures, respectively. The biggest value of permeation of ANS occurs at temperatures close to the phase transitions and is similar to previously published results [43,44]. After reaching the maximum at Tm, a monotonically decreasing FI up to 60 °C was obtained.
In the gel phase, the presence of an increasing concentration of TM increases the Fl value and results in a gradual disappearance of the pretransition temperature. Additionally, increasing the presence of TM widened the trace, flattened the curves, and simultaneously shifted the positions of the Fl main maximum. At the highest concentration of TM, the curve was flattened with a shape incomparable to lower concentrations. The similar observations on the traces of Toc were noted. Increasing temperatures above the main phase transition decrease the intensity with similar slopes for TM and Toc samples, which may indicate that one mechanism is involved in the observed process. We suggest that the observed quenching is due to the increasing number of water molecules in the inner leaflet of the liposome modified by embedded TM. With an increasing number of TM or Toc molecules, for both tocopherols, a similar decrease of the temperature at which the Fl curve achieves a maximum was observed. Since Tm is related to the structure of acyl chains, the presence of this same chromanol ring and phytol chain induced similar results. Additionally, it confirms that malonate moiety attached at 6 position of the chromanol ring does not influence this parameter. In the gel phase at 23 °C, Fl increases by nearly 3-fold compared to pure DPPC, whereas at main phase transition at 42 °C, a FI increase is only 25% of the highest intensity observed for 2 mol% compared to DPPC. At increasing TM concentrations, FI lowers significantly, indicating its disruptive role.
The plots of the FI during the cooling of the samples from 60 °C to 20 °C for TM are given in Figure 3b. The results reveal that the traces observed during cooling differ, including the shape and the positions of the maxima are shifted to lower temperatures. We assume that the presence of TM induces structural changes depend on the homogeneity of the liposome and forms the defects in the regular DPPC structure, which decreased the cooperativity of the transition, thus lowering its phase transition temperature. We also notice that, after cooling, the FIs in the gel phase were 2- or 3-fold higher compared to those observed at the beginning of the heating (Figure 3a,b,d). These results may indicate that some of the ANS molecules were bound inside the modified liposome layer. The formation of the metastable rippled gel phase during cooling has been reported [33,45].
In our studies with ANS fluorescence at increasing concentrations of TM and Toc, in DPPC during the course of heating and cooling, we observe that λmax changes; these dependencies are given in Figure 4a–c. In the DPPC gel phase at 25 °C, the ANS fluorescence maximum is 477 nm, indicating that a molecule is located in the interphase aqueous environment. The emission maximum is shifting to a shorter wavelength as the temperature is rising. At 41 °C (corresponding to Tm), it reaches the lowest value of 471 nm, indicating that ANS molecules experience a more hydrophobic environment.
In the gel phase, with an increasing content of TM or Toc, a λmax shifts from 477 nm to 466 nm, indicating that ANS molecules experience progressively increasing hydrophobic surroundings. A shift of λmax to longer wavelengths is observed with growing temperature for all TM concentrations, indicating that ANS molecules are surrounded by water molecules. We may notice that a pure DPPC trace exhibits some characteristic features within the presence of pretransition and the temperature of the main phase transition, whereas the shapes of plots with added TM are different.
A cooling of the samples (Figure 4b) gives almost symmetrical plots relative to heating. However, the curves are smooth and monotonically decreasing toward lower temperatures, except that of DPPC, which shows a maximum of a 5-nm downshift. However, one may notice that in the gel phase and TM presence, the λmax was shifted to shorter wavelengths, which indicates an emission from the hydrophobic part of the liposome.

3.2. Fluidity Evaluation—DPH and TMA-DPH Fluorescence Anisotropy

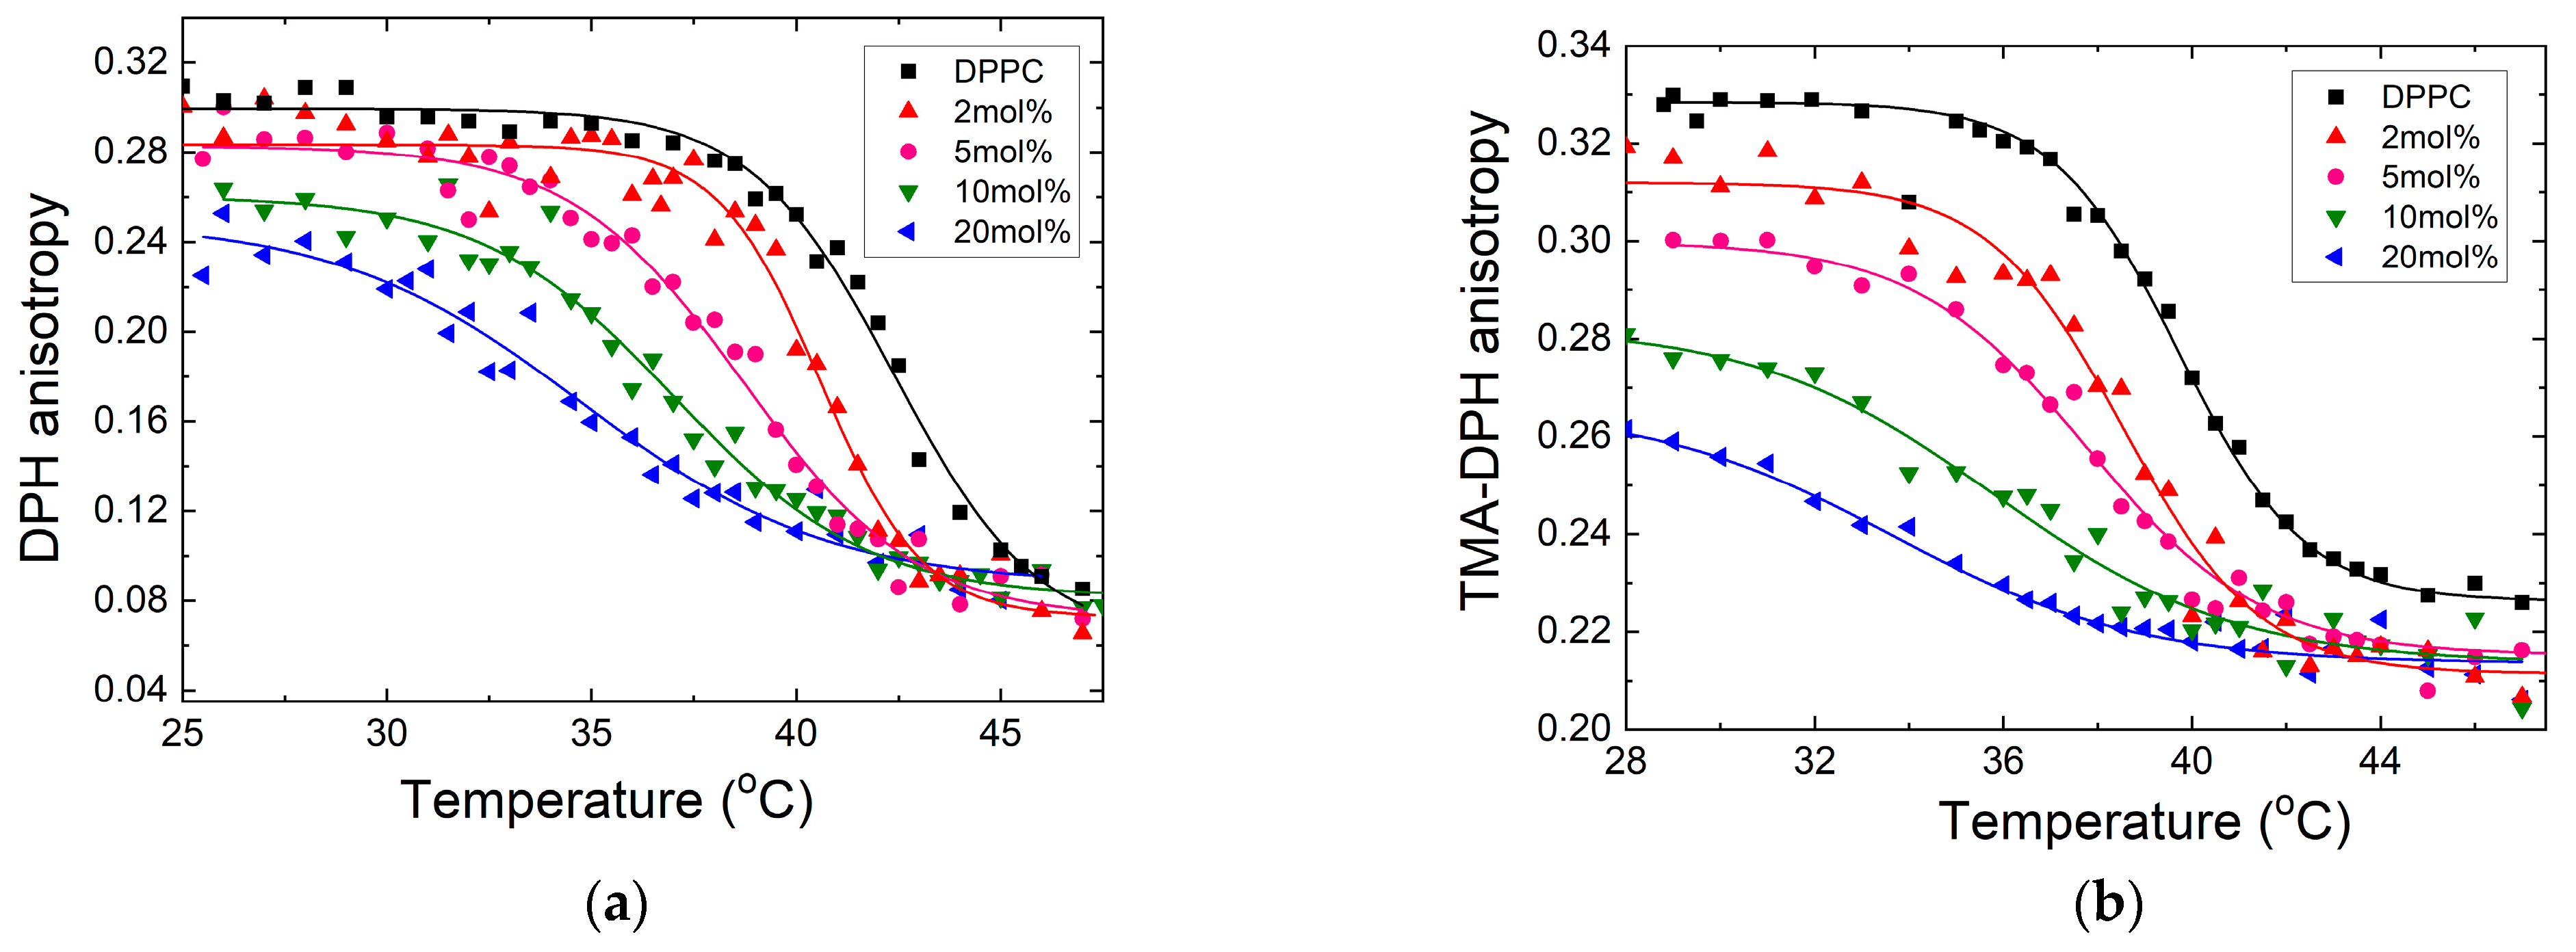
Figure 5a displays the effects of temperature changes with an increasing concentration of TM in the DPPC liposomes on the fluorescence anisotropy of DPH. The plotted results show a sigmoidal shape with a decreasing slope with increasing TM concentration. With rising temperature, the anisotropy decreases, reaching a value of 0.06. When temperature are above 45 °C, it remains constant. Increasing TM concentrations flattened the plots’ shapes and simultaneously shifted the onset of the main phase transition, as well as Tm from 41.5 °C to lower temperatures. The changes in the shape and slope of the traces observed with increasing temperature and concentrations are indicators of membrane fluidization. This shows that doping with TM lowers Tm, and induces different membrane organization at higher concentrations.
In the case of TMA–DPH, the temperature profiles of Figure 5b are similar to those observed for DPH. However, the range of observed anisotropy changes is much smaller than for DPH. In the gel phase, the amplitude of anisotropy decrease is similar for both dyes. This suggests that the presence of TM also perturbs the structure of the interphase region of the DPPC membrane concurrently with changes induced in the acyl chain region as measured by DPH. With temperature above Tm, the anisotropy decreases to a value of 0.22, indicating a loosening in the hydrophilic region of the membrane. However, it still remains structurally ordered.
The DPH anisotropy profile reflects the modifications in the ordered molecular structure of the hydrophobic part of the bilayer induced by embedded TM in the DPPC. TMA–DPH, which is anchored close to the membrane surface, probes the glycerol backbone and upper part of acyl chains, thus reflecting membrane surface fluidity and membrane density [46]. When the molecular motion of DPH is constrained, it leads to high anisotropy values, which occur in the gel phase. Increasing the rotational motion of acyl chains with rising temperature gives more motion freedom to DPH, which results in lower anisotropy. In the gel phase, its anisotropy responds to increasing membrane disordering due to embedded TM molecules, observed as anisotropy lowering. The fact that, in a liquid crystalline state, the TMA–DPH shows a high value of anisotropy may indicate that, despite an observed loosening in the glycerol region of the membrane, the electrostatic interactions between head molecules and malonate moiety still preserve an ordered structure.
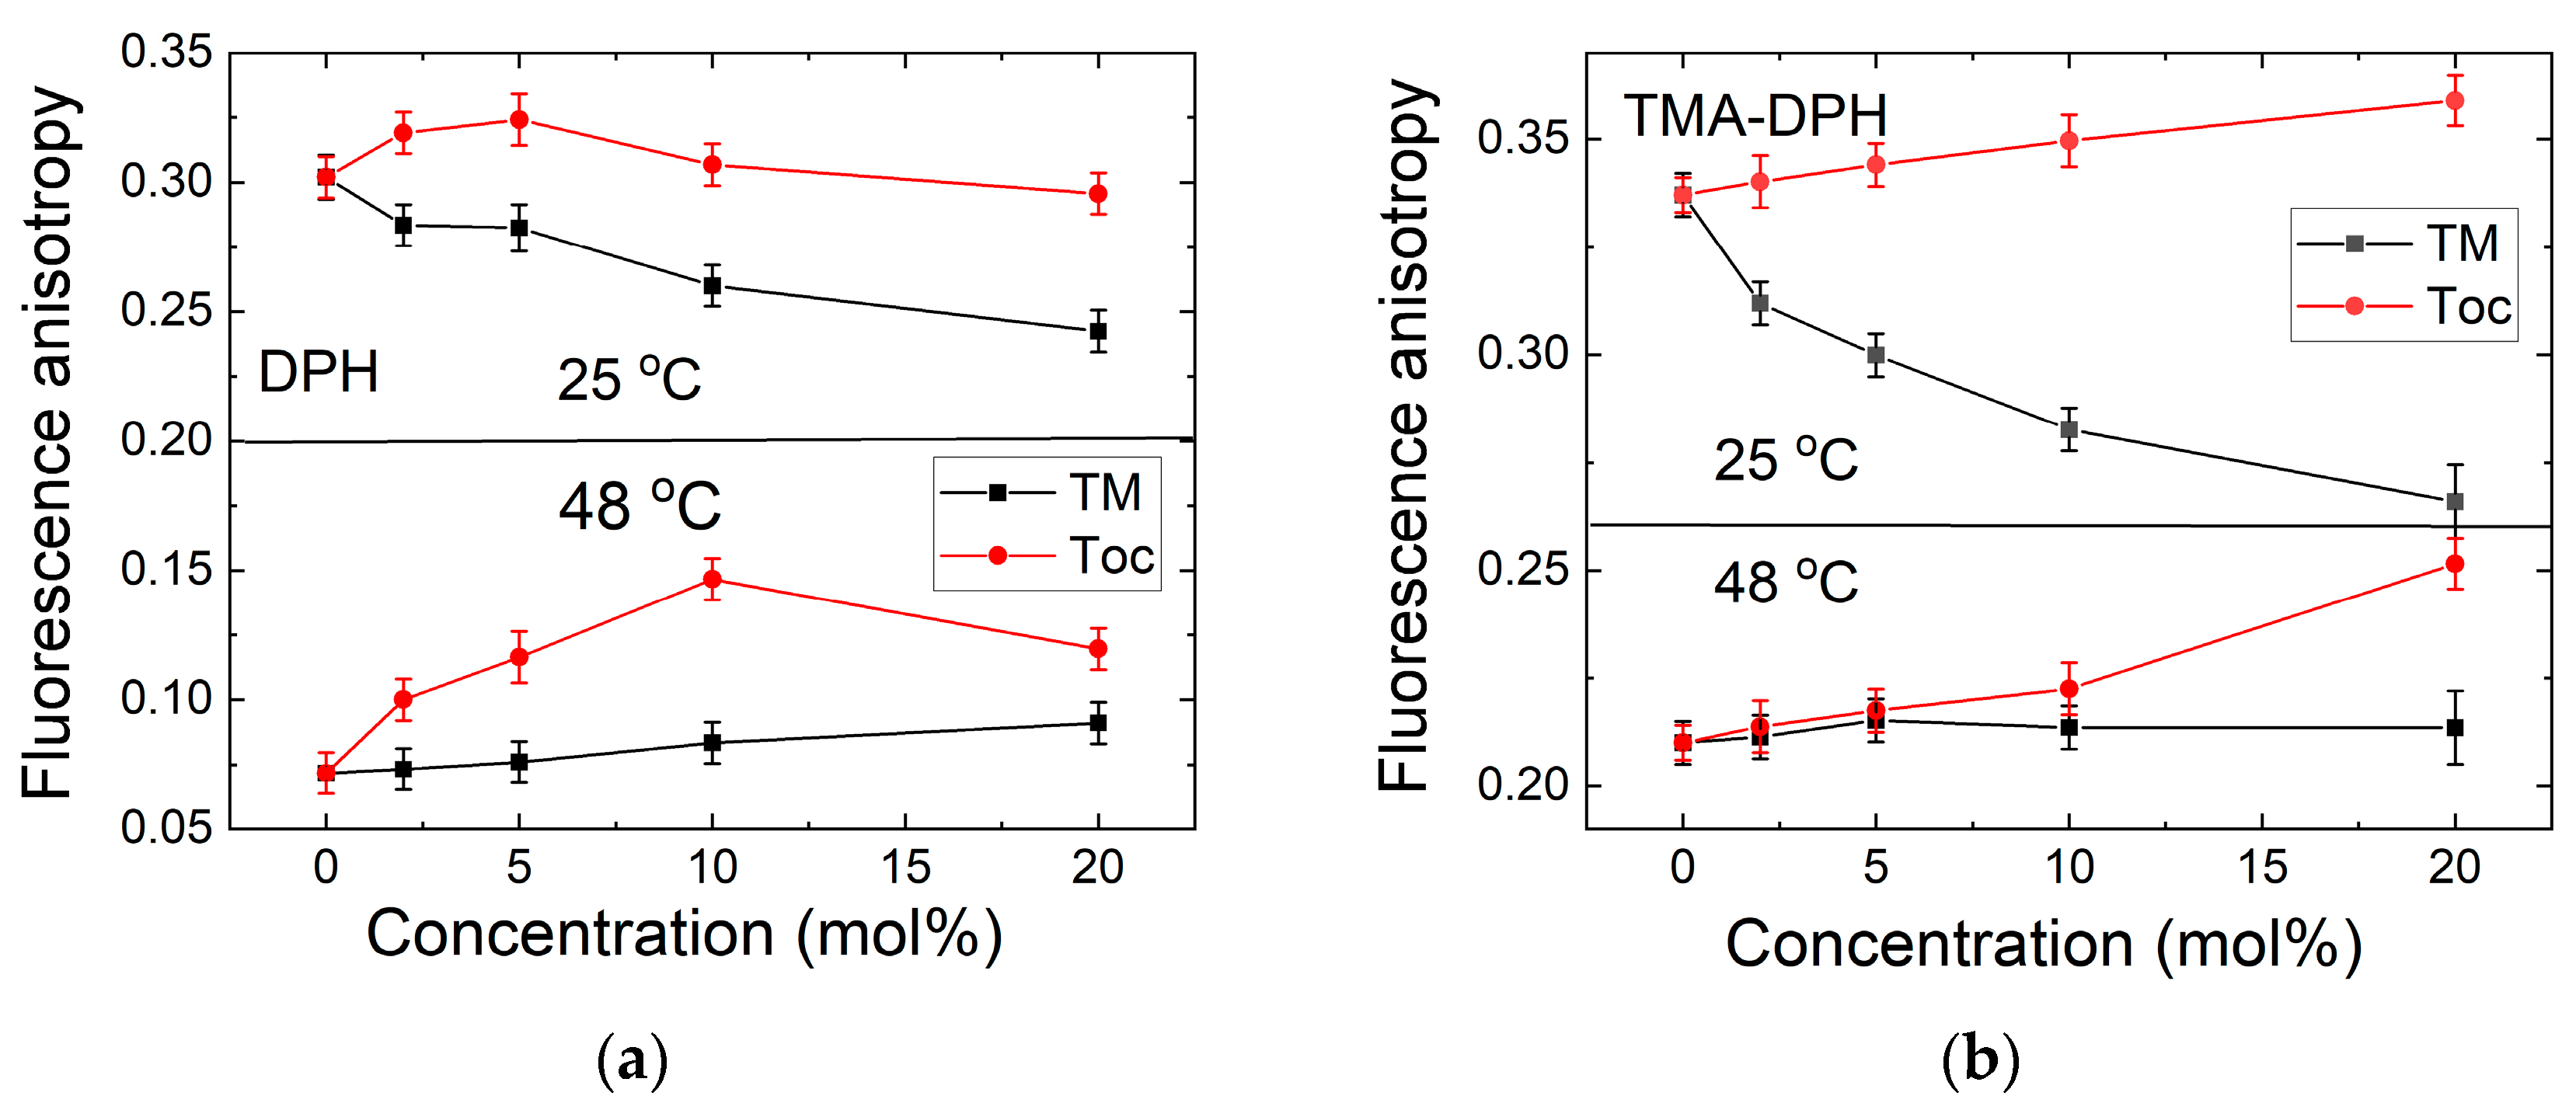
Figure 6 summarizes the anisotropy results of DPH and TMA–DPH recorded at 25 °C and 48 °C with increasing concentrations of TM and Toc. In the gel phase, the increasing TM concentrations lead to progressive anisotropy lowering, which is opposite to the scenario when Toc is embedded into DPPC and anisotropy increases. More than 5 mol% slowly decreases anisotropy. An increasing presence of tocopherols in the fluid phase increases the DPH anisotropy, indicating membrane rigidification. The TMA–DPH anisotropy value at 0.21 remains constant, whereas the presence of Toc at this same condition increases anisotropy, indicating decreasing membrane fluidity. Increasing anisotropy in the liquid crystalline phase of DPPC for Toc was reported [23,47].

3.3. DSC Measurements

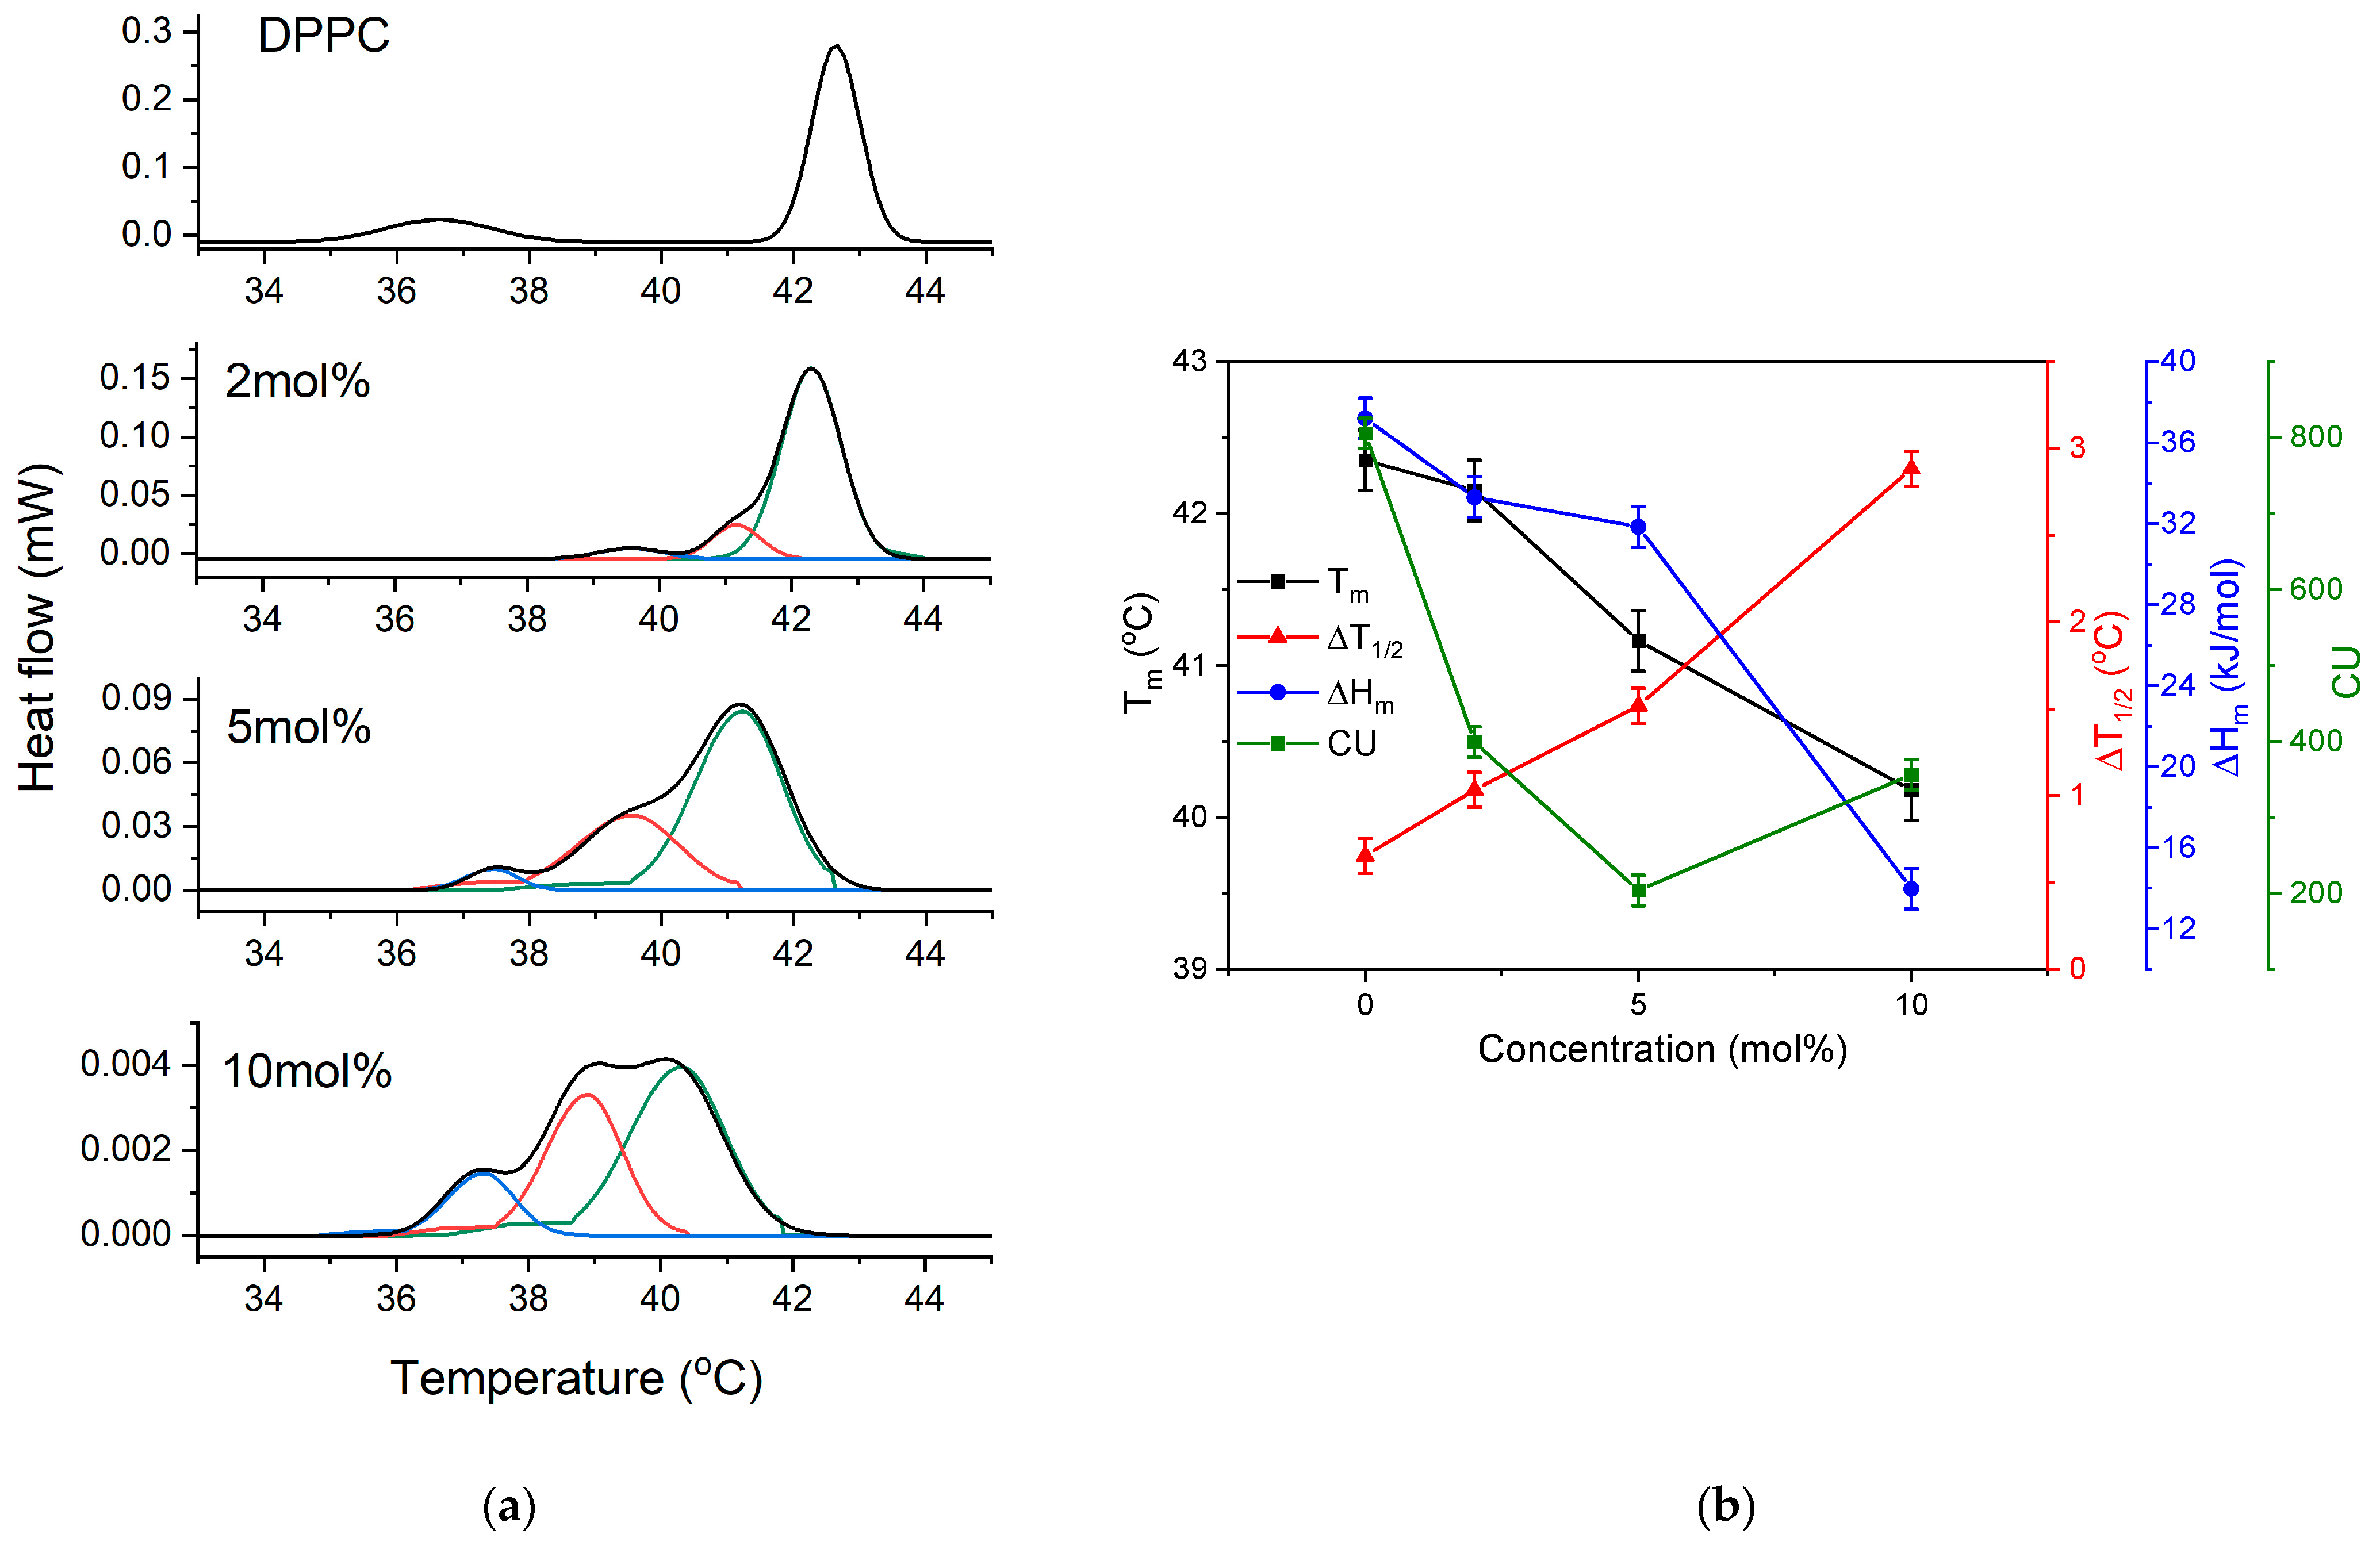
To complete the above presented fluorescence probe results with thermodynamic and thermotropic information as enthalpy, temperatures, and cooperativities of the main phase transition, we applied the DSC method. Figure 7 presents the thermograms obtained during DSC measurements of DPPC with embedded TM. For pure DPPC, the DSC scan shows the main phase transition peak with a maximum at 42.35 °C and a small peak at 35 °C, ascribed to the pretransition, which occurs from the gel to the ripple phase. Figure 7 shows that embedded TM at 2, 5, or 10 mol% into DPPC influences the DSC curves of these mixtures. Increasing TM concentration is gradually broadening the main transition peak, lowering the Tm temperature and lowering the intensity of the whole trace. Moreover, the measured thermograms became unsymmetrical by forming shoulders toward lower temperatures. The pretransition peak disappears from the trace at TM presence, even at 2 mol%. The incorporation of 20 mol% of TM led to the disappearance of DSC traces, indicating a complete fluidization of the membrane. The cooperativity parameter, calculated from DSC results, decreased from 803 for pure DPPC to 287 at 10 mol% of TM, indicating an increasing disorder in the bilayer.
Presence of TM in liposomes generates multicomponent DSC endotherm. Fitting procedures have shown that those traces are consisting of two or three new peaks, indicating the presence of at least two thermal processes (Figure 7a). Positions of maxima and intensities of deconvolved peaks depend on TM concentration. All fitted peaks are wider compared to pure DPPC, and those appearing with increasing TM concentrations are shifted towards lower Tm. The new bands with a maxima at 42.15 °C and 39.5 °C at 2 mol% are relatively small compared to the main peak transition, whereas at 5 mol%, those bands dominate with negligible participation of the main transition peak. Additionally, we observed the formation of another shoulder at 37.5 °C. At 10 mol%, the total disappearance of the main peak occurs, whereas the other bands still exist but with much lower intensity. The data presented in Figure 7a indicate that recorded DSC traces of the TM-containing DPPC liposomes can be correctly simulated as a summation of three components. Such results suggest that the DPPC bilayer mixtures with TM may contain at least two populations of domains with different melting temperatures.
Figure 7b presents a multiplot with the measured and calculated parameters derived from the DSC scans as the temperature of the main transition peak Tm, the width of the transition at half-peak height ΔT1/2, the enthalpy of the phase transition ΔHm, and the cooperativity unit CU plotted against TM concentrations. The decreasing values of Tm, the ΔHm, CU, and increasing ΔT1/2 indicate a structural modification of DPPC introduced with increasing concentrations of TM. This last parameter indicates a progressing disappearance of cooperativity, which is clearly shown on this plot for the CU parameter. The reduction in ΔHm leads to weaker interactions between acyl chains in the phospholipids, thus leading to a loosening of the membrane structure.

4. Discussion

The information regarding properties of TM in DPPC monolayers, or its destructive effects on cancer cell lines, were revealed previously [9,48]. In this work, we present the results obtained in DPPC liposomes, which serve as a model for biological membranes. The ANS, DPH, and TMA–DPH fluorescence, together with a DSC method, confirmed their potential to detect structural changes in DPPC liposomes [21,42].
The obtained results using ANS fluorescence indicate that with increasing TM concentration, the bilayer structure undergoes alterations in phase transition, ordering, and hydration in the interphase region. The obtained parameters suggest that the alterations may have arisen from the interactions at the interfacial region of the bilayer. Such modifications of the membrane structure as increase the volume of the head group were reported for alcohols [49,50,51], phenols [52], or sterols [38,53]. Additionally, increasing hydrocarbon tilt and increasing molecular area lead to reordering of the acyl chain packing [46,53,54].
The kinetic results of ANS binding to DPPC revealed the mechanism for this process. The binding occurs fast by an adsorption of ANS dye present in bulk water onto accessible places on liposome surfaces. Because ANS binds by electrostatic forces, the binding to the surface occurs by interactions with head group atoms of phospholipid, phosphate, or choline moiety. A slow component characterized by longer times and stronger fluorescence indicates the motion of ANS into the liposome hydrophobic interior and an increasing number of binding sites due to added TM, which decreases membrane ordering. Thus, bilayer reorganization is giving opportunity that more ANS molecules bind to membrane, what is observed as the increase of Fl.
Increasing temperature leads to the formation of the ripple phase, where an ordered membrane transforms into a periodically undulated bilayer. Such reorganization opens more binding sites inside bilayer interior. Thus, more ANS molecules may bound to newly formed sites, what is observed as the increase of FI. The highest FI is observed at temperature of the phase transition from a rippled ordered state to a fluid phase, which is a less ordered state. Such a combination of ordered and fluid phases gives ANS molecules the highest possibility of membrane penetration and binding. Further loosening of the structure, which is connected with an increasing surface area of the lipid head group and changing packing order, also allows for the influx of water molecules, leading to the fluorescence quenching of ANS [25,26,41], which is observed as decreasing FI as temperature increases. The results regarding permeations of other dyes and drugs at the temperature of the main phase transition have also been reported [43,44].
The presented results of ANS fluorescence indicate that TM embedded into DPPC modifies its properties mainly because of an increased influx of water molecules, which increases surface/volume per head group and introduces disordering in the acyl chain region. Such modifications in the membrane structure finally led to the further fluidization of the bilayer at lower temperatures.
The molecular mechanism of these processes is connected with interactions between TM, which possesses a long anionic malonate moiety and the electrostatic potentials of the membrane surface arising from DPPC head group moieties where each possess lone pair electrons [55]. Interactions between negatively charged phosphate groups in the phospholipid head group and anionic malonate moiety from embedded TM modify membrane interface region, which leads to further processes.
The anisotropy results of DPH and TMA–DPH indicate that TM inserted into DPPC increases its disorder, decreasing cooperativity and making the structure less rigid and fluid.
To simultaneously follow the changes in two measured properties with the opportunity to observe the variation of interior membrane properties at each stage of transformation induced by the presence of TM, we apply the Cartesian plot. In this presentation, we may also follow the dynamics of given bilayer structures induced by increasing presences of TM. Figure 8 presents the Cartesian diagram for DPPC liposomes modified with 2, 5, 10, and 20 mol% of TM, arranged from the data of membrane fluidity (DPH, TMA–DPH) and hydration (ANS intensity) at four characteristic temperatures: for gel, Tp, Tm, and crystalline phases. The vertical line at 170 is a threshold line between low and high hydration, whereas a horizontal line at 0.2 is a threshold for ordered and transition states.
The DPH data, Figure 8a, indicate that in the gel phase increasing TM concentration decreases membrane order in its hydrophobic region. It is concurrently observed increasing hydration as a contradiction to the fluorescence mechanism of ANS emission. Thus, we have to introduce another mechanism in accordance to the ANS fluorescence mechanism and call it polarity. The increasing intensity is related to electrostatic interactions between ANS and ionic groups of the phospholipid head. A disturbing presence of TM in the membrane leads to more binding places on the membrane surface. The ripple phase observed as pretransition undergoes membrane progressing disordering as the TM presence raises, and the recorded ANS intensity is ascribed to the aforementioned mechanism. At Tm, a pure DPPC is still in an ordered state. However, from 2 mol% to 5 mol% of TM, an increasing disorder in the dehydrated interior is observed. Increasing TM concentration induces hydration in this region, allowing for the water influx. In the liquid crystalline phase, the fluid state shows an increasing hydration, indicating a further influx of water molecules into the liposome interior. The results indicate that the presence of TM, even at 2 mol%, alters fluidity and/or hydration/polarity of the hydrophobic region of the membrane in the pattern.
To observe and analyze behavior in the hydrophilic membrane region, we apply another fluorescent probe that is placed closer to membrane surface. TMA–DPH probes the interface region in the vicinity of the glycerol backbone and upper acyl chain region because of its cationic group, which anchors to water/a bilayer interface [46]. Figure 8b presents the Cartesian diagram in this same form as given for DPH, Figure 8a, to visually compare the results. We may notice in Figure 8b that in ordered states, the increasing concentration of TM decreases ordering in the interface region to the same extent as observed for DPH, and with this same molecular mechanism. At Tm, and in a liquid crystalline phase, the increasing TM concentration practically has no effect of interface fluidity, which remains still in an ordered state. However, the influx of water is observed leading to increased hydration.
The parameters obtained from the DSC traces (Tm, ΔT1/2 and ΔHm) are very sensitive indicators of the calorimetric properties characterizing the system. Our results show that in the presence of TM, the changes in the broadening of ΔT1/2, decreasing Tm, and diminishing ΔHm and cooperativity were noted. Additionally, with an increasing TM, the new peaks appeared on thermograms. These findings indicate that the observed changes can be ascribed to lowering rigidity of phospholipid molecules in the liposomes and show that the presence of the TM molecules in DPPC liposomes lead to its fluidization. The deconvolution of DSC traces indicate the formation of different ordered structures formed from the existing components, which include regions with higher TM concentrations, leading to the formation of cubic or hexagonal mixed micelles formed from DPPC- and TM-enriched molecules [56,57,58,59,60]. Presented results have shown that increasing TM presence embedded into DPPC strongly affect its phase properties in a similar way as observed for temperature-induced phase transitions, thus indicating its possible role in transduction of membrane processes.
In our previous studies of ester derivatives of tocopherol [21,23], investigated in DPPC monolayers and liposomes regarding their behavior, we have found that the increasing presence of esters change membrane properties proportionally to their concentrations. All investigated esters triggered the hydration in the head groups region of phospholipids and disordering of the DPPC in the gel phase while slightly increasing the order in the liquid crystalline phase. A molecular mechanism behind the observed phenomena in mixtures of DPPC and embedded esters is related to a decreasing strength of the van der Waals interactions between hydrocarbon tails and electrostatic interactions in the interface layer of the membrane.

5. Conclusions

The presented ANS fluorescence, DPH, and TMA–DPH fluorescence anisotropy and DSC data established that embedded TM into DPPC membranes led to changes in their structural and thermotropic properties. The growing ANS fluorescence with increasing TM content in the gel phase reflects changes in the electrostatic interactions of the dye, with the phospholipid head group atoms leading to structural membrane alterations. The disrupted packing order allowed ANS molecules to achieve a deeper penetration into the inner locations inside the membrane. In a liquid–crystalline phase, into the disrupted DPPC structure the influx of water molecules increases, leading to further fluidization. The raising of TM concentration decreases cooperativity and the formation of a multicomponent structure of a mixture, which led to a progressive fluidization of the membrane with lowering main phase transition temperature. In the interface region, an enhanced hydration of the head groups of phospholipids interacting with anionic malonate moiety is observed, which modifies the interactions between the surrounding water molecules and the surface. The above presented results may be indicative as one of the molecular mechanisms responsible for the effective disruption of cell membranes caused by the presence of TM.

Author Contributions

Conceptualization, K.P. and G.N.; methodology, K.P., G.N. and J.T.-G.; software, K.P., G.N. and J.T.-G.; validation, K.P., G.N. and J.T.-G.; formal analysis, K.P. and G.N.; investigation, G.N., J.T.-G. and M.G.-W.; resources, S.W.; data curation, K.P. and G.N.; writing—original draft preparation, K.P. and G.N.; writing—review and editing, K.P., G.N., J.T.-G., M.G.-W. and S.W.; visualization, K.P. and G.N.; supervision, K.P. All authors have read and agreed to the published version of the manuscript.

Funding

This work was partially supported by grants 508.782.00 and 508.785.00 from the Poznan University of Life Science.

Institutional Review Board Statement

Not applicable.

Informed Consent Statement

Not applicable.

Data Availability Statement

Data are available from the corresponding author on reasonable request.

Conflicts of Interest

The authors declare no conflict of interest.

References

  1. Azzi, A.; Stocker, A. Vitamin E: Non-antioxidant roles. Prog. Lipid Res. 2000, 39, 231–255. [Google Scholar] [CrossRef] [PubMed]
  2. Ungurianu, A.; Zanfirescu, A.; Nițulescu, G.; Margină, D. Vitamin E beyond Its Antioxidant Label. Antioxidants 2021, 10, 634. [Google Scholar] [CrossRef] [PubMed]
  3. Quinn, P.J. Is the Distribution of α-Tocopherol in Membranes Consistent with Its Putative Functions? Biochemistry 2004, 69, 58–66. [Google Scholar] [CrossRef] [PubMed]
  4. Atkinson, J.; Epand, R.F.; Epand, R.M. Tocopherols and tocotrienols in membranes: A critical review. Free Radic. Biol. Med. 2008, 44, 739–764. [Google Scholar] [CrossRef]
  5. Massey, J.B.; She, H.S.; Pownall, H.J. Interaction of vitamin E with saturated phospholipid bilayers. Biochem. Biophys. Res. Commun. 1982, 106, 842–847. [Google Scholar] [CrossRef]
  6. Wang, X.; Quinn, P.J. Vitamin E and its function in membranes. Prog. Lipid Res. 1999, 38, 309–336. [Google Scholar] [CrossRef]
  7. Quinn, P.J. The effect of tocopherol on the structure and permeability of phosphatidylcholine liposomes. J. Control. Release 2012, 160, 158–163. [Google Scholar] [CrossRef]
  8. Kogure, K.; Hama, S.; Kisaki, M.; Takemasa, H.; Tokumura, A.; Suzuki, I.; Fukuzawa, K. Structural characteristic of terminal dicarboxylic moiety required for apoptogenic activity of alpha-tocopheryl esters. Biochim. Biophys. Acta-Gen. Subj. 2004, 1672, 93–99. [Google Scholar] [CrossRef]
  9. Kogure, K.; Manabe, S.; Suzuki, I.; Tokumura, A.; Fukuzawa, K. Cytotoxicity of alpha-tocopheryl succinate, malonate and oxalate in normal and cancer cells in vitro and their anti-cancer effects on mouse melanoma in vivo. J. Nutr. Sci. Vitaminol. 2005, 51, 392–397. [Google Scholar] [CrossRef]
  10. Kanai, K.; Kikuchi, E.; Mikami, S.; Suzuki, E.; Uchida, Y.; Kodaira, K.; Miyajima, A.; Ohigashi, T.; Nakashima, J.; Oya, M. Vitamin E succinate induced apoptosis and enhanced chemosensitivity to paclitaxel in human bladder cancer cells in vitro and in vivo. Cancer Sci. 2010, 101, 216–223. [Google Scholar] [CrossRef]
  11. Donapaty, S.; Louis, S.; Horvath, E.; Kun, J.; Sebti, S.M.; Malafa, M.P. RRR-alpha-tocopherol succinate down-regulates oncogenic Ras signaling. Mol. Cancer Ther. 2006, 5, 309–316. [Google Scholar] [CrossRef] [PubMed]
  12. Malafa, M.P.; Neitzel, L.T. Vitamin E succinate promotes breast cancer tumor dormancy. J. Surg. Res. 2000, 93, 163–170. [Google Scholar] [CrossRef] [PubMed]
  13. Koudelka, S.; Turanek Knotigova, P.; Masek, J.; Prochazka, L.; Lukac, R.; Miller, A.D.; Neuzil, J.; Turanek, J. Liposomal delivery systems for anti-cancer analogues of vitamin E. J. Control. Release 2015, 207, 59–69. [Google Scholar] [CrossRef] [PubMed]
  14. Monteiro, N.; Martins, A.; Reis, R.L.; Neves, N.M. Liposomes in tissue engineering and regenerative medicine. J. R. Soc. Interface 2014, 11, 20140459. [Google Scholar] [CrossRef]
  15. Nsairat, H.; Khater, D.; Sayed, U.; Odeh, F.; Al Bawab, A.; Alshaer, W. Liposomes: Structure, composition, types, and clinical applications. Heliyon 2022, 8, e09394. [Google Scholar] [CrossRef] [PubMed]
  16. Liu, P.; Chen, G.; Zhang, J. A Review of Liposomes as a Drug Delivery System: Current Status of Approved Products, Regulatory Environments, and Future Perspectives. Molecules 2022, 27, 1372. [Google Scholar] [CrossRef]
  17. Krilov, D.; Kosović, M.; Serec, K. Spectroscopic studies of alpha tocopherol interaction with a model liposome and its influence on oxidation dynamics. Spectrochim. Acta-Part A Mol. Biomol. Spectrosc. 2014, 129, 588–593. [Google Scholar] [CrossRef]
  18. Srivastava, S.; Phadke, R.S.; Govil, G. Magnetic resonance studies on the binding of etomidate to lipid bilayers. Physiol. Chem. Phys. Med. NMR 1987, 19, 241–250. [Google Scholar]
  19. Wu, R.G.; Wang, Y.R.; Wu, F.G.; Zhou, H.W.; Zhang, X.H.; Hou, J.L. A DSC study of paeonol-encapsulated liposomes, comparison the effect of cholesterol and stigmasterol on the thermotropic phase behavior of liposomes. J. Therm. Anal. Calorim. 2012, 109, 311–316. [Google Scholar] [CrossRef]
  20. Mason, J.T. Properties of phosphatidylcholine bilayers as revealed by mixed-acyl phospholipid fluorescent probes containing n-(9-anthroyloxy) fatty acids. Biochim. Biophys. Acta (BBA)-Biomembr. 1994, 1194, 99–108. [Google Scholar] [CrossRef]
  21. Neunert, G.; Tomaszewska-Gras, J.; Witkowski, S.; Polewski, K. Tocopheryl succinate-induced structural changes in DPPC liposomes: DSC and ANS fluorescence studies. Molecules 2020, 25, 2780. [Google Scholar] [CrossRef] [PubMed]
  22. Quinn, P.J.; Takahashi, H.; Hatta, I. Characterization of complexes formed in fully hydrated dispersions of dipalmitoyl derivatives of phosphatidylcholine and diacylglycerol. Biophys. J. 1995, 68, 1374–1382. [Google Scholar] [CrossRef] [PubMed]
  23. Neunert, G.; Tomaszewska-Gras, J.; Siejak, P.; Pietralik, Z.; Kozak, M.; Polewski, K. Disruptive effect of tocopherol oxalate on DPPC liposome structure: DSC, SAXS, and fluorescence anisotropy studies. Chem. Phys. Lipids 2018, 216, 104–113. [Google Scholar] [CrossRef] [PubMed]
  24. Lai, M.Z.; Diizgune, N.; Szoka, F.C. Effects of replacement of the hydroxyl group of cholesterol and tocopherol on the thermotropic behavior of phospholipid membranes. Biochemistry 1985, 24, 1646–1653. [Google Scholar] [CrossRef]
  25. Gasymov, O.K.; Glasgow, B.J. ANS fluorescence: Potential to augment the identification of the external binding sites of proteins. Biochim. Biophys. Acta-Proteins Proteomics 2007, 1774, 403–411. [Google Scholar] [CrossRef]
  26. Haynes, D.H.; Staerk, H. 1-Anilino-8-naphthalenesulfonate: A fluorescent probe of membrane surface structure, composition and mobility. J. Membr. Biol. 1974, 17, 313–340. [Google Scholar] [CrossRef]
  27. Au, S.; Schacht, J.; Weiner, N. Membrane effects of aminoglycoside antibiotics measured in liposomes containing the fluorescent probe, 1-anilino-8-naphthalene sulfonate. Biochim. Biophys. Acta (BBA)-Biomembr. 1986, 862, 205–210. [Google Scholar] [CrossRef]
  28. Bisby, R.H.; Birch, D.J. A time-resolved fluorescence anisotropy study of bilayer membranes containing alpha-tocopherol. Biochem. Biophys. Res. Commun. 1989, 158, 386–391. [Google Scholar] [CrossRef]
  29. De Almeida, R.F.M.; Loura, L.M.S.; Fedorov, A.; Prieto, M. Lipid rafts have different sizes depending on membrane composition: A time-resolved fluorescence resonance energy transfer study. J. Mol. Biol. 2005, 346, 1109–1120. [Google Scholar] [CrossRef]
  30. Jaśkowski, J.; Witkowski, J.; Myśliwski, A.; Zawadzki, H. Effect of air ions on L 1210 cells: Changes in fluorescence of membrane-bound 1,8-aniline-naphthalene-sulfonate (ANS) after in vitro exposure of cells to air ions. Gen. Physiol. Biophys. 1986, 5, 511–515. [Google Scholar]
  31. Loura, L.M.S.; Fedorov, A.; Prieto, M. Partition of membrane probes in a gel/fluid two-component lipid system: A fluorescence resonance energy transfer study. Biochim. Biophys. Acta-Biomembr. 2000, 1467, 101–112. [Google Scholar] [CrossRef] [PubMed]
  32. Sengupta, P.; Holowka, D.; Baird, B. Fluorescence resonance energy transfer between lipid probes detects nanoscopic heterogeneity in the plasma membrane of live cells. Biophys. J. 2007, 92, 3564–3574. [Google Scholar] [CrossRef] [PubMed]
  33. Vladkova, R.; Teuchner, K.; Leupold, D.; Koynova, R.; Tenchov, B. Detection of the metastable rippled gel phase in hydrated phosphatidylcholine by fluorescence spectroscopy. Biophys. Chem. 2000, 84, 159–166. [Google Scholar] [CrossRef]
  34. Genz, A.; Holzwarth, J.F. Dynamic fluorescence measurements on the main phase transition of dipalmytoylphosphatidylcholine vesicles. Eur. Biophys. J. 1986, 13, 323–330. [Google Scholar] [CrossRef] [PubMed]
  35. Ortiz, A.; Villalain, J.; Gómez-Fernández, J.C. Interaction of Diacylglycerols with Phosphatidylcholine Vesicles As Studied by Differential Scanning Calorimetry and Fluorescence Probe Depolarization. Biochemistry 1988, 27, 9030–9036. [Google Scholar] [CrossRef] [PubMed]
  36. Antunes-Madeira, M.C.; Madeira, V.M.C. Membrane fluidity as affected by the insecticide lindane. BBA-Biomembr. 1989, 982, 161–166. [Google Scholar] [CrossRef]
  37. Wang, S.; Beechem, J.M.; Gratton, E.; Glaser, M. Orientational Distribution of 1,6-Diphenyl-1,3,5-hexatriene in Phospholipid Vesicles As Determined by Global Analysis of Frequency Domain Fluorimetry Data. Biochemistry 1991, 30, 5565–5572. [Google Scholar] [CrossRef]
  38. Bui, T.T.; Suga, K.; Umakoshi, H. Roles of Sterol Derivatives in Regulating the Properties of Phospholipid Bilayer Systems. Langmuir 2016, 32, 6176–6184. [Google Scholar] [CrossRef]
  39. Witkowski, S.; Wałejko, P. Synthesis of α-Tocopheryl Glycosides. Z. Naturforsch. 2001, 56b, 411–415. [Google Scholar] [CrossRef]
  40. Witkowski, S.; Maciejewska, D.; Wawer, I. A solution and solid state conformations of chromanol esters, 13C MAS NMR and d-NMR study. J. Chem. Soc. Perkin Trans. 2000, 2, 1471–1476. [Google Scholar] [CrossRef]
  41. Slavík, J. Anilinonaphthalene sulfonate as a probe of membrane composition and function. BBA-Rev. Biomembr. 1982, 694, 1–25. [Google Scholar] [CrossRef] [PubMed]
  42. Neunert, G.; Tomaszewska-Gras, J.; Baj, A.; Gauza-Włodarczyk, M.; Witkowski, S.; Polewski, K. Phase transitions and structural changes in DPPC liposomes induced by a 1-carba-alpha-tocopherol analogue. Molecules 2021, 26, 2851. [Google Scholar] [CrossRef] [PubMed]
  43. Tsong, T.Y. Effect of phase transition on the kinetics of dye transport in phospholipid bilayer structures. Biochemistry 1975, 14, 5409–5414. [Google Scholar] [CrossRef] [PubMed]
  44. Jacobson, K.; Papahadjopoulos, D. Effect of a phase transition on the binding of 1-anilino-8-naphthalenesulfonate to phospholipid membranes. Biophys. J. 1976, 16, 549–560. [Google Scholar] [CrossRef] [PubMed]
  45. Sun, L.; Böckmann, R.A. Membrane phase transition during heating and cooling: Molecular insight into reversible melting. Eur. Biophys. J. 2018, 47, 151–164. [Google Scholar] [CrossRef]
  46. do Canto, A.M.T.M.; Robalo, J.R.; Santos, P.D.; Carvalho, A.J.P.; Ramalho, J.P.P.; Loura, L.M.S. Diphenylhexatriene membrane probes DPH and TMA-DPH: A comparative molecular dynamics simulation study. Biochim. Biophys. Acta-Biomembr. 2016, 1858, 2647–2661. [Google Scholar] [CrossRef]
  47. Massey, J.B. Interfacial properties of phosphatidylcholine bilayers containing vitamin E derivatives. Chem. Phys. Lipids 2001, 109, 157–174. [Google Scholar] [CrossRef]
  48. Neunert, G.; Hertmanowski, R.; Witkowski, S.; Polewski, K. Effect of Ester Moiety on Structural Properties of Binary Mixed Monolayers of Alpha-Tocopherol Derivatives with DPPC. Molecules 2022, 27, 4670. [Google Scholar] [CrossRef]
  49. Barry, J.A.; Gawrisch, K. Effects of ethanol on lipid bilayers containing cholesterol, gangliosides, and sphingomyelin. Biochemistry 1995, 34, 8852–8860. [Google Scholar] [CrossRef]
  50. Reeves, M.D.; Schawel, A.K.; Wang, W.; Dea, P. Effects of butanol isomers on dipalmitoylphosphatidylcholine bilayer membranes. Biophys. Chem. 2007, 128, 13–18. [Google Scholar] [CrossRef]
  51. Vierl, U.; Löbbecke, L.; Nagel, N.; Cevc, G. Solute effects on the colloidal and phase behavior of lipid bilayer membranes: Ethanol-dipalmitoylphosphatidylcholine mixtures. Biophys. J. 1994, 67, 1067–1079. [Google Scholar] [CrossRef] [PubMed]
  52. Suga, K.; Umakoshi, H. Detection of nanosized ordered domains in DOPC/DPPC and DOPC/CH binary lipid mixture systems of large unilamellar vesicles using a TEMPO quenching method. Langmuir 2013, 29, 4830–4838. [Google Scholar] [CrossRef] [PubMed]
  53. Ausili, A.; Torrecillas, A.; De Godos, A.M.; Corbalán-García, S.; Gómez-Fernández, J.C. Phenolic Group of α-Tocopherol Anchors at the Lipid-Water Interface of Fully Saturated Membranes. Langmuir 2018, 34, 3336–3348. [Google Scholar] [CrossRef]
  54. Fukuzawa, K.; Ikebata, W.; Shibata, A.; Kumadaki, I.; Sakanaka, T.; Urano, S. Location and dynamics of α-tocopherol in model phospholipid membranes with different charges. Chem. Phys. Lipids 1992, 63, 69–75. [Google Scholar] [CrossRef] [PubMed]
  55. Makino, K.; Yamada, T.; Kimura, M.; Oka, T.; Ohshima, H.; Kondo, T. Temperature- and ionic strength-induced conformational changes in the lipid head group region of liposomes as suggested by zeta potential data. Biophys. Chem. 1991, 41, 175–183. [Google Scholar] [CrossRef] [PubMed]
  56. Tenchov, R.; Bird, R.; Curtze, A.E.; Zhou, Q. Lipid Nanoparticles—From Liposomes to mRNA Vaccine Delivery, a Landscape of Research Diversity and Advancement. ACS Nano 2021, 15, 16982–17015. [Google Scholar] [CrossRef] [PubMed]
  57. Augustyńska, D.; Burda, K.; Jemioła-Rzemińska, M.; Strzałka, K. Temperature-dependent bifurcation of cooperative interactions in pure and enriched in β-carotene DPPC liposomes. Chem. Biol. Interact. 2016, 256, 236–248. [Google Scholar] [CrossRef]
  58. Timoszyk, A. Dynamics of Model Membranes by NMR. In Spectroscopic Analyses—Developments and Applications; IntechOpen: London, UK, 2017; ISBN 978-953-51-3628-6. [Google Scholar]
  59. Willumeit, R.; Kumpugdee, M.; Funari, S.S.; Lohner, K.; Navas, B.P.; Brandenburg, K.; Linser, S.; Andrä, J. Structural rearrangement of model membranes by the peptide antibiotic NK-2. Biochim. Biophys. Acta-Biomembr. 2005, 1669, 125–134. [Google Scholar] [CrossRef]
  60. Lorincz, A.; Mihály, J.; Németh, C.; Wacha, A.; Bóta, A. Effects of ursolic acid on the structural and morphological behaviours of dipalmitoyl lecithin vesicles. Biochim. Biophys. Acta 2015, 1848, 1092–1098. [Google Scholar] [CrossRef]
Figure 1. Chemical structures of α-tocopherol ((a) Toc) and tocopheryl malonate ((b) TM).
Applsci 13 06219 g001
Figure 2. Time-course of ANS (16 µM) inclusion into DPPC (0.08 mg/mL) membrane at 25 °C for (a) malonate (TM); (b) tocopherol (Toc). TM and Toc concentrations are given in figures.
Applsci 13 06219 g002
Figure 3. Fluorescence intensity (Fl) changes of ANS (16 µM) added to DPPC (0.08 mg/mL) with increasing concentrations of: (a) TM during heating; (b) TM during cooling; (c) Toc during heating; (d) TM during heating at 25, 41, and 50 °C and cooling at 25 °C.
Applsci 13 06219 g003
Figure 4. Fluorescence maxima (λmax) of ANS (16 µM) in DPPC (0.08 mg/mL) versus temperature with increasing concentrations of: (a) TM during heating; (b) TM during cooling; (c) Toc during heating.
Applsci 13 06219 g004
Figure 5. Temperature profiles of anisotropy values at increasing concentrations of TM in DPPC liposome (0.08 mg/mL): (a) DPH; (b) TMA–DPH. Concentrations of TM are given in the legend.
Applsci 13 06219 g005
Figure 6. Anisotropy values versus TM and Toc concentrations in the gel phase at 25 °C and in the liquid crystalline phase at 48 °C: (a) DPH; (b) TMA–DPH.
Applsci 13 06219 g006
Figure 7. (a) DSC measurements (black lines), with fitted components (green, red and blue lines), of mixtures of DPPC with TM at 0, 2, 5, and 10 mol% (please notice changing heat flow scale values on abscissas); (b) plots of the essential thermodynamic parameters versus TM concentration calculated from the DSC thermograms: temperatures of the main transition (Tm), half-width of the peak ΔT1/2, enthalpy of the phase transition (ΔHm) and cooperativity unit (CU).
Applsci 13 06219 g007
Figure 8. The Cartesian diagrams of TM at 25, 36, 41, and 50 °C; (a) DPH/ANS; (b) TMA–DPH/ANS. The x axis indicates hydration/polarity and y axis represents fluidity. Arrows are located at pure DPPC and indicate direction of changes with increasing TM concentration.
Applsci 13 06219 g008
Disclaimer/Publisher’s Note: The statements, opinions and data contained in all publications are solely those of the individual author(s) and contributor(s) and not of MDPI and/or the editor(s). MDPI and/or the editor(s) disclaim responsibility for any injury to people or property resulting from any ideas, methods, instructions or products referred to in the content.