Article

The Impact of Water Availability on the Discriminative Status of Nitrogen (N) in Sugar Beet and Celery Using Hyperspectral Imaging Methods

1
Department of Geology, Soil Science and Geoinformation, Institute of Earth and Environmental Sciences, Maria Curie-Skłodowska University, al. Kraśnicka 2cd, 20-718 Lublin, Poland
2
Institute of Agrophysics Polish, Academy of Sciences, ul. Doświadczalna 4, 20-290 Lublin, Poland
*
Author to whom correspondence should be addressed.
Appl. Sci. 2023, 13(10), 6072; https://doi.org/10.3390/app13106072
Submission received: 2 March 2023 / Revised: 11 May 2023 / Accepted: 12 May 2023 / Published: 15 May 2023

Abstract

:
A pot experiment was conducted to determine the impact of water availability on the discriminatory status of nitrogen (N) in plants using hyperspectral imaging. Nitrogen deficiency causes a significant decrease in chlorophyll concentration in plant leaves regardless of water availability. Five different classification algorithms were used to discriminate between nitrogen concentrations in plants at different levels of water availability. Several statistical parameters, including kappa and overall classification accuracy for calibration and prediction, were used to determine the efficiency and accuracy of the models. The Random Forest model had the highest overall accuracy of over 81% for sugar beet and over 78% for celery. Additionally, characteristic electromagnetic wavelengths were identified in which reflectance correlated with nitrogen and water content in plants could be recorded. It was also noted that the spectral resolution between the N and High Water (HW)/Low Water (LW) treatments was lower in the short-wave infrared (SWIR) region than in the visible and near-infrared (VNIR) region.

1. Introduction

The influence of water and nitrogen fertilization is crucial for plants due to their condition and the costs of plant production [1,2]. The use of nitrogen fertilizers in plant production can cause environmental pollution and it can have a negative impact on soil [3,4]. This is mainly seen in the change in surface and groundwater chemistry and the reduction in soil productivity [5]. On the other hand, nitrogen deficiencies adversely affect plant production and thus reduce profits for farmers [6,7,8]. Properly selected doses of fertilizers taking into account the needs of the plant in a given location, will ensure cost optimization and increased plant comfort [9,10,11]. In addition, modern fertilization techniques combined with new fertilizer products reduce the amount of harmful compounds introduced into the environment [5].
Gathering information about the condition of plants and deficiencies of basic nutrients is conducted using various methods and techniques. These methods can be divided into invasive—leading to plant destruction [12], or non-invasive, where the sensor does not have direct contact with the analyzed object or does not destroy it [13]. Invasive methods are generally applied under laboratory conditions on a small number of plants. In the case of remote sensing methods, the acquisition of information can in principle take place continuously at different spatial scales. In the case of remote sensing data, this ranges from a single leaf through a selected field to continental and global scales [14].
Conducting research in controlled laboratory conditions allows for the verification of many initial hypotheses, which are then transferred to the field scale [15]. Analyses of the influence of various stress factors on plant growth and development can be conducted using multi- and hyperspectral cameras [16,17,18]. One of the most frequently studied stress-inducing factors affecting plant health is water deficiency [19,20,21]. Hyperspectral data analysis also enables the detection of stress caused by deficiencies in specific macro-elements in the soil environment, for example, Mahajan et al. [22], Singh et al. [23] and Jørgensen et al. [24] investigated the possibility of detecting stress associated with fertilizer dosage in barley using visible and near-infrared (VNIR) hyperspectral data. Hongyu et al. [25] used VNIR hyperspectral data to assess the content of NPK in tomatoes. They achieved the best results (R2 above 0.9) for nitrogen prediction. Mahajan et al. [22] used hyperspectral data in the range of 400–2500 nm to determine the possibility of detecting the influence of NPS fertilization on rice.
Remote sensing methods for determining the content of individual nutrients in plants are mainly based on: the discrimination of appropriate wavelengths of radiation based on the reduction of input data dimensionality [22,25,26,27,28], the correlation between vegetation indices and the content of individual macro-elements [22,29,30,31], mathematical modeling based on different input data [32,33], and data classification to discriminate specific features [34,35].
Analysis of hyperspectral data provides ample opportunities for discovering relationships between different stress factors for plants in the natural environment [36]. Research conducted under controlled conditions facilitates the elimination of a large group of naturally occurring factors and creates opportunities for selecting only those wavelengths in which the stress-inducing factor has the greatest influence on reflectivity [37].
The aim of this study was to determine the effect of water availability on nitrogen concentrations in sugar beet and celery leaves using hyperspectral data. The influence of nitrogen fertilization under different water availability on chlorophyll content in the leaves of these plants was examined, and the wavelengths of radiation in the VNIR and short-wave infrared (SWIR) range that best correlate with nitrogen application in terms of water availability in sugar beet and celery were determined.

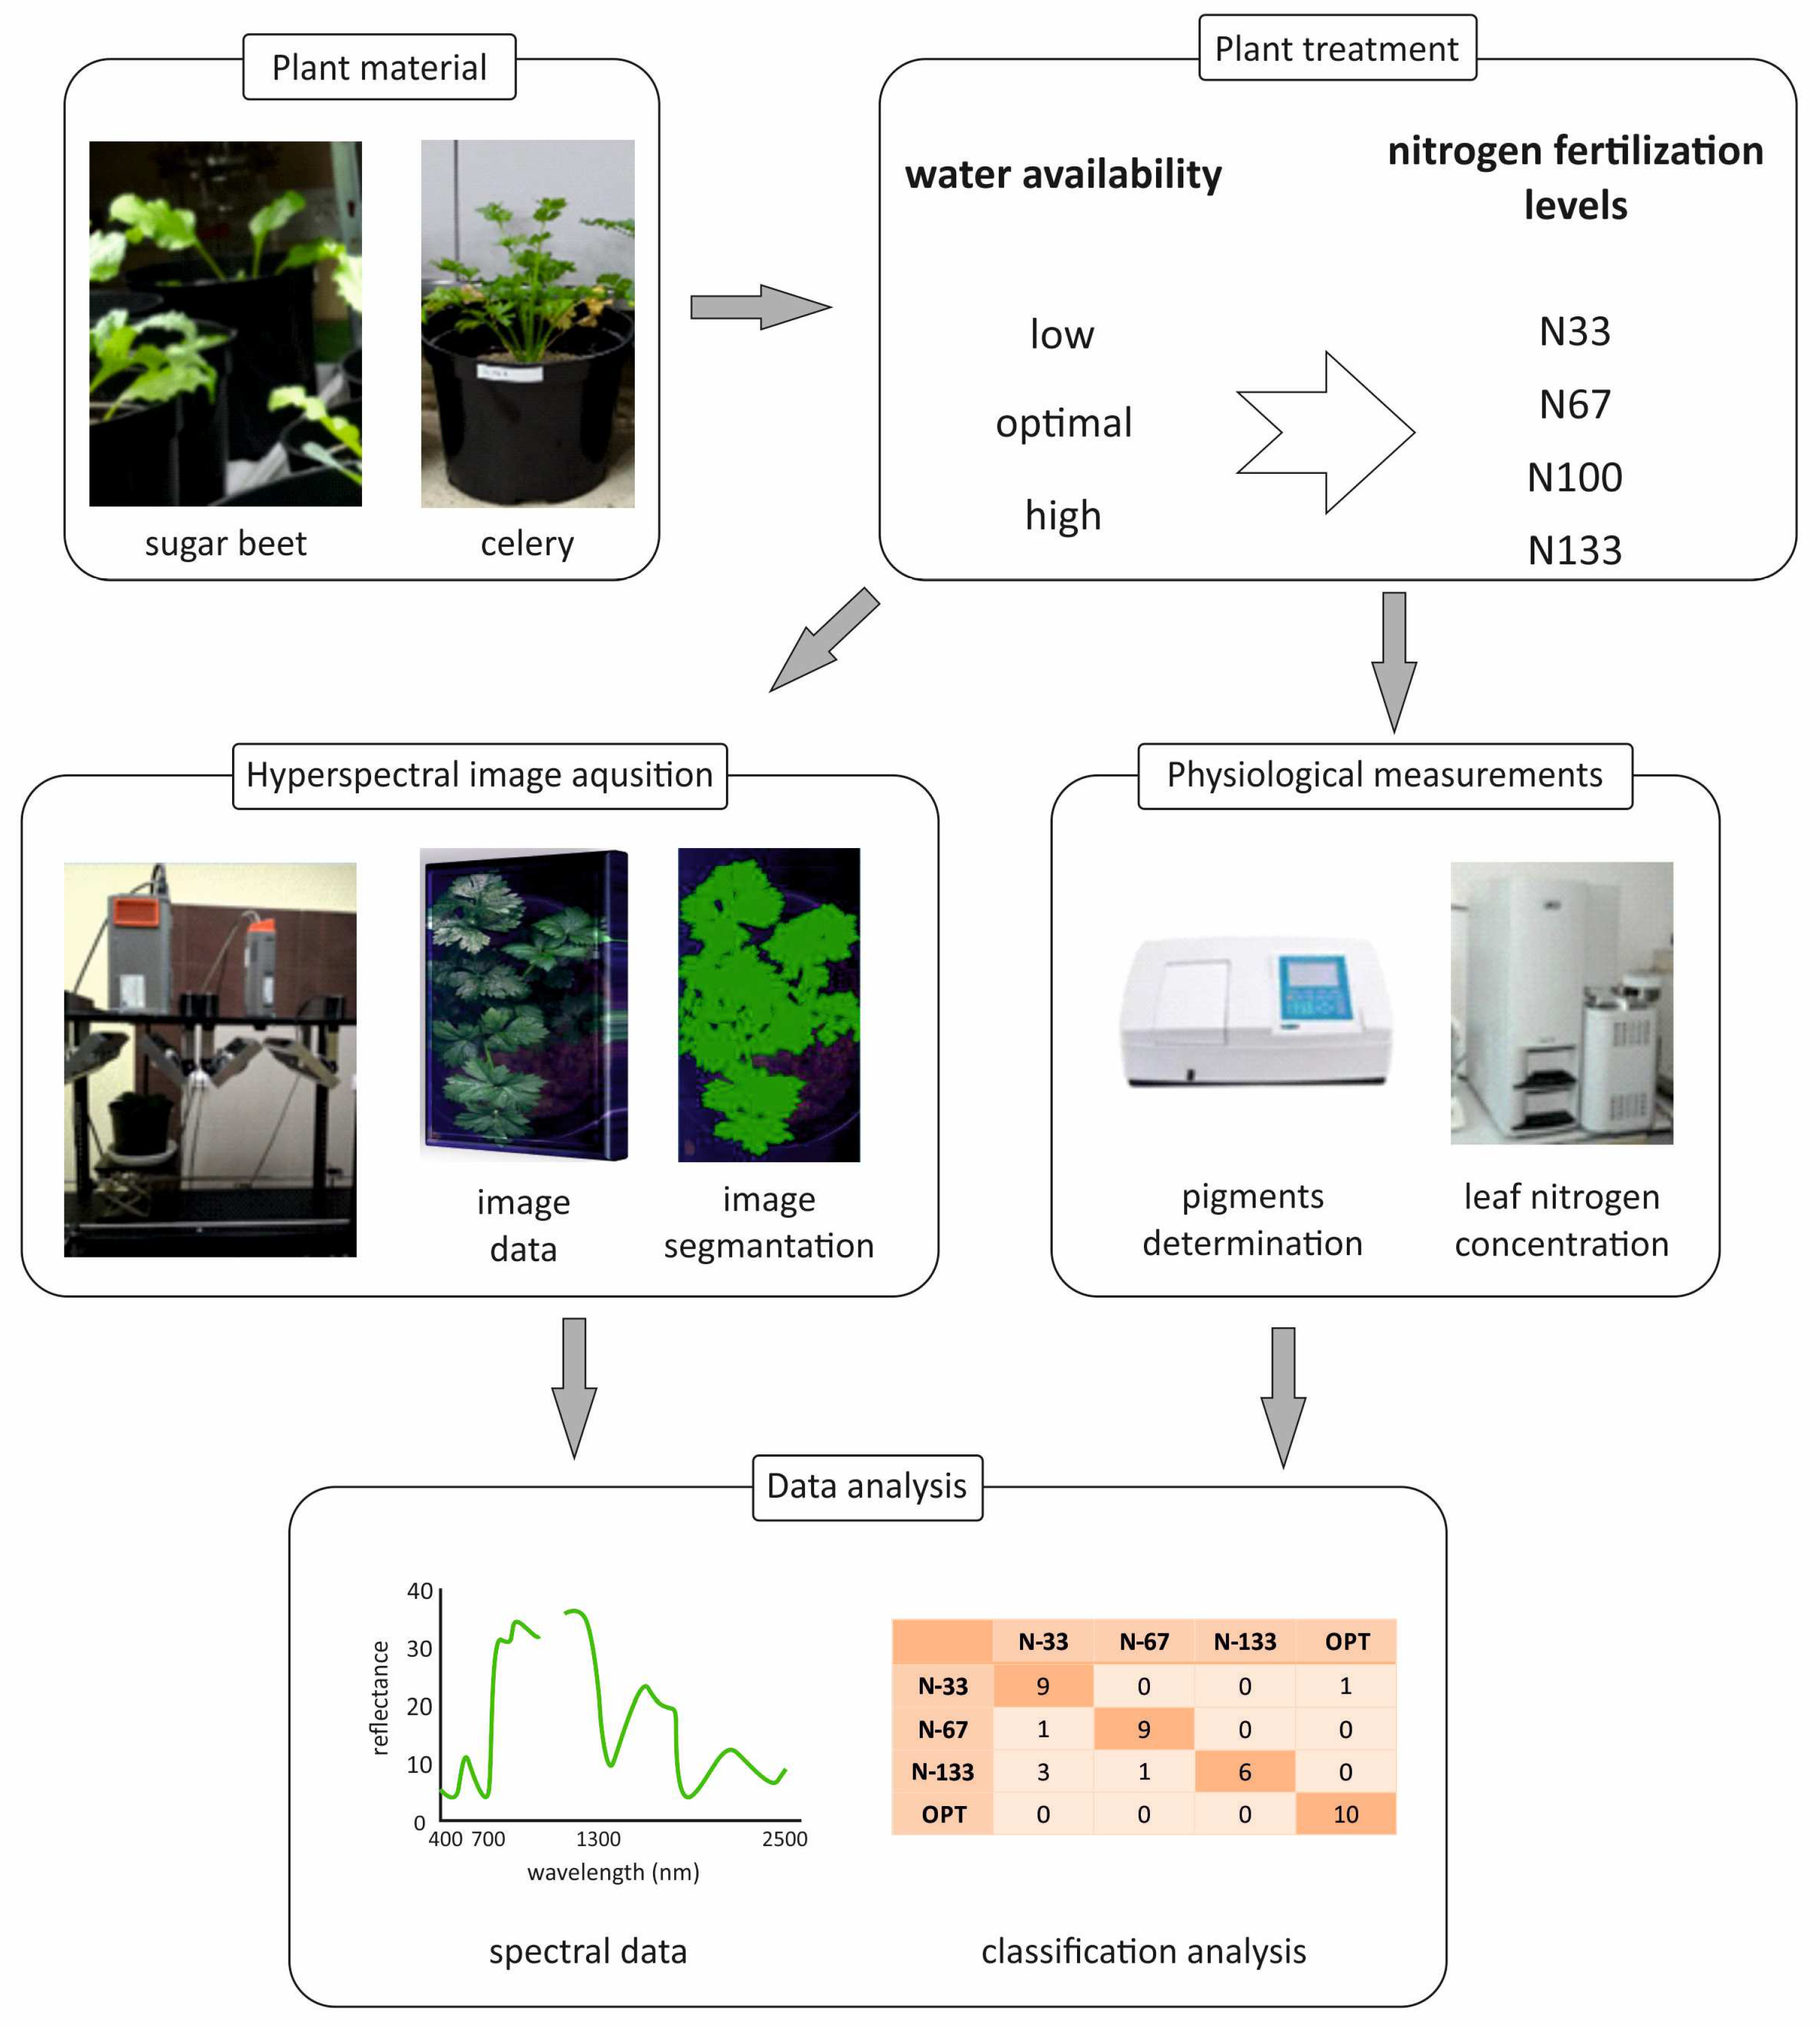
2. Materials and Methods

2.1. Plant Materials

The pot experiment performed on two plant species: celery (Apium graveolens L., cv. Neon) and sugar beet (Beta vulgaris L., cv. Tapir) was conducted between 3 March 2019 and 30 September 2019. The seeds of celery (produced by SEMO, CZE) and sugar beet (produced by SESVanderHave, NED) were purchased commercially. Celery and sugar beet were chosen because they are very popular crops within the European Lowlands, moreover, they have different leaf morphology, which can condition the acquisition of spectral data [38]. The seeds were sown in plastic pots containing peat moss. After seven weeks, seedlings of similar sizes were transplanted into pots with a diameter of 20 cm (one seedling per pot) containing sand as a growing medium. The plants were grown in the greenhouse under natural sunlight supplemented with LED light using a photoperiod of day/night set to 12/12 h, with the temperature ranging from 20 °C to 22 °C from March through to June and also in September 2019. During the months of July and August, the temperature ranged from 24 °C to 26 °C. In this experiment, three irrigation regimes were used in combination with four N levels. Twelve pots of each water x N combination were used. Nitrogen in the form of NH4NO3 was applied in four different doses (33%, 66%, 100%, and 133% of the N dose recommended for the cultivation of studied plants). The recommended doses of N were 350 and 420 mg N per pot for sugar beet and celery plants, respectively. Other macronutrients were applied in their recommended doses using a commercial fertilizer Micro Plus (produced by Intermag, Olkusz, POL). The irrigation regimes included: drought stress (LW; soil water content of 50% of field capacity), optimum water supply (OW; soil water content of 100% of field capacity), and water overflow (HW; soil water content of 120% of field capacity) [39,40,41]. Soil water content was controlled using the Time Domain Reflectometry technique (TDR) at a surface horizon in the range of 0–10 cm. All planted pots were irrigated with tap water after 60 days from seed emergence The water and N treatments were applied from the sprouting stage onwards. Every pot was poured with appropriate quantities of tap water or N solution every two days for 26 weeks. The water or N solution doses were calculated on alternate days for each pot based on soil water content. The irrigation process was carried out in the morning at 8 o’clock. The spectral, leaf pigments, and nitrogen content were measured at the end of the experiment once the plants reached their main development stages. The developmental stages of sugar beet correspond to rosette growth (BBCH stage 28) and the developmental stage of celery corresponds to when the celery roots begin to expand (BBCH stage 41). The scheme of the experiment was presented in Figure 1.

2.2. Hyperspectral Image Acquisition

A laboratory hyperspectral imaging system(HIS) covering the spectral range of 400–1000 nm was used to acquire hyperspectral images of plant leaves. This system consisted of two cameras fitted with spectrographs, and eight halogen lamps each integrated with a camera. The first camera was responsible for VNIR data acquisition, while the second recorded SWIR data. The image acquisition occurred by line scanning. The VNIR images covering 269 spectral bands in the range of 400 nm to 1000 nm were obtained with a spectral sampling interval of 2.8 nm using the VNIR camera with an ImSpector V10E imaging spectrograph produced by SPECIM (FIN). The SWIR camera with an N25E 2/3” imaging spectrometer (Specim, Oulu, Finland) captured a total of 224 images from each plant leaf, which corresponds to a specific wavelength inside a range of 1000–2500 nm. The system used was briefly described by Siedliska et al. [42].

2.3. Chemical Analysis

After the acquisition of hyperspectral images, leaf samples were cut and transferred to the laboratory for determination of chlorophyll concentration. The chlorophyll content was estimated using a chemical method according to the procedure described by Wellburn and Lichtenthaler [35]. Pigments were extracted with about 0.2 g fresh leaf by 25 mL 80% acetone for 24 h in the dark at room temperature. The absorbance of the extract was measured at 663, 645, and 470 nm using a UV-VIS spectrophotometer (UV-5600, Metash, Japan) to estimate the chlorophyll content. The total leaf nitrogen content was determined using a Leco TruSpec apparatus (St. Joseph, MI, USA). Samples were burned at 950 °C, the resulting analyte was analyzed on a TC thermoconductivity bridge, after converting nitrogen oxides to N2 [43]. Analyses were performed in triplicate for each sample.

2.4. Hyperspectral Image Transformation and Spectral Data Extraction

The captured images were analyzed using software for hyperspectral image analysis (Environment for Visualizing Images, ENVI, Irving, TX, USA). To eliminate the effects of uneven illumination and dark current, black-and-white calibration was conducted on raw images using Equation (1):
R = I r I w I w I d
where R is the corrected reflectance image; Ir is the raw hyperspectral image; Iw and Id represent the white reference image and the dark reference image, respectively [44]. The dark reference image with 0% reflectance was collected when the lights were turned off and the lens was covered with a black cover. Accordingly, the white reference image was acquired from a white diffuse reflectance board with 99% reflectivity (Spectralon, Labsphere Inc., North Sutton, NH, USA). In the next step, a thresholding method was applied to the corrected images for the removal of the background and extraction of the region of interest (the region corresponding to the flat leaf). The mean spectra of each image were extracted from the leaf samples, by averaging the spectra of all the pixels in the corresponding region of interest.

2.5. Spectral Data Preprocessing

Spectra, extracted from hyperspectral images, contained abnormalities such as noises, uncertainties, variabilities, interactions, and unrecognized features, which disrupted the modeling processes. To minimalize these effects, calibrated spectra obtained from the plant leaves were transformed using baseline correction, in which the lowest value was subtracted from all the remaining values in the spectrum. The values below 400 nm and above 2400 nm remained noisy and were abandoned. In addition, values in the 1000–1200 nm range have also been removed, as this range is in the marginal registration zones of both sensors. Then, the second derivative Savitzky–Golay (SG) filter (second-order polynomial fitting and nine-data-points window size) was applied [42,45]. In the process of SG smoothing, the linear least squares method is used to fit a small set of consecutive data points to a polynomial. The calculated central point of the fitted polynomial curve is taken as the new smoothed data point. After this calculation, some data points at both ends of the spectrum are lost in order to allow the filter to be fully contained within the available data [46].
To reduce the high dimensionality, enhance learning efficiency and improve the calculation speed, only some of the wavelengths were selected from the full spectra. These wavelengths bring out the most important information which could efficiently predict nitrogen deficiency in plants growing under different water conditions. In the current study, the most informative wavelengths were determined using a Correlation-based Feature Selection (CFS) algorithm with a greedy stepwise selection method. The data processing methods were implemented using the Unscramble X10.3 software (CAMO Software, Inc., Oslo, Norway, 133).

2.6. Statistical Analysis and Model Development

In this experiment, a factorial design with three factors wasused: plant species, (two variants), the nitrogen supply (four levels), and moisture content (three levels). A total of 216 plants (108 sugar beet and 108 celery plants) belonging to four studied variants were used for the determination of the leaf nitrogen and leaf chlorophyll content. The average of the studied groups was analyzed to evaluate differences among treatments by the analysis of variance (ANOVA) at a significance level of 95% and the Tukey test (p < 0.05) using Statistica software version 13 (StatSoft Inc., Tulsa, OK, USA).
In this study, five different multivariate classification algorithms were chosen for discrimination between N content in plants growing under different water statuses. The studied models represent four different groups: Bayes (Backpropagation neural network—BNN), functions (Support Vector Machine—SVM; Logistic—LOG; Multilayer Perceptron—MP), trees (Random Forest—RF), and lazy (Instance-Based Learning with parameter k—Ibk). Prior to the modeling, 144 leaf samples belonging to each of the variants were numbered consecutively and divided into a calibration set and a validation set with a ratio of 75:25. To determine the performance of the models the accuracy and the root mean square errors of calibration and validation (RMSEC and RMSEV, respectively), were calculated for each model. The best model was characterized by the highest values of overall accuracy and the Kappa coefficient. For the best model, the class parameters, such as true positive rate, true negative rate, precision, recall, and F1 scores were calculated.

3. Results and Discussion

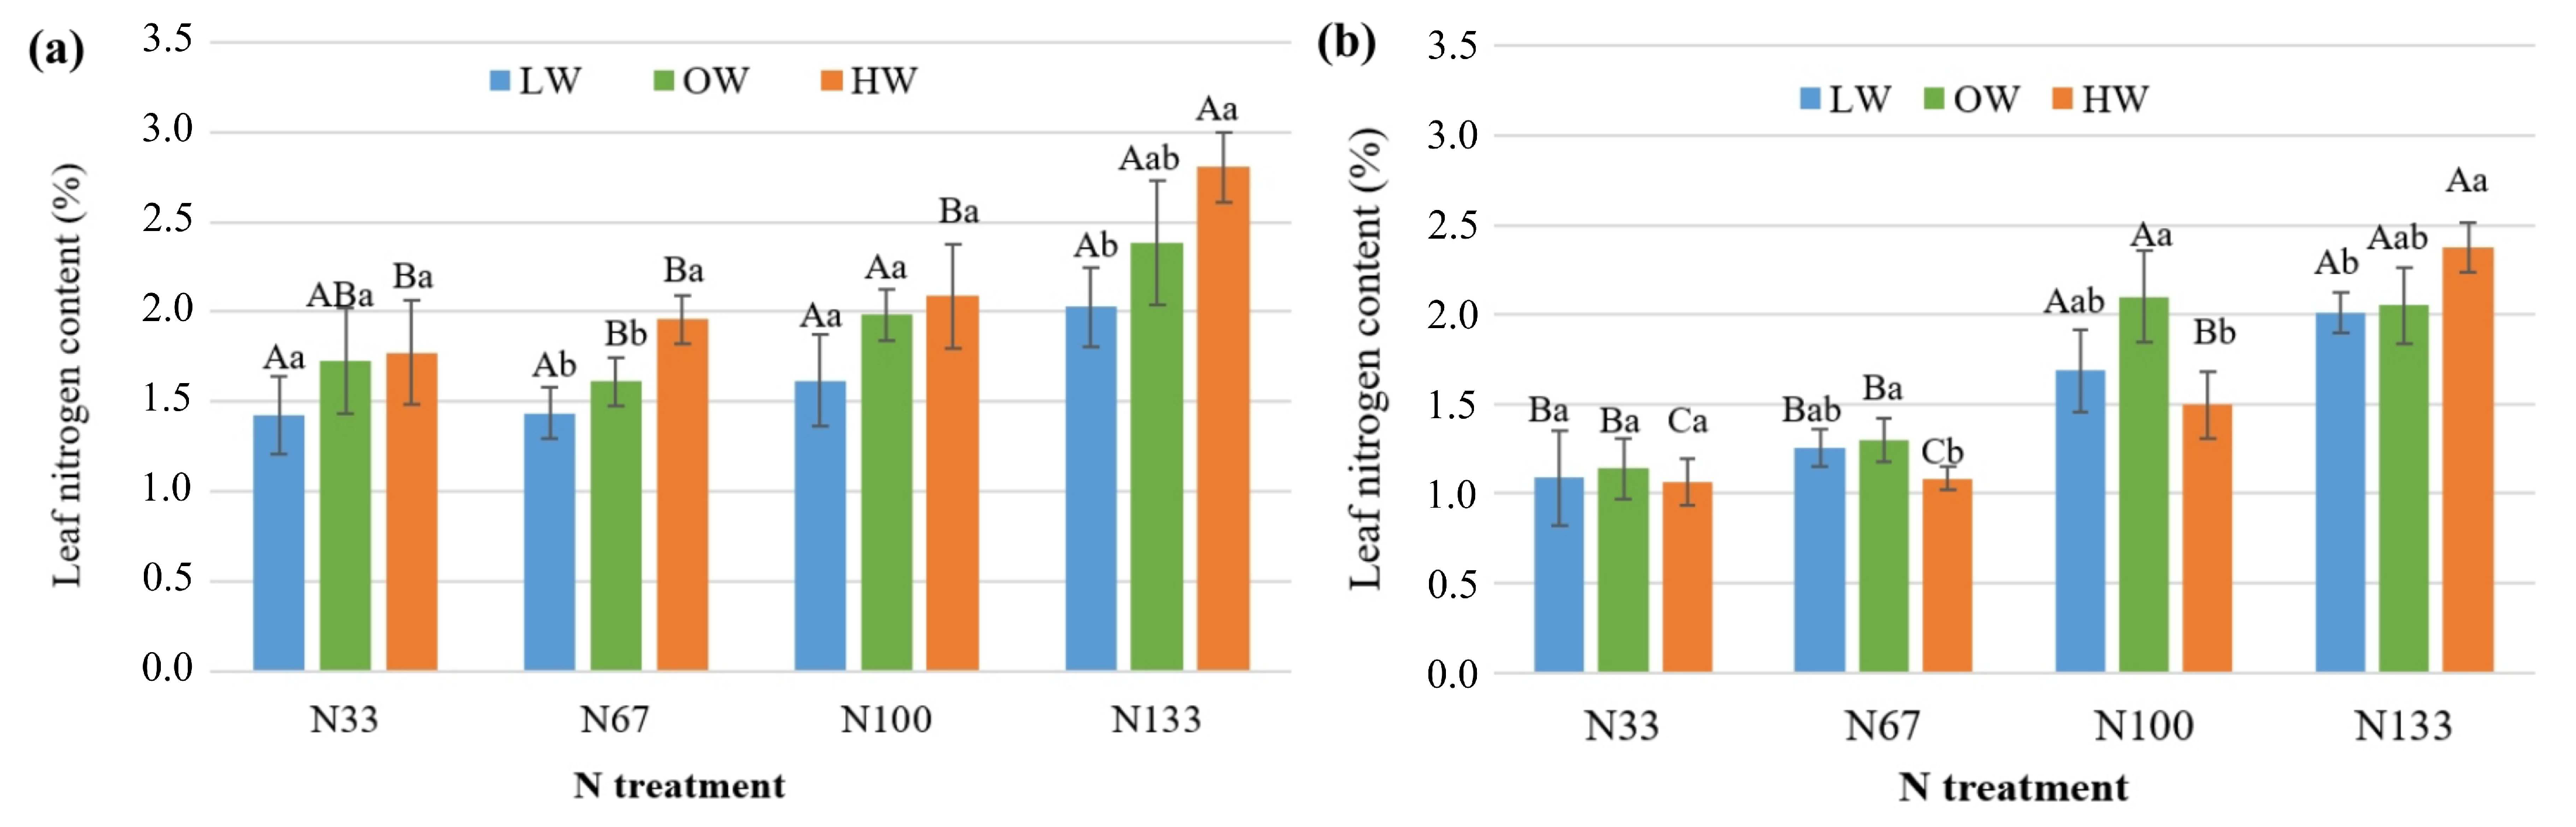
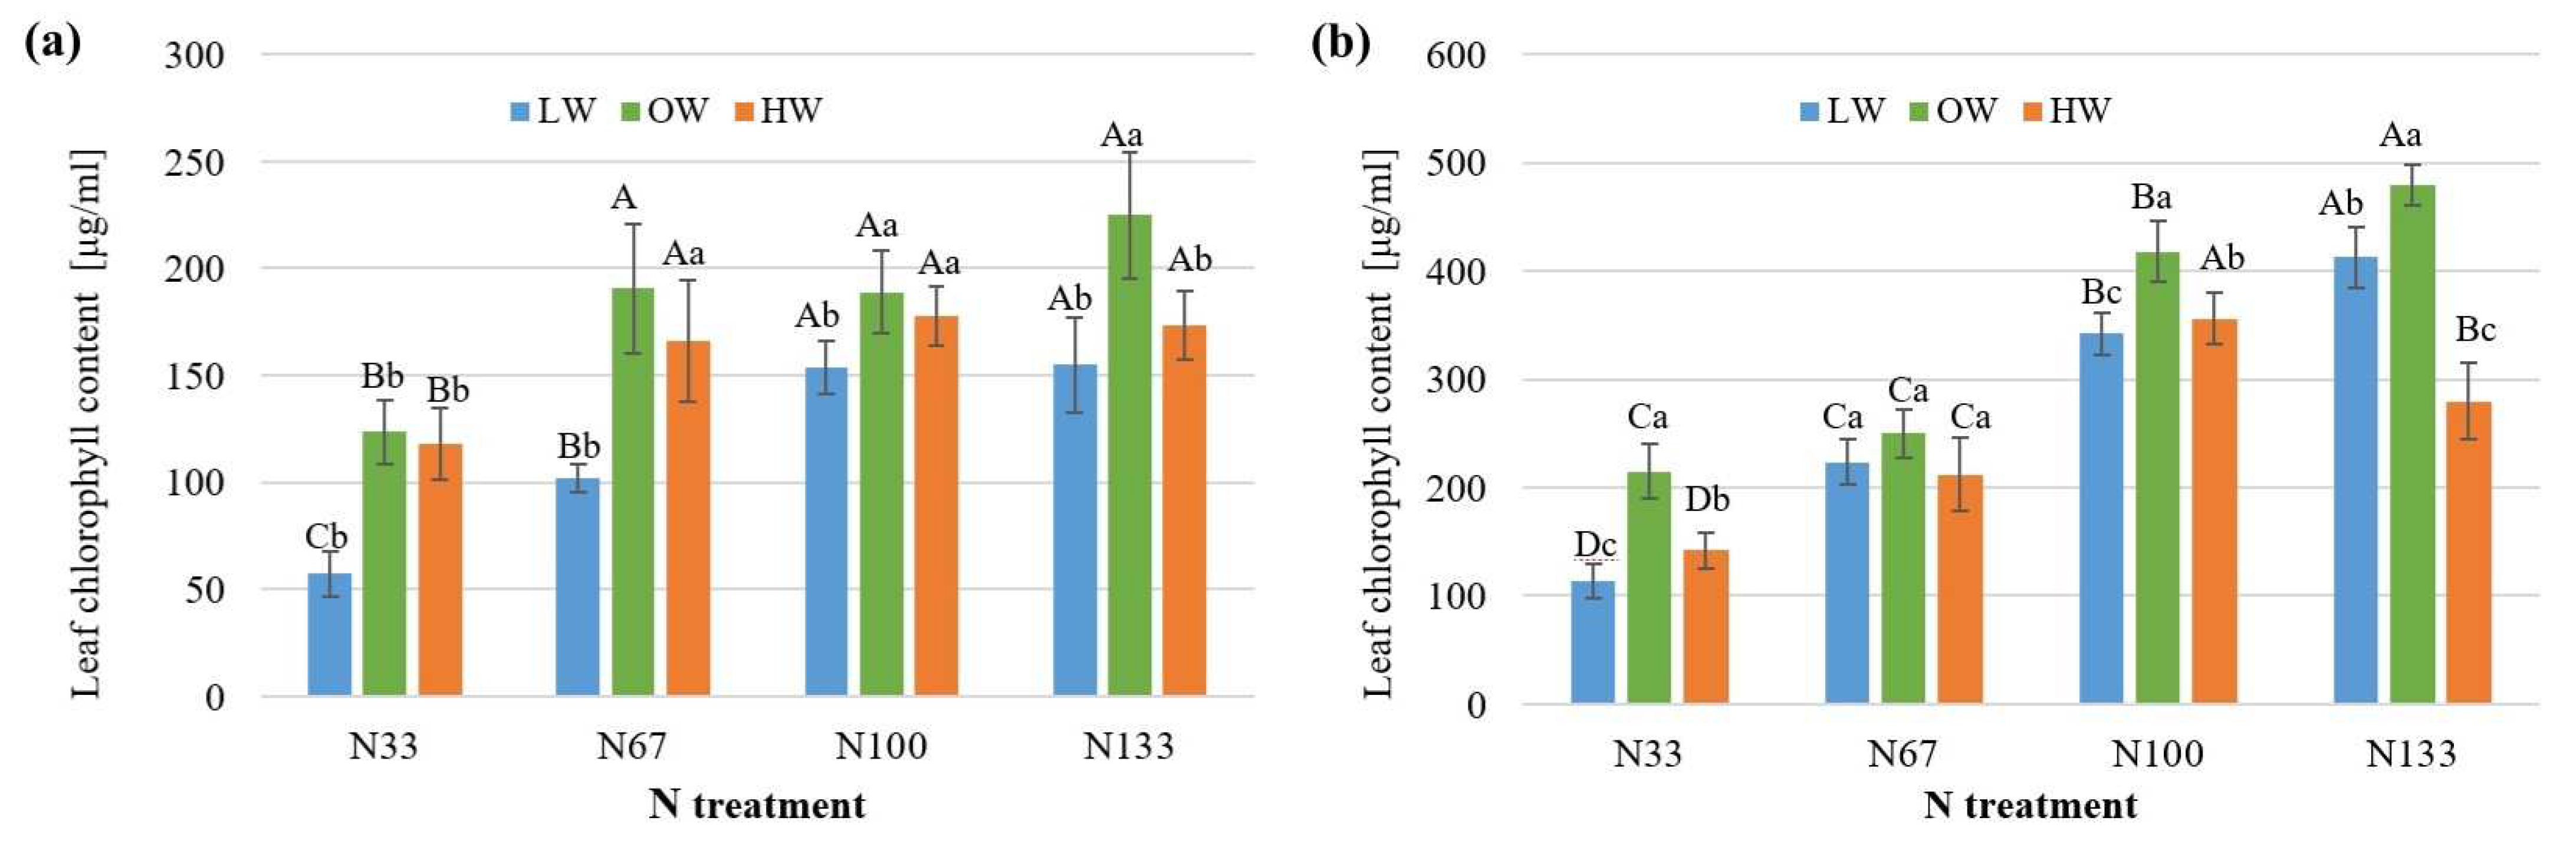
3.1. Nitrogen and Water Stress Impact on Chlorophyll and N Content in Leaves

In order to investigate the effect of different N and water treatments on sugar beet and celery plants, leaf total chlorophyll and leaf N contents were measured. Water stress influences the N availability, movement, and uptake by the crop, which subsequently affects the chlorophyll and nitrogen content in leaves. Water and N interaction has a significant effect on N leaf content in sugar beet (Figure 2a) and celery (Figure 2b) plants. The variation in leaf nitrogen concentration between plants growing under different N fertilization was higher for celery plants than for sugar beet. Higher doses of N fertilization increased leaf N content in LW and OW treatments. Excess water supply (HW) improved the nitrogen accumulation in leaves of sugar beet, whereas the N content in celery leaves decreased, except for the N133 variant. Under the OW condition, the leaf nitrogen content for celery plants in the N33 treatment was as much as 50 % lower than N100, whereas for sugar beet it was only 10% lower. It can be affirmed that the water deficit and the increase in nitrogen levels caused a greater accumulation of nitrogen in the leaves. Previous studies demonstrated that water deficit reduces the activity of nitrate reductase, which, combined with high N content availability in the rhizosphere, favors its absorption by the roots and accumulation in the plant leaves [47].
It could be noted that the exposed sugar beet (Figure 3a) and celery (Figure 3b) plants to N deficiency (N33 and N 67 variants) caused a significant decrease in chlorophyll content in the case of sugar beet, compared to the N100, for all studied water treatment. In the case of celery, the difference is also visible, although much less pronounced. However, a higher than optimum amount of N fertilizer (N133 variant) causes a slow increase in chlorophyll content in celery plant leaves. The excessive N fertilization had a non-significant influence on chlorophyll content in sugar beet. Water stress (water deficit and excessive water stress) decreases the leaf chlorophyll concentration in both studied plants. As a result of the reduction of the chlorophyll content in plant leaves caused by water stress, photosynthesis decline which leads to stunting of the plants and yield reduction. In the literature, conflicting results are reported on the effects of N availability on plant pigment concentrations. Some authors reported that the water deficit led to a reduction in the leaf chlorophyll, which was in line with our findings [47]. However, according to [48] the increase in the N level does not affect leaf chlorophyll content. The pigment content in plant leaves is known as one of the factors that affects the curve of spectral reflectance. Therefore, to develop stable, widely applicable, and highly robust prediction models, the high variability of chlorophyll content between the variants of the experiments are important and necessary.

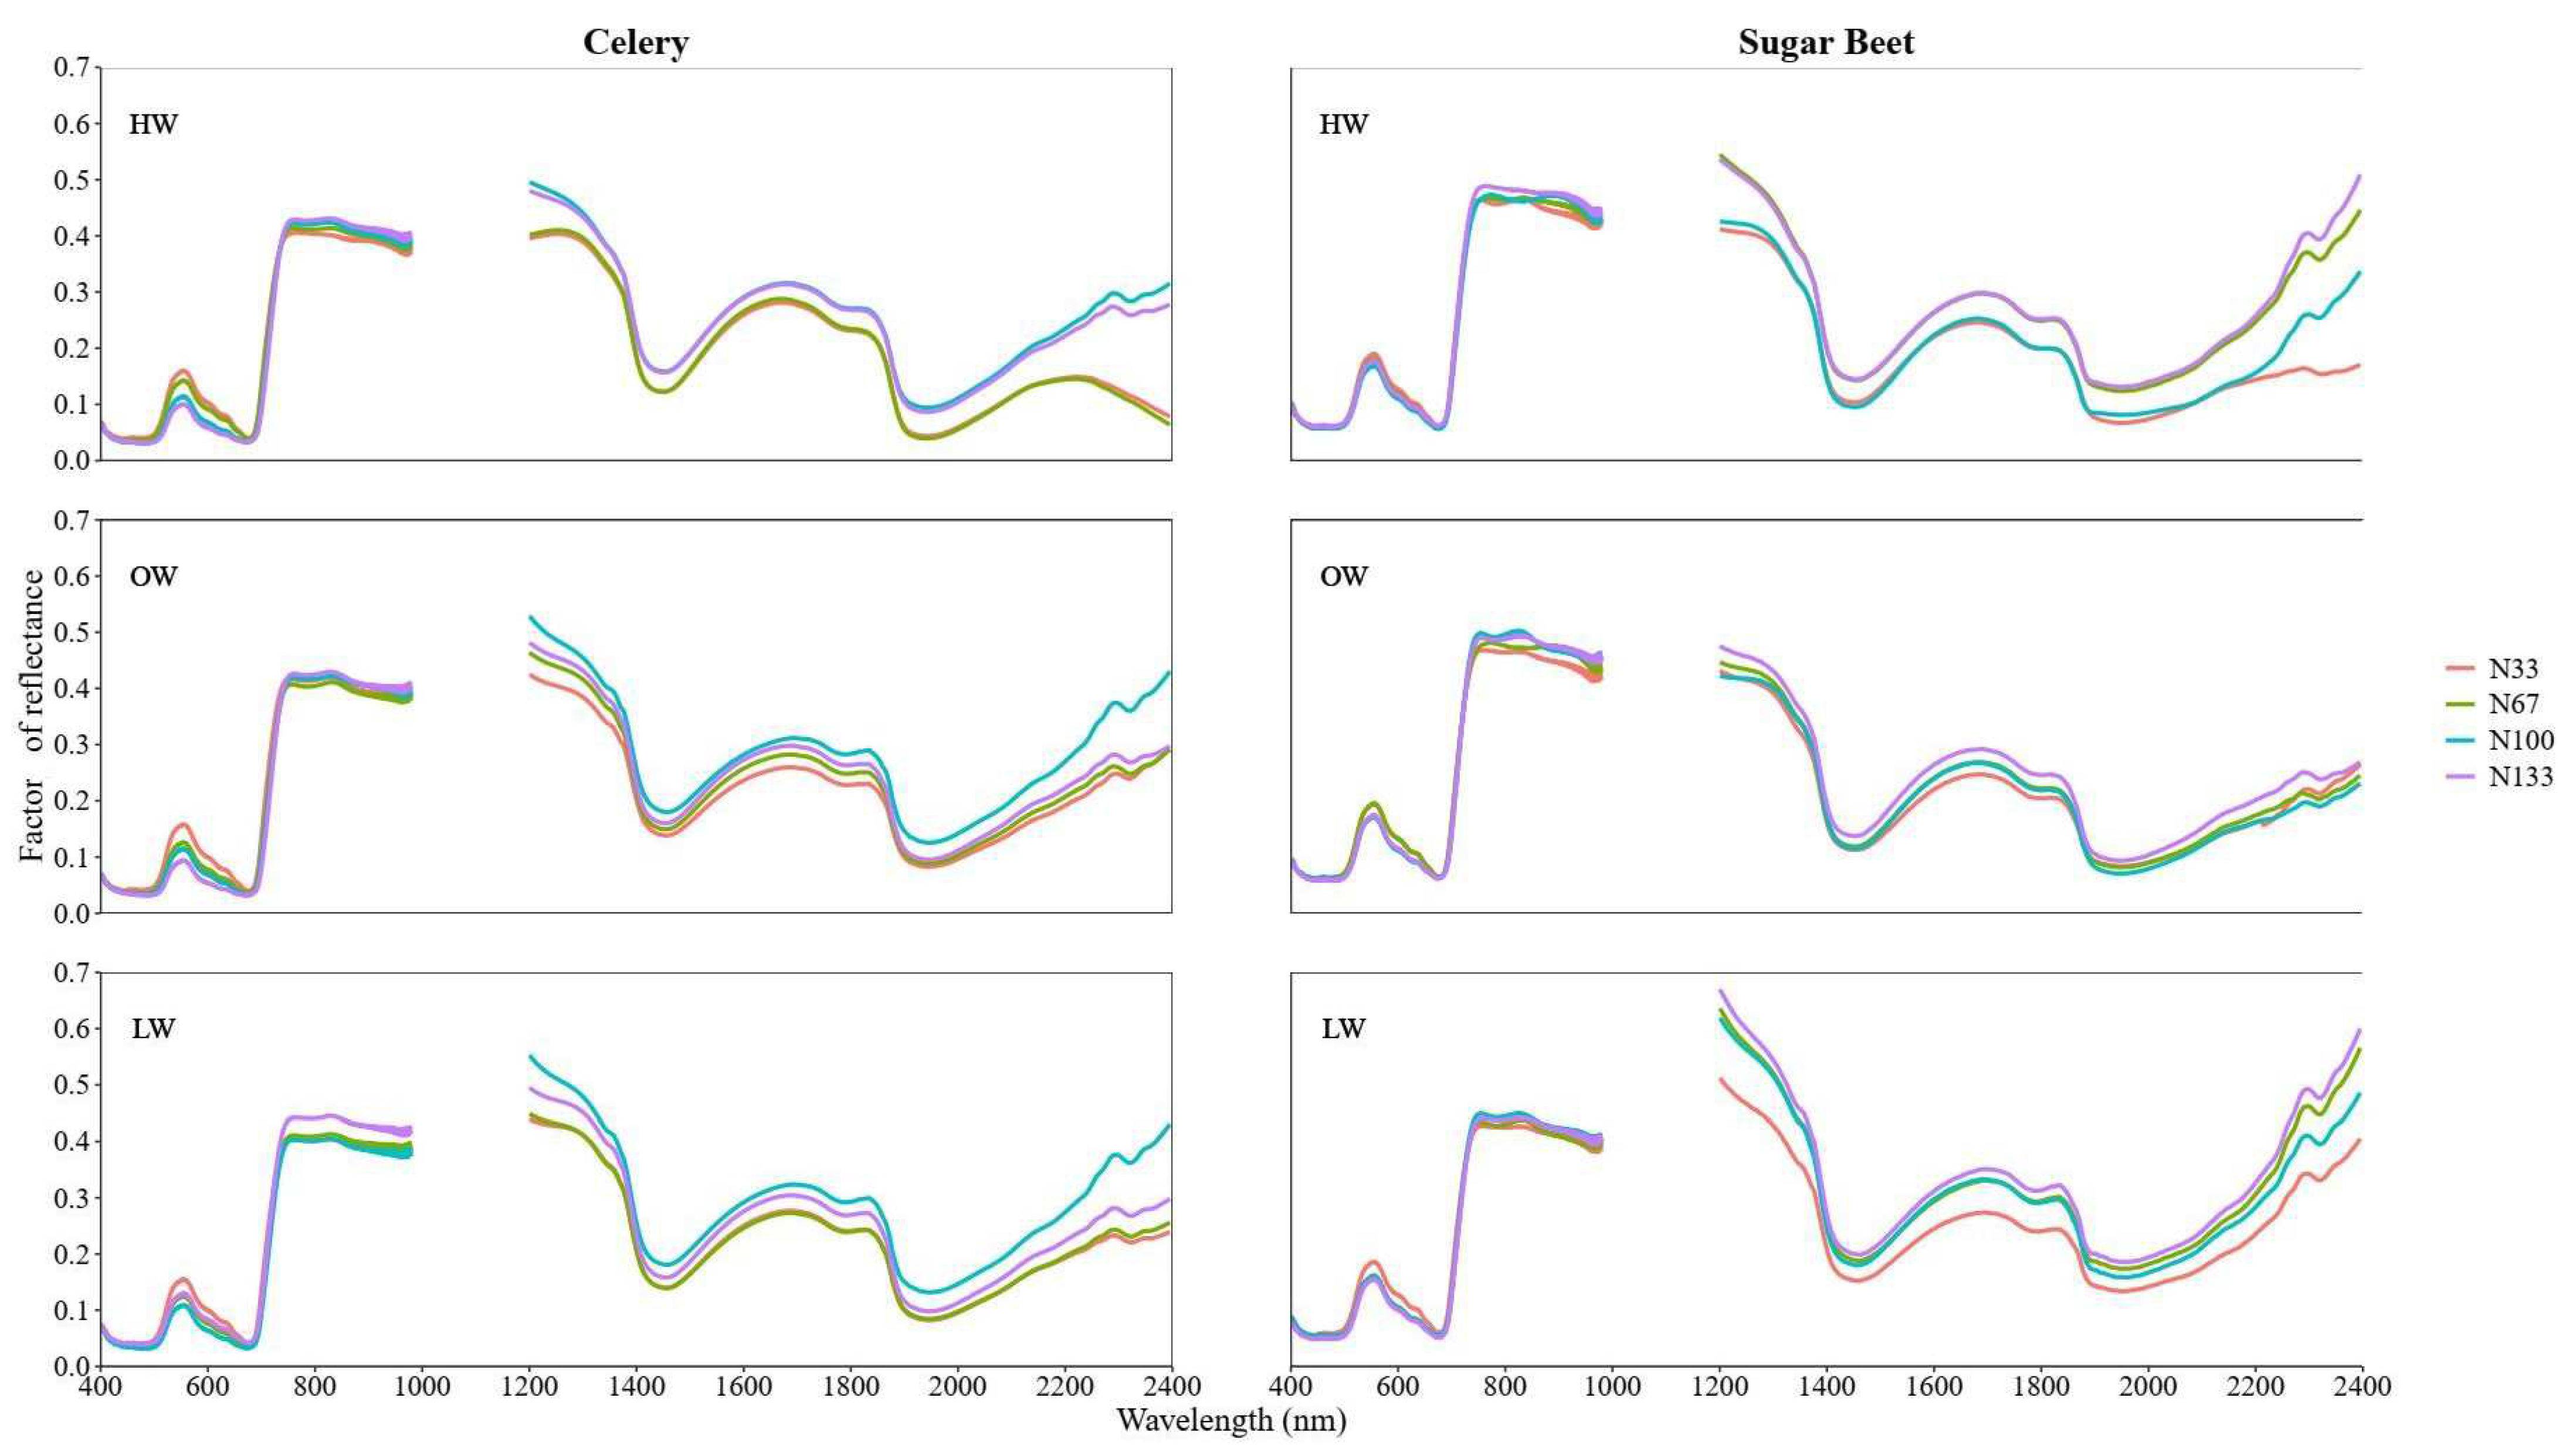
3.2. Spectra Feature

The mean reflectance spectra curves of sugar beet and celery leaf samples with four levels of N treatments growing under different water conditions are shown in Figure 4. All studied variants (N and water treatments) are characterized by a similar profile of the spectral curves. It can be observed that water and N treatment influence leaf reflectance spectra in the whole spectral region for both studied plants. The most important parts of the spectra for discriminating between N stress among water treatment are located in the red and green regions from 525 to 640 nm. It can be observed that the increasing N doses reduced leaf spectral reflectance in this region. This variation was more pronounced for celery than for sugar beet, which may be related to the different internal structures of the leaf structure.
The reflectance peak at around 550 nm is characteristic of green plants and can be correlated with chlorophyll concentration. Zhao et al. observed that about 40 days after plant stress, chlorophyll content decreased by about 60%, resulting in an increase in reflectance in the range of approximately 550 to 710 nm. In the SWIR region, two values (minima): 1410 nm and 1940 nm referred to water content were observed. The differences in leaf reflectance at the SWIR region among all N treatments became more apparent under the OW treatment than the underwater stress (HW and LW). In the region, 1580 to 1850 nm plants growth under N deficiency (N33 and N67) had a lower reflectance value than those with optimal and higher N doses (N100 and N133). However, the spectral separability between the N treatment and HW/LW treatment is lower in SWIR than VNIR region. The spectral signatures obtained by our experimental setup concurred with these previous studies.
Figure 5 presents the relationship between the leaf chlorophyll concentration and features from the second derivative of spectral data based on Pearson’s correlation coefficient. It is featured with a correlation coefficient higher than 0.4 indicating a strong correlation with the leaf nitrogen content. Overall, most of the features showing a strong correlation are in the VNIR range. The highest negative correlations were observed in the regions from 410–500 nm and 750–800 nm. In the region between 800 and 1000 nm, the correlation curve becomes noisy. Some features with strong positive or negative correlations with the leaf N content could be found in the SWIR region. The correlation coefficient decreased for variants with higher water availability (HW) compared to variants with low (LW) and optimal (OW) water supply.

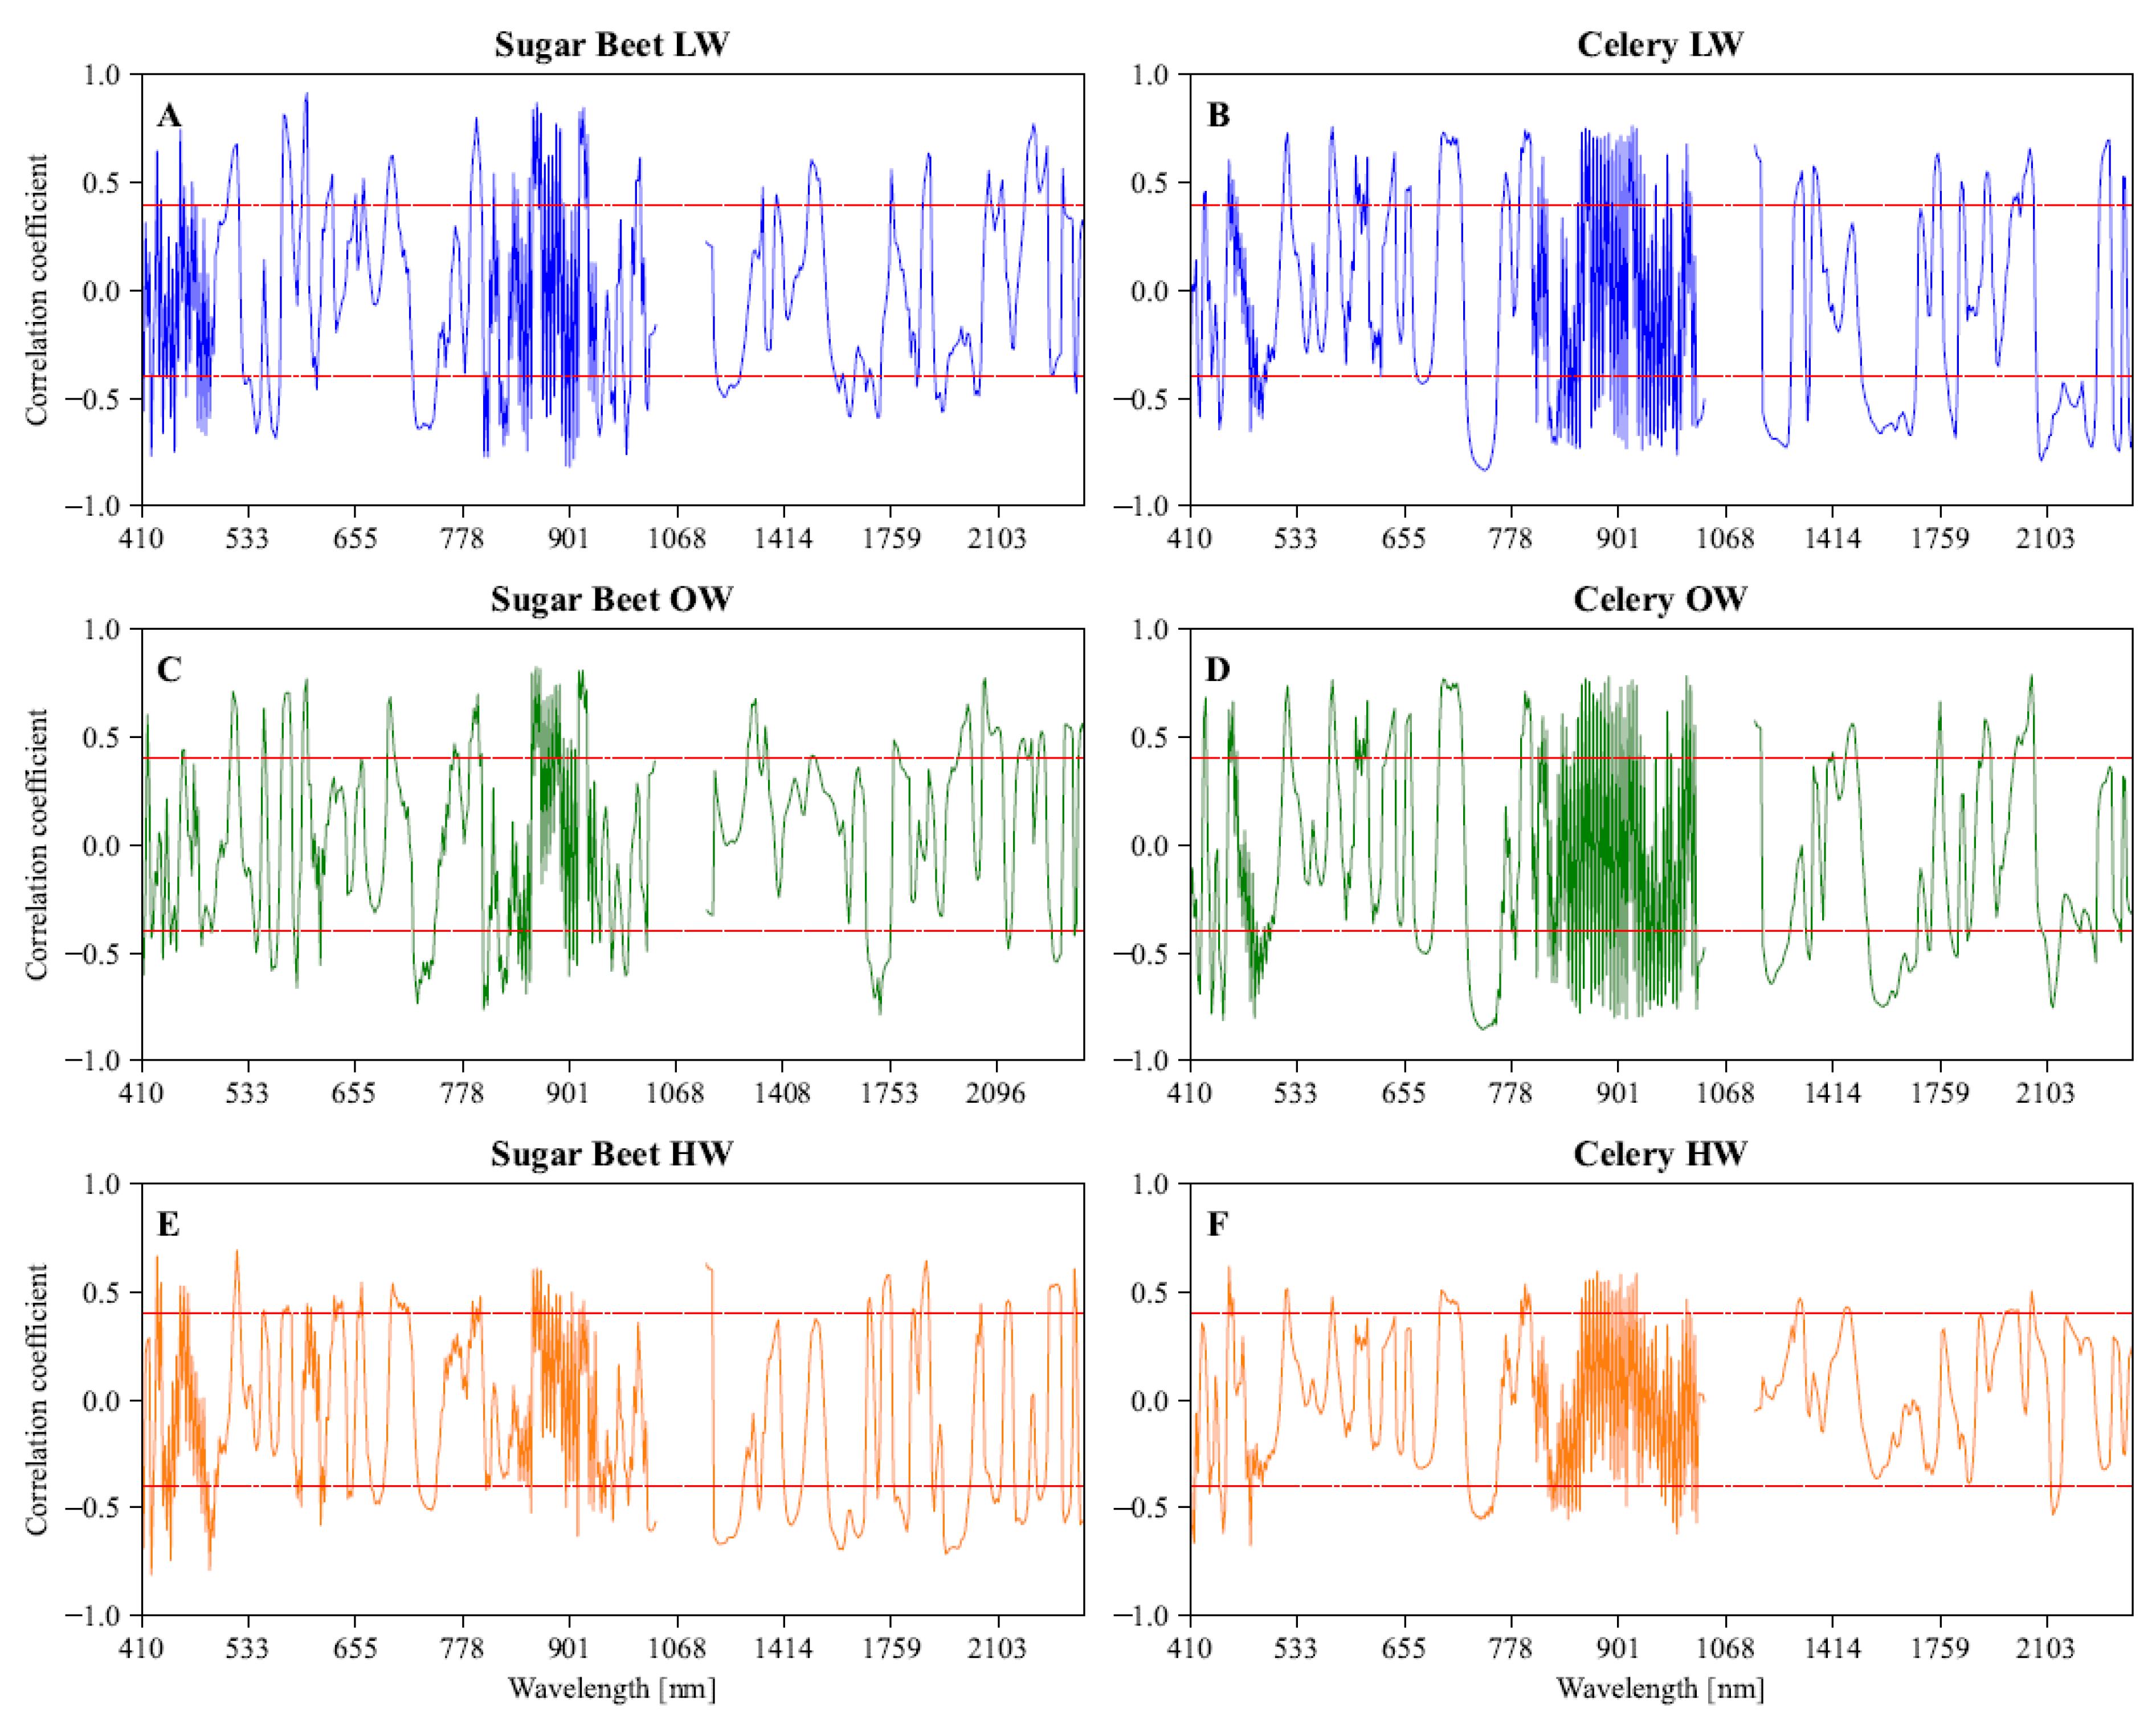
3.3. Effective Wavelengths Selection

Commercial applications of the HIS technique demand data reduction to minimize the processing time and maximize the robustness of the models. Therefore, the selection of an appropriate optimal method for the identification of sensitive features is crucial, especially for large input datasets. In our study, eleven characteristic wavelengths: 418, 434, 521, 644, 659, 740, 796, 994, 1338, 2245, and 2339 nm were selected from the full spectrum using the CFS algorithm with a ‘first is best’ approach. The CFS algorithm evaluates feature subsets based on a degree of dependence or predictability between wavelengths. This algorithm was able to reduce the number of features from 467 to 11, which accounted for 2% of the full number of wavelengths. The wavelengths in the regions of 400–500 nm and 600–750 nm are associated with some of the leaf pigments that control the plant’s photosynthetic and light-use efficiency. The wavelengths closest to 520 nm are sensitive to chlorophyll content, which was indicated in the previous study [49]. The wavelength of 994 nm defined as the water absorption peak corresponded to the second overtone, the O-H stretching vibrational overtone of the water and carbohydrates [50]. Our results are similar to those found in previous studies, which indicated that green, red, and NIR regions are the most sensitive to N stress. Wang et al. [51] selected five optimal wavelengths (520, 553, 673, 693, and 884 nm) for the discrimination of nitrogen fertilizer levels of a tea plant. Other authors found that reflectance in red-edges centered at 740 nm were highly correlated with leaf N content in sorghum and oat [52,53]. Although the possibility of application of the HIS to detect N-stress or the N combination and water stress has been described by many authors, only a few studies have considered the SWIR range. Bruning et al., [54] confirmed that the incorporation of the SWIR wavelengths into the models improved the prediction accuracies of both the water and nitrogen models. The wavebands in the SWIR region are associated with weak harmonic and overtone absorptions from biochemical compounds such as lignin, starch, and cellulose [55]. The N fertilization significantly affects the chemical compositions of plant tissues, including lignin and cellulose content [56,57], thus wavelengths from the SWIR region can also influence the results of discrimination in N treatment.

3.4. Model Performance

In order to discriminate between plants growing with different nitrogen fertilization levels and under different water availability the five algorithms were tested. For these models, the overall accuracy and kappa coefficient used as the evaluation indicator were tabulated in Table 1 and Table 2. The results showed that all studied models achieved overall accuracies of 67–83% and kappa coefficients of 0.59–0.81. It can be stated that the water supply level did not influence model accuracies.
Among all models, the RF method resulted in the highest, whether overall accuracy or kappa coefficient. The overall accuracies were greater than 81% and 78% for sugar beet and celery plants, respectively. The kappa coefficient obtained for sugar beet and celery was higher than 0.74 and 0.70, respectively. The potential of this algorithm for the prediction of leaf N content was confirmed in previous studies [57,58].
The performance of the classification model depends on the ability to accurately forecast the target classes of the unlabeled instances. To demonstrate the class-wise effectiveness of the RF model, the TP rate, FP Rate, precision, recall, and F1 score are presented in Table 3 and Table 4, respectively. Among the two studied plants, the model performance was a little bit better for HW and OW than for LW water treatments. The F1- score, which is calculated as the harmonic mean of the model’s precision and recall, evaluates the accuracy of a model. In the case of both plants, both classes achieved a similar F1 score, ranging from 0.706 to 1.00 and from 0.706 to 0.941 for sugar beet and celery plants, respectively. A good result was obtained for the detection of nitrogen deficiency. The F1 scores for N33 and N67 classes were higher than 0.73 and 0.70 for sugar beet and celery plants, respectively.
Numerous papers were dedicated to estimating the plant nitrogen status using multi- or hyperspectral techniques for various research areas, crops, and growth stages [59,60,61]. Most of these studies focused on the estimation of nitrogen status based on quantitative approaches, which analyze the relationships with the physiological crop parameters and evaluate their performance in distinguishing the nitrogen levels [50,62,63]. This paper is one of only a few studies dedicated to the classification of the plants’ nitrogen status [64,65,66]. The model accuracies obtained in our work were higher than those obtained by Culman et al. [67].

4. Conclusions

Water and nitrogen deficiency are two of the main limiting factors, which has a great influence on plant condition and yield. In this study, hyperspectral and physiological measurements were combined in an attempt to characterize the spectral response of celery and sugar beet to varied nitrogen fertilization under different water availability conditions. The use of remote sensing methods allows for non-invasive research, which increases the possibilities of continuous monitoring of the plants growing conditions. Nitrogen fertilization increased leaf N content in both low and optimal water statuses. Excess water supply (high water) improved the nitrogen accumulation in sugar beet leaves, whereas the N content in celery leaves decreased. Among the tested classifiers, the RF classifier showed the best results in classifying nitrogen content at different water availabilities. In future research, the impact of water availability on the content of other macro elements in plant leaves will be examined.

Author Contributions

Conceptualization, A.S. and M.S.; methodology, A.S. and M.S.; software, A.S.; formal analysis, J.K.; data curation and calculations, A.S. and M.S.; writing—original draft preparation, M.S. and A.S.; editing, M.S. and P.B. (Piotr Bartmiński); supervision, W.K.; project administration, P.B. (Piotr Baranowski); visualization, M.S. and P.B. (Piotr Bartmiński). All authors have read and agreed to the published version of the manuscript.

Funding

This paper was partly financed from funds of the Polish National Centre for Research and Development in frame of the project: “MSINiN”, contract number: BIOSTRATEG3/343547/8/NCBR/2017. The research was partially financed by the National Science Center (NCN-Poland) grant No. 2016/21/D/ST10/01947.

Institutional Review Board Statement

Not applicable.

Informed Consent Statement

Not applicable.

Data Availability Statement

The data presented in this study are available on request from the corresponding author.

Conflicts of Interest

The authors declare no conflict of interest.

References

  1. Fageria, N.K.; Baligar, V.C.; Li, Y.C. The role of rutrient efficient plants in pmproving prop yields in the twenty first century. J. Plant Nutr. 2008, 31, 1121–1157. [Google Scholar] [CrossRef]
  2. Chandini, K.R.; Kumar, R.; Kumar, R.; Prakash, O. The impact of chemical fertilizers on our environment and ecosystem. Res. Trends Environ. Sci. 2019, 35, 69–86. [Google Scholar]
  3. Mosier, A.; Syers, J.K.; Freney, J.R. Agriculture and the Nitrogen Cycle: Assessing the Impacts of Fertilizer Use on Food Production and the Environment; Island Press: Washington, DC, USA, 2013; ISBN 978-1-59726-743-4. [Google Scholar]
  4. Savci, S. Investigation of effect of chemical fertilizers on environment. APCBEE Procedia 2012, 1, 287–292. [Google Scholar] [CrossRef]
  5. Chen, Y.; Guerschman, J.P.; Cheng, Z.; Guo, L. Remote sensing for vegetation monitoring in carbon capture storage regions: A review. Appl. Energy 2019, 240, 312–326. [Google Scholar] [CrossRef]
  6. Bremner, J.M. Recent research on problems in the use of urea as a nitrogen fertilizer. In Nitrogen Economy in Tropical Soils: Proceedings of the International Symposium on Nitrogen Economy in Tropical Soils, St. Augustine, Trinidad West Indies, 9–14 January 1994; Springer: Dordrecht, The Netherlands, 1995. [Google Scholar]
  7. Binder, D.L.; Sander, D.H.; Walters, D.T. Maize response to time of nitrogen application as affected by level of nitrogen deficiency. Agron. J. 2000, 92, 1228–1236. [Google Scholar] [CrossRef]
  8. Alloway, B.J. Micronutrient Deficiencies in Global Crop Production; Springer Science & BusinessMedia: Berlin/Heidelberg, Germany, 2008; ISBN 978-1-4020-6860-7. [Google Scholar]
  9. Hossain, M.A.; Siddique, M.N.A. Online Fertilizer Recommendation System (OFRS): A Step Towards Precision Agriculture And Optimized Fertilizer Usage By Smallholder Farmers In Bangladesh: Online fertilizer recommendation. Eur. J. Environ. Earth Sci. 2020, 1, 1–9. [Google Scholar] [CrossRef]
  10. Mitra, S. Jackfruit: Botany, Production and Uses; CABI: Warlingford, UK, 2023; ISBN 978-1-80062-229-6. [Google Scholar]
  11. Tudor, V.C.; Stoicea, P.; Chiurciu, I.-A.; Soare, E.; Iorga, A.M.; Dinu, T.A.; David, L.; Micu, M.M.; Smedescu, D.I.; Dumitru, E.A. The Use of Fertilizers and Pesticides in Wheat Production in the Main European Countries. Sustainability 2023, 15, 3038. [Google Scholar] [CrossRef]
  12. Ward, G.M.; Johnston, F.B. Chemical method of plant analysis. Publ. Dep. Agric. Can. 1960, 1064, 59. [Google Scholar]
  13. Marín Del Valle, T.; Jiang, P. Comparison of common classification strategies for large-scale vegetation mapping over the Google Earth Engine platform. Int. J. Appl. Earth Obs. Geoinf. 2022, 115, 103092. [Google Scholar] [CrossRef]
  14. Joshi, N.; Baumann, M.; Ehammer, A.; Fensholt, R.; Grogan, K.; Hostert, P.; Jepsen, M.R.; Kuemmerle, T.; Meyfroidt, P.; Mitchard, E.T.A. A Review of the application of Optical and Radar remote sensing data fusion to land use mapping and monitoring. Remote Sens. 2016, 8, 70. [Google Scholar] [CrossRef]
  15. Eberhardt, L.L.; Thomas, J.M. Designing environmental field studies. Ecol. Monogr. 1991, 61, 53–73. [Google Scholar] [CrossRef]
  16. Asaari, M.S.M.; Mishra, P.; Mertens, S.; Dhondt, S.; Inzé, D.; Wuyts, N.; Scheunders, P. Close-range hyperspectral image analysis for the early detection of stress responses in individual plants in a high-throughput phenotyping platform. ISPRS J. Photogramm. Remote Sens. 2018, 138, 121–138. [Google Scholar] [CrossRef]
  17. Asaari, M.S.M.; Mertens, S.; Dhondt, S.; Inzé, D.; Wuyts, N.; Scheunders, P. A Analysis of hyperspectral images for detection of drought stress and recovery in maize plants in a high-throughput phenotyping platform. Comput. Electron. Agric. 2019, 162, 749–758. [Google Scholar] [CrossRef]
  18. Lowe, A.; Harrison, N.; French, A.P. Hyperspectral image analysis techniques for the detection and classification of the early onset of plant disease and stress. Plant Methods 2017, 13, 80. [Google Scholar] [CrossRef]
  19. El-Hendawy, S.; Al-Suhaibani, N.; Hassan, W.; Tahir, M.; Schmidhalter, U. Hyperspectral reflectance sensing to assess the growth and photosynthetic properties of wheat cultivars exposed to different irrigation rates in an irrigated arid region. PLoS ONE 2017, 12, e0183262. [Google Scholar] [CrossRef]
  20. Gehards, M.; Schlerf, M.; Mallick, K.; Udelhoven, T. Challenges and Future Perspectives of Multi-/Hyperspectral Thermal Infrared Remote Sensing for Crop Water-Stress Detection: A Review. Remote Sens. 2019, 11, 1240. [Google Scholar] [CrossRef]
  21. Crusiol, L.G.T.; Nanni, M.R.; Furlanetto, R.H.; Sibaldelli, R.N.R.; Sun, L.; Gonçalves, S.L.; Foloni, J.S.S.; Mertz-Henning, L.M.; Nepomuceno, A.L.; Neumaier, N. Assessing the sensitive spectral bands for soybean water status monitoring and soil moisture prediction using leaf-based hyperspectral reflectance. Agric. Water Manag. 2023, 277, 108089. [Google Scholar] [CrossRef]
  22. Mahajan, G.R.; Pandey, R.N.; Sahoo, R.N.; Gupta, V.K.; Datta, S.C.; Kumar, D. Monitoring nitrogen, phosphorus and sulphur in hybrid rice (Oryza sativa L.) using hyperspectral remote sensing. Precis. Agric. 2017, 18, 736–761. [Google Scholar] [CrossRef]
  23. Singh, H.; Roy, A.; Setia, R.; Pateriya, B. Estimation of chlorophyll, macronutrients and water content in maize from hyperspectral data using machine learning and explainable artificial intelligence techniques. Remote Sens. Lett. 2022, 13, 969–979. [Google Scholar] [CrossRef]
  24. Jørgensen, R.N.; Christensen, L.K.; Bro, R. Spectral reflectance at sub-leaf scale including the spatial distribution discriminating NPK stress characteristics in barley using multiway partial least squares regression. Int. J. Remote Sens. 2007, 28, 943–962. [Google Scholar] [CrossRef]
  25. Hongyu, L.; Hanping, M.; Wenjing, Z.; Xiaodong, Z.; Hongyan, G. Rapid diagnosis of tomato NPK nutrition level based on hyperspectral technology. Trans. Chin. Soc. Agric. Eng. 2015, 31, 212–220. [Google Scholar] [CrossRef]
  26. Mallet, Y.; Coomans, D.; deVel, O. Recent developments in discriminant analysis on high dimensional spectral data. Chemom. Intell. Lab. Syst. 1996, 35, 157–173. [Google Scholar] [CrossRef]
  27. Ravikanth, L.; Jayas, D.S.; White, N.D.G.; Fields, P.G.; Sun, D.-W. Extraction of spectral information from hyperspectral data and application of hyperspectral imaging for food and agricultural products. Food Bioprocess Technol. 2017, 10, 1–33. [Google Scholar] [CrossRef]
  28. Shi, Y.; Huang, W.; Luo, J.; Huang, L.; Zhou, X. Detection and discrimination of pests and diseases in winter wheat based on spectral indices and kernel discriminant analysis. Comput. Electron. Agric. 2017, 141, 171–180. [Google Scholar] [CrossRef]
  29. Munyati, C.; Balzter, H.; Economon, E. Correlating Sentinel-2 MSI-derived vegetation indices with in-situ reflectance and tissue macronutrients in savannah grass. Int. J. Remote Sens. 2020, 41, 3820–3844. [Google Scholar] [CrossRef]
  30. Oliveira, L.F.R.; Oliveira, M.L.R.; Gomes, F.S.; Santana, R.C. Estimating foliar nitrogen in Eucalyptus using vegetation indexes. Sci. Agric. (Piracicaba Braz.) 2017, 74, 142–147. [Google Scholar] [CrossRef]
  31. Rodrigues, M.; Cezar, E.; Argenta, J.C.; Barcelos, L.B.; Reis, A.S.; dos Santos, G.L.A.A.; Oliveira, K.M.; Oliveira, R.B.; Rafael Nanni, M. Relationship Between Vegetation Indices, Nutrients Content, and the Biomass Production of Brachiaria (Brachiaria ruziziensis). Commun. Soil Sci. Plant Anal. 2022, 53, 2400–2419. [Google Scholar] [CrossRef]
  32. Yang, H.; Yin, H.; Li, F.; Hu, Y.; Yu, K. Machine learning models fed with optimized spectral indices to advance crop nitrogen monitoring. Field Crops Res. 2023, 293, 108844. [Google Scholar] [CrossRef]
  33. Li, H.; Yang, G.; Long, H.; Feng, H.; Xu, B.; Zhao, C. Estimating characteristic coefficient of vertical leaf nitrogen profile within wheat canopy from spectral reflectance. Comput. Electron. Agric. 2023, 206, 107652. [Google Scholar] [CrossRef]
  34. Filella, I.; Serrano, L.; Serra, J.; Peñuelas, J. Evaluating wheat nitrogen status with canopy reflectance indices and discriminant analysis. Crop Sci. 1995, 35, 1400–1405. [Google Scholar] [CrossRef]
  35. Sibanda, M.; Mutanga, O.; Rouget, M.; Odindi, J. Exploring the potential of in situ hyperspectral data and multivariate techniques in discriminating different fertilizer treatments in grasslands. JARS 2015, 9, 096033. [Google Scholar] [CrossRef]
  36. Strachan, I.B.; Pattey, E.; Boisvert, J.B. Impact of nitrogen and environmental conditions on corn as detected by hyperspectral reflectance. Remote Sens. Environ. 2002, 80, 213–224. [Google Scholar] [CrossRef]
  37. Thomas, S.; Kuska, M.T.; Bohnenkamp, D.; Brugger, A.; Alisaac, E.; Wahabzada, M.; Behmann, J.; Mahlein, A.-K. Benefits of hyperspectral imaging for plant disease detection and plant protection: A technical perspective. J. Plant Dis. Prot. 2018, 125, 5–20. [Google Scholar] [CrossRef]
  38. Jarecki, W. Production of selected crop plants in Poland over the period of 2010-2019. Acta Agrophysica 2020, 27, 39–45. [Google Scholar] [CrossRef]
  39. Alam, H.; Khattak, J.Z.K.; Ksiksi, T.S.; Saleem, M.H.; Fahad, S.; Sohail, H.; Ali, Q.; Zamin, M.; El-Esawi, M.A.; Saud, S.; et al. Negative impact of long-term exposure of salinity and drought stress on native Tetraena mandavillei L. Physiol. Plant. 2021, 172, 1336–1351. [Google Scholar] [CrossRef] [PubMed]
  40. Ikram, M.; Raja, N.I.; Javed, B.; Mashwani, Z.-R.; Hussain, M.; Hussain, M.; Ehsan, M.; Rafique, N.; Malik, K.; Sultana, T. Foliar applications of bio-fabricated selenium nanoparticles to improve the growth of wheat plants under drought stress. Green Process. Synth. 2020, 9, 706–714. [Google Scholar] [CrossRef]
  41. Ullah, A.; Romdhane, L.; Rehman, A.; Farooq, M. Adequate zinc nutrition improves the tolerance against drought and heat stresses in chickpea. Plant Physiol. Biochem. 2019, 143, 11–18. [Google Scholar] [CrossRef]
  42. Siedliska, A.; Baranowski, P.; Pastuszka-Woźniak, J.; Zubik, M.; Krzyszczak, J. Identification of plant leaf phosphorus content at different growth stages based on hyperspectral reflectance. BMC Plant Biol. 2021, 21, 28. [Google Scholar] [CrossRef]
  43. Matejovic, I. Total nitrogen in plant material determinated by means of dry combustion: A possible alternative to determination by Kjeldahl digestion. Commun. Soil Sci. Plant Anal. 1995, 26, 2217–2229. [Google Scholar] [CrossRef]
  44. Abdlaty, R.; Doerwald-Munoz, L.; Farrell, T.J.; Hayward, J.E.; Fang, Q. Hyperspectral imaging assessment for radiotherapy induced skin-erythema: Pilot study. Photodiagnosis Photodyn. Ther. 2021, 33, 102195. [Google Scholar] [CrossRef]
  45. Li, Y.; Tan, X.; Zhang, W.; Jiao, Q.; Xu, Y.; Li, H.; Zou, Y.; Yang, L.; Fang, Y. Research and application of several key techniques in hyperspectral image preprocessing. Front. Plant Sci. 2021, 12, 627865. [Google Scholar] [CrossRef]
  46. King, R.L.; Ruffin, C.; LaMastus, F.E.; Shaw, D.R. The analysis of hyperspectral data using Savitzky-Golay filtering-practical issues. 2. In Proceedings of the IEEE 1999 International Geoscience and Remote Sensing Symposium. IGARSS’99 (Cat. No.99CH36293), Hamburg, Germany, 28 June–2 July 1999; Volume 1. pp. 398–400. [Google Scholar]
  47. Zhang, Y.J.; Xie, Z.K.; Wang, Y.J.; Su, P.X.; An, L.P.; Gao, H. Effect of water stress on leaf photosynthesis, chlorophyll content, and growth of oriental lily. Russ. J. Plant Physiol. 2011, 58, 844–850. [Google Scholar] [CrossRef]
  48. Kopsell, D.A.; Kopsell, D.E.; Curran-Celentano, J. Carotenoid pigments in kale are influenced by nitrogen concentration and form. J. Sci. Food Agric. 2007, 87, 900–907. [Google Scholar] [CrossRef]
  49. He, J.; Yang, W.; Qin, L.; Fan, D.-Y.; Chow, W.S. Photoinactivation of Photosystem II in wild-type and chlorophyll b-less barley leaves: Which mechanism dominates depends on experimental circumstances. Photosynth. Res. 2015, 126, 399–407. [Google Scholar] [CrossRef]
  50. Colovic, M.; Yu, K.; Todorovic, M.; Cantore, V.; Hamze, M.; Albrizio, R.; Stellacci, A.M. Hyperspectral vegetation indices to assess water and nitrogen status of sweet maize crop. Agronomy 2022, 12, 2181. [Google Scholar] [CrossRef]
  51. Wang, Y.; Hu, X.; Hou, Z.; Ning, J.; Zhang, Z. Discrimination of nitrogen fertilizer levels of tea plant (Camellia sinensis) based on hyperspectral imaging. J. Sci. Food Agric. 2018, 98, 4659–4664. [Google Scholar] [CrossRef]
  52. Zhao, B.; Ma, B.-L.; Hu, Y.; Liu, J. Characterization of nitrogen and water status in oat leaves using optical sensing approach. J. Sci. Food Agric. 2015, 95, 367–378. [Google Scholar] [CrossRef]
  53. Zhao, D.; Reddy, K.R.; Kakani, V.G.; Reddy, V.R. Nitrogen deficiency effects on plant growth, leaf photosynthesis, and hyperspectral reflectance properties of sorghum. Eur. J. Agron. 2005, 22, 391–403. [Google Scholar] [CrossRef]
  54. Bruning, B.; Liu, H.; Brien, C.; Berger, B.; Lewis, M.; Garnett, T. The Development of Hyperspectral Distribution Maps to Predict the Content and Distribution of Nitrogen and Water in Wheat (Triticum aestivum). Front. Plant Sci. 2019, 10, 1380. [Google Scholar] [CrossRef]
  55. Hennessy, A.; Clarke, K.; Lewis, M. Hyperspectral classification of plants: A review of waveband selection generalisability. Remote Sens. 2020, 12, 113. [Google Scholar] [CrossRef]
  56. Liu, J.; Wu, N.; Wang, H.; Sun, J.; Peng, B.; Jiang, P.; Bai, E. Nitrogen addition affects chemical compositions of plant tissues, litter and soil organic matter. Ecology 2016, 97, 1796–1806. [Google Scholar] [CrossRef] [PubMed]
  57. Loozen, Y.; Rebel, K.T.; deJong, S.M.; Lu, M.; Ollinger, S.V.; Wassen, M.J.; Karssenberg, D. Mapping canopy nitrogen in European forests using remote sensing and environmental variables with the random forests method. Remote Sens. Environ. 2020, 247, 111933. [Google Scholar] [CrossRef]
  58. Abdel- Rahman, E.M.; Ahmed, F.B.; Ismail, R. Random forest regression and spectral band selection for estimating sugarcane leaf nitrogen concentration using EO-1 Hyperion hyperspectral data. Int. J. Remote Sens. 2013, 34, 712–728. [Google Scholar] [CrossRef]
  59. Zhang, J.; Cheng, T.; Shi, L.; Wang, W.; Niu, Z.; Guo, W.; Ma, X. Combining spectral and texture features of UAV hyperspectral images for leaf nitrogen content monitoring in winter wheat. Int. J. Remote Sens. 2022, 43, 2335–2356. [Google Scholar] [CrossRef]
  60. Han, N.; Zhang, B.; Liu, Y.; Peng, Z.; Zhou, Q.; Wei, Z. Rapid Diagnosis of Nitrogen Nutrition Status in Summer Maize over Its Life Cycle by a Multi-Index Synergy Model Using Ground Hyperspectral and UAV Multispectral Sensor Data. Atmosphere 2022, 13, 122. [Google Scholar] [CrossRef]
  61. Yin, C.; Lv, X.; Zhang, L.; Ma, L.; Wang, H.; Zhang, L.; Zhang, Z. Hyperspectral UAV Images at Different Altitudes for Monitoring the Leaf Nitrogen Content in Cotton Crops. Remote Sens. 2022, 14, 2576. [Google Scholar] [CrossRef]
  62. Olson, M.B.; Crawford, M.M.; Vyn, T.J. Hyperspectral indices for predicting nitrogen use efficiency in maize hybrids. Remote Sens. 2022, 14, 1721. [Google Scholar] [CrossRef]
  63. Fan, K.; Li, F.; Chen, X.; Li, Z.; Mulla, D.J. Nitrogen Balance Index Prediction of Winter Wheat by Canopy Hyperspectral Transformation and Machine Learning. Remote Sens. 2022, 14, 3504. [Google Scholar] [CrossRef]
  64. Benmouna, B.; Pourdarbani, R.; Sabzi, S.; Fernandez-Beltran, R.; García-Mateos, G.; Molina-Martínez, J.M. Comparison of Classic Classifiers, Metaheuristic Algorithms and Convolutional Neural Networks in Hyperspectral Classification of Nitrogen Treatment in Tomato Leaves. Remote Sens. 2022, 14, 6366. [Google Scholar] [CrossRef]
  65. de FátimadaSilva, F.; Luz, P.H.C.; Romualdo, L.M.; Marin, M.A.; Zúñiga, A.M.G.; Herling, V.R.; Bruno, O.M. A diagnostic tool for magnesium nutrition in maize based on image analysis of different leaf sections. Crop Sci. 2014, 54, 738–745. [Google Scholar] [CrossRef]
  66. Sun, Y.; Gao, J.; Wang, K.; Shen, Z.; Chen, L. Utilization of machine vision to monitor the dynamic responses of rice leaf morphology and colour to nitrogen, phosphorus, and potassium deficiencies. J. Spectrosc. 2018, 2018, e1469314. [Google Scholar] [CrossRef]
  67. Culman, M.A.; Gomez, J.A.; Talavera, J.; Quiroz, L.A.; Tobon, L.E.; Aranda, J.M.; Garreta, L.E.; Bayona, C.J.A. A novel application for identification of nutrient deficiencies in oil palm using the internet of things. In Proceedings of the 2017 5th IEEE International Conference on Mobile Cloud Computing, Services, and Engineering (MobileCloud), San Francisco, CA, USA, 6–7 April 2017; pp. 169–172. [Google Scholar]
Figure 1. Flow chart of the analysis conducted during the experiment. The procedures presented are described in the text.
Applsci 13 06072 g001
Figure 2. Leaf nitrogen content of sugar beet (a) and celery (b) plants in accordance with four nitrogen supplies and three water treatments. Each bar represents the mean ± SD of 3 plants in each group. According to two-way ANOVA and Tukey’s test, distinct uppercase letters indicate statistical differences among the different N supplies and the same water treatment. Distinct lowercase letters indicate significant differences between the different water treatments and the same N supply. For each graph values followed by the same letter are not significantly different (p > 0.05). LW: low water supply, OW: optimum water supply, HW: high water supply.
Applsci 13 06072 g002
Figure 3. Leaf chlorophyll content of sugar beet (a) and celery (b) plants in accordance with four nitrogen supplies and three water treatments. Each bar represents the mean ± SD of 3 plants in each group. According to two-way ANOVA and Tukey’s test, distinct uppercase letters indicate statistical differences among the different N supplies and the same water treatment. Distinct lowercase letters indicate significant differences between the different water treatments and the same N supply. For each graph values followed by the same letter are not significantly different (p > 0.05). LW: low water supply, OW: optimum water supply, HW: high water supply.
Applsci 13 06072 g003
Figure 4. Raw spectral data for celery and sugar beet plants treated with four nitrogen fertilization doses and three water supply levels. LW: low water supply, OW: optimum water supply, HW: high water supply.
Applsci 13 06072 g004
Figure 5. The correlation coefficient between leaf nitrogen content and the second derivative of the spectral reflectance obtained for sugar beet (A,C,E) and celery (B,D,F) plants treated with four nitrogen fertilization doses and three water supply levels. The dashed red lines in each plot represent the limit of statistical significance at 0.4. The data points located beyond these limits are significantly correlated with leaf nitrogen concentration. LW: low water supply, OW: optimum water supply, HW: high water supply.
Applsci 13 06072 g005
Table 1. Overall accuracy and kappa coefficient of the models for classification of sugar beet plants subjected to four leaf nitrogen supplies and three water treatments. LW: low water supply, OW: optimum water supply, HW: high water supply.
Calibration SetValidation Set
Overall
Accuracy
(%)
Kappa
Coefficient
Overall
Accuracy
(%)
Kappa
Coefficient
HWBNN980.98830.78
Logistic660.54780.70
RF1001860.81
SVM830.78750.67
kNN1001780.70
OWBNN960.95780.70
Logistic830.78800.74
RF1001830.78
SVM0.850.80800.74
kNN1001780.70
LWBNN920.89690.59
Logistic810.75720.63
RF1001810.74
SVM780.70720.63
kNN1001670.56
Table 2. Overall accuracy and kappa coefficient of the models for classification of celery plants subjected to four leaf nitrogen supplies and three water treatments. LW: low water supply, OW: optimum water supply, HW: high water supply.
Calibration SetValidation Set
Overall
Accuracy (%)
Kappa
Coefficient
Overall
Accuracy (%)
Kappa
Coefficient
HWBNN930.91780.70
Logistic860.81750.67
RF1001810.74
SVM680.58690.59
kNN1001750.67
OWBNN970.96720.63
Logistic860.81780.70
RF1001810.74
SVM860.81750.67
kNN1001670.56
LWBNN940.93670.56
Logistic880.84720.63
RF1001780.70
SVM840.79690.59
kNN1001750.67
Table 3. Performance results of RF model obtained for classification of sugar beet plants subjected to four nitrogen supply levels and three water treatment levels. LW: low water supply, OW: optimum water supply, HW: high water supply.
ClassTP RateFP RatePrecisionRecallF1-ScoreAccuracy
Sugar Beet LWAll0.8060.0650.8610.8060.797
N330.6670.0001.0000.6670.800
N671.0000.1480.6921.0000.8180.81
N1000.5560.0001.0000.5560.714
N1331.0000.1110.7501.0000.857
Sugar Beet OWAll0.8330.0560.8350.8330.833
N331.0000.0001.0001.0001.000
N670.7780.1110.7000.7780.7370.83
N1000.8890.0370.8890.8890.889
N1330.6670.0740.7500.6670.706
Sugar Beet HWAll0.8610.0460.8630.8610.855
N331.0000.0740.8181.0000.900
N671.0000.0370.9001.0000.9470.86
N1000.6670.0370.8570.6670.750
N1330.7780.0370.8750.7780.824
Table 4. Performance results of RF model obtained for classification celery plants subjected to four nitrogen supply levels and three water treatment levels. LW: low water supply, OW: optimum water supply, HW: high water supply.
ClassTP RateFP RatePrecisionRecallF1-ScoreAccuracy
Celery LWAll0.7780.0740.7970.7780.781
N330.7780.0001.0000.7780.875
N670.8890.0740.8000.8890.8420.81
N1000.6770.0740.7500.6670.706
N1330.7780.1480.6360.7780.781
Celery OWAll0.8060.0650.8410.8060.810
N330.6670.0001.0000.6670.800
N670.7780.1480.6360.7780.7000.81
N1000.8890.0001.0000.8890.941
N1330.8890.1110.7270.8890.800
Celery HWAll0.8060.0650.8190.8060.808
N330.7780.0001.0000.7780.875
N670.7780.1110.7000.7780.7370.81
N1000.7780.0740.7780.7780.778
N1330.8890.0740.8000.8890.842
Disclaimer/Publisher’s Note: The statements, opinions and data contained in all publications are solely those of the individual author(s) and contributor(s) and not of MDPI and/or the editor(s). MDPI and/or the editor(s) disclaim responsibility for any injury to people or property resulting from any ideas, methods, instructions or products referred to in the content.

