Article

Primary Stability Assessment of Conical Implants in Under-Prepared Sites: An In Vitro Study in Low-Density Polyurethane Foams

1
Independent Researcher, San Vendemiano-Conegliano, 31020 Treviso, Italy
2
Department of Medical, Surgical, and Dental Sciences, University of Milan, 20122 Milan, Italy
3
Department of Stomatology, Tuscan Stomatologic Institute, Foundation for Dental Clinic, Research and Continuing Education, 55041 Camaiore, Italy
4
Department of Medical, Oral and Biotechnological Sciences, “G. d’Annunzio” University of Chieti-Pescara, 66013 Chieti, Italy
5
Center for Advanced Studies and Technology-CAST, “G. d’Annunzio” University of Chieti-Pescara, 66013 Chieti, Italy
6
Independent Researcher, 00187 Rome, Italy
7
School of Dentistry, Saint Camillus International University of Health and Medical Sciences, 00131 Rome, Italy
8
Facultad de Medicina, UCAM Universidad Católica San Antonio de Murcia, 30107 Murcia, Spain
*
Author to whom correspondence should be addressed.
These authors contributed equally to this work.
Appl. Sci. 2023, 13(10), 6041; https://doi.org/10.3390/app13106041
Submission received: 20 April 2023 / Revised: 11 May 2023 / Accepted: 12 May 2023 / Published: 14 May 2023
(This article belongs to the Special Issue Oral and Implant Health)

Abstract

:
Bone characteristics, the implant macrogeometry, and the drilling technique are considered the main important factors to obtain a good implant primary stability (PS). Indeed, although it is known that implant placement in poor bone sites increases the possibility of implant failure, several surgical procedures have been proposed to improve PS, such as site under-preparation. Hence, this in vitro study aimed to evaluate the insertion torque (IT), removal torque (RT), and resonance frequency analysis (RFA) of conical implants (3.3 and 4 × 13 mm) placed in under-prepared sites on 10 and 20 pounds per cubic foot (PCF) density polyurethane sheets (simulating a D3 and D2 bone, respectively) with and without a cortical sheet of 30 PCF in density (corresponding to a D1 bone). After using ANOVA or Kolmogorov–Smirnov test to elaborate data, the resulting IT and RT values were directly proportional to the polyurethane block densities (e.g., the lowest and highest IT values were 8.36 ± 0.52 Ncm in the 10 PCF density sheet and 46.21 ± 0.79 Ncm in the 20 PCF density sheet + cortical for 4 × 13 mm implants) and increased with the increasing amount of site under-preparation (the highest results for both implants were found with a 2.2 mm under-preparation, showing a significantly higher IT with a p < 0.05 compared with others, especially in the highest-density sheets). Both implants inserted in the 20 PCF density block + cortical with all under-preparation protocols exhibited significantly higher RFA values (p < 0.05–0.0001) compared with the corresponding ones in the 10 PCF block. Moreover, 3.3 × 13 mm implants showed the same results comparing the 20 PCF block and the 10 PCF block + cortical. In conclusion, in this in vitro study using low-density polyurethane blocks, the under-preparation of the implant insertion sites was shown to be effective in increasing implants’ PS.

1. Introduction

Primary stability (PS) plays a crucial role in attaining and maintaining the mineralized bone at the implant interface level for a long time [1,2,3,4]. PS was reported to represent the resultant force of friction generated by the implant surface and the host bone contact after implant insertion [5,6,7]. A high implant insertion torque (IT) probably constitutes an important factor in reaching a high PS with the reduction in implant micromotion [2,3]. It has been shown that implant micromotion during the early phases after implant insertion impair the osseointegration process, resulting in a fibrous capsule formation and implant loosening. In the early 1990s, a limit of 150 µm of micromotion was considered as the cut-off for a successful osseointegration [8]. Despite this, with the evolution of implant systems and surface modifications, this variable has been reconsidered [9,10,11]. A recent review of Kohli et al. [12] showed a 32% higher micromotion in failed implants compared to the osseointegrated ones, but it also concluded that considering a universal tolerable limit for micromotion in osseointegrated implants could be misleading. Traditionally, dental implants take from 3 to 6 months to fully heal after their insertion, avoiding micromovements. However, with the emergence of immediate loading protocols, by which the implant loading can be performed immediately after surgery or within 48 h (ILP), the importance of PS increased dramatically. The rate of failures in ILP protocols has been reported as higher than conventional loading (risk ratio = 2.09, 95% confidence interval (CI) [1.18, 3.69], p = 0.01) [13]. Consequently, specific IT values have been suggested for ILP. For example, a minimum value of 60 Ncm was indicated by Calandriello et al. [14] for single teeth and an IT of 45 and 32 Ncm for implants that have to support partial and full arch restorations, respectively. However, with a 2-year retrospective study, Del Giudice et al. [15] asserted that also an IT < 32 Ncm can be compatible with ILP success.
Among the important factors influencing PS, there can be cited the bone quality, the bone density, the bone volume, the length and diameter of implants, the surgeon’s experience and skills, the thread shape, the implant macrogeometry, the surgical site morphology, the drilling technique, the preparation of osteotomies, and the surgical technique [3,4,5,9,16,17,18,19,20]. The presence of poor bone quality and quantity has been reported to decrease the implant success [1,5,21]. PS is known to be related to the mechanical stability achieved with different surgical techniques and procedures: under-preparation, bone condensation, and bicortical fixation [5,18,22]. In fact, an under-preparation of the implant site in cancellous bone has been already proved to be helpful in improving implant PS [5,6,18,22,23,24,25,26].
In recent years, polyurethane has been reported to have biomechanical properties similar to human bone and also a more uniform average cell size in respect to natural bone [16,18,20]. It is a standardized and homogenous material that can be provided in different thicknesses and densities, from D1 to D4 [20,21]. These characteristics make the polyurethane foam a suitable material for biomechanical tests of dental implants, for example, the IT, removal torque (RT), and resonance frequency analysis (RFA) assessment [17,21,27,28,29]. In particular, the latter is known to be a valuable parameter to measure the implant stability quotient (ISQ) after its positioning, becoming a noninvasive technique to identify implant failure risk and add information on the predictability of dental implant procedures [30].
Thus, the main objective of this in vitro study has been the evaluation of IT, RT, and RFA values of different diameter conical implants (3.3 and 4 × 13 mm) placed in under-prepared sites on 10 and 20 pounds per cubic foot (PCF) density polyurethane blocks, with and without the addition of a 30 PCF density cortical sheet. Despite in the literature there not being clear evidence about how under-preparation of sites could influence IT, RT, and RFA, in this study, it could be hypothesized that, with the increase in the under-preparation size, not only the RFA, but also the IT of both implants with different diameters could be improved. Moreover, from a clinical point of view, it could be interesting to see no differences between the two implant groups in order to choose the smaller diameter that needs less under-sizing and use the 4 mm diameter with a higher under-preparation of the site only in low-density bones.

2. Materials and Methods

2.1. Polyurethane Foams

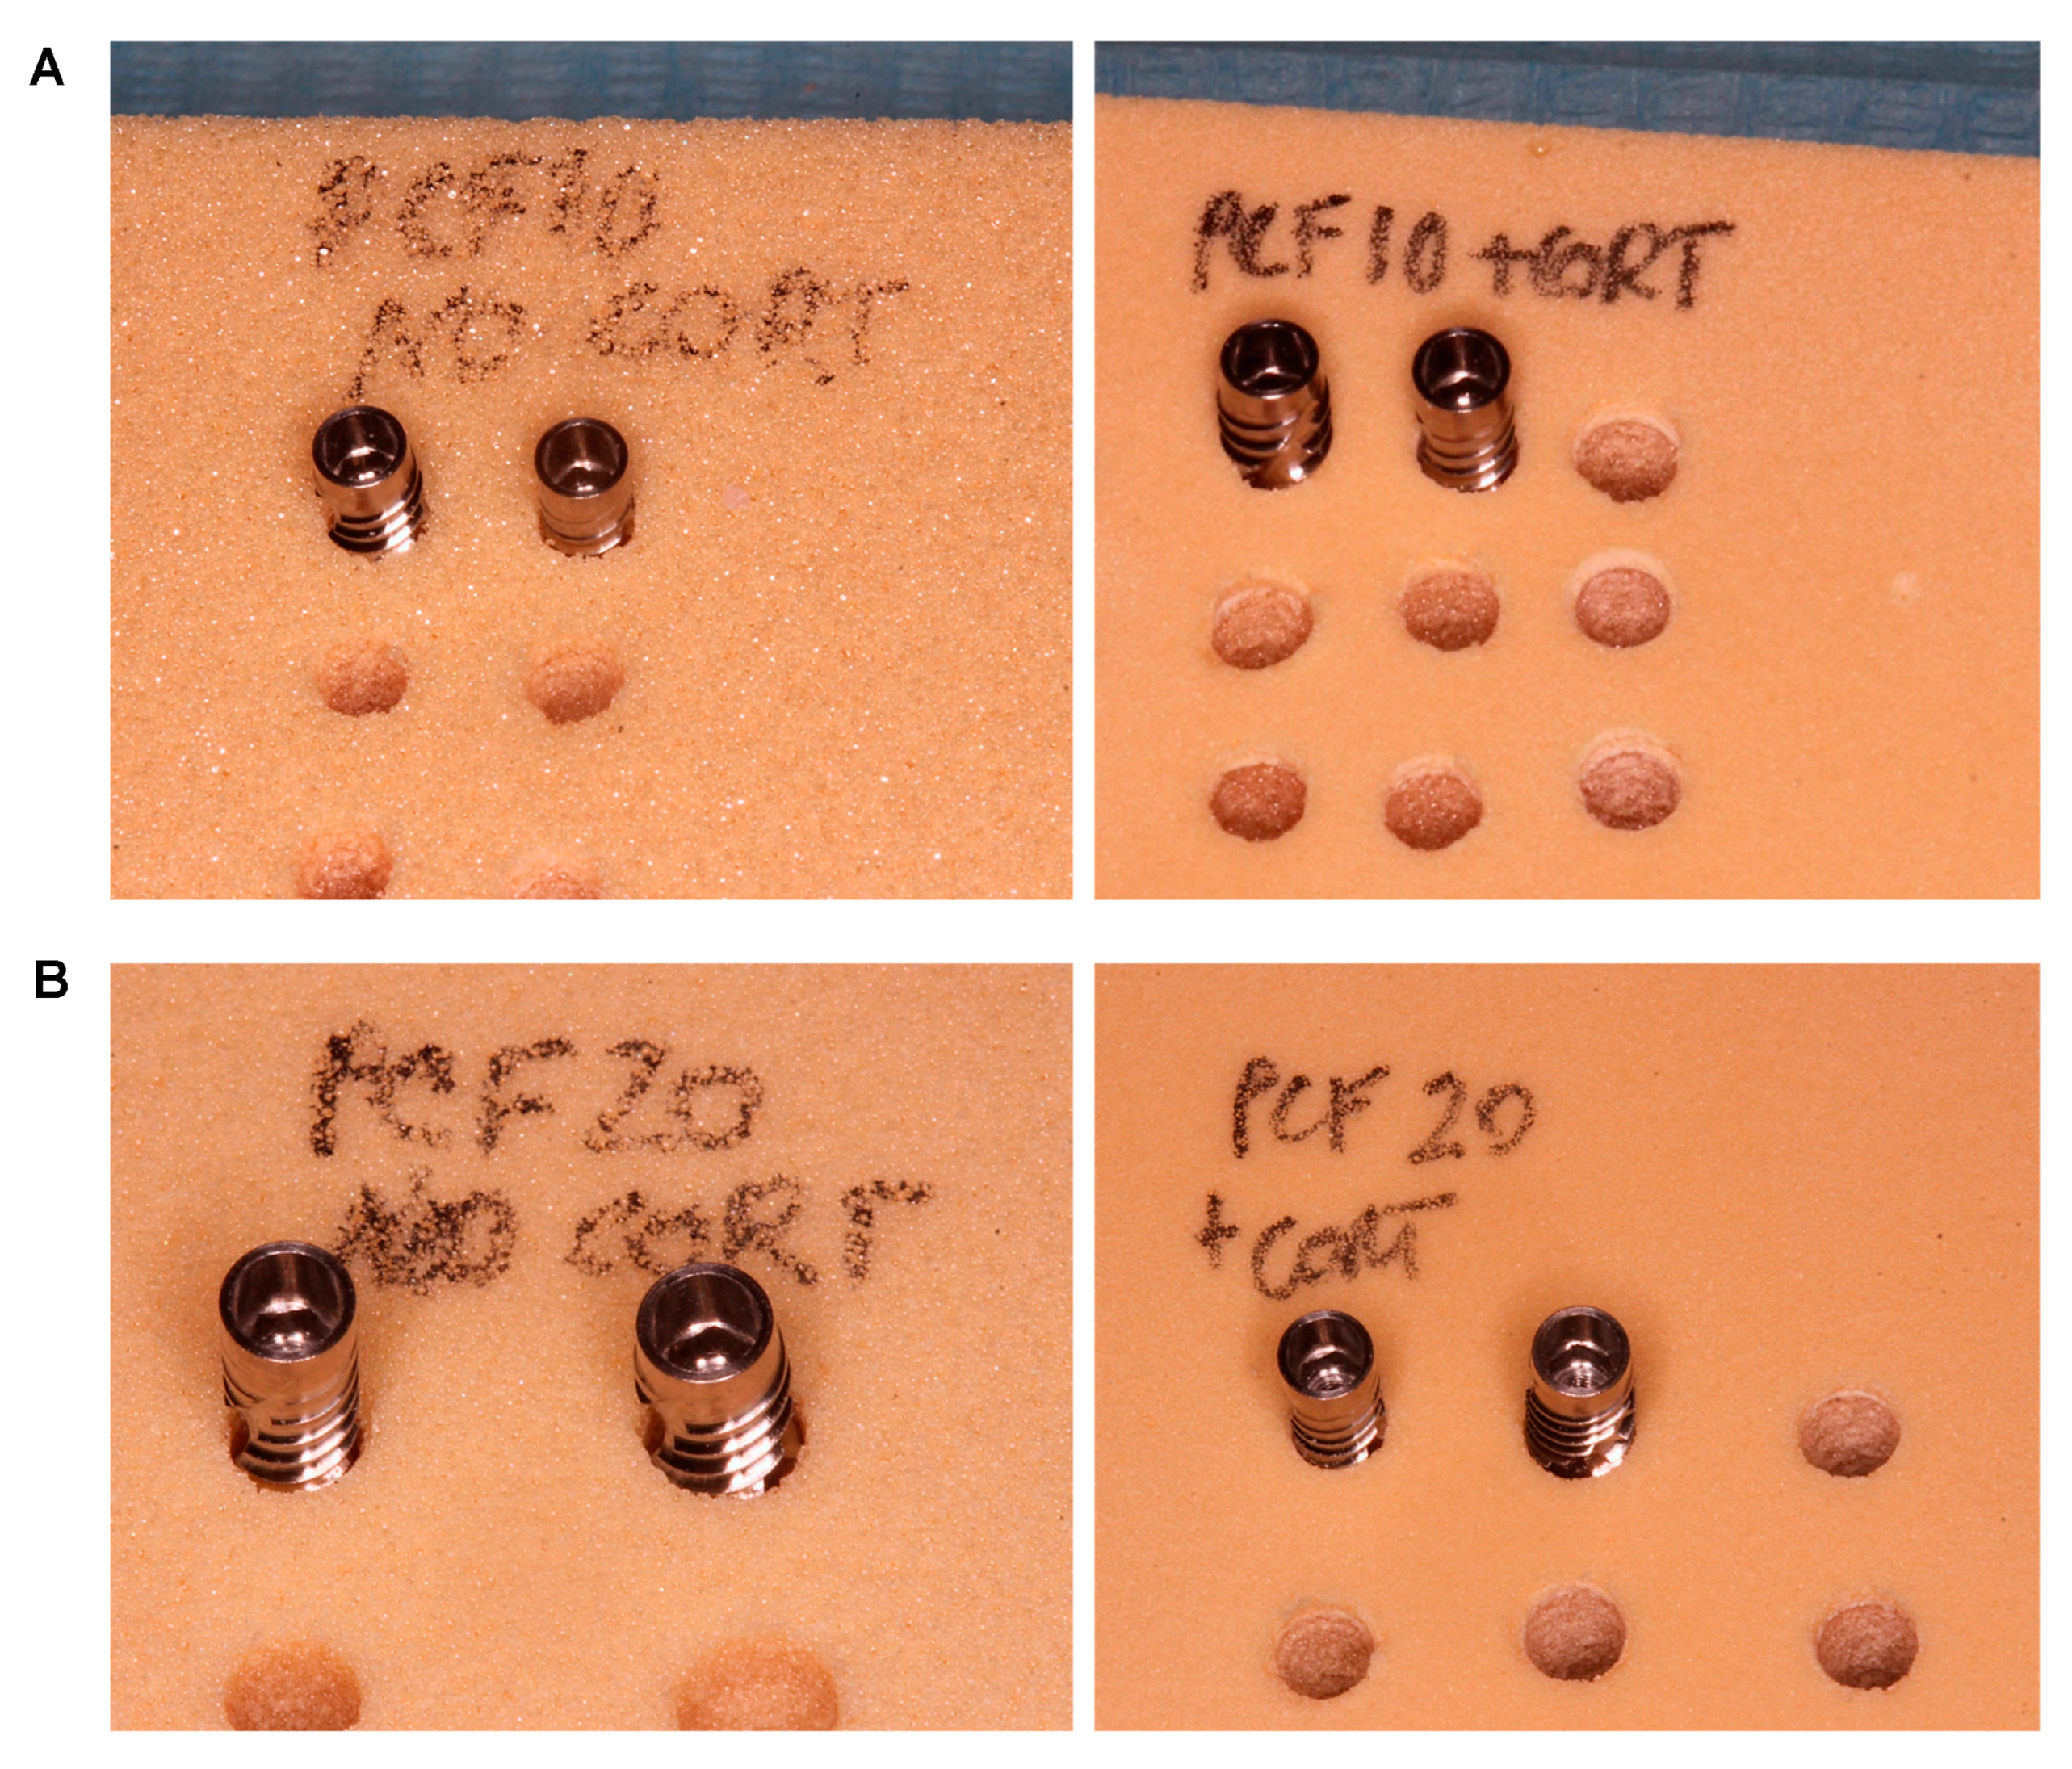
As Comuzzi et al. [27] previously reported, nowadays, the solid rigid polyurethane foam represents the most suitable model to perform in vitro tests and to compare dental implants and bone screws in order to simulate different densities and consistencies of the natural bone. In this study, 13 cm × 18 cm × 4 cm blocks with 10 and 20 PCF in density (which correspond to a density of 0.16 and 0.32 g/cc, mimicking the in vivo D3 and D2 bone, respectively, according to Misch classification [31]), with or without the addition of a 1 mm thickness cortical sheet of 30 PCF in density (corresponding to a density of 0.48 g/cc, similar to the in vivo D1 bone and simulating a layer of cortical bone), were used to test the implants in the present study (Figure 1 and Figure 2). The microstructure of these materials has been previously analyzed [32,33].
All these polyurethane foams were purchased from Sawbones Europe AB (Malmö, Sweden) and results conform to ASTM F-1839-08 “Standard Specification for Rigid Polyurethane Foam for Use as a Standard Material for Testing Orthopaedic Devices and Instruments” [34], as reported in Table 1.

2.2. Implants

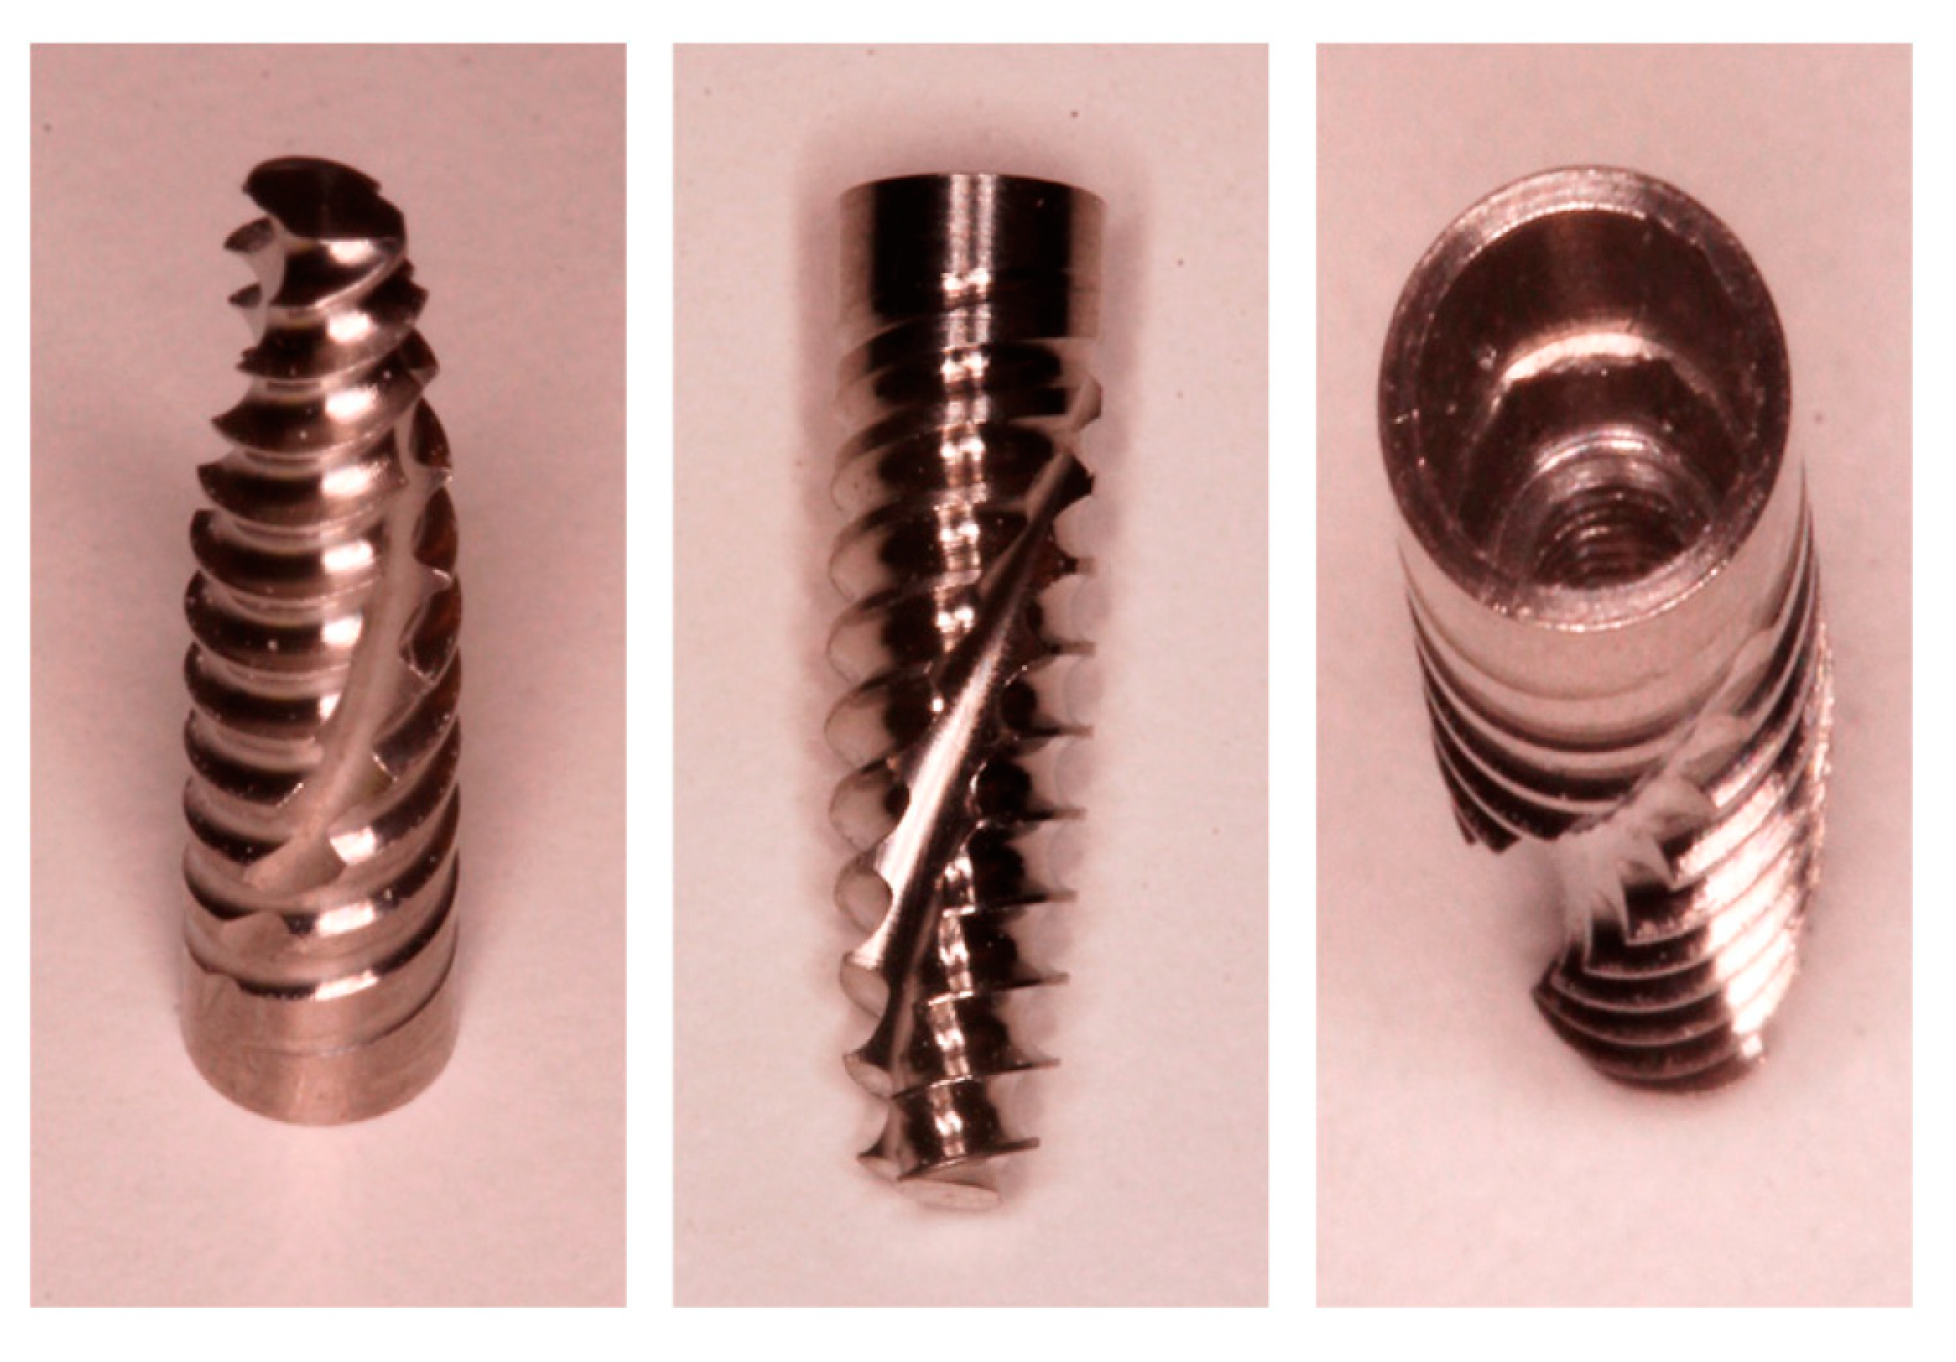
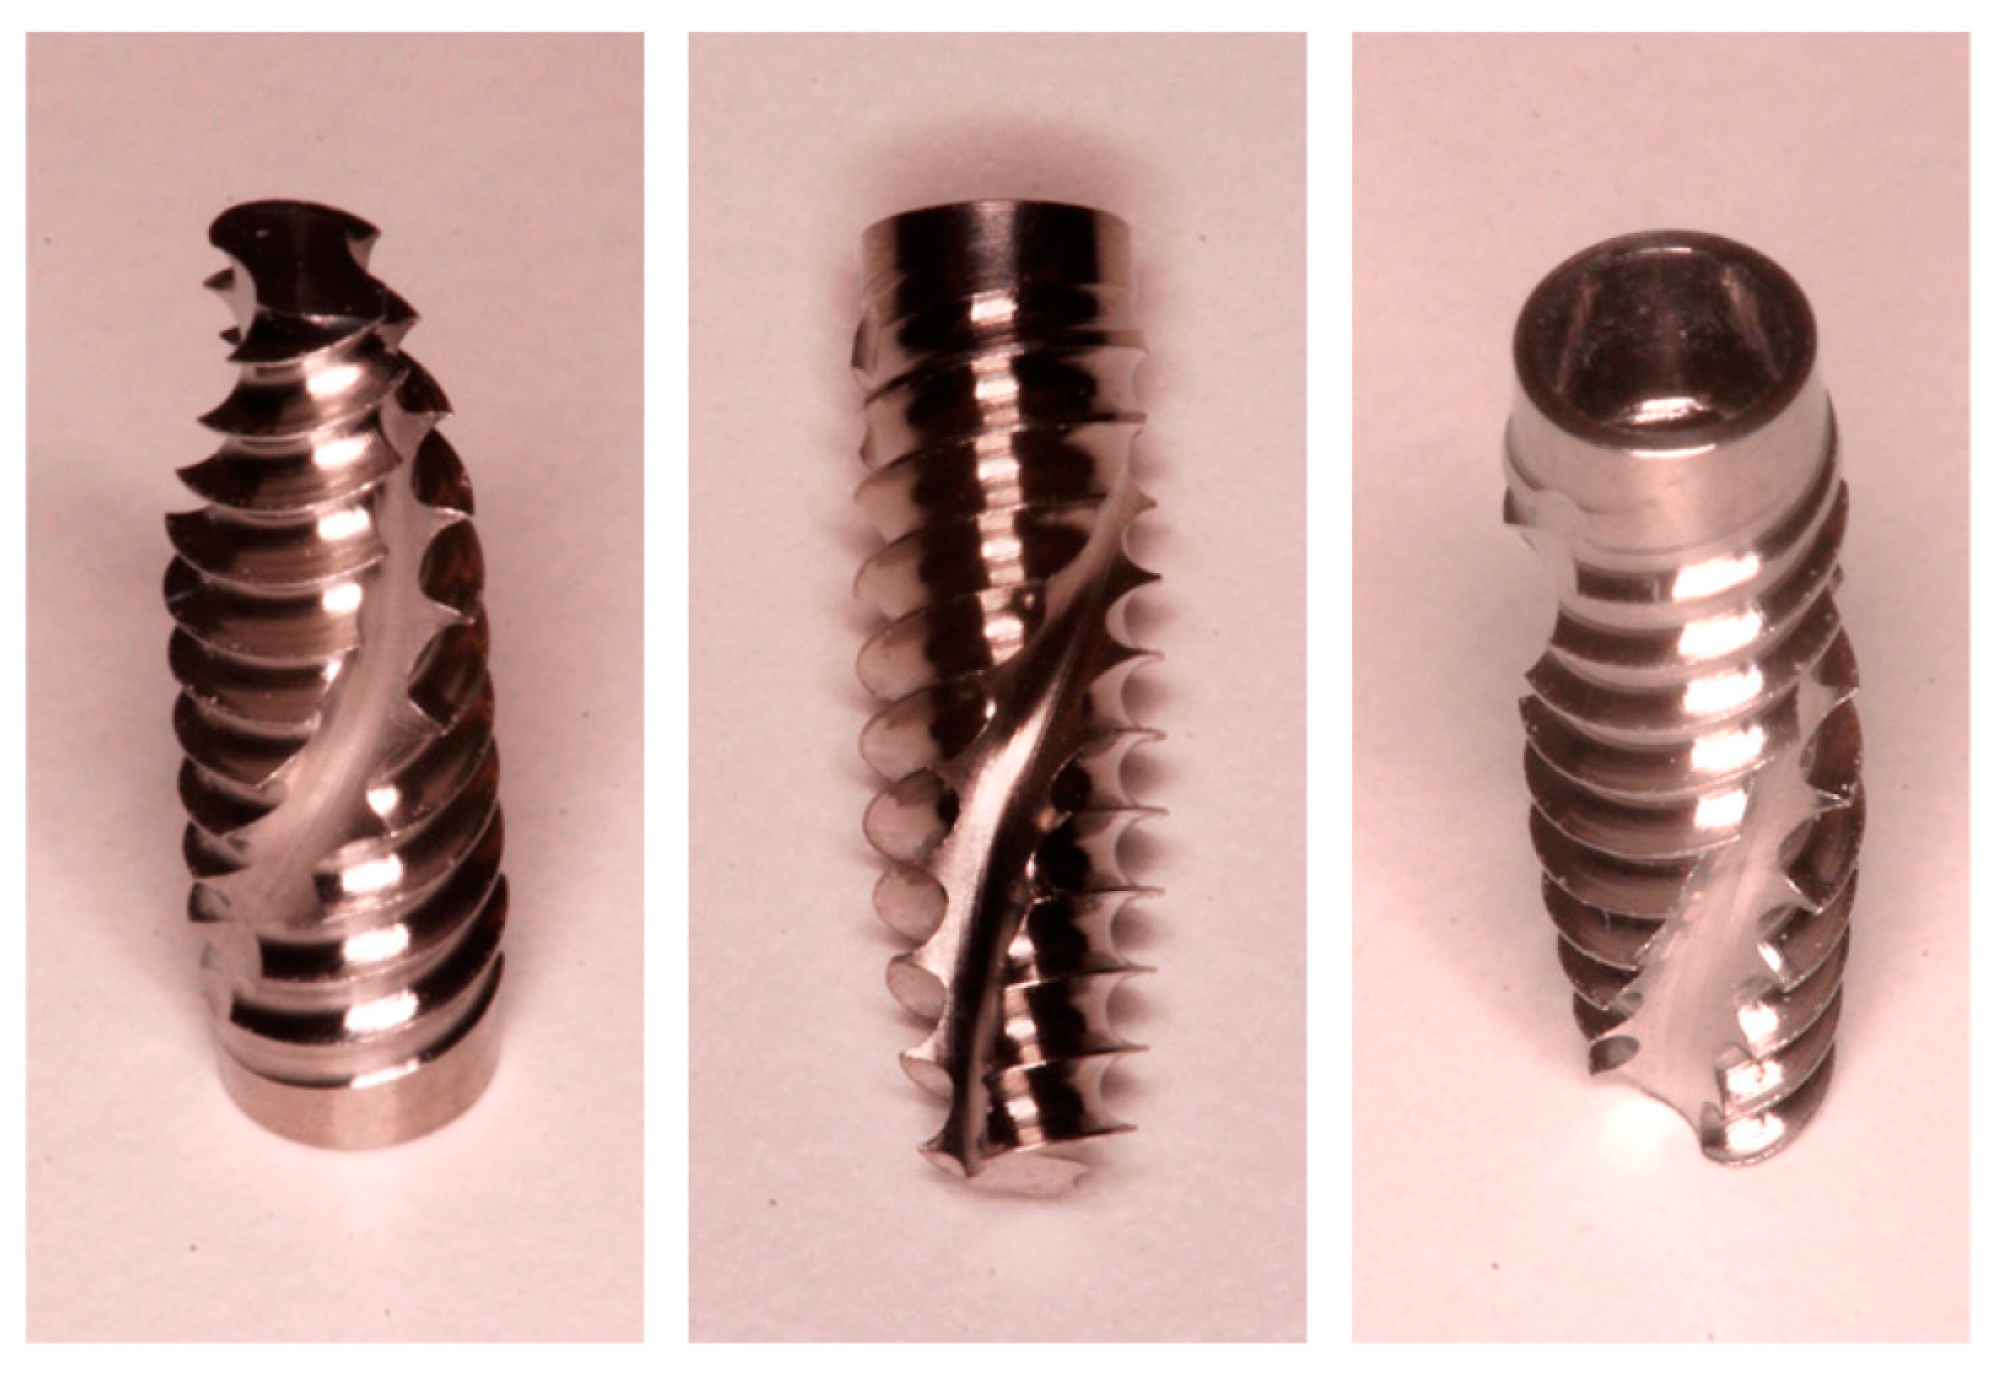
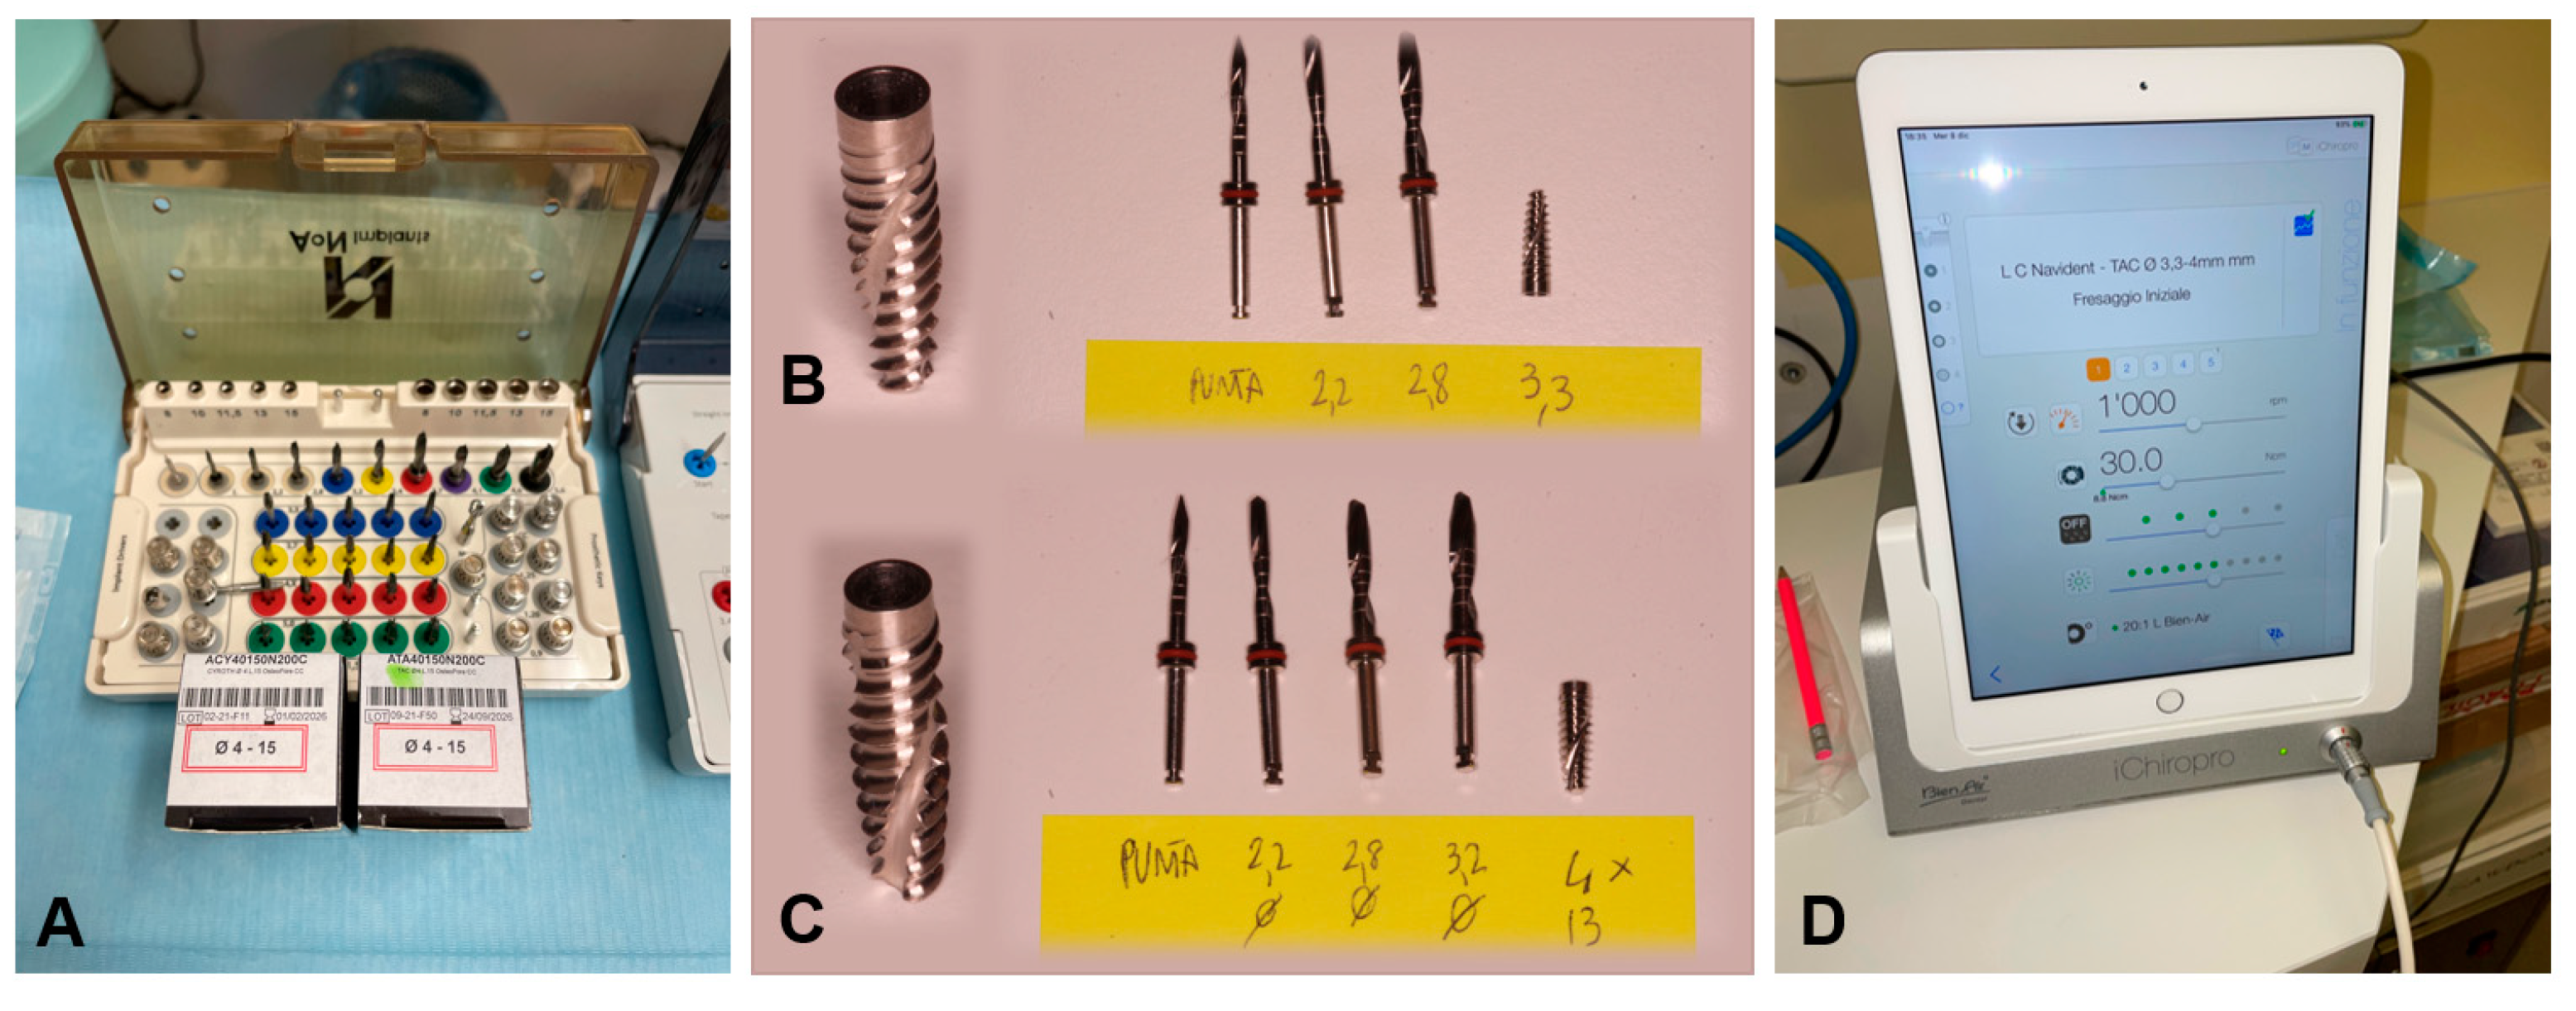
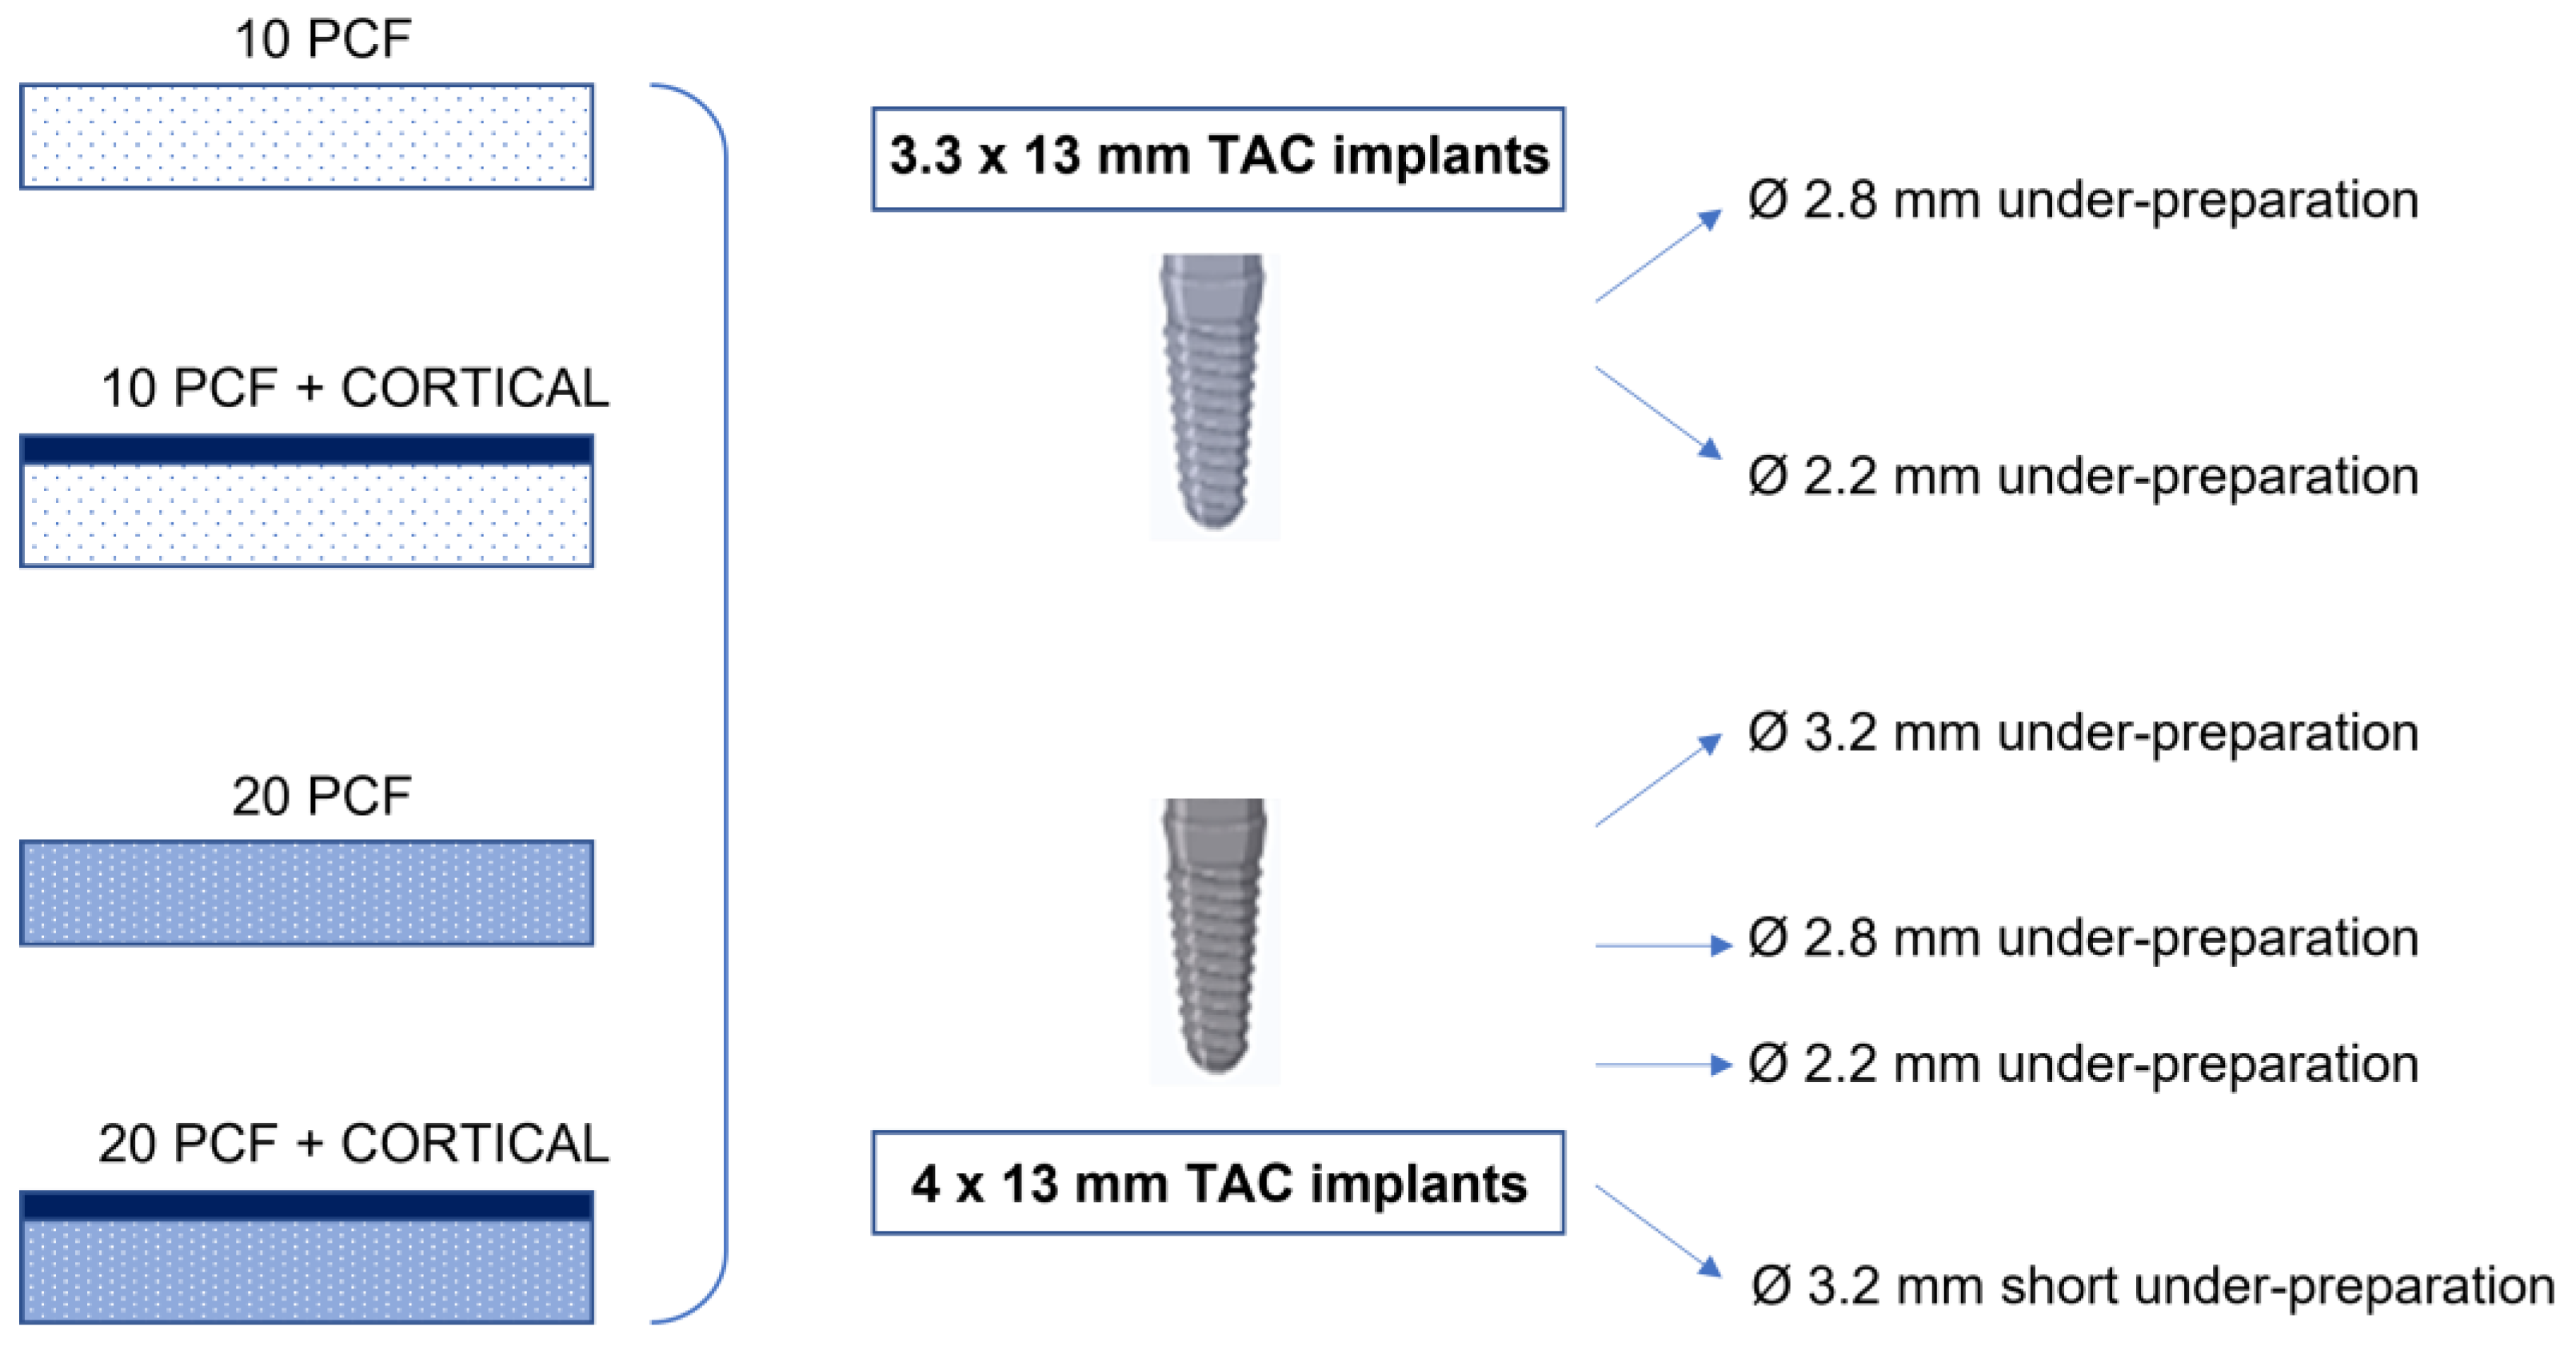
The two conical implants used in the present study presented the following dimensions: 3.3 mm × 13 mm and 4 mm × 13 mm (TAC, AoN Implants, Grisignano di Zocco, Italy). Ten implants for each type were inserted in the different blocks, after the under-preparation of the sites with a specific drilling sequence, using the manufacturer kit (AoN Implants, Grisignano di Zocco, Italy) and also a surgical implant motor (Chiropro, Bien Air Dental SA, Bienne, Switzerland) (Figure 3, Figure 4 and Figure 5).
All implants tested presented a double acidification surface treatment (OsteoPore, AoN Implants, Grisignano di Zocco, Italy) affecting only the part of the thread. The new “Smooth Design” of the thread profile is designed to respect hard tissues as much as possible, together with a reduced apical part, aiming at leaving the bone quality as unaltered as possible and obtaining the maximum possible stability, while maintaining the appropriate IT. Moreover, a Cone–Morse self-locking connection is present.

2.3. Drilling Protocol

For 3.3 mm × 13 mm TAC implants, 2 site preparation protocols were used:
  • A 2.8 mm diameter site (under-preparation size: 0.5 mm);
  • A 2.2 mm diameter site (under-preparation size: 1.1 mm).
For 4 mm × 13 mm TAC implants, 4 site preparation protocols were used:
  • A 3.2 mm diameter site (under-preparation size: 0.8 mm);
  • A 2.8 mm diameter site (under-preparation size: 1.2 mm);
  • A 2.2 mm diameter site (under-preparation size: 1.8 mm);
  • A 3.2 mm diameter site (“short”): a 2.8 mm diameter site preparation was performed and, then, another preparation up to a diameter of 3.2 mm only for the first 4–5 mm of the osteotomy (under-preparation size: 1.2 mm in the central and apical parts of the implant and 1.8 mm in the coronal portion of the osteotomy). This protocol was thought to minimize the friction and the stress at the coronal portion of the osteotomy without increasing the whole implant contact with the bone, in case of the presence of a thick cortical bone.
The drilling protocol was uniformed for all the implants and performed using the manufacturer kit:
  • An initial pointed bur at 300 rpm;
  • A 2.2 mm bur at 300 rpm;
  • Eventually, a 2.8 mm bur at 300 rpm;
  • Eventually, a 3.2 mm bur at 300 rpm;
  • Or, a 2.8 mm bur and partially a 3.2 mm bur at 300 rpm, as previously explained in the “short” protocol.
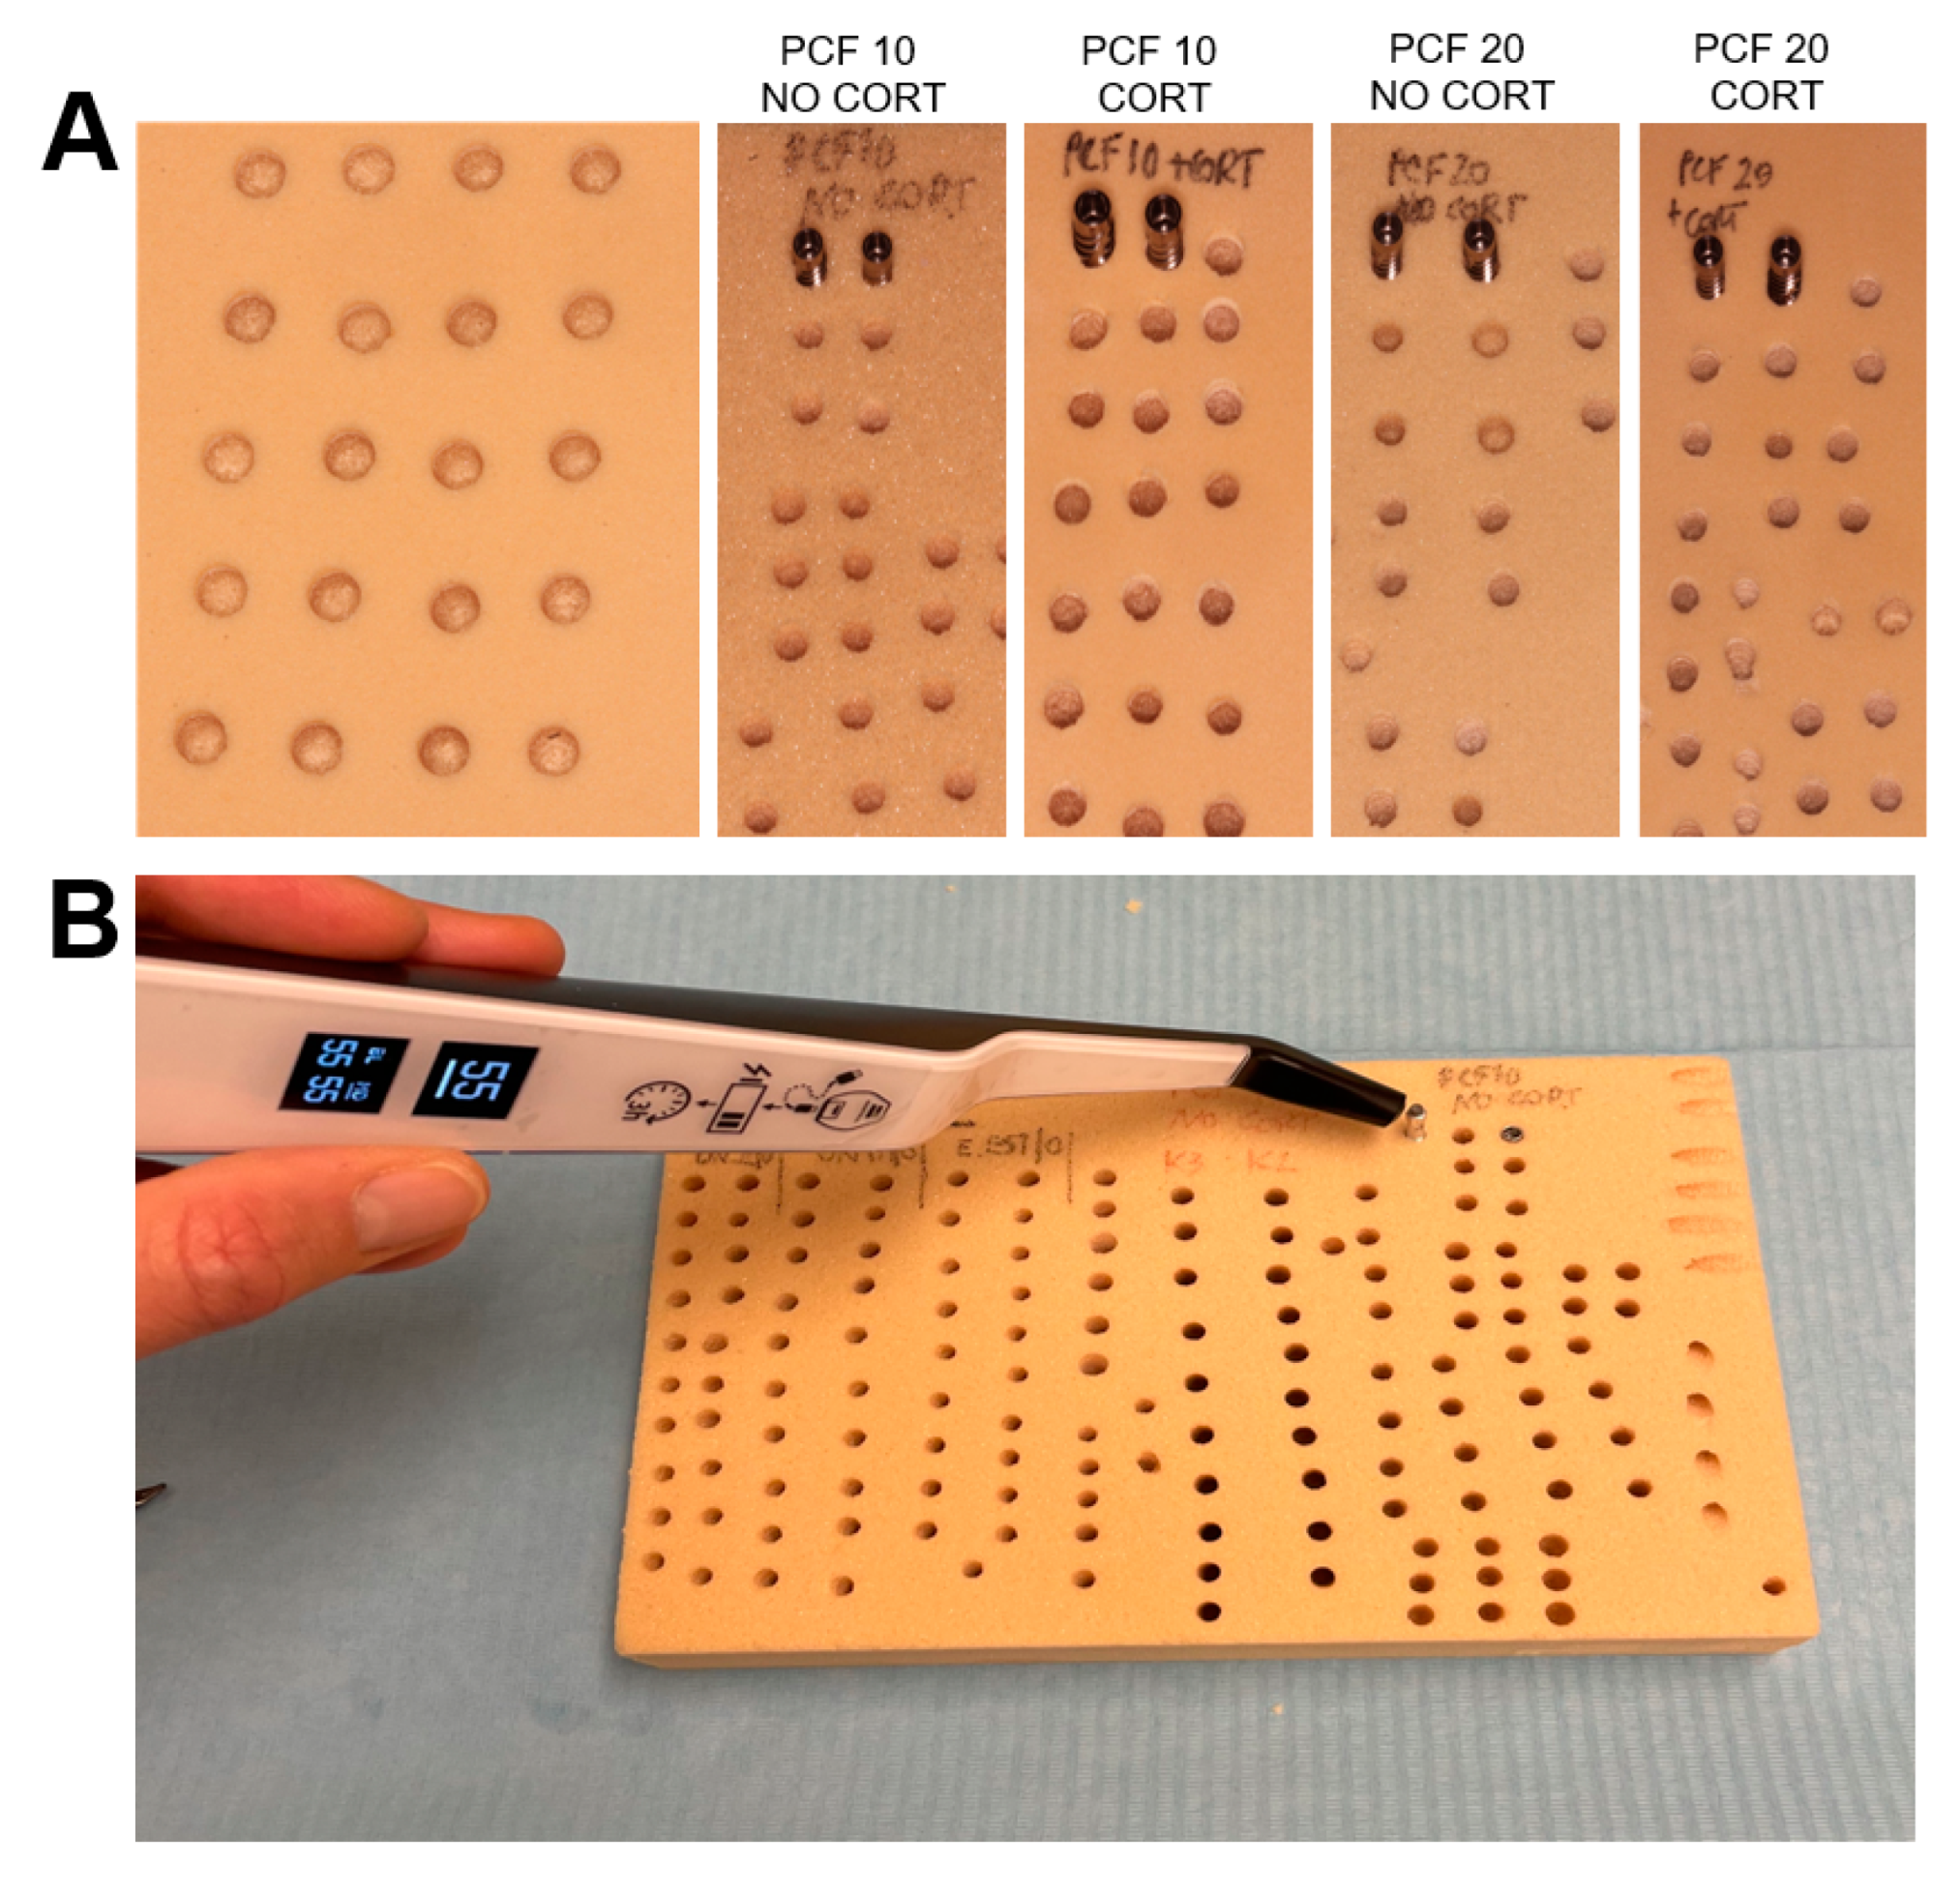
Thus, 10 implants of each type were inserted in 10 and 20 PCF density blocks with or without the addition of a cortical sheet and for each under-prepared site. In this way, a total of 240 site preparations were performed (Figure 6 and Figure 7).
The final insertion of the implants was conducted at 30 rpm with a calibrated torque of 50 Ncm, evaluating the IT and RT values in the final 1 mm with a calibrated torque meter for dynamometric analysis. On the other hand, a n. 78 Smart Peg (Osstell AB, Gothenburg, Sweden) was used to obtain the ISQ values. Then, the placement of the implant platform at the superficial polyurethane level was performed for all the implants.

2.4. Statistical Analysis

The a priori sample size calculation was performed using the analysis of covariance (ANCOVA) statistical test (effect size: 0.35, α err: 0.05; power (1-β): 0.95; numerator df: 15; number of groups: 6; number of covariates: 4) with G*Power 3.1.9.7 program (Heinrich-Heine-Universität, Düsseldorf, Germany). Thus, a minimum of 240 osteotomies had to be performed in order to obtain a statistically significant result. After the assessment of the normal distribution of values by D’Agostino-Pearson omnibus normality test, the different IT, RT, and RFA measured values were evaluated by using the one-way analysis of variance (ANOVA) test followed by Bonferroni post hoc test (normally distributed data) or Kolmogorov–Smirnov test (nonparametric data). A p-value < 0.05 was considered statistically significant. The statistical analysis was performed using Excel (Microsoft Company, Redmond, WA, USA) and GraphPad Prism Software Analysis version 9 (San Diego, CA, USA). Data were expressed as the mean ± standard deviation (SD).

3. Results

In Table 2, all the values registered by the two groups of implants in each experimental condition are reported.

3.1. Evaluation of IT Values

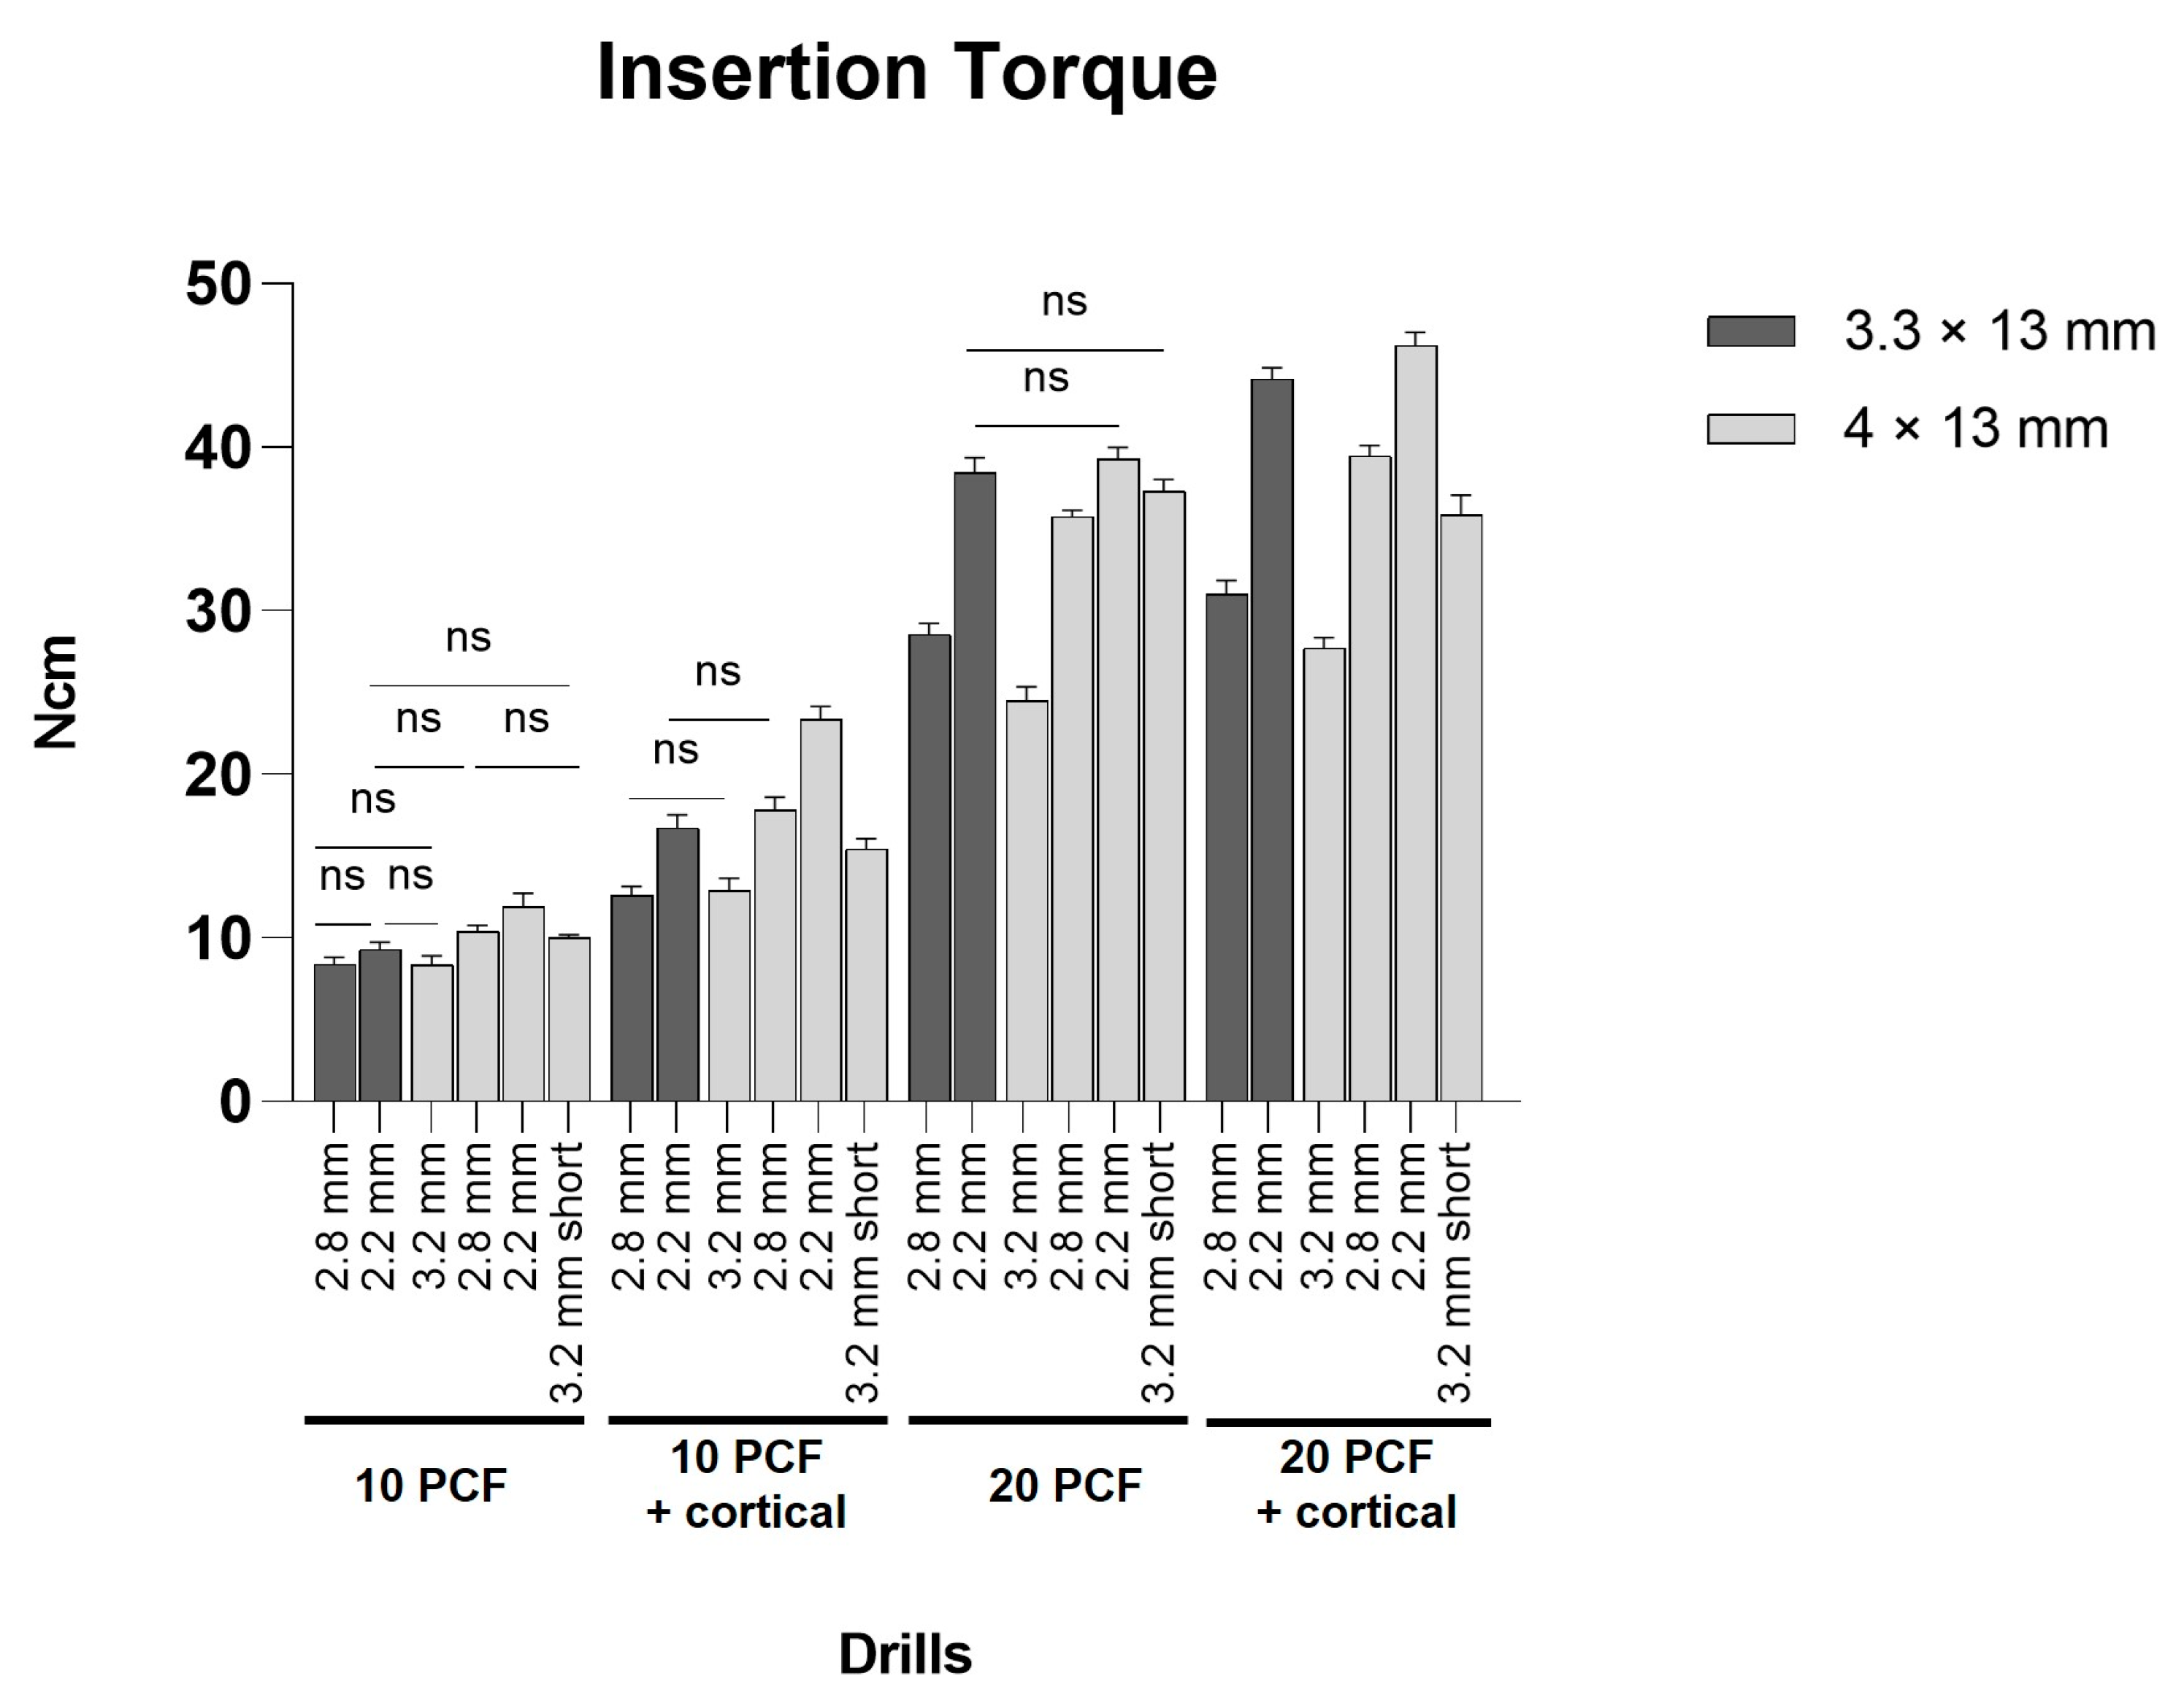
The IT values appeared to be directly proportional to the density of the blocks: lower values were registered in the 10 PCF density block without the cortical sheet, with the lowest IT values of 8.36 ± 0.52 Ncm for 4 × 13 mm TAC implants with the 3.2 mm site preparation protocol, while higher values were found in the 20 PCF density block with the cortical sheet, with the highest values of 46.21 ± 0.79 Ncm for 4 × 13 mm TAC implants with the 2.2 mm site preparation protocol. Thus, the IT values appeared to proportionally increase with the decrease in the under-preparation size of the sites, showing the highest values with 4 × 13 mm implants and 2.2 mm burs in all the experimental conditions (23.34 ± 0.79 Ncm and 11.88 ± 0.86 Ncm in 10 PCF density blocks with and without the cortical sheet, respectively, and 46.21 ± 0.79 Ncm and 39.28 ± 0.68 Ncm in 20 PCF density blocks with and without the cortical sheet, respectively), always reaching a statistical significance, except when compared with 3.3 × 13 mm implants and 2.2 mm protocol in the 20 PCF density block without the cortical sheet. The IT increased about 7–10 points for each decrease in diameter of the under-preparation, except in the lowest densities of the material, where the increase was about 2–5 points in the 10 PCF density block with the cortical sheet and 1–2 points in the 10 PCF density block without the cortical sheet. Indeed, all implants presented quite low IT values in the 10 PCF density block without the cortical sheet, despite the under-preparation size (7.8–12.9 Ncm) (Figure 8).
Overall, the inserted implants may be considered stable in all conditions, without stressing too much the artificial bone.

3.2. Evaluation of RT Values

The RT always showed lower values than those of the IT for both the implants tested, with higher differences in 20 PCF density blocks with and without the cortical sheet. Moreover, these values were proportional to the increase in the polyurethane block density and to the decrease in the under-preparation size. In particular, the values reached 39.09 ± 0.72 Ncm with 4 × 13 mm implants and 2.2 mm burs and 32.38 ± 0.68 Ncm with 3.3 × 13 mm implants and 2.2 mm burs in the 20 PCF density block with the cortical sheet, without statistically significant differences. Conversely, in the 10 PCF density block without the cortical sheet, the lowest RT values were registered for 4 × 13 mm TAC implants (6.81 ± 0.82 Ncm) and for 3.3 × 13 mm TAC implants (7.39 ± 0.34 Ncm) in the sites prepared with the 3.2 mm bur and the 2.8 mm bur, respectively, always not reporting significant differences. However, in the same bone density, 4 × 13 mm implants showed the highest RT values in 2.8 mm and 2.2 mm prepared sites (9.3 ± 0.43 and 10.41 ± 0.43 Ncm, respectively).
Moreover, RT values reported for the two implants with all the under-prepared sizes in 20 PCF density blocks were significantly higher than the corresponding ones registered in the lowest-density block, with the exception of 4 × 13 mm TAC implants and the 3.2 mm bur in the 20 PCF density block without the cortical sheet.
Specifically, the increase in RT values, in concomitance with the increase in the under-preparation, showed to be about 4–14 Ncm lower than the corresponding IT values in 20 PCF density blocks with and without the cortical sheet, while about 2–6 Ncm lower for each increase in the under-preparation in 10 PCF density blocks with and without the cortical sheet (Figure 9).

3.3. Evaluation of RFA Values

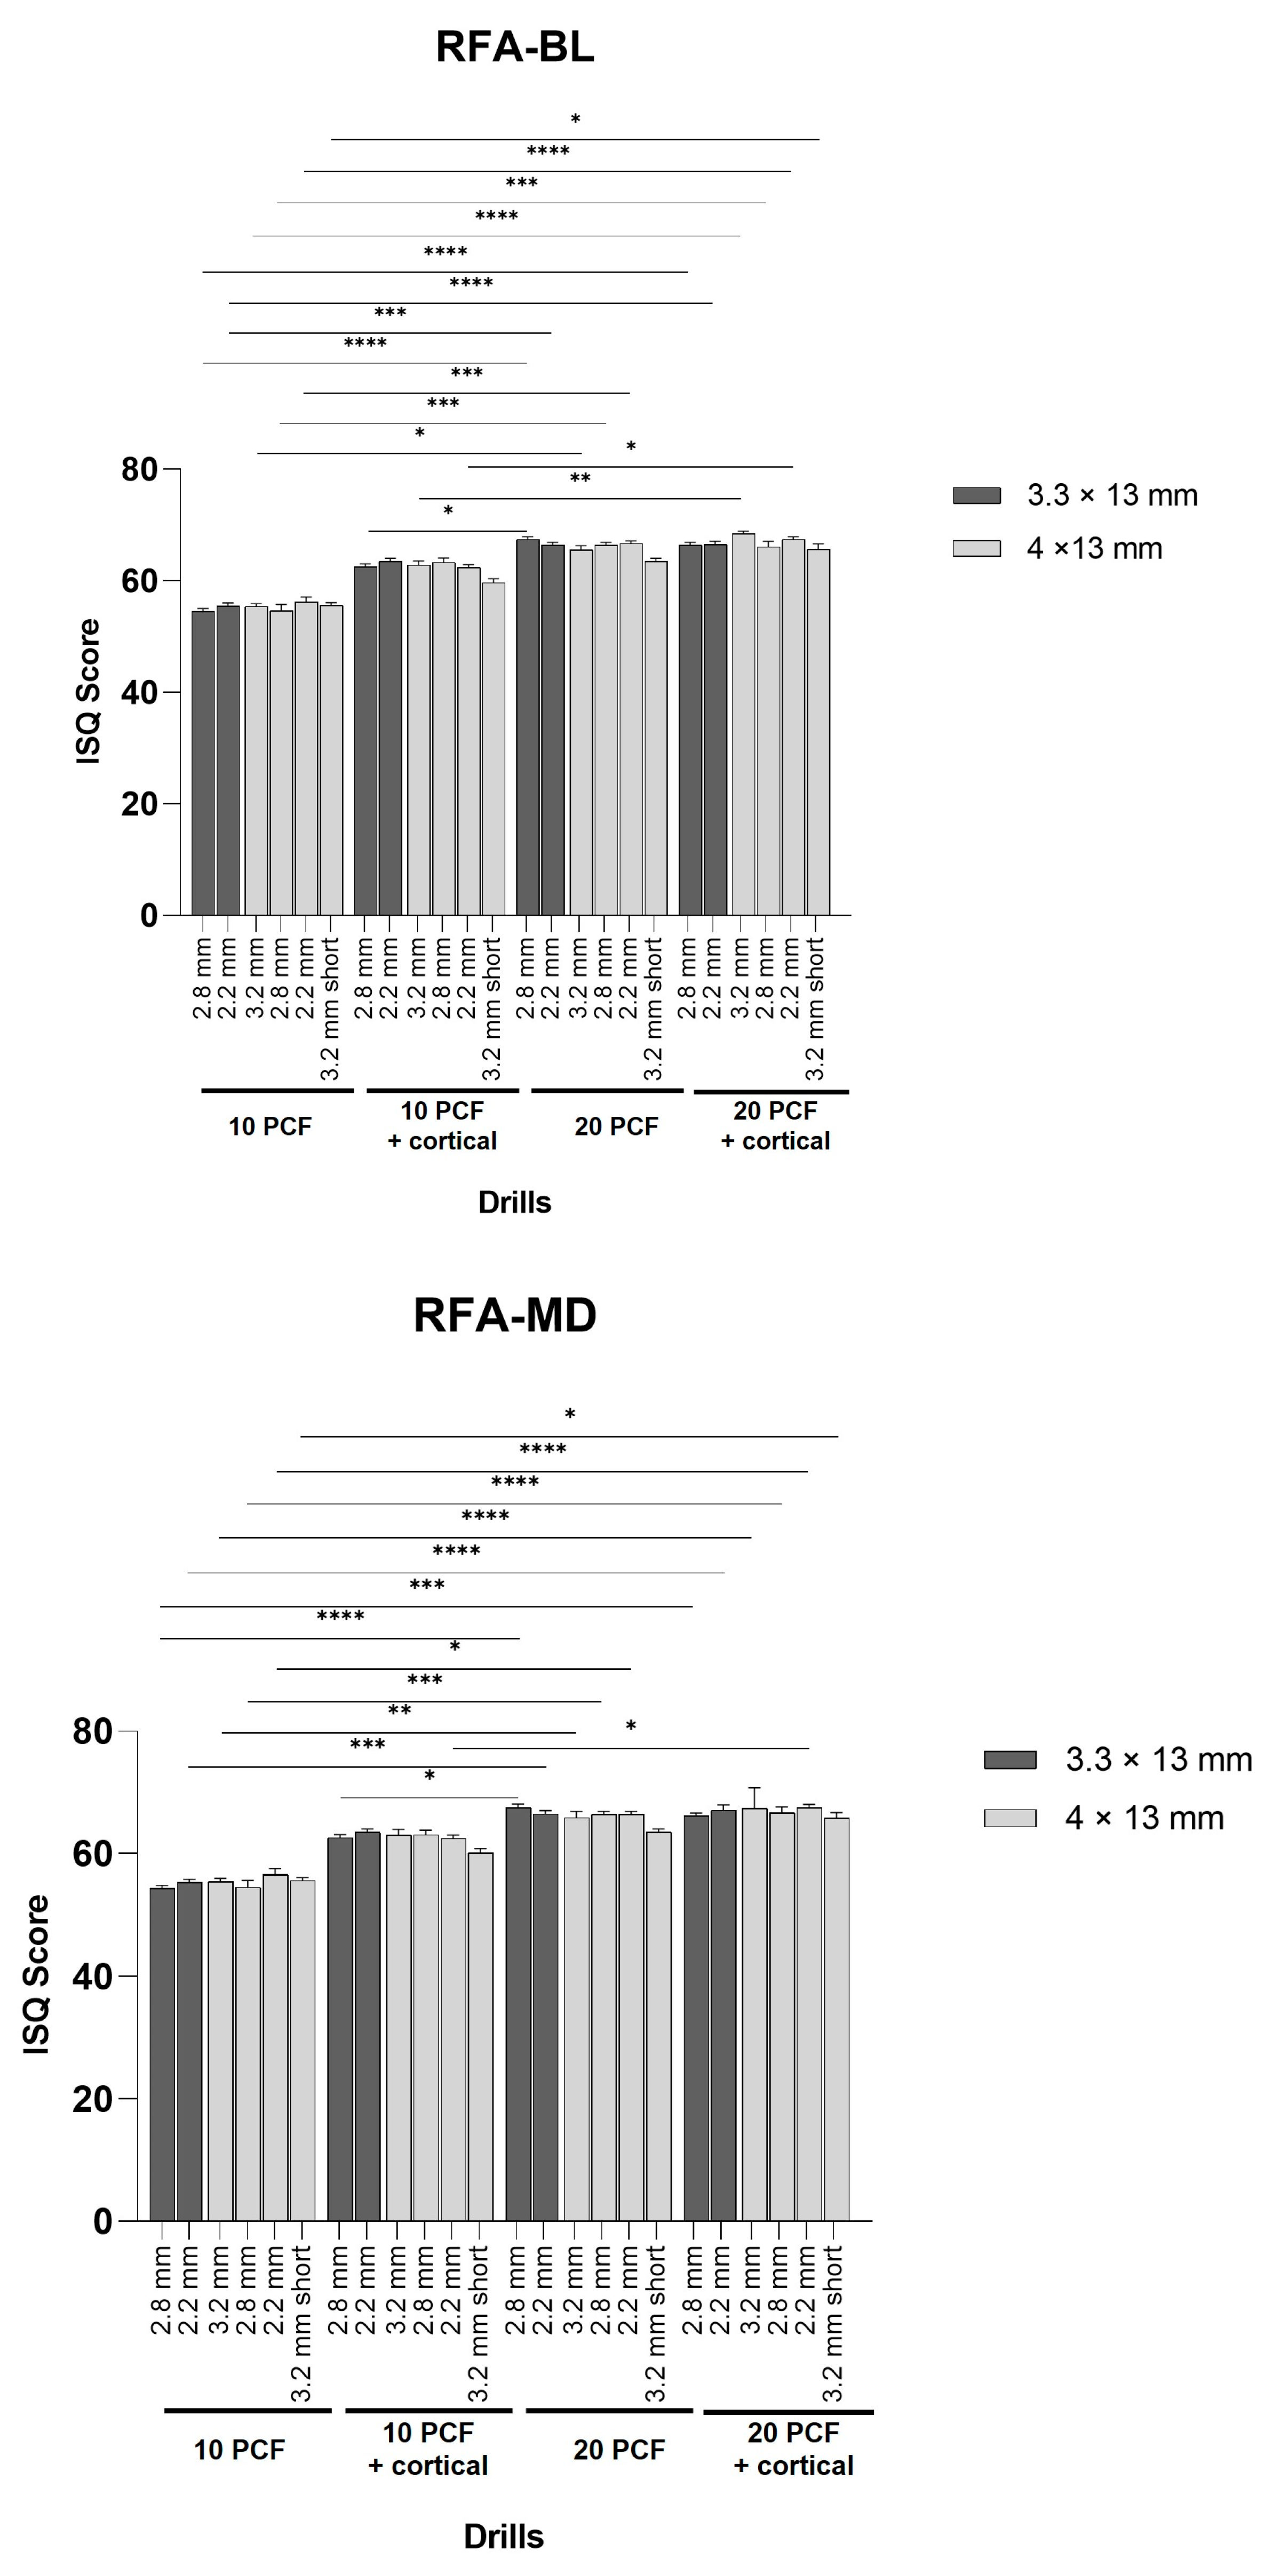
Concerning RFA values, they appeared uniform and high in all polyurethane densities and with all under-preparation protocols, without significant differences among the implants tested on the same foam. Indeed, all the values measured in the different experimental conditions were included between 53 and 69 ISQ. More specifically, higher values were registered in the highest-density block (20 PCF density with the cortical sheet), with 68.40 ± 0.52 ISQ and 67.50 ± 0.53 for 4 × 13 mm implants and 3.2 mm and 2.2 mm burs, respectively. In contrast, the lowest values were found in the 10 PCF density block without the cortical sheet but reaching 56.60 ± 0.97 ISQ for 4 × 13 mm implants and 55.50 ± 0.53 ISQ for 3.3 × 13 mm implants with 2.2 mm burs.
In particular, both 4 × 13 mm and 3.3 × 13 mm TAC implants inserted in the 20 PCF block with the cortical sheet using all the under-preparation protocols exhibited significantly higher RFA values in respect to the corresponding ones inserted in the 10 PCF block without the cortical, except for the 4 × 13 mm TAC implant and the “short” protocol in the 20 PCF density block without the cortical sheet. Additionally, 3.3 × 13 mm TAC implants inserted in the 20 PCF density block without the cortical sheet showed a significantly higher ISQ also in respect to the corresponding implants inserted in the 10 PCF density block with the cortical sheet (Figure 10).

4. Discussion

Several surgical techniques have been proposed to improve implant PS in cancellous low-quality and low-density bone, among which there is a surgical technique, called under-preparation of the bone site, which consists of preparing the bone site with a smaller size than the diameter of the implant used [5]. Tabassum et al. [35] showed a correlation between the implant PS and the thickness of a cortical artificial bone, with statistically significant higher IT and RT values for implants inserted in under-sized sites compared to press-fit sites in vitro. For this reason, the under-preparation of the bone sites seemed to improve the implant PS. In another in vitro study performed on fresh humid poor-quality bovine bone [36], it was demonstrated that a 10% under-preparation of the site was enough to increase the implant PS. Later, an animal study on sheep [37] also showed improved biomechanics of implants placed into under-drilled sites. However, during the early healing period, a major remodeling of the cortical bone was observed. Similar results were found by Antonacci et al. [38] in a systematic literature review with meta-regression, in which it was reported that marginal bone loss had a relationship with the drilling preparation technique and with the bone density, besides a greater mismatch between the implant and the osteotomy site, related to a higher marginal bone loss in higher bone densities. Even though the use of under-sized drilling may lead to higher marginal bone loss, it was used to increase the PS [39].
Moreover, in a human cadaver study, other researchers [23] reported an improved PS with under-sized implant site preparations and demonstrated significant correlations among the bone density, the IT, and the RFA. In addition, self-tapping implants with self-cutting flutes were also found to influence PS [9]. In fact, osseodensification determines a higher IT also in low-quality bone [40], as well as a significant increase in bone density, PS, bone-to-implant contact (BIC), and bone area frequency occupancy [41,42,43].
Thus, according to some in vitro and cadaver studies [5,6,22,26,44], the implant site under-preparation is able to significantly improve not only the IT and RFA, but also the implant PS in low-quality bone. Moreover, in preparing dental implant osteotomies, it was revealed that a low-speed drilling without irrigation has been comparable to conventional drilling [45].
In this work, IT values increased according to the site under-preparation, and so to the decreased size of the site, showing always a statistically significance among the different artificial bone densities. The ISQ score results were high in all the experimental conditions, especially in the highest artificial bone densities, where the reported RFA values were significantly higher in respect to those of implants inserted in the 10 PCF density block without the cortical sheet, except for 4 × 13 mm TAC implants and the “short” protocol in the 20 PCF density block without the cortical sheet. Moreover, 3.3 × 13 mm TAC implants inserted in the 20 PCF density block without the cortical sheet exhibited significantly higher ISQ also in respect to the corresponding implants inserted in the 10 PCF density block with the cortical sheet.
Nonetheless, no significant differences related to the amount of site under-preparation and to the implant diameter among the implants tested on the same polyurethane block have been reported in the present study. In other words, all these implants have shown a good stability using all the under-preparation protocols, mostly in higher-density polyurethane blocks. In low-density polyurethane blocks, it might be proposed to increase the under-preparation of the site up to 1.5–1.8 mm, since a 2.2 mm size seemed to show higher results mainly with 4 × 13 mm TAC implants in the 10 PCF density block without exhibiting a statistical significance.
Thus, the initial study hypothesis considering the RFA, RT, and IT increase proportionally to the increase in artificial bone density and site under-preparation was accepted, demonstrating no significant differences in ISQ values between the two implant diameters and under-sizing protocols. Regarding the IT, significant higher values have always been reported by 4 × 13 mm TAC implants and the 2.2 mm protocol (23.34 ± 0.79 Ncm and 11.88 ± 0.86 Ncm in 10 PCF density blocks with and without the cortical sheet, respectively, and 46.21 ± 0.79 Ncm and 39.28 ± 0.68 Ncm in 20 PCF density blocks with and without the cortical sheet, respectively), except when compared with 3.3 × 13 mm TAC implants and the 2.2 mm protocol in the 20 PCF density block without the cortical sheet. RT, instead, is clinically defined as the force needed to remove an implant from the bone and it is considered a predictable way to prove implant stability, indirectly providing information on the degree of bone-to-impact contact (BIC) [46]. Considering a maximum of 80 Ncm as a limit to prevent mechanical damage to implants and 30 Ncm as a valid level for RT assessment, it may be used for comparative tests on implant surfaces, macromorphologies, and materials [47,48]. Here, the RT values, as well as IT ones, were proportional to the increase in the polyurethane block density and to the decrease in the under-preparation size for both the implants tested. In particular, the values reached 39.09 ± 0.72 Ncm with 4 × 13 mm implants and 2.2 mm burs and 32.38 ± 0.68 Ncm with 3.3 × 13 mm implants and 2.2 mm burs in the 20 PCF density block with the cortical sheet, without statistically significant differences. In contrast, in the 10 PCF density block without the cortical sheet, the lowest RT values were registered for 4 × 13 mm TAC implants (6.81 ± 0.82 Ncm) and for 3.3 × 13 mm TAC implants (7.39 ± 0.34 Ncm) in the sites prepared with the 3.2 mm bur and the 2.8 mm bur, respectively, always not reporting significant differences. However, in the same bone density, 4 × 13 mm implants showed the highest RT values in 2.8 mm and 2.2 mm prepared sites (9.3 ± 0.43 and 10.41 ± 0.43 Ncm, respectively). In addition, the increase in RT values, in concomitance with the increase in the under-preparation, was about 4–14 Ncm lower than the corresponding IT values in 20 PCF density blocks with and without the cortical sheet and about 2–6 Ncm lower for 10 PCF density blocks with and without the cortical sheet. Based on the aforementioned results, this indicates a higher stability and contact with the material for both implants in the higher-density blocks and mainly with the 2.2 mm under-sizing protocol.
Concerning the limitations of the present study, the absence of human individual variability, bone response, and natural health or pathological bone microenvironment, as well as variables regarding the surgical technique, should be considered in order to better discuss these data. Although polyurethane foams have been often used in implant research because of their consistent and reproducible testing nature, they will never be able to fully replicate the complex properties of a real bone. Therefore, the results obtained in this study may not fully reflect the in vivo performance of TAC implants. Other limitations could be related to the choice of only low polyurethane block densities to test the effectiveness of under-sizing and the assessment of a limited type of forces tested on implants. In fact, higher densities mimicking the D2-D1 bone type, besides evaluating the biomechanical performance of dental implants with finite element analysis (FEA) studies would further strengthen the use of polyurethane foams as a human bone model to study implant behavior.
However, with all the strong limitations related to an in vitro study performed on a non-human bone tissue, the authors may speculate that this preliminary information, in the future, after the essential and urgent corroboration of data with animal and clinical studies, could be useful for clinicians who intend to use the One-Abutment One-Time technique. In fact, if the registered IT values are too low, it will be neither possible to insert the prosthetic components nor to immediately load the implants. The so-called “short” protocol could be proposed in case of a wider crestal bone area and in the presence of a high-quality and particularly thick cortical bone, when the implant insertion could be difficult, and a significant increase in the IT could be necessary (up to 70–100 Ncm). Moreover, the macromorphology of the implants used in this in vitro study presents cutting threads that might be of great help during the implant insertion, so it could be inserted with a relatively low torque, without stressing the implant–abutment connection and the peri-implant tissues.
Lastly, in the future, it could be also interesting and useful to evaluate the effect of such under-preparation protocols on PS implantation on alternative in vitro models, such as 3D-printed bone grafts, which could represent a personalized regenerative medicine approach compared to artificial bone [49].

5. Conclusions

In the present research, the IT and RT of both implant diameters have always shown increasing values that were proportional to the decrease in the under-preparation size. Furthermore, the registered RFA values were uniformly high in all different polyurethane densities, when using all the different under-preparation protocols and implants, except for higher-density blocks that showed significantly higher ISQ in respect to the 10 PCF density block without the cortical sheet.
In conclusion, the under-drilling of implant sites has been shown to be effective in increasing the implant PS in a low-density artificial bone model and from a clinical point of view; it was interesting to see no significant RFA differences between the two implant groups in order to choose the smaller diameter that needs less under-sizing and maybe use the 4 mm diameter with a higher under-preparation of the site only in low-density bones.

Author Contributions

Conceptualization, L.C., U.C. and A.P.; methodology, L.C. and M.T.; software, T.R.; validation, T.R., N.D.P. and L.M.; formal analysis, T.R. and M.P.; investigation, L.C.; resources, L.C. and U.C.; data curation, T.R. and N.D.P.; writing—original draft preparation, L.C., M.T., A.P., T.R. and N.D.P.; writing—review and editing, A.P., U.C. and N.D.P.; visualization, M.P.; supervision, L.C. and A.P.; project administration, L.C. All authors have read and agreed to the published version of the manuscript.

Funding

This research received no external funding.

Institutional Review Board Statement

Not applicable.

Informed Consent Statement

Not applicable.

Data Availability Statement

Data are contained within the article and available on request from the corresponding author.

Acknowledgments

AoN Implants S.r.l. Company, Grisignano di Zocco, Vicenza, Italy, provided the implants at no cost and this is gratefully acknowledged.

Conflicts of Interest

The authors declare no conflict of interest.

References

  1. Marquezan, M.; Osório, A.; Sant’Anna, E.; Souza, M.M.; Maia, L. Does bone mineral density influence the primary stability of dental implants? A systematic review. Clin. Oral Implant. Res. 2012, 23, 767–774. [Google Scholar] [CrossRef]
  2. Jimbo, R.; Tovar, N.; Marin, C.; Teixeira, H.; Anchieta, R.; Silveira, L.; Janal, M.; Shibli, J.; Coelho, P. The impact of a modified cutting flute implant design on osseointegration. Int. J. Oral Maxillofac. Surg. 2014, 43, 883–888. [Google Scholar] [CrossRef] [PubMed]
  3. Hsu, Y.-Y.; Huang, H.-L.; Fuh, L.-J.; Tsai, M.-T.; Hsu, J.-T. The Effects of Insertion Approach on the Stability of Dental Implants. Appl. Bionics Biomech. 2022, 2022, 7188240. [Google Scholar] [CrossRef] [PubMed]
  4. Yamaguchi, Y.; Shiota, M.; FuJii, M.; Sekiya, M.; Ozeki, M. Development and application of a direct method to observe the implant/bone interface using simulated bone. Springerplus 2016, 5, 494. [Google Scholar] [CrossRef] [PubMed]
  5. Lemos, B.F.; Lopez-Jarana, P.; Falcao, C.; Ríos-Carrasco, B.; Gil, J.; Ríos-Santos, J.V.; Herrero-Climent, M. Effects of Different Undersizing Site Preparations on Implant Stability. Int. J. Environ. Res. Public Health 2020, 17, 8965. [Google Scholar] [CrossRef] [PubMed]
  6. Krischik, D.; Tokgöz, S.E.; van Orten, A.; Friedmann, A.; Bilhan, H. An In Vitro Evaluation of Primary Stability Values for Two Differently Designed Implants to Suit Immediate Loading in Very Soft Bone. Dent. J. 2021, 9, 5. [Google Scholar] [CrossRef]
  7. Al-Sabbagh, M.; Eldomiaty, W.; Khabbaz, Y. Can Osseointegration Be Achieved Without Primary Stability? Dent. Clin. N. Am. 2019, 63, 461–473. [Google Scholar] [CrossRef]
  8. Trisi, P.; Perfetti, G.; Baldoni, E.; Berardi, D.; Colagiovanni, M.; Scogna, G. Implant micromotion is related to peak insertion torque and bone density. Clin. Oral Implant. Res. 2009, 20, 467–471. [Google Scholar] [CrossRef]
  9. Hsieh, M.-C.; Huang, C.-H.; Hsu, M.-L. Effect of cutting flute design features on primary stability of immediate implant placement and restoration: A dynamic experimental analysis. Med. Biol. Eng. Comput. 2023, 61, 475–484. [Google Scholar] [CrossRef]
  10. Möhlhenrich, S.; Heussen, N.; Elvers, D.; Steiner, T.; Hölzle, F.; Modabber, A. Compensating for poor primary implant stability in different bone densities by varying implant geometry: A laboratory study. Int. J. Oral Maxillofac. Surg. 2015, 44, 1514–1520. [Google Scholar] [CrossRef]
  11. Gonzalez-Serrano, J.; Ortega-Aranegui, R.; Lopez-Quiles, J. In vitro comparison of primary stability of two implant designs in D3 bone. Med. Oral Patol. Oral Cir. Bucal. 2017, 22, e473–e477. [Google Scholar] [CrossRef] [PubMed]
  12. Kohli, N.; Stoddart, J.C.; van Arkel, R.J. The limit of tolerable micromotion for implant osseointegration: A systematic review. Sci. Rep. 2021, 11, 10797. [Google Scholar] [CrossRef] [PubMed]
  13. Zhu, Y.; Zheng, X.; Zeng, G.; Xu, Y.; Qu, X.; Zhu, M.; Lu, E. Clinical efficacy of early loading versus conventional loading of dental implants. Sci. Rep. 2015, 5, 15995. [Google Scholar] [CrossRef] [PubMed]
  14. Calandriello, R.; Tomatis, M.; Rangert, B. Immediate functional loading of Brånemark System implants with enhanced initial stability: A prospective 1- to 2-year clinical and radiographic study. Clin. Implant. Dent. Relat. Res. 2003, 55 (Suppl. 1), 10–20. [Google Scholar] [CrossRef]
  15. Del Giudice, R.; Piattelli, A.; Grande, N.; Cataneo, E.; Crispino, A.; Petrini, M. Implant insertion torque value in immediate loading: A retrospective study. Med. Oral Patol. Oral Cir Bucal. 2019, 24, e398–e403. [Google Scholar] [CrossRef]
  16. Tsolaki, I.N.; Tonsekar, P.P.; Najafi, B.; Drew, H.J.; Sullivan, A.J.; Petrov, S.D. Comparison of Osteotome and Conventional Drilling Techniques for Primary Implant Stability: An In Vitro Study. J. Oral Implant. 2016, 42, 321–325. [Google Scholar] [CrossRef]
  17. Gehrke, S.A.; Guirado, J.L.C.; Bettach, R.; Del Fabbro, M.; Martínez, C.P.-A.; Shibli, J.A. Evaluation of the insertion torque, implant stability quotient and drilled hole quality for different drill design: An in vitro Investigation. Clin. Oral Implant. Res. 2018, 29, 656–662. [Google Scholar] [CrossRef]
  18. Al-Tarawneh, S.; Thalji, G.; Cooper, L. Macrogeometric Differentiation of Dental Implant Primary Stability: An In Vitro Study. Int. J. Oral Maxillofac. Implant. 2022, 37, 1110–1118. [Google Scholar] [CrossRef]
  19. Romanos, G.E.; Bastardi, D.J.; Moore, R.; Kakar, A.; Herin, Y.; Delgado-Ruiz, R.A. In Vitro Effect of Drilling Speed on the Primary Stability of Narrow Diameter Implants with Varying Thread Designs Placed in Different Qualities of Simulated Bone. Materials 2019, 12, 1350. [Google Scholar] [CrossRef]
  20. Di Stefano, D.A.; Arosio, P.; Gastaldi, G.; Gherlone, E. The insertion torque-depth curve integral as a measure of implant primary stability: An in vitro study on polyurethane foam blocks. J. Prosthet. Dent. 2018, 120, 706–714. [Google Scholar] [CrossRef]
  21. Romanos, G.E.; Delgado-Ruiz, R.A.; Sacks, D.; Calvo-Guirado, J.L. Influence of the implant diameter and bone quality on the primary stability of porous tantalum trabecular metal dental implants: An in vitro biomechanical study. Clin. Oral Implant. Res. 2018, 29, 649–655. [Google Scholar] [CrossRef]
  22. Herrero-Climent, M.; Lemos, B.F.; Herrero-Climent, F.; Falcao, C.; Oliveira, H.; Herrera, M.; Gil, F.J.; Ríos-Carrasco, B.; Ríos-Santos, J.V. Influence of Implant Design and Under-Preparation of the Implant Site on Implant Primary Stability. An In Vitro Study. Int. J. Environ. Res. Public Health 2020, 17, 4436. [Google Scholar] [CrossRef] [PubMed]
  23. Turkyilmaz, I.; Tozum, T. Enhancing primary implant stability by undersizing implant site preparation: A human cadaver study. J. Stomatol. Oral Maxillofac. Surg. 2020, 121, 58–62. [Google Scholar] [CrossRef] [PubMed]
  24. Degidi, M.; Daprile, G.; Piattelli, A. Influence of Stepped Osteotomy on Primary Stability of Implants Inserted in Low-Density Bone Sites: An In Vitro Study. Int. J. Oral Maxillofac. Implant. 2017, 32, 37–41. [Google Scholar] [CrossRef] [PubMed]
  25. Arosio, P.; Greco, G.B.; Zaniol, T.; Iezzi, G.; Perrotti, V.; Di Stefano, D.A. Sinus augmentation and concomitant implant placement in low bone-density sites. A retrospective study on an undersized drilling protocol and primary stability. Clin. Implant. Dent. Relat. Res. 2018, 20, 151–159. [Google Scholar] [CrossRef]
  26. Boustany, C.M.; Reed, H.; Cunningham, G.; Richards, M.; Kanawati, A. Effect of a Modified Stepped Osteotomy on the Primary Stability of Dental Implants in Low-Density Bone: A Cadaver Study. Int. J. Oral Maxillofac. Implant. 2015, 30, 48–55. [Google Scholar] [CrossRef] [PubMed]
  27. Comuzzi, L.; Tumedei, M.; Romasco, T.; Petrini, M.; Afrashtehfar, K.I.; Inchingolo, F.; Piattelli, A.; Di Pietro, N. Insertion Torque, Removal Torque, and Resonance Frequency Analysis Values of Ultrashort, Short, and Standard Dental Implants: An In Vitro Study on Polyurethane Foam Sheets. J. Funct. Biomater. 2022, 14, 10. [Google Scholar] [CrossRef]
  28. Comuzzi, L.; Tumedei, M.; Di Pietro, N.; Romasco, T.; Montesani, L.; Piattelli, A.; Covani, U. Are Implant Threads Important for Implant Stability? An In Vitro Study Using Low-Density Polyurethane Sheets. Eng 2023, 4, 1167–1178. [Google Scholar] [CrossRef]
  29. Fanali, S.; Tumedei, M.; Pignatelli, P.; Inchingolo, F.; Pennacchietti, P.; Pace, G.; Piattelli, A. Implant primary stability with an osteocondensation drilling protocol in different density polyurethane blocks. Comput. Methods Biomech. Biomed. Eng. 2021, 24, 14–20. [Google Scholar] [CrossRef]
  30. Meredith, N.; Alleyne, D.; Cawley, P. Quantitative determination of the stability of the implant-tissue interface using resonance frequency analysis. Clin. Oral Implant. Res. 1996, 7, 261–267. [Google Scholar] [CrossRef]
  31. Mish, C.E. Bone Dentistry. A Key Determinant for Clinical Success. Contemp. Implant Dent. 1998, 1, 109–118. [Google Scholar]
  32. Calvert, K.L.; Trumble, K.P.; Webster, T.J.; Kirkpatrick, L.A. Characterization of commercial rigid polyurethane foams used as bone analogs for implant testing. J. Mater. Sci. Mater. Med. 2010, 21, 1453–1461. [Google Scholar] [CrossRef] [PubMed]
  33. Nagaraja, S.; Palepu, V. Comparisons of Anterior Plate Screw Pullout Strength Between Polyurethane Foams and Thoracolumbar Cadaveric Vertebrae. J. Biomech. Eng. 2016, 138, 104505. [Google Scholar] [CrossRef] [PubMed]
  34. ASTM F1839; Standard Specification for Rigid Polyurethane Foam for Use as a Standard Material for Testing Orthopaedic Devices and Instruments. American Society for Testing and Materials; ASTM: West Conshohocken, PA, USA, 2008. [CrossRef]
  35. Tabassum, A.; Meijer, G.J.; Wolke, J.G.; Jansen, J.A. Influence of surgical technique and surface roughness on the primary stability of an implant in artificial bone with different cortical thickness: A laboratory study. Clin. Oral Implant. Res. 2010, 21, 213–220. [Google Scholar] [CrossRef] [PubMed]
  36. Degidi, M.; Daprile, G.; Piattelli, A. Influence of Underpreparation on Primary Stability of Implants Inserted in Poor Quality Bone Sites: An In Vitro Study. J. Oral Maxillofac. Surg. 2015, 73, 1084–1088. [Google Scholar] [CrossRef]
  37. Stocchero, M.; Toia, M.; Jinno, Y.; Cecchinato, F.; Becktor, J.P.; Naito, Y.; Halldin, A.; Jimbo, R. Influence of different drilling preparation on cortical bone: A biomechanical, histological, and micro-CT study on sheep. Clin. Oral Implant. Res. 2018, 29, 707–715. [Google Scholar] [CrossRef]
  38. Antonacci, D.; Del Fabbro, M.; Bollero, P.; Stocchero, M.; Jinno, Y.; Canullo, L. Clinical effects of conventional and underprepared drilling preparation of the implant site based on bone density: A systematic review and meta-regression. J. Prosthodont. Res. 2023, 67, 23–34. [Google Scholar] [CrossRef]
  39. Karl, M.; Irastorza-Landa, A. Does Implant Design Affect Primary Stability in Extraction Sites? Quintessence Int. 2017, 48, 219–224. [Google Scholar] [CrossRef]
  40. Lahens, B.; Neiva, R.; Tovar, N.; Alifarag, A.M.; Jimbo, R.; Bonfante, E.A.; Bowers, M.M.; Cuppini, M.; Freitas, H.; Witek, L.; et al. Biomechanical and histologic basis of osseodensification drilling for endosteal implant placement in low density bone. An experimental study in sheep. J. Mech. Behav. Biomed. Mater. 2016, 63, 56–65. [Google Scholar] [CrossRef]
  41. Gaikwad, A.M.; Joshi, A.A.; Nadgere, J.B. Biomechanical and histomorphometric analysis of endosteal implants placed by using the osseodensification technique in animal models: A systematic review and meta-analysis. J. Prosthet. Dent. 2022, 127, 61–70. [Google Scholar] [CrossRef]
  42. Yeh, Y.-T.; Chu, T.-M.; Blanchard, S.; Hamada, Y. Effects on Ridge Dimensions, Bone Density, and Implant Primary Stability with Osseodensification Approach in Implant Osteotomy Preparation. Int. J. Oral Maxillofac. Implant. 2021, 36, 474–484. [Google Scholar] [CrossRef] [PubMed]
  43. Mullings, O.; Tovar, N.; de Bortoli, J.; Parra, M.; Torroni, A.; Coelho, P.; Witek, L. Osseodensification Versus Subtractive Drilling Techniques in Bone Healing and Implant Osseointegration: Ex Vivo Histomorphologic/Histomorphometric Analysis in a Low-Density Bone Ovine Model. Int. J. Oral Maxillofac. Implant. 2021, 36, 903–909. [Google Scholar] [CrossRef] [PubMed]
  44. El-Kholey, K.E.; Elkomy, A. Does the Drilling Technique for Implant Site Preparation Enhance Implant Success in Low-Density Bone? A Systematic Review. Implant. Dent. 2019, 28, 500–509. [Google Scholar] [CrossRef] [PubMed]
  45. Bernabeu-Mira, J.C.; Soto-Peñaloza, D.; Peñarrocha-Diago, M.; Camacho-Alonso, F.; Rivas-Ballester, R.; Peñarrocha-Oltra, D. Low-speed drilling without irrigation versus conventional drilling for dental implant osteotomy preparation: A systematic review. Clin. Oral Investig. 2021, 25, 4251–4267. [Google Scholar] [CrossRef] [PubMed]
  46. Simeone, S.G.; Rios, M.; Simonpietri, J. “Reverse torque of 30 Ncm applied to dental implants as test for osseointegration”—A human observational study. Int. J. Implant. Dent. 2016, 2, 26. [Google Scholar] [CrossRef] [PubMed]
  47. Ferguson, S.J.; Broggini, N.; Wieland, M.; De Wild, M.; Rupp, F.; Geis-Gerstorfer, J.; Cochran, D.L.; Buser, D. Biomechanical evaluation of the interfacial strength of a chemically modified sandblasted and acid-etched titanium surface. J. Biomed. Mater. Res. A 2006, 2, 291–297. [Google Scholar] [CrossRef]
  48. Gottlow, J.; Dard, M.; Kjellson, F.; Obrecht, M.; Sennerby, L. Evaluation of a New Titanium-Zirconium Dental Implant: A Biomechanical and Histological Comparative Study in the Mini Pig. Clin. Implant. Dent. Relat. Res. 2012, 14, 538–545. [Google Scholar] [CrossRef]
  49. Thurzo, A.; Gálfiová, P.; Nováková, Z.V.; Polák, Š.; Varga, I.; Strunga, M.; Urban, R.; Surovková, J.; Leško, Ľ.; Hajdúchová, Z.; et al. Fabrication and In Vitro Characterization of Novel Hydroxyapatite Scaffolds 3D Printed Using Polyvinyl Alcohol as a Thermoplastic Binder. Int. J. Mol. Sci. 2022, 23, 14870. [Google Scholar] [CrossRef]
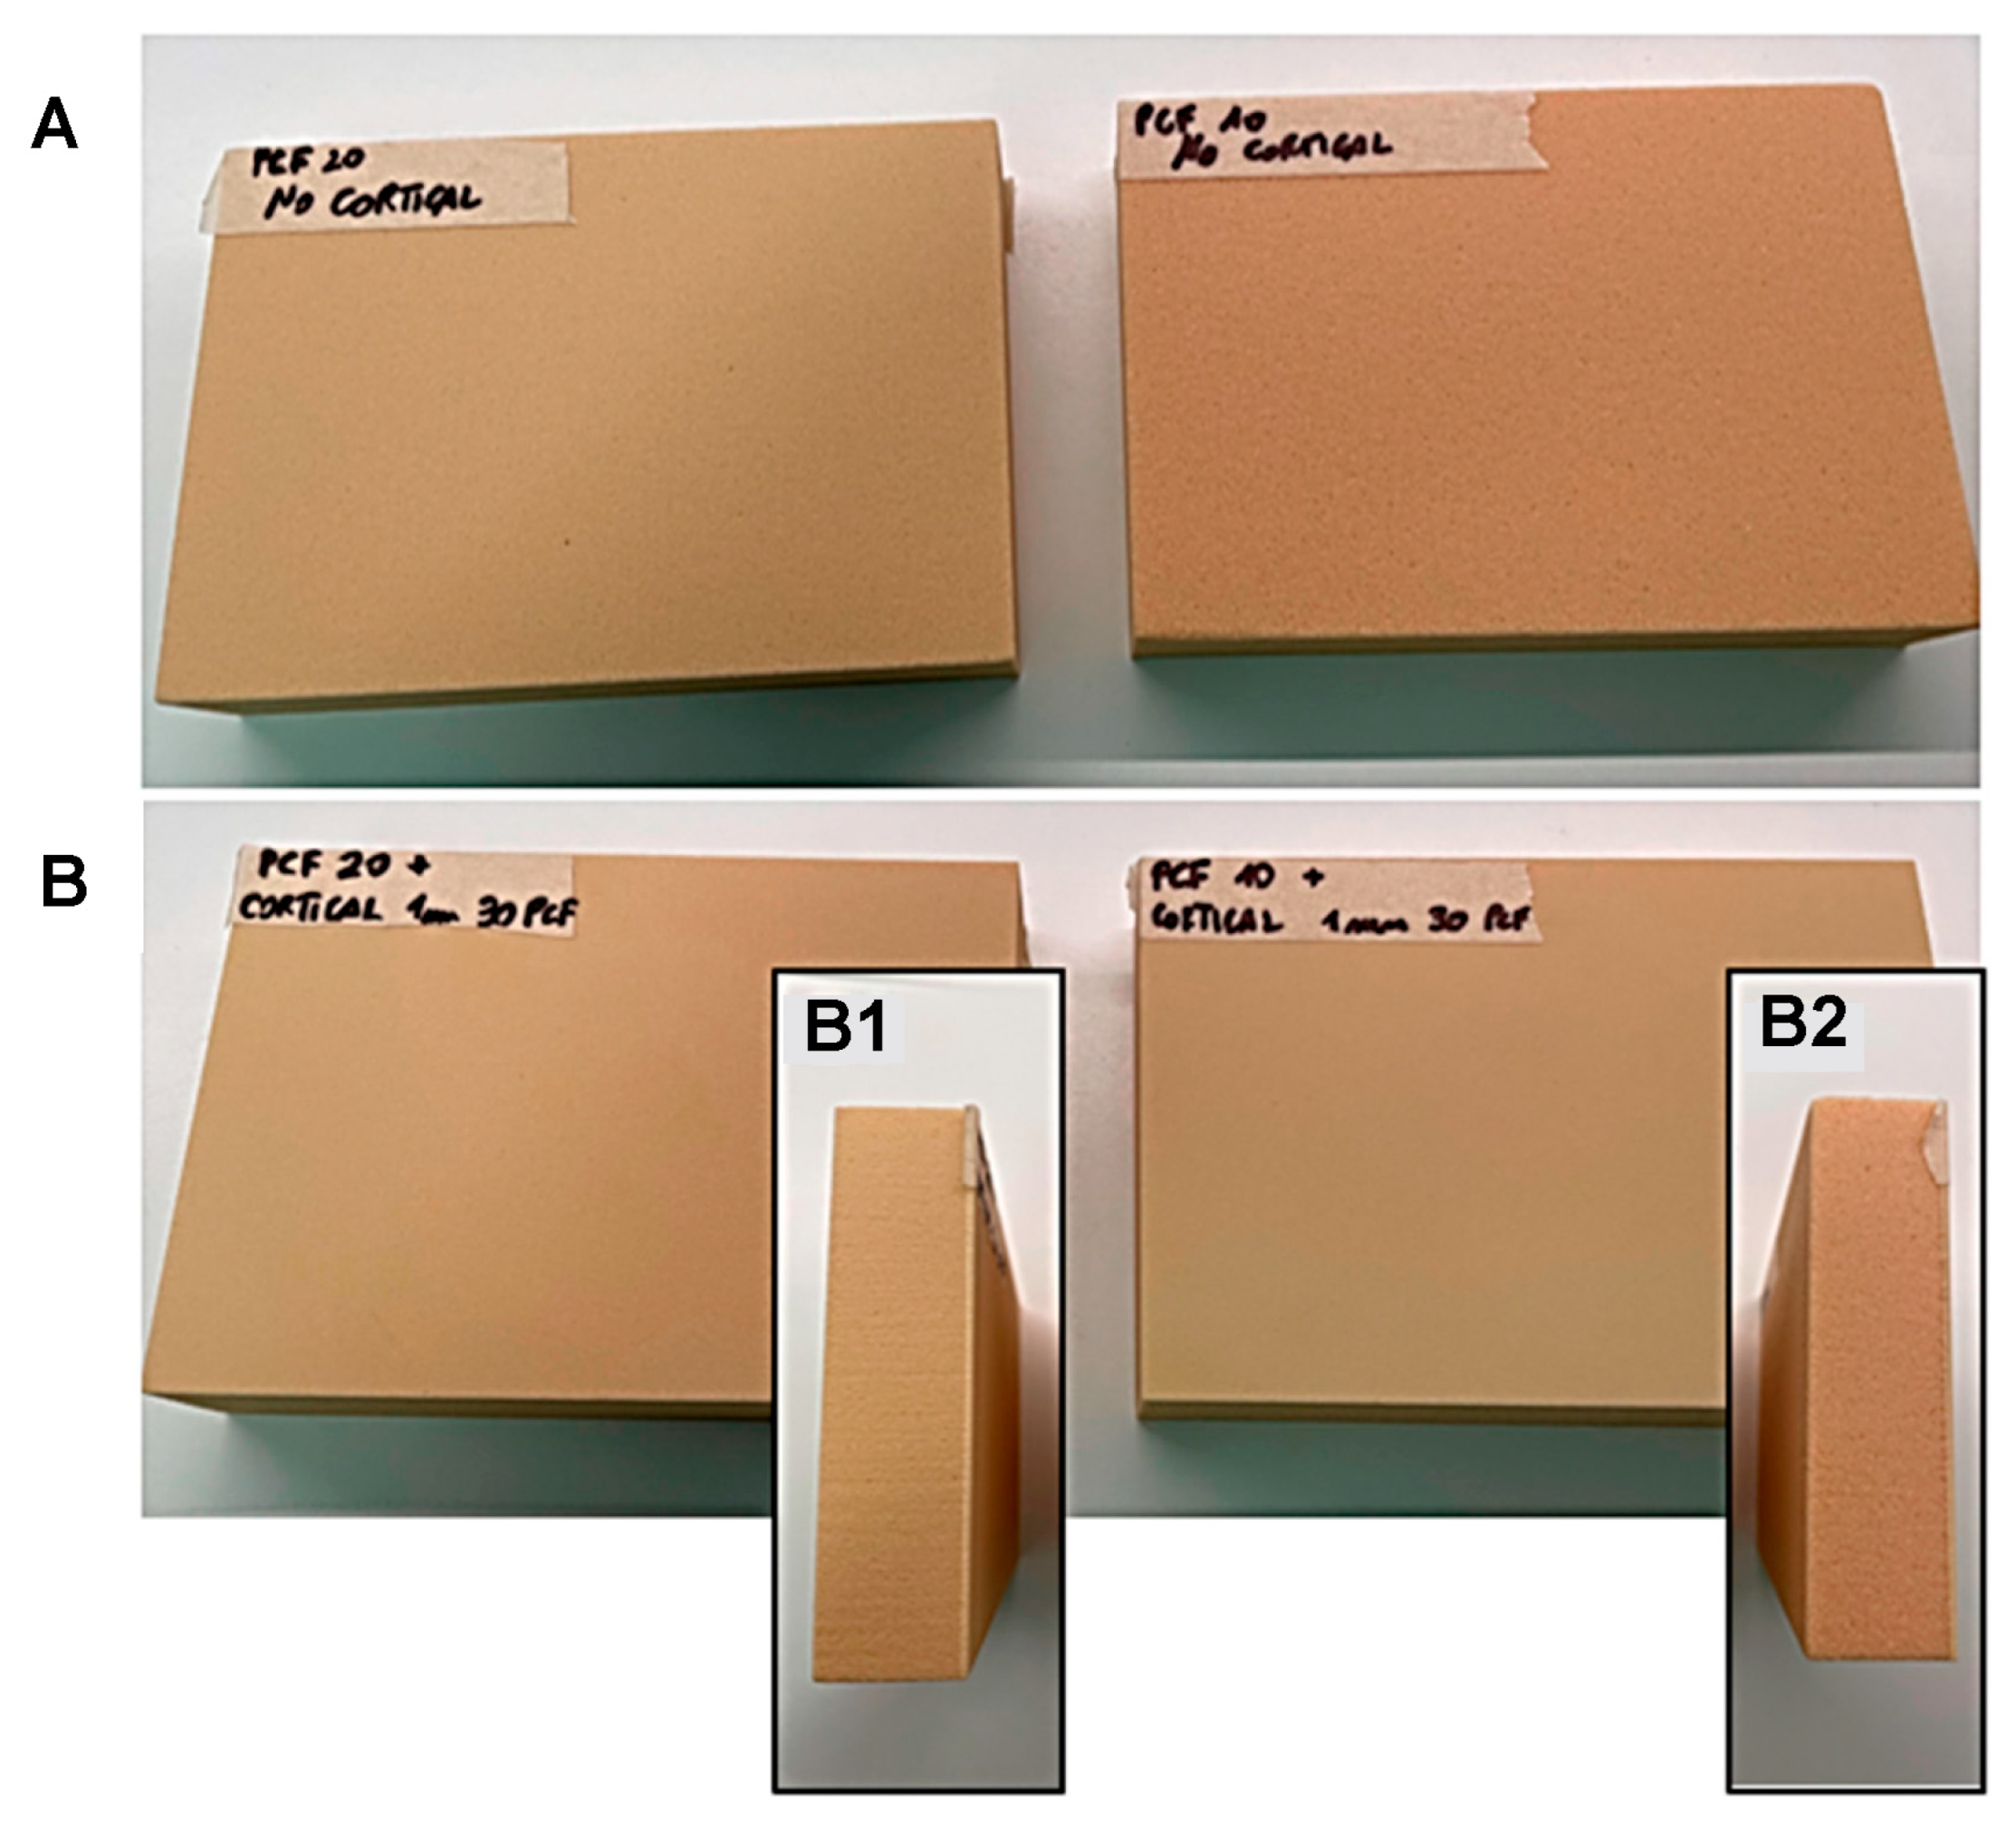
Figure 1. Details of 20 pounds per cubic foot (PCF) (on the left) and 10 PCF (on the right) density blocks, (A) without or (B,B1,B2) with a 30 PCF density cortical sheet, used in the in vitro simulation.
Applsci 13 06041 g001
Figure 2. (A) Magnifications of both the tested implants inserted in the 10 PCF density (on the left) and the 10 PCF density with a 30 PCF density cortical sheet (on the right). (B) Magnifications of both the tested implants inserted in the 20 PCF density (on the left) and the 20 PCF density with a 30 PCF density cortical sheet (on the right).
Applsci 13 06041 g002
Figure 3. Representative images of the 3.3 mm × 13 mm TAC implant. From left to right: bottom, lateral, and top views.
Applsci 13 06041 g003
Figure 4. Representative images of the 4 mm × 13 mm TAC implant. From left to right: bottom, lateral, and top views.
Applsci 13 06041 g004
Figure 5. Representative images of the (A) implant kit; (B) macrogeometry of the 3.3 mm × 13 mm TAC implant and specific lances used for under-drilling; (C) macrogeometry of the 4 mm × 13 mm TAC implant with specific lances used for under-drilling; (D) Chiropro surgical motor display.
Applsci 13 06041 g005
Figure 6. Summary of the study design and the experimental conditions.
Applsci 13 06041 g006
Figure 7. Representative images of (A) polyurethane blocks after site under-preparation (on the left) and insertion of the implants in the different polyurethane foam blocks (on the right); (B) resonance frequency analysis (RFA) measurements: implant stability quotient (ISQ) registration.
Applsci 13 06041 g007
Figure 8. IT measurements derived from the two types of implants inserted in all artificial bone densities. Data are expressed as means ± standard deviation (SD), following the one-way analysis of variance (ANOVA) test. All the values are significant, with p < 0.05, except for those indicated as not significant (ns).
Applsci 13 06041 g008
Figure 9. RT measurements derived from the two types of implants inserted in all the artificial bone densities. Data are expressed as means ± SD, following the Kolmogorov–Smirnov test. * p < 0.05, ** p < 0.01, *** p < 0.001, **** p < 0.0001.
Applsci 13 06041 g009
Figure 10. RFA measurements (RFA-BL on the top and RFA-MD on the bottom) derived from the two types of implants inserted in all the artificial bone densities. Data are expressed as means ± SD, following the Kolmogorov–Smirnov test. * p < 0.05, ** p < 0.01, *** p < 0.001, **** p < 0.0001.
Applsci 13 06041 g010
Table 1. Summary of the mechanical properties concerning the polyurethane foams used in this study and the corresponding ASTM F-1839-08 specifications.
DensityCompressionShear
PCFg/ccStrength
(MPa)
Modulus
(MPa)
Strength
(MPa)
Modulus
(MPa)
Sawbones Europe AB (Malmö, Sweden)100.162.2581.619
200.328.42104.349
300.48184457.687
ASTM F1839-08 required values [34]100.14–0.181.745–2.82045.75–71.701.225–2.01015.15–22.75
200.29–0.356.630–10.45167.5–257.53.395–5.27540.75–59.25
300.43–0.5314.30–22.70355.5–548.57.460–11.9571.70–105.0
Table 2. Summary of the insertion torque (IT), removal torque (RT), and resonance frequency analysis (RFA) (measured in the bucco-lingual (RFA-BL) and mesio-distal (RFA-MD) orientations) values reported for the two implant types (in blue: 3.3 × 13 mm TAC implants and in yellow: 4 × 13 mm TAC implants) in the different foam densities expressed in pound per cubic foot (PCF). Data are reported as the mean (in Ncm for IT and RT and in implant stability quotient (ISQ) score for RFA-BL and RFA-MD) and the standard deviation (SD). Under-preparation sizes: (a) 2.8 mm, (b) 2.2 mm, (c) 3.2 mm, (d) 2.8 mm, (e) 2.2 mm, and (f) 3.2 mm short.
IT10 PCF10 PCF + Cortical20 PCF20 PCF + Cortical
abcdefabcdefabcdefabcdef
Mean8.389.318.3610.3811.8810.0312.6016.7312.8917.8023.3415.4328.5838.4524.4735.7539.2837.3331.0244.1927.7439.4746.2135.89
SD0.430.410.520.380.861.570.550.770.750.810.790.640.630.890.860.390.680.680.840.670.610.650.791.17
RT10 PCF10 PCF + cortical20 PCF20 PCF + cortical
abcdefabcdefabcdefabcdef
Mean7.398.316.819.3010.418.4211.2814.4511.1114.7917.2411.1617.9227.5514.8724,9036.6523.7519.4632.3823.8434.4239.0928.67
SD0.340.430.820.430.430.400.920.530.890.760.741.290.640.800.750.491.060.810.680.680.970.710.720.84
RFA-BL10 PCF10 PCF + cortical20 PCF20 PCF + cortical
abcdefabcdefabcdefabcdef
Mean54.5055.5055.4054.6056.2055.662.5063.5062.8063.3062.4059.7067.4066.4065.6066.4066.7063.5066.4066.6068.4066.1067.4065.70
SD0.530.530.521.170.920.520.530.530.790.820.520.670.520.520.700.520.480.530.520.520.520.990.520.95
RFA-MD10 PCF10 PCF + cortical20 PCF20 PCF + cortical
abcdefabcdefabcdefabcdef
Mean54.5055.4055.5054.6056.6055.762.6063.5063.0063.1062.5060.1067.6066.5065.9066.4066.4063.5066.2067.1067.4066.7067.5065.80
SD0.520.520.531.080.970.480.520.530.940.740.530.740.520.530.990.520.520.530.420.883.340.950.530.92
Disclaimer/Publisher’s Note: The statements, opinions and data contained in all publications are solely those of the individual author(s) and contributor(s) and not of MDPI and/or the editor(s). MDPI and/or the editor(s) disclaim responsibility for any injury to people or property resulting from any ideas, methods, instructions or products referred to in the content.