Article

The Variation of Surface Shape in the Gas Jet Forming

1
School of Mechatronic Engineering and Automation, Foshan University, Foshan 528001, China
2
Ministry of Education Key Laboratory for Cross-Scale Micro and Nano Manufacturing, Changchun 130022, China
3
School of Mechatronic Engineering, Changchun University of Science and Technology, Changchun 130022, China
*
Author to whom correspondence should be addressed.
Appl. Sci. 2023, 13(1), 504; https://doi.org/10.3390/app13010504
Submission received: 4 December 2022 / Revised: 27 December 2022 / Accepted: 27 December 2022 / Published: 30 December 2022
(This article belongs to the Special Issue Advanced Manufacturing Processes)

Abstract

:
This study investigated the the gas jet forming process for optical aspherical mirror blanks. The trend of the influence of the gas jet parameters on the surface shape of the mirror blanks was inferred by analysing the variation in the morphology of the gas jet stream. Based on the theoretical analysis, the inference was verified by numerical simulation. The experimental results were compared with the simulation predictions, and it was found that the average prediction deviation for the diameter was 1.07 mm, while the average prediction deviation for the principal curvature was 0.03665 mm−1, which is challenging to correct in simulation. Therefore, we developed a dimensionless prediction model of the surface curvature and surface diameter of the mirror blanks by considering the jet parameters using experimental data. The model’s average prediction error for the surface diameter of the formed surface was 0.3192 mm, and the average prediction error of the principal curvature for the formed surface was 0.00269 mm−1.

1. Introduction

With the development of technology, aspherical mirrors are widely used in aerospace, medical testing, and information communication, and are among the core components of modern optical systems. For instance, the Giant Magellan Telescope developed by the University of Arizona and the telescopes developed by NASA all employ high sub-aspherical mirrors [1,2]. Mirror blanks are the substrates used for optical mirror coatings, and their surface accuracy and quality determine the optical performance of the mirror after coating. Therefore, processing mirror blanks is the most critical aspect of optical mirror formation [3,4].
The conventional aspherical mirror processing methods are material removal formation [5], compression moulding [6], and spin-casting [7]. These methods generally have high processing costs, low flexibility, and limited surface shape. Fu et al. proposed a the gas jet forming method for processing mirror blanks [8]. Under this air pressure, the pool of photosensitive resin is deformed by the impact and cured when the desired surface shape is achieved. This method allows the desired optical surface to be obtained by controlling the nozzle height and the gas flow rate.
Currently, the studies related to the gas jet forming in the field of mirror blank processing production are still in their infancy. However, the the gas jet forming process has become one of the hot topics in the field of multiphase fluids. In 1965, Banks et al. observed the liquid surface dimple phenomenon caused by cylindrical jets [9]. In 1970, Molloy et al. confirmed that the profile of liquid surface dimples is related to the jet velocity and nozzle diameter [10]. In 2004, Meidani et al. used an experimental setup of liquid metal systems to study the influence of gas flow rate and nozzle height on the depth of liquid surface dimples [11]. In 2012, Ek et al. experimented with impacting liquid steel with a gas jet and established a depth prediction model related to the gas flow rate and nozzle height [12]. In 2017, Kalifa et al. used the Reynolds stress model (RSM) to study the interaction process of a gas jet perpendicular to a liquid interface [13]. In the same year, Jurman et al. derived a nonlinear wave equation capable of quantitatively describing the surface waves caused by airflow [14]. According to the above studies, the gas jet forming process mainly consider the interaction mechanism of the gas–liquid interface, the surface wave phenomenon, and the depth of the liquid surface dimples. These studies cannot predict the diameter and principal curvature of the mirror blank. Therefore, it is necessary to establish the relationship between the gas flow rate, nozzle height, and principal curvature and surface diameter of the mirror blank for further study of the jet formation process.
According to the research completed so far, this paper investigates the change rule of the principal curvature and surface diameter of mirror blanks in the gas jet forming. Firstly, the influence of the gas jet parameters on the pressure distribution rule in the cross-section of the gas stream is analysed, and a model of the pressure distribution in the initial section of the gas stream is established. Based on this gas pressure distribution model, an inference is drawn from the relationship between the gas jet parameters and the surface parameters. A numerical simulation is carried out to understand this inference. Finally, the inference is verified by the gas jet forming experiments. The dimensionless mathematical model of the principal curvature and surface diameter of the mirror blank with respect to the jet parameters is established by analysing the causes of the calculation deviations.

2. Principles of the Gas Jet Forming and Related Inferences

2.1. Principles of the Gas Jet Forming

In the the gas jet forming process, the jet from the nozzle, due to the entrainment effect, increases the end surface of the stream. At the same time, the flow velocity of the jet also decreases, and the deformed gas jet carrying kinetic energy impacts the surface of the liquid pool. The velocity distribution of the jet in the cross-section is characterised by a maximum velocity at the centre line of the flow stream, and the further away from the centre axis in the same cross-section, the lower the gas flow velocity. In this case, the liquid pool’s impingement position cannot bear the impact pressure generated by the gas jet, and the pressure difference between the inside and the outside will finally form a stable surface. According to mechanical analysis, the surface shape formed by the gas jet profile is determined by the air pressure, hydrostatic pressure, and surface tension generated by the jet, and the equilibrium composed of the above forces is shown in Figure 1 [15], where p is the interfacial pressure difference, τ is the interfacial stress caused by the jet, and dh and dr are the ds interfacial unit components.

2.2. Inference of the Relationship between Jet Parameters and Mirror Blank Parameters

According to the equilibrium theory described in Section 2.1, the surface profile of the mirror blank is closely related to the interfacial pressure and the physical properties of the photosensitive resin. The physical properties of the photosensitive resin used in this study are stable, and by changing the velocity of the gas jet and the nozzle’s height from the liquid surface, the pressure on the surface of the resin pool can be altered to achieve effective control of the shape of the resulting surface. Therefore, it is important to analyse the gas flow field created by the gas jet to determine the pressure distribution on the surface of the liquid photosensitive resin.
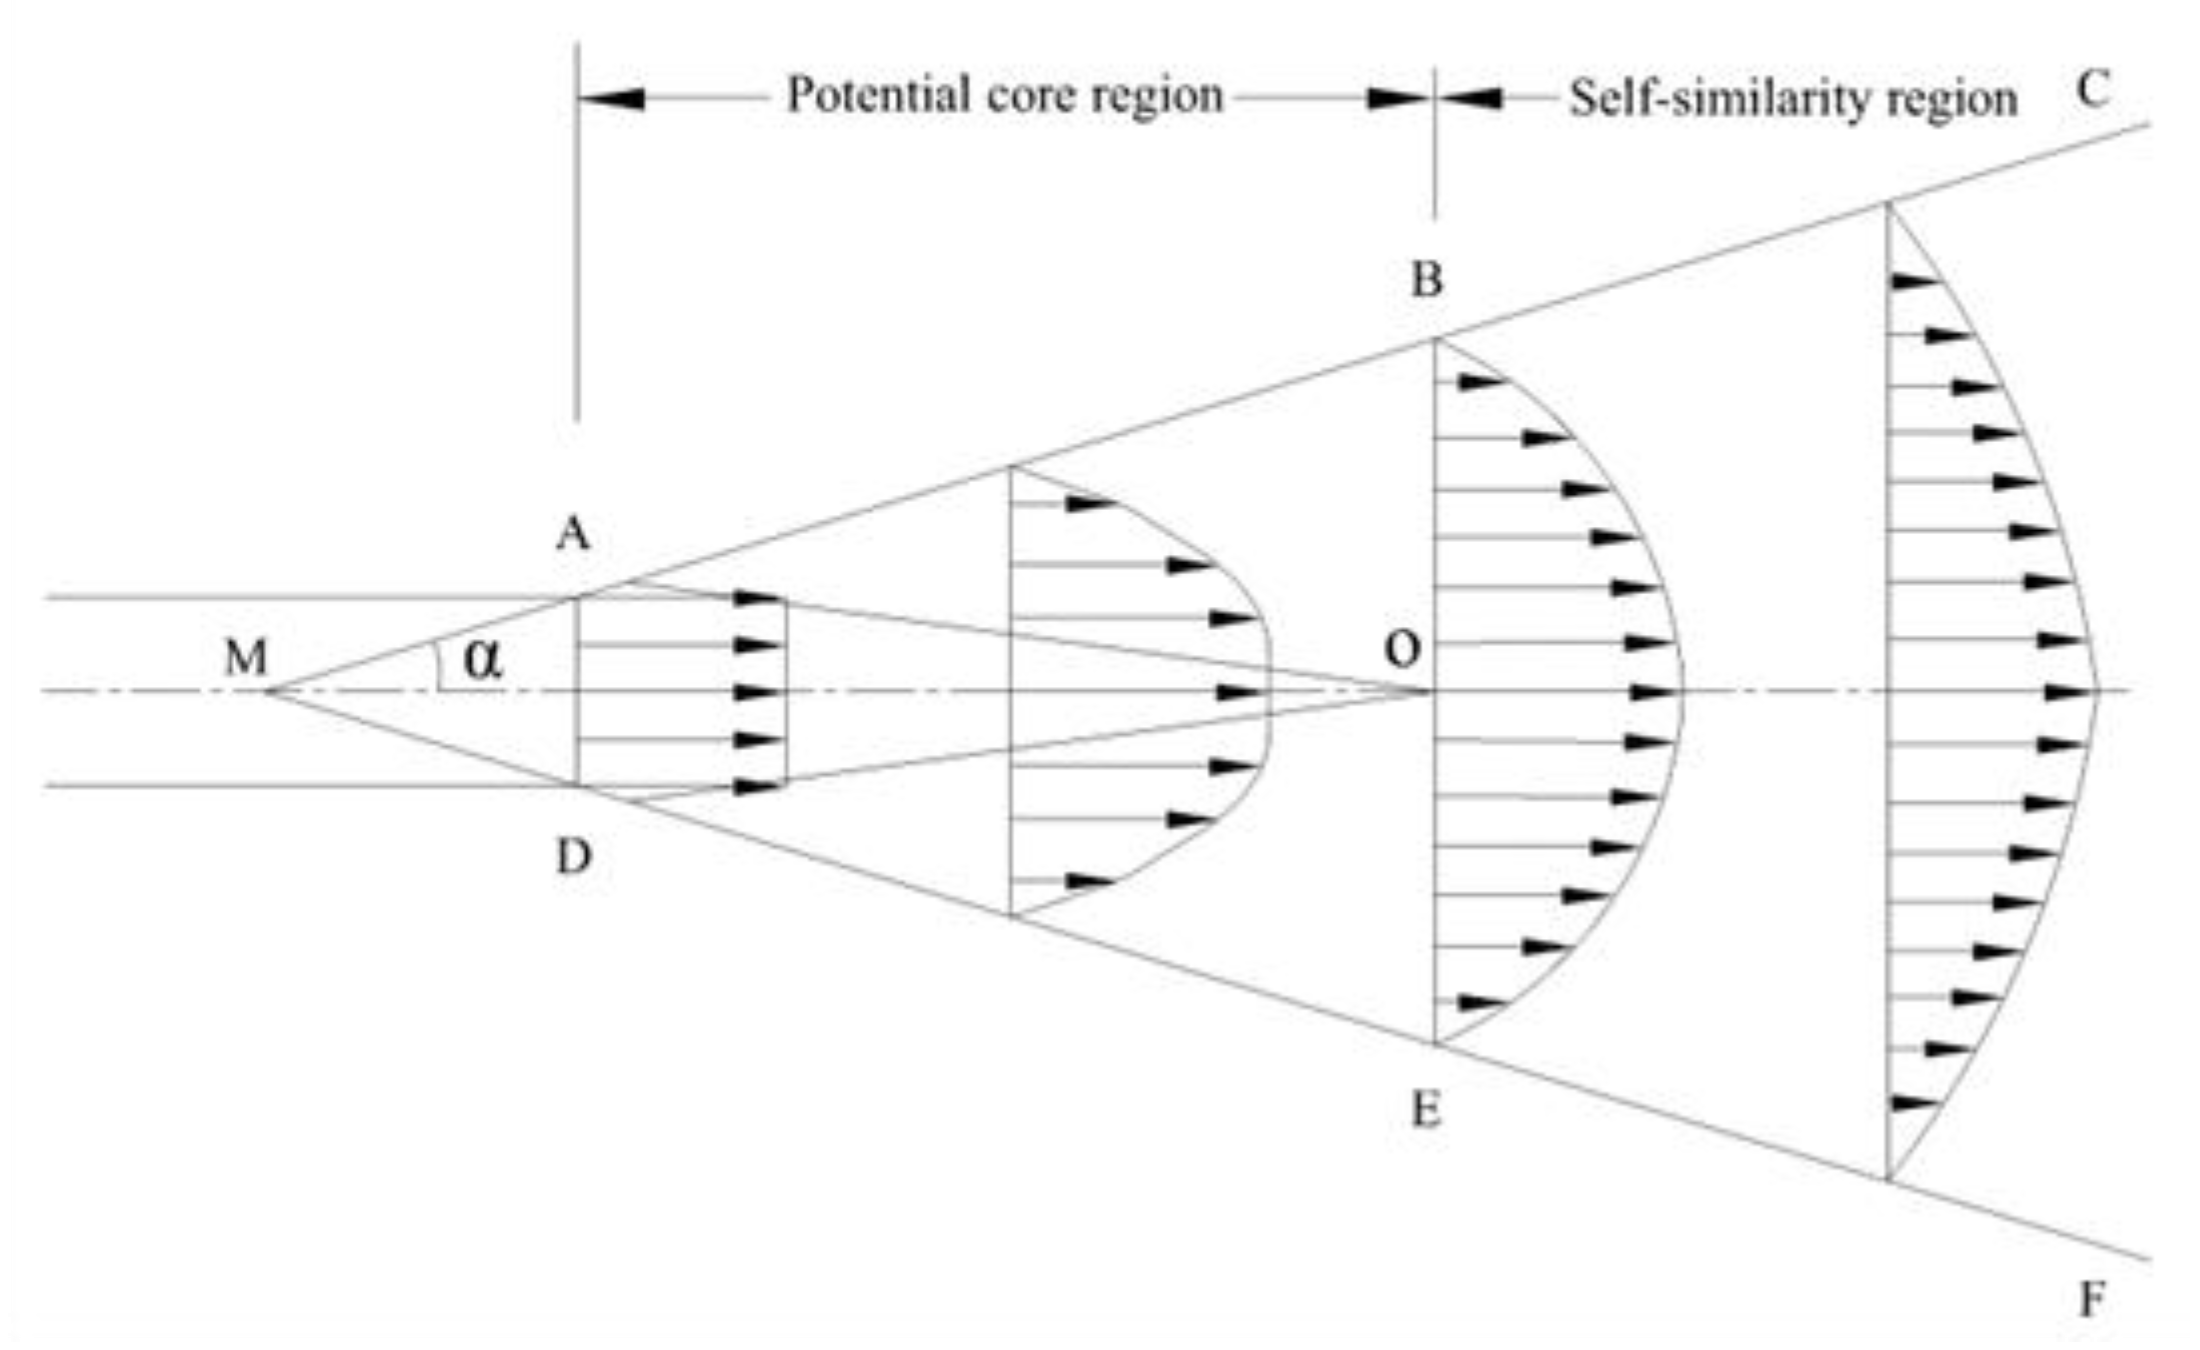
According to previous studies [16], the velocity distribution of the gas flow field on the axis of the flow stream can be divided into a potential core region and a self-similarity region, with the BOE as the transition zone, as shown in Figure 2.
The distance of the potential core region Sn is determined by Equation (1) [17].
S n = 0.671 r 0 α ,
where r0 is the radius of the nozzle and α is the diffusion angle; in this paper, α is 0.08.
As this paper is concerned with the effects of the jet velocity and the nozzle height from the liquid surface on the mirror profile, the nozzle diameter was taken as a fixed quantity. In this paper, the nozzle diameter chosen was 10 mm, and the above parameters were substituted into Equation (1) to obtain the following calculation result:
S n = 0.671 r 0 α = 0.671 × 0.005 0.08 = 41.93   mm ,
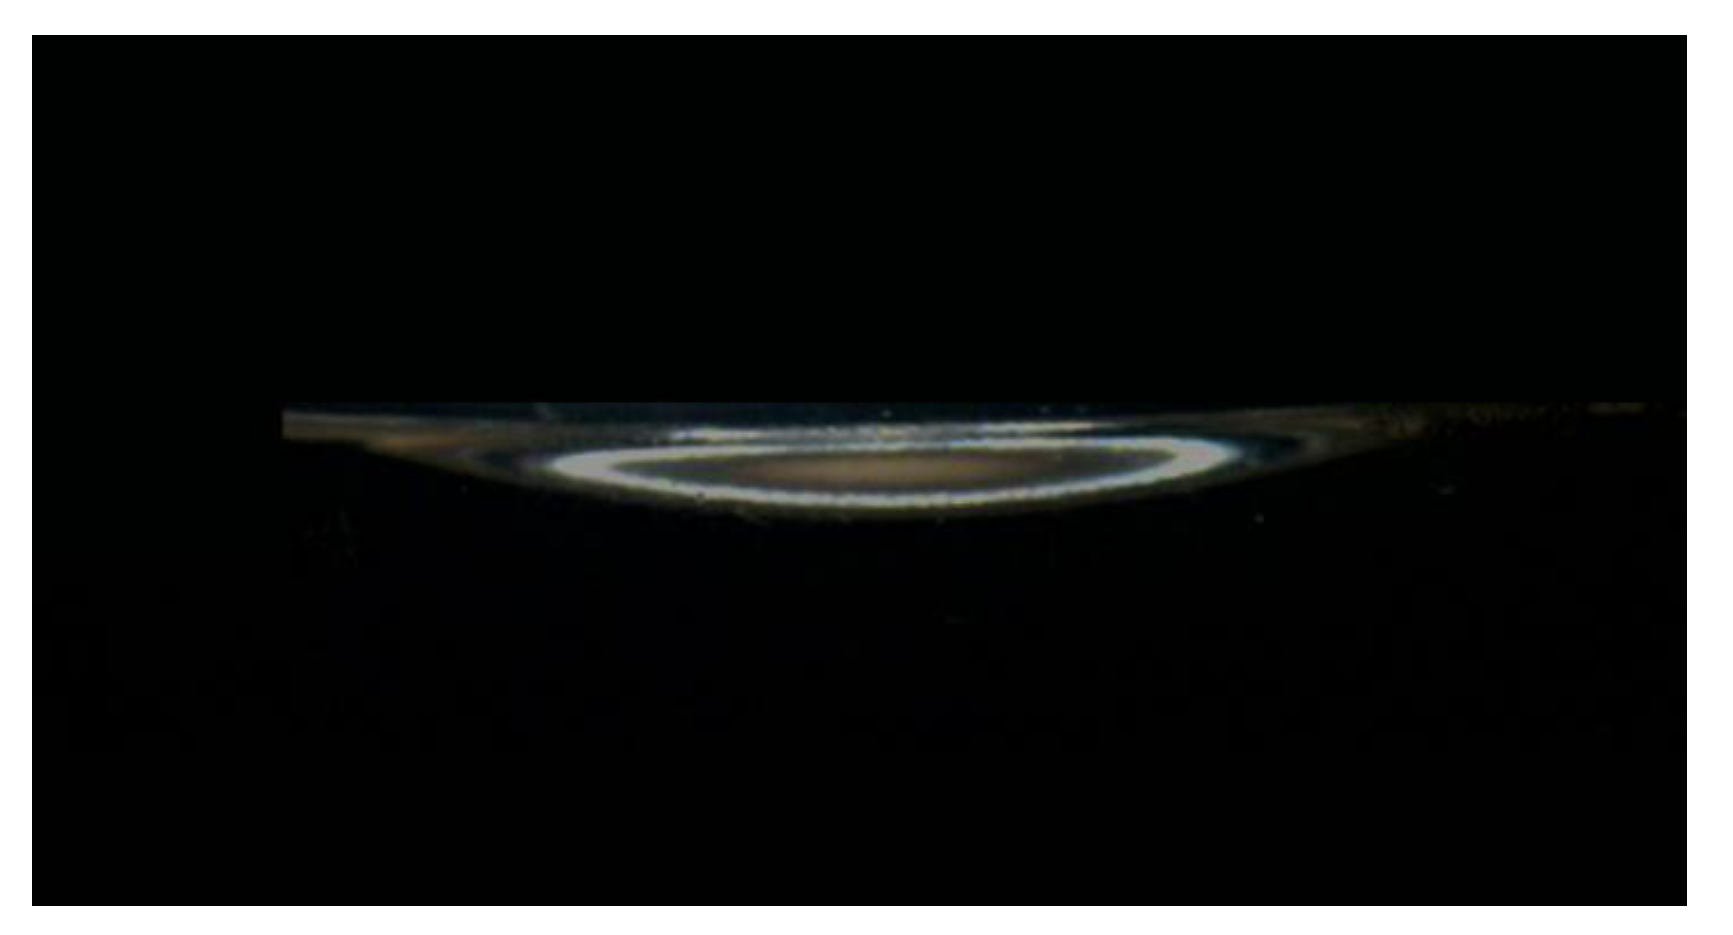
According to the analysis results shown in Figure 2, the gas flow field is divided by the BOE turning surface, and there is a variation trend between the potential core region and the self-similarity region. According to the calculation results obtained from Equation (2), when the self-similarity region is selected for the gas jet forming, the nozzle’s height from the liquid surface is greater than 41.93 mm. At this point, it can be found through the experiment (as shown in Figure 3) that the surface formed is very shallow, and it is not easy to observe the influence of the changes in the gas jet parameters on the surface shape of the mirror blank.
Therefore, the potential core region was chosen as the formation flow field in this study. According to Figure 2, the velocity of the flow field of the potential core region in the cross-section is the same after the gas is ejected from the nozzle, and the diameter of the core region’s cross-section gradually decreases with the movement of the gas stream. In 1962, Banks et al. described the main section of the jet flow field with the following equation [18]:
P = 1 2 ρ G V 0 2 ( d h ) · e c ( r h ) 2 ,
where P is the pressure generated by the gas flow, ρG is the gas density, V0 is the gas flow rate, d is the nozzle diameter, h is the nozzle height, and c is a constant.
However, the above equation can only describe the flow field distribution in the self-similarity region, but not the gas flow field in the potential core region. Comparing the self-similarity region with the flow field distribution law of the potential core region, we can see that there is a jet-preserving core region in the starting section, and there is a difference in the number of times describing the normal distribution e. Therefore, it is important to develop a mechanistic model suitable for describing the flow field distribution in the potential core region and analysing the flow field pressure variations. In this study, a mechanistic model describing the flow field in the potential core region was established and modelled as follows:
{ P = 1 2 ρ G V 0 2 r < r c o r ( a ) P = 1 2 ρ G V 0 2 ( d h ) · e c ( r h σ ) 2 r > r c o r ( b )
where r c o r is the core zone radius, r c o r ( 1 / h ) , and σ is a constant (mm2). Equation (4) (a) describes the pressure distribution within the core zone, while Equation (4) (b) describes the pressure distribution outside the core zone to the boundary layer.
According to Section 2.1 of this paper, the surface shape of the mirror blank is formed by the combined action of air pressure, surface tension, and the hydrostatic pressure of the liquid. Of these, the air pressure has a positive effect on the expansion of the surface. In contrast, the surface tension and static pressure have a negative effect by inhibiting the expansion of the surface. During the the gas jet forming process, the air pressure is stronger than the combined inhibitory effect of the surface tension and static pressure, causing a tendency for the surface profile to expand outwards until the three forms of action reach equilibrium. For this reason, Equation (4) can be modified to obtain Equation (5).
P = ρ V 0 2 d 2 h e c ( r h σ ) 2 ,
According to Equation (5), the magnitude of the pressure acting on the surface of the liquid cell is related to the initial jet velocity V0. The greater the V0, the greater the resulting pressure P, resulting in a larger diameter of the surface formed by the gas jet. It can be inferred that the diameter formed by the gas jet increases as the initial gas flow rate V0 increases. In addition to velocity, the pressure is also related to the nozzle’s height from the liquid surface. Although the cross-sectional diameter of the flow stream increases as the nozzle’s height from the liquid surface increases, the greater the nozzle height, the lower the pressure within the radial cross-section, resulting in a smaller diameter formed by the gas jet.
The principal curvature is one of the key parameters describing the profile of an optical mirror, and it is not correlated with the diameter. Therefore, it is also necessary to analyse the law of change in the principal curvature of the surfaces formed in the gas jet forming. Due to the volume reduction in the potential core region and the effect of the hydrostatic pressure of the liquid, the principal curvature is determined by both the pressure in the potential core region and the pressure distribution generated by the flow streams in the vicinity of the core.
By taking the derivative of P with respect to r in Equation (4) (b):
d P d r = c r σ 2 ρ G h d V 0 2 · e c ( r h σ ) 2 ,
The second derivative of the above equation:
d 2 P d r 2 = c σ 2 ρ G V 0 2 d h · e c ( r h σ ) 2 ( 2 c h 2 σ 2 r 1 ) ,
According to the mathematical equation, the curvature K at each point of the airflow can be obtained from Equation (8).
K = | d 2 P d r 2 | [ 1 + ( d P d r ) 2 ] 3 2 ,
Substituting Equations (6) and (7) into Equation (8) yields the curvature equation describing the pressure distribution of the gas jet acting on the fluid surface.
K = | c σ 2 ρ G V 0 2 d h · e c ( r h σ ) 2 ( 2 c h 2 σ 2 r 1 ) | [ 1 + ( c r σ 2 ρ G h d V 0 2 · e c ( r h σ ) 2 ) 2 ] 3 2 ,
The focus of this paper is on the preserving core region and the pressure distribution near the preserving core region ( r 0 ). At this point, the principal curvature equation of the airflow stream is shown in Equation (10).
K = lim r 0 K = | c σ 2 ρ G V 0 2 d h · e c ( r h σ ) 2 ( 2 c h 2 σ 2 r 1 ) | [ 1 + ( c r σ 2 ρ G h d V 0 2 · e c ( r h σ ) 2 ) 2 ] 3 2 = c σ 2 ρ G V 0 2 d h ,
Analysis of Equation (10) can lead to the following inference: when the nozzle diameter is determined, the principal curvature and the initial velocity of the gas stream change with the nozzle’s height from the liquid surface. In contrast, the principal curvature of the mirror blank can be inferred from the increasing initial velocity of the jet to increase with the increasing height of the nozzle from the liquid surface.

3. Numerical Simulation

Although the relationship between the jet parameters and the mirror blank parameters is inferred above, it is only mechanistic. In order to verify the above inference, the relationship between the gas jet parameters and the surface shape parameters of the formed surface was analysed using fluent software to investigate the variation of the diameter and the principal curvature of the formed surface due to the variation of the gas flow and nozzle height.

3.1. Establishment of the Model

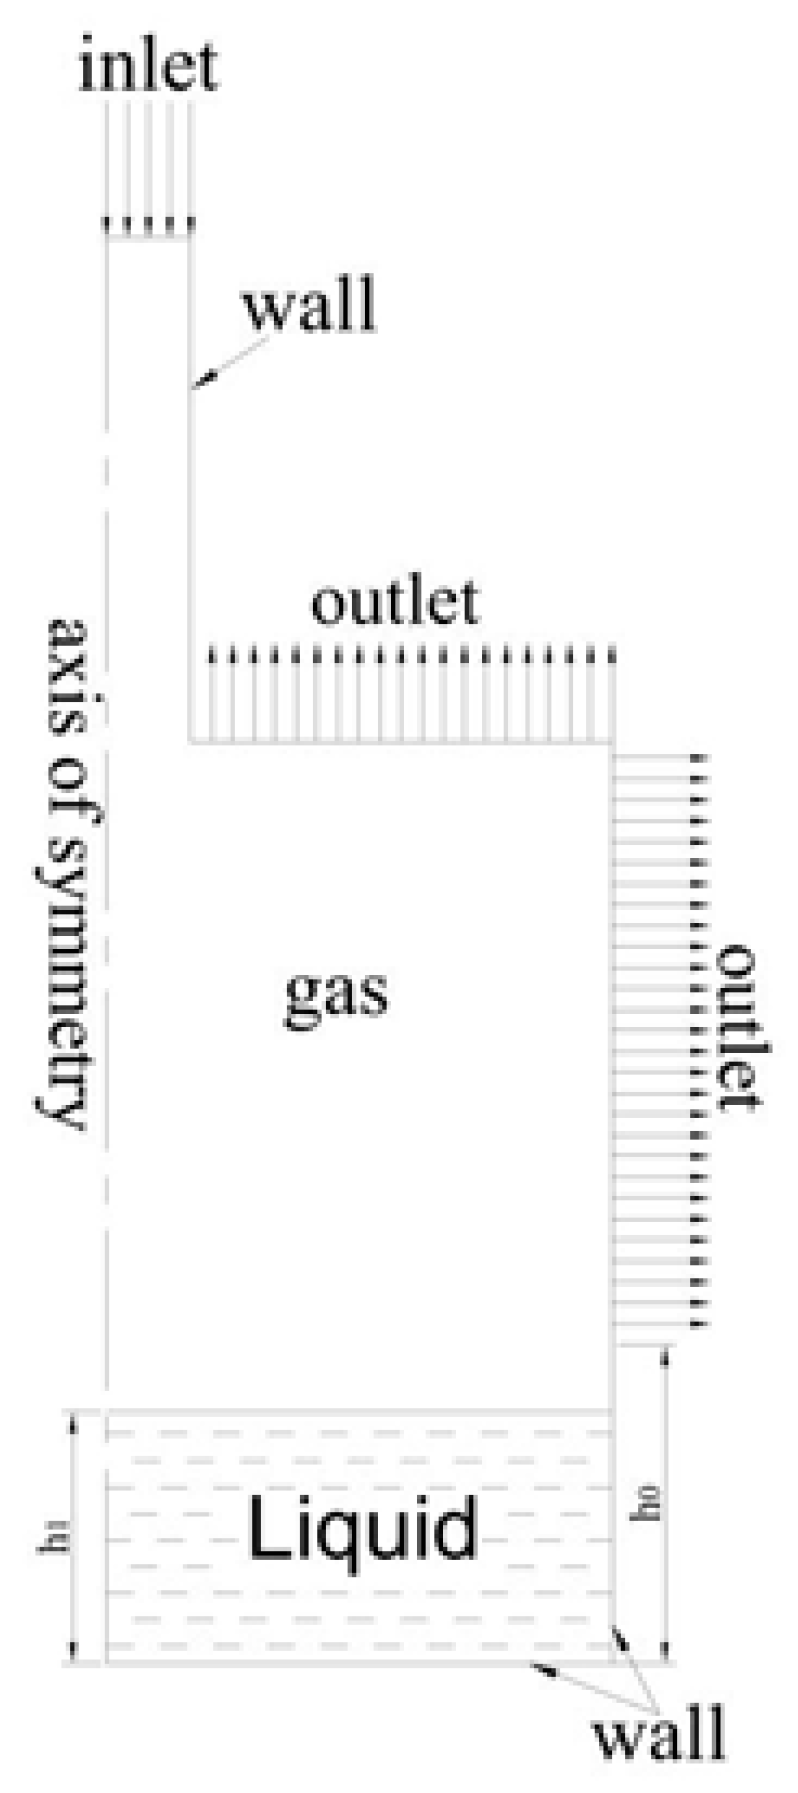
The simulation model of the gas injection moulding process is shown in Figure 4, where “inlet” is the gas inlet and “wall” is the wall of the nozzle and the wall of the mould. h0 is the height of the glass dish wall, and h1 is the liquid phase’s liquid level. The simulation was calculated using a two-dimensional axisymmetric computational domain with the axis of symmetry shown in the figure.

3.2. Control Equations and Discrete Methods

The VOF interface tracking model in the Reynolds-averaged Navier–Stokes framework was used in the simulation to predict the the gas jet forming process. Nichols and Hirt first proposed the VOF method in 1975 to capture free surface calculations through a computational grid [19]. The fluid model was refined by these two researchers in 1981 and is still in use today [20].
The numerical simulation of the the gas jet forming method is a multinomial fluid model. During the solution process, the gas and liquid phases fill the calculation domain, and in this model both the gas and liquid phases are continuous, satisfying the Navier–Stokes equations. Due to the low influence of temperature on the experiment, the energy conservation factor is ignored in the calculations. The mass equation is shown in Equation (11), and the momentum equation is shown in Equation (12) [21].
ρ t + · ( ρ U ) = 0 ,
ρ U t + · ( ρ U U ) · τ = p + ρ g + F ,
where t is the time, U is the gas flow rate, p is the pressure, g is the gravity vector, μ is the viscosity, ρ is the density, and F is the source term, which is provided in the experiments of the jet spray moulding method, including surface tension.
According to Section 2.1 above, surface tension is an important influencing factor for the prediction of the mirror blank’s surface shape. The surface tension model in this paper is the continuous surface force model proposed by Brackbill. As shown in Equation (13), in this model, the surface tension is added to the source term of the momentum equation [22].
F C S S = · T ,
Expressing the stress surface tensor T [22]:
T = σ ( | α | I α α | α | ) ,
where I is the stress tensor, α is the volume fraction, σ is the surface tension coefficient, is the tensor product of the two vectors, and n is the volume fraction gradient.
Within the grid of the VOF method, the two phases share a common set of momentum equations. Therefore, the rate properties and the material properties within the grid are jointly determined by the physical properties of the two phases, along with the volume fraction [23].
The formula for the mixing density ρ m is as follows [23]:
ρ m = α c ρ c + α d ρ d ,
where α c is the volume fraction of the gas phase, ρ c is the physical density of the gas phase, α d is the volume fraction of the liquid phase, and ρ d is the physical density of the liquid phase.
The formula for the mixing viscosity μ m is as follows [23]:
μ m = α c μ c + α d μ d ,
where μ c is the physical viscosity of the gas phase, μ d is the physical viscosity of the liquid phase. The grid rate U m property has the following formula [23]:
U m = α c ρ c U c + α d ρ d U d ρ m ,
where U C is the gas phase rate property at the last time step of the grid, while U d is the liquid phase rate property at the last time step of the grid.
In order to ensure the better stability of the VOF, an explicit algorithm is used in the time domain, the transient solution is used for the numerical simulation process, and the PISO algorithm is applied to solve the pressure-rate field. The first-order upwind algorithm is used to discretise the momentum equation, the PRESTO algorithm is used to discretise the pressure space, and the least squares cell-based algorithm is used to discretise the gradient space.

3.3. Grid Independence Test

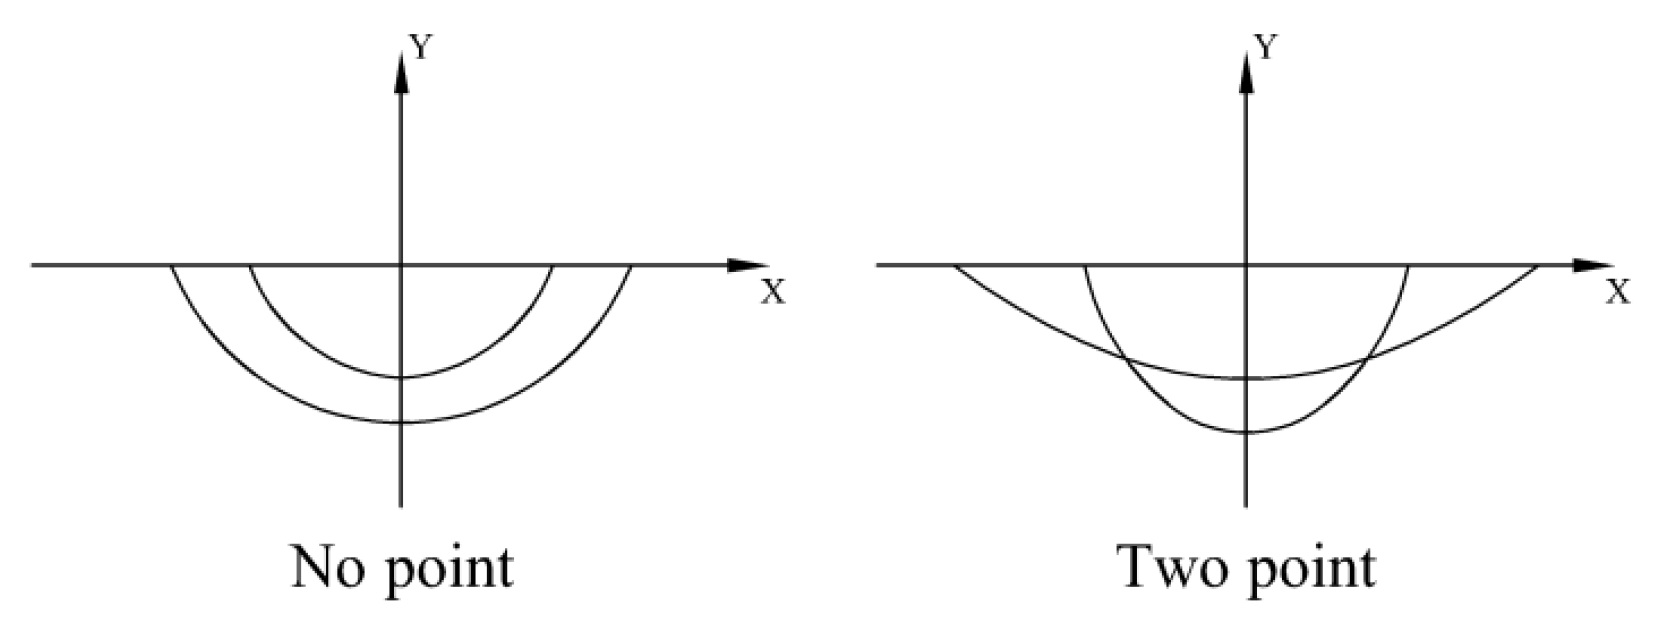
The simulation’s mesh quality directly determines the numerical simulation’s prediction accuracy. Therefore, a grid independence test is required before calculation. This paper uses a rectangular orthogonal grid to partition the model. In the the gas jet forming process, two cases of surface profiles are calculated at different grid densities, namely, no-point and two-point, as shown in Figure 5.
There are many methods for grid independence tests, such as Harsdorf’s method [24], Freshet’s method [25], and LCSS [26]. However, these methods are only suitable for judging straight-line trajectories and cannot achieve the expected results in the case of judging similar curves. For this reason, this paper proposes a new method for determining the similarity of specular contours for the surface profile characteristics formed by the gas jet forming. Its similarity formula is as follows:
δ = C A + B C ,
where A is the area of intersection of curve 1 with the X axis, B is the area of intersection of curve 2 with the X-axis, and C is the common area of A and B.
The grid size was set to 0.7 mm, 0.6 mm, 0.5 mm, 0.4 mm, 0.3 mm, 0.2 mm, 0.1 mm, and 0.09 mm to mesh the model. The number of meshes corresponding to the above mesh sizes was 3565, 4850, 6917, 10,911, 19,110, 42,596, 169,091, and 209,038, respectively. A curve similarity equation (Equation (18)) was applied to calculate the similarity of two adjacent curves, and the point line diagram was drawn based on the calculation results, as shown in Figure 6.
According to the results of the calculations, the similarity values fluctuate considerably when the grid (or grids) size is between 0.7 mm and 0.3 mm. Between 0.3 mm and 0.09 mm, the fluctuations in the curve similarity values became smooth and reached over 95%. The similarity value did not reach 100%, due to a slight error caused by the time step adjustment. Based on the grid independence experiments, 0.3 mm was chosen as the grid size for the numerical simulations.

3.4. The Setting of the Numerical Simulation Parameters and Analysis of the Results

According to Section 2.2, it can be seen that when the nozzle is too high from the liquid surface, it will make the formation difficult to observe macroscopically. In contrast, a low nozzle distance from the liquid surface will cause waves at the gas–liquid interface. Therefore, the nozzle height was set between 20 mm and 40 mm, and the gas jet velocity was between 9.5 m/s and 11 m/s. The jet parameters for the numerical simulation and the subsequent experiments were used in 4 × 5 orthogonal experiments, and the gas jet parameters were set as shown in Table 1.
The material used to form the mirror blanks was photosensitive resin, and the gas emitted from the nozzle was air. The relevant properties of the photosensitive resin were tested using a DA-130N densitometer, a VT-06 viscometer, and a SITA surface tension meter, and the results are shown in Table 2.
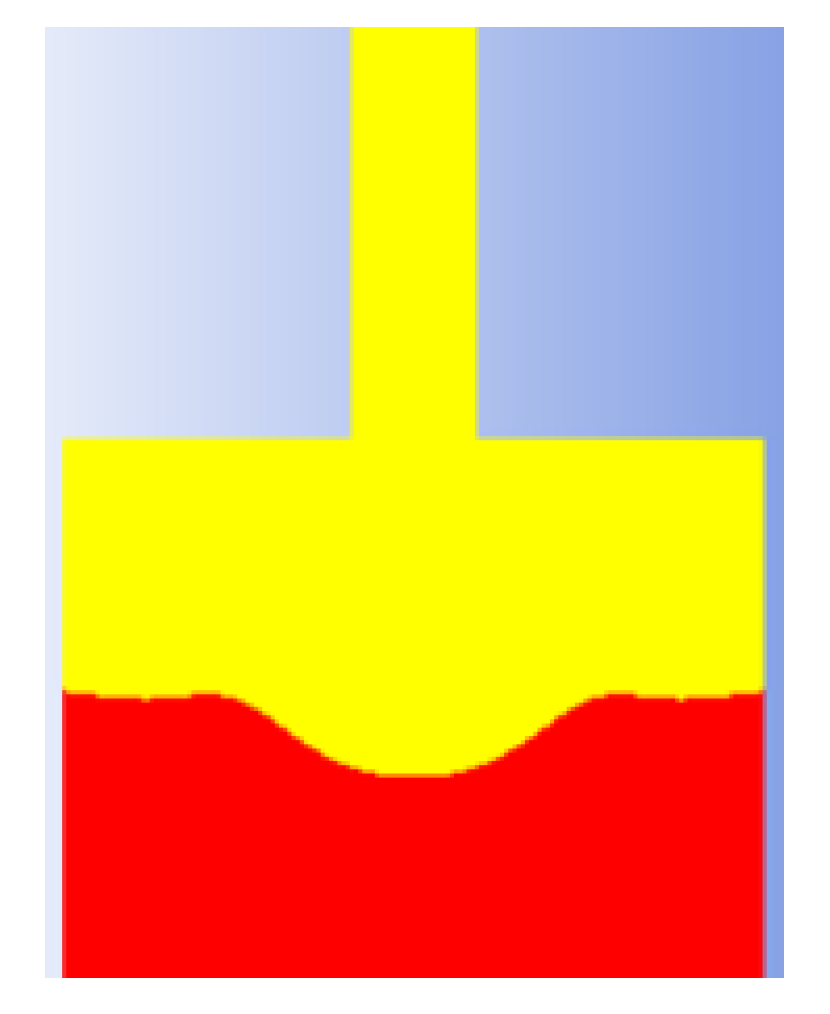
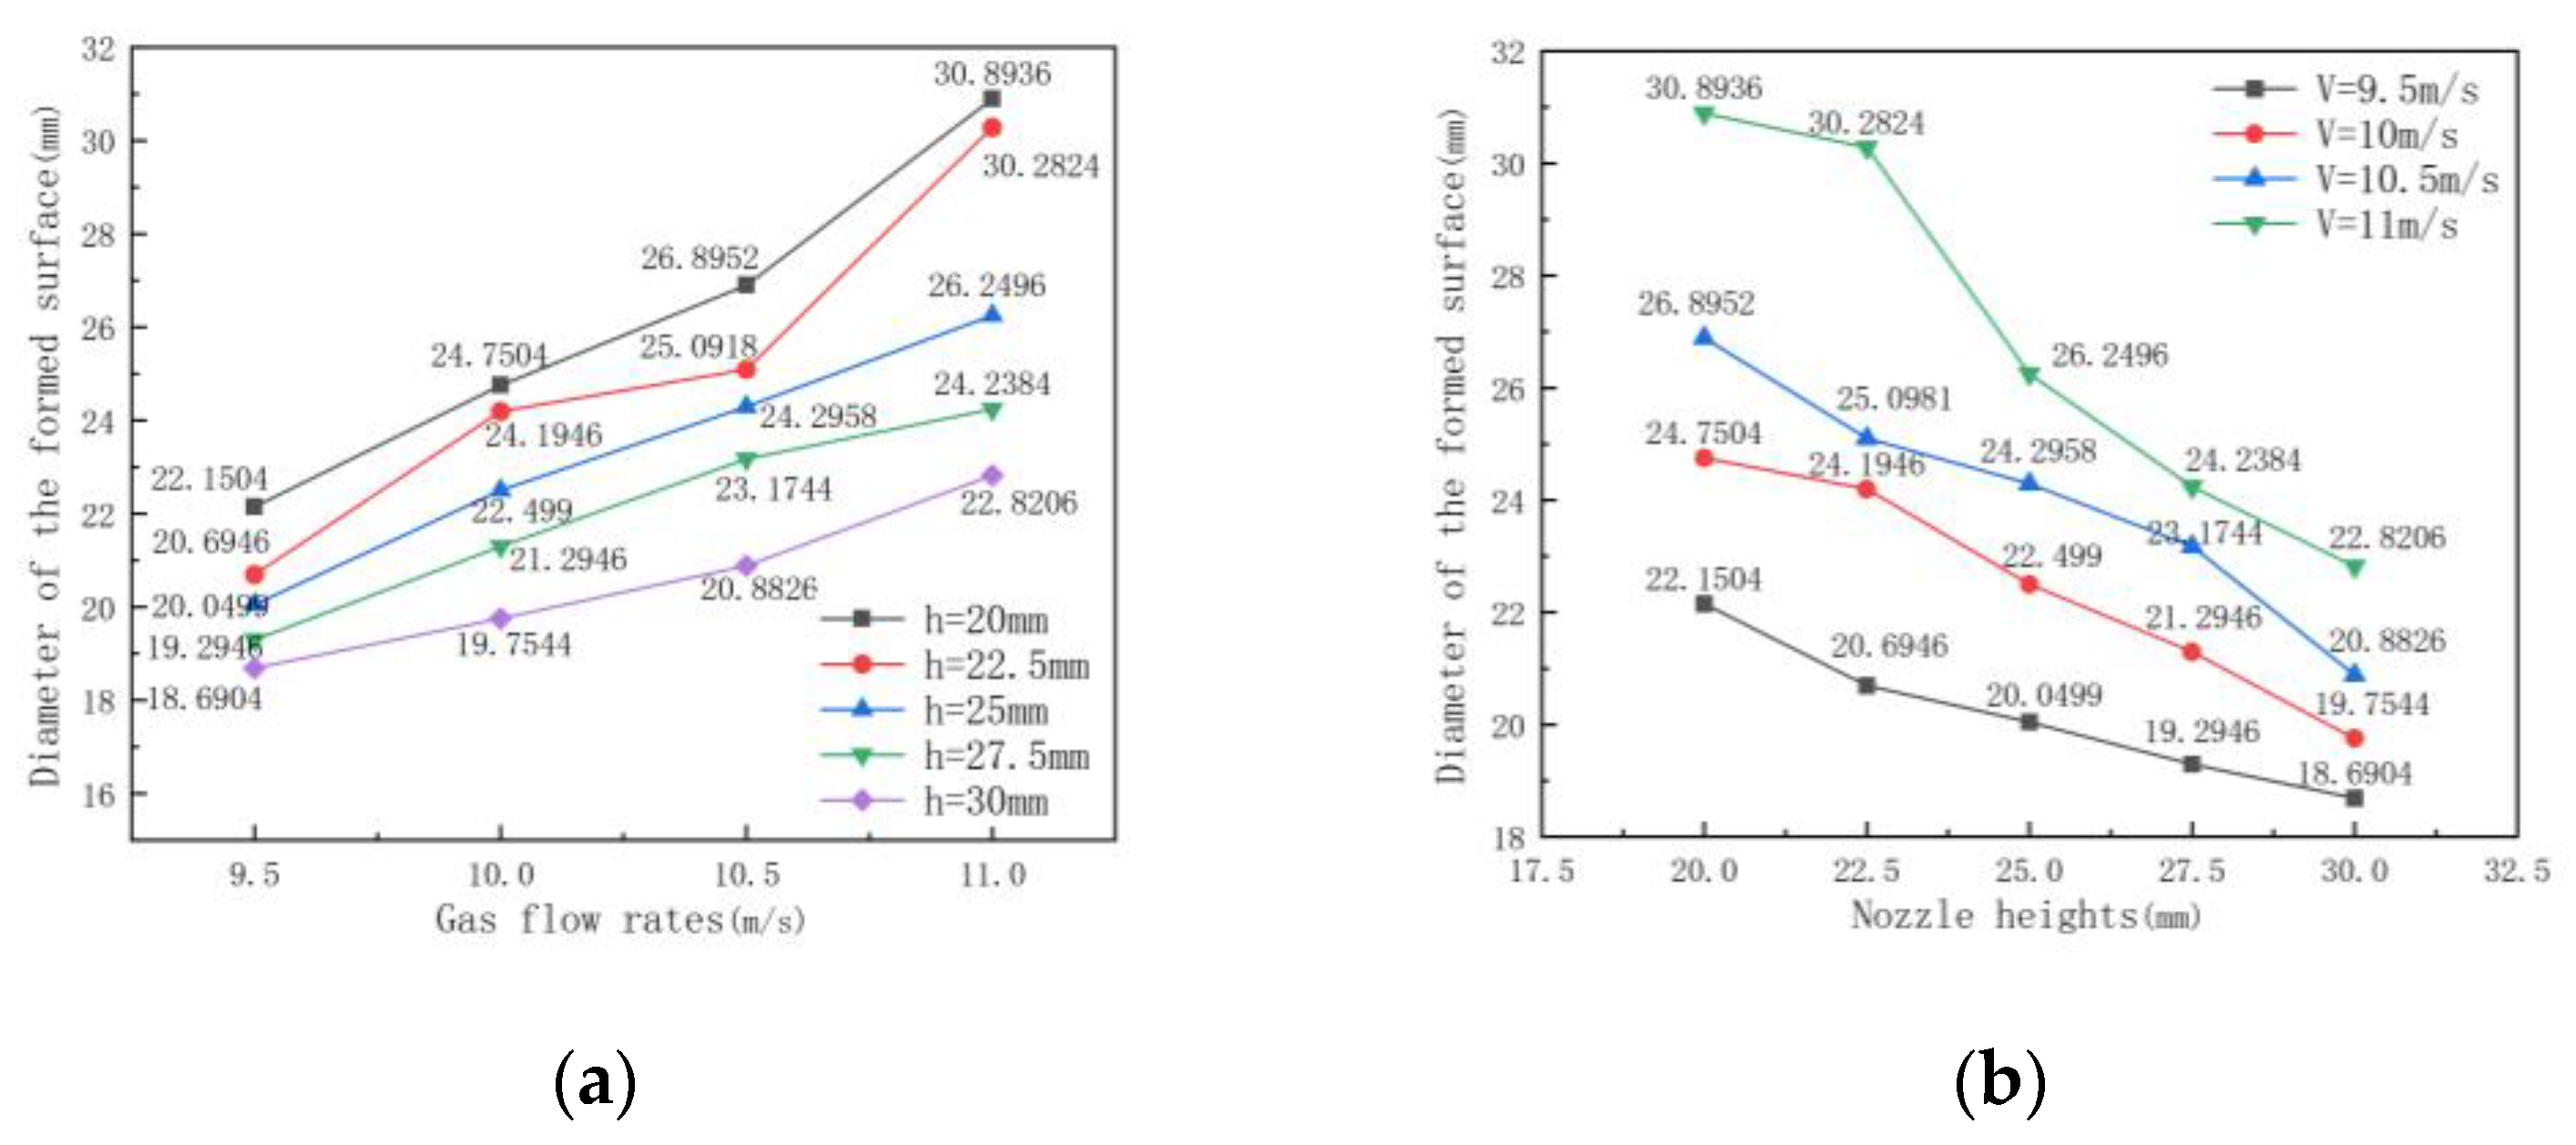
The final mirror blank profile curves for the different gas jet parameters were obtained by numerical simulation, as shown in Figure 7, where the yellow part is the air and the red part is the photosensitive resin liquid pool. By collecting the calculated data from the numerical simulation, the relationship between the gas flow rate and the diameter of the forming surface was determined, as shown in Figure 8a, and the relationship between the distance from the nozzle to the liquid surface and the diameter of the formed surface is shown in Figure 8b.
As shown in Figure 8, the diameter of the surface formed by the gas jet increased as the gas flow rate increased when the nozzle’s height from the liquid surface was fixed. When the gas flow rate was fixed, the diameter of the surface formed by the gas flow rate decreased as the nozzle height increased. When the gas flow rate was between 9.5 m/s and 11 m/s and the nozzle’s height from the liquid surface was between 20 mm and 30 mm, the minimum diameter of the formed surface was 18.6904 mm and the maximum was 30.8936 mm in the simulations.
The principal curvature of the mirror blank is challenging to determine directly from the profile information obtained from the numerical simulation, unlike the diameter of the surface formed by the gas jet. Therefore, using the surface profile data calculated from the simulation, the principal curvature was calculated using a data-fitting method. The shape equation for fitting the data is given in Equation (19) [27].
z = C r 2 1 + 1 ( K + 1 ) C 2 r 2 + a r 4 + b r 6 + h m ,
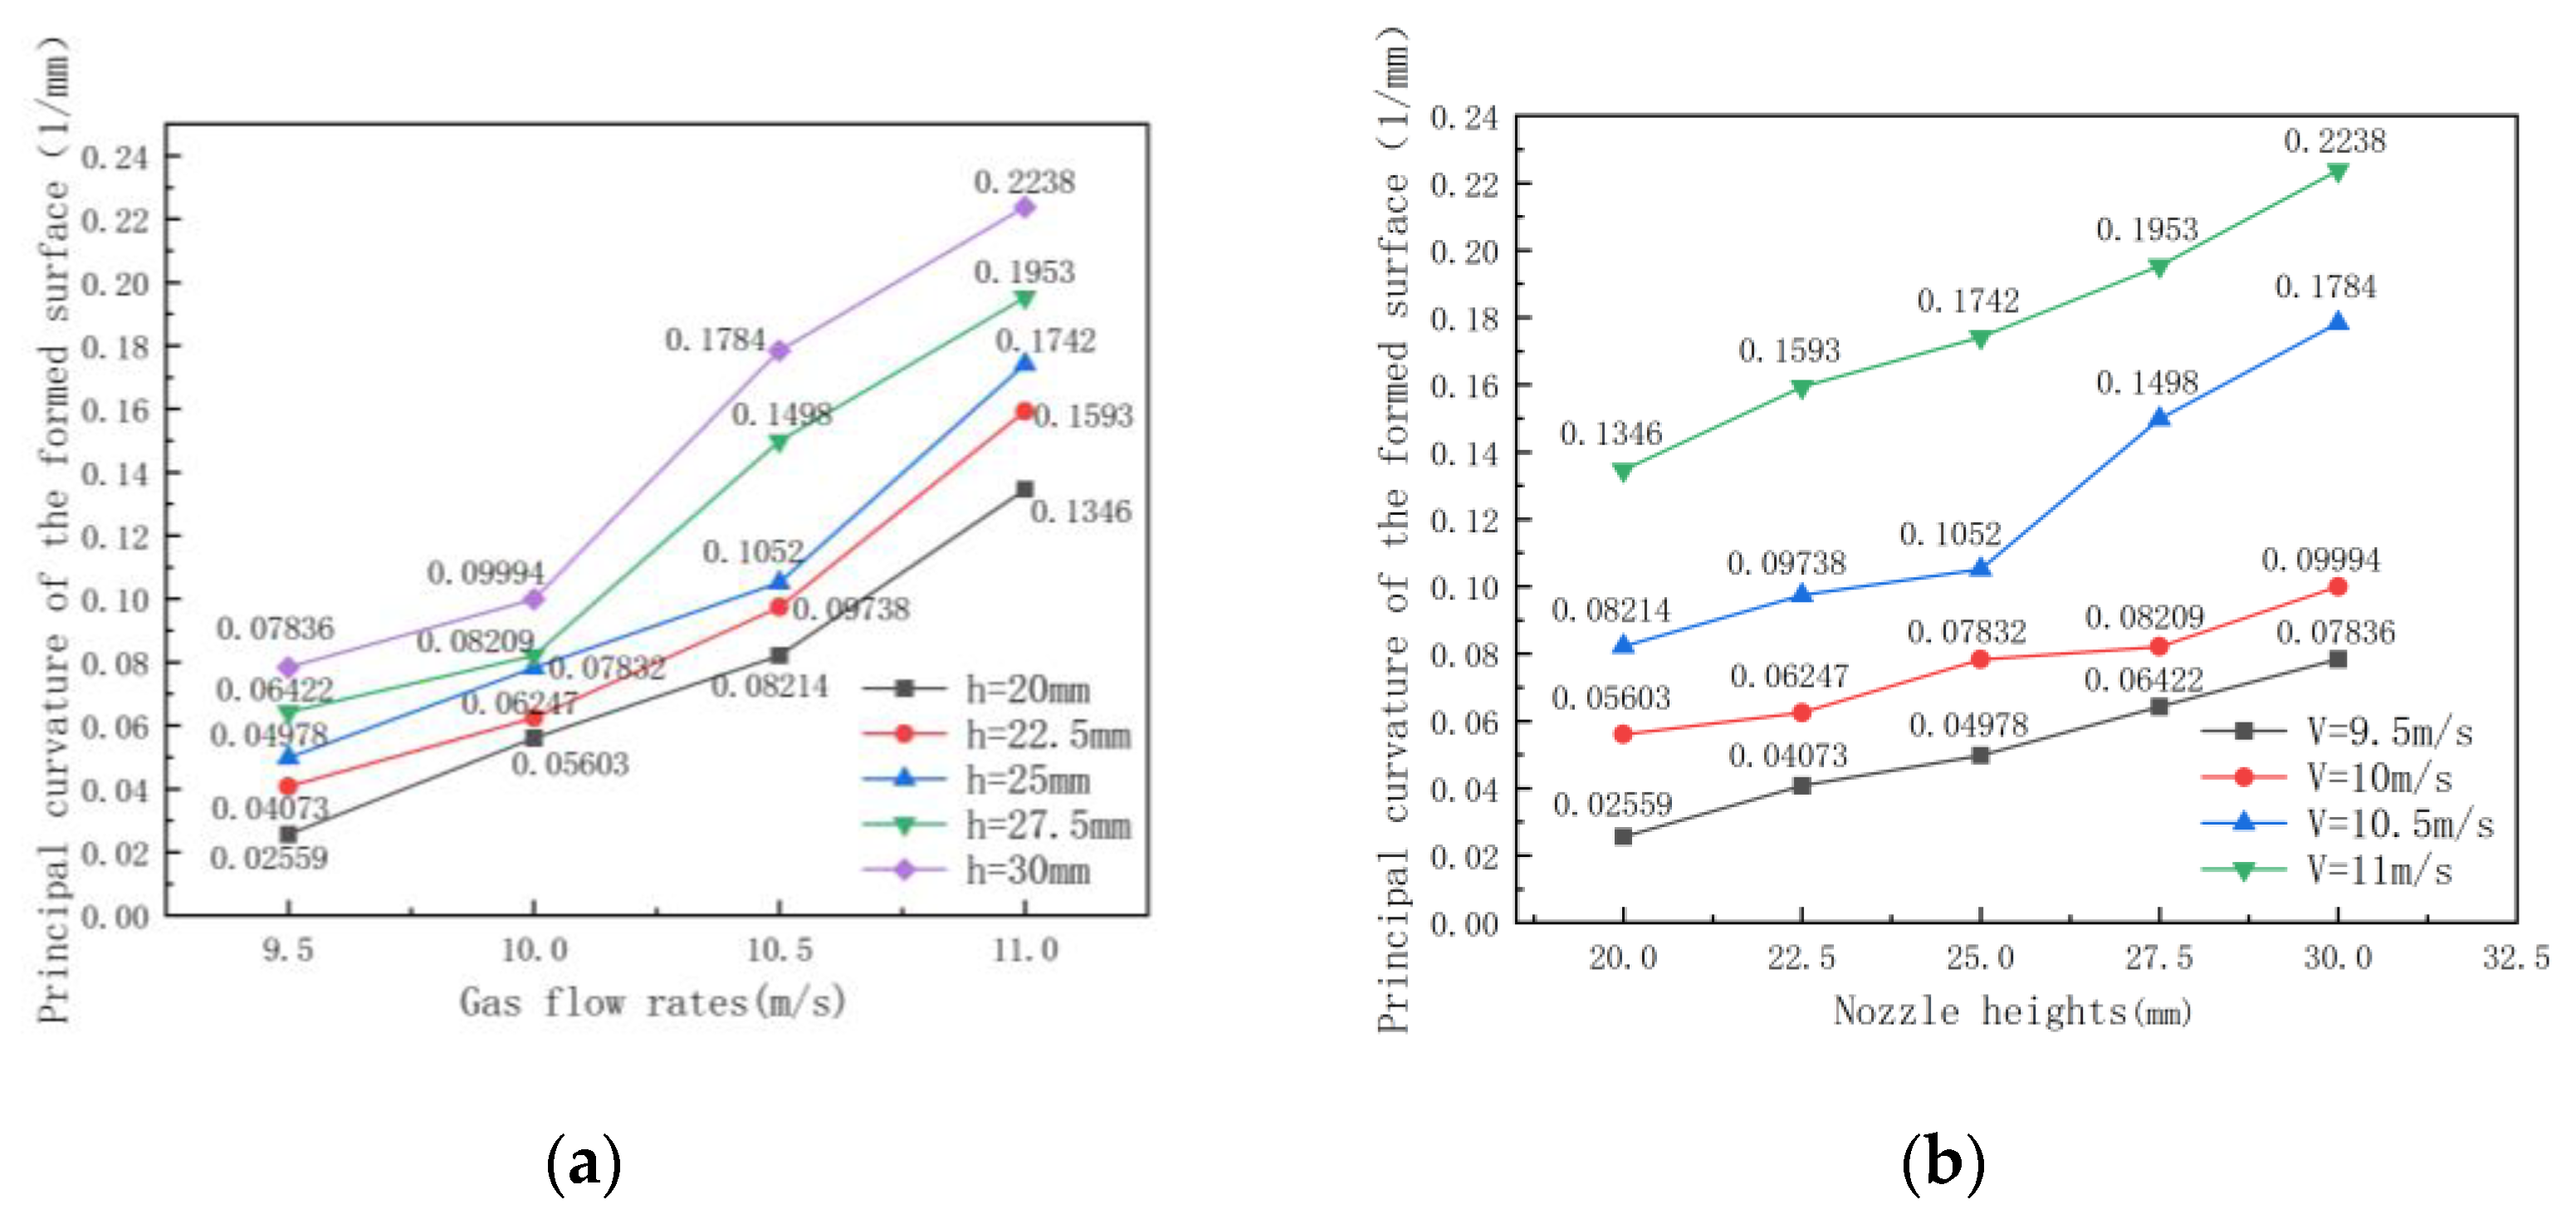
where C is the principal curvature of the mirror blanks, K is the cone coefficient, a, b… is a multinomial coefficient, and hm is the lowest point of the mirror blank. The principal curvature of the formed surface, simulated for different gas flow rates and nozzle heights from the liquid surface, is shown in Figure 9.
As shown in Figure 9, both the gas flow rate and the nozzle height from the liquid surface play a significant role in the changes in the principal curvature of the mirror blank. As the nozzle height increases, the principal curvature increases. As the gas flow rate increases, the principal curvature increases. Within the range of jet parameters set in this paper, when the jet velocity was 11 m/s and the nozzle’s height from the liquid surface was 30 mm, the principal curvature of the formed surface reached its maximum, at 0.1159 mm−1. When the gas flow rate was 9 m/s and the distance of the nozzle from the liquid surface was 20 mm, the principal curvature of the formed surface was minimal, at 0.03723 mm−1.

4. Experiments

The relevant experiments were carried out by building a the gas jet forming testing platform to verify the effectiveness of the above inferences and simulation results. The details are as follows:

The Gas Jet Forming Method

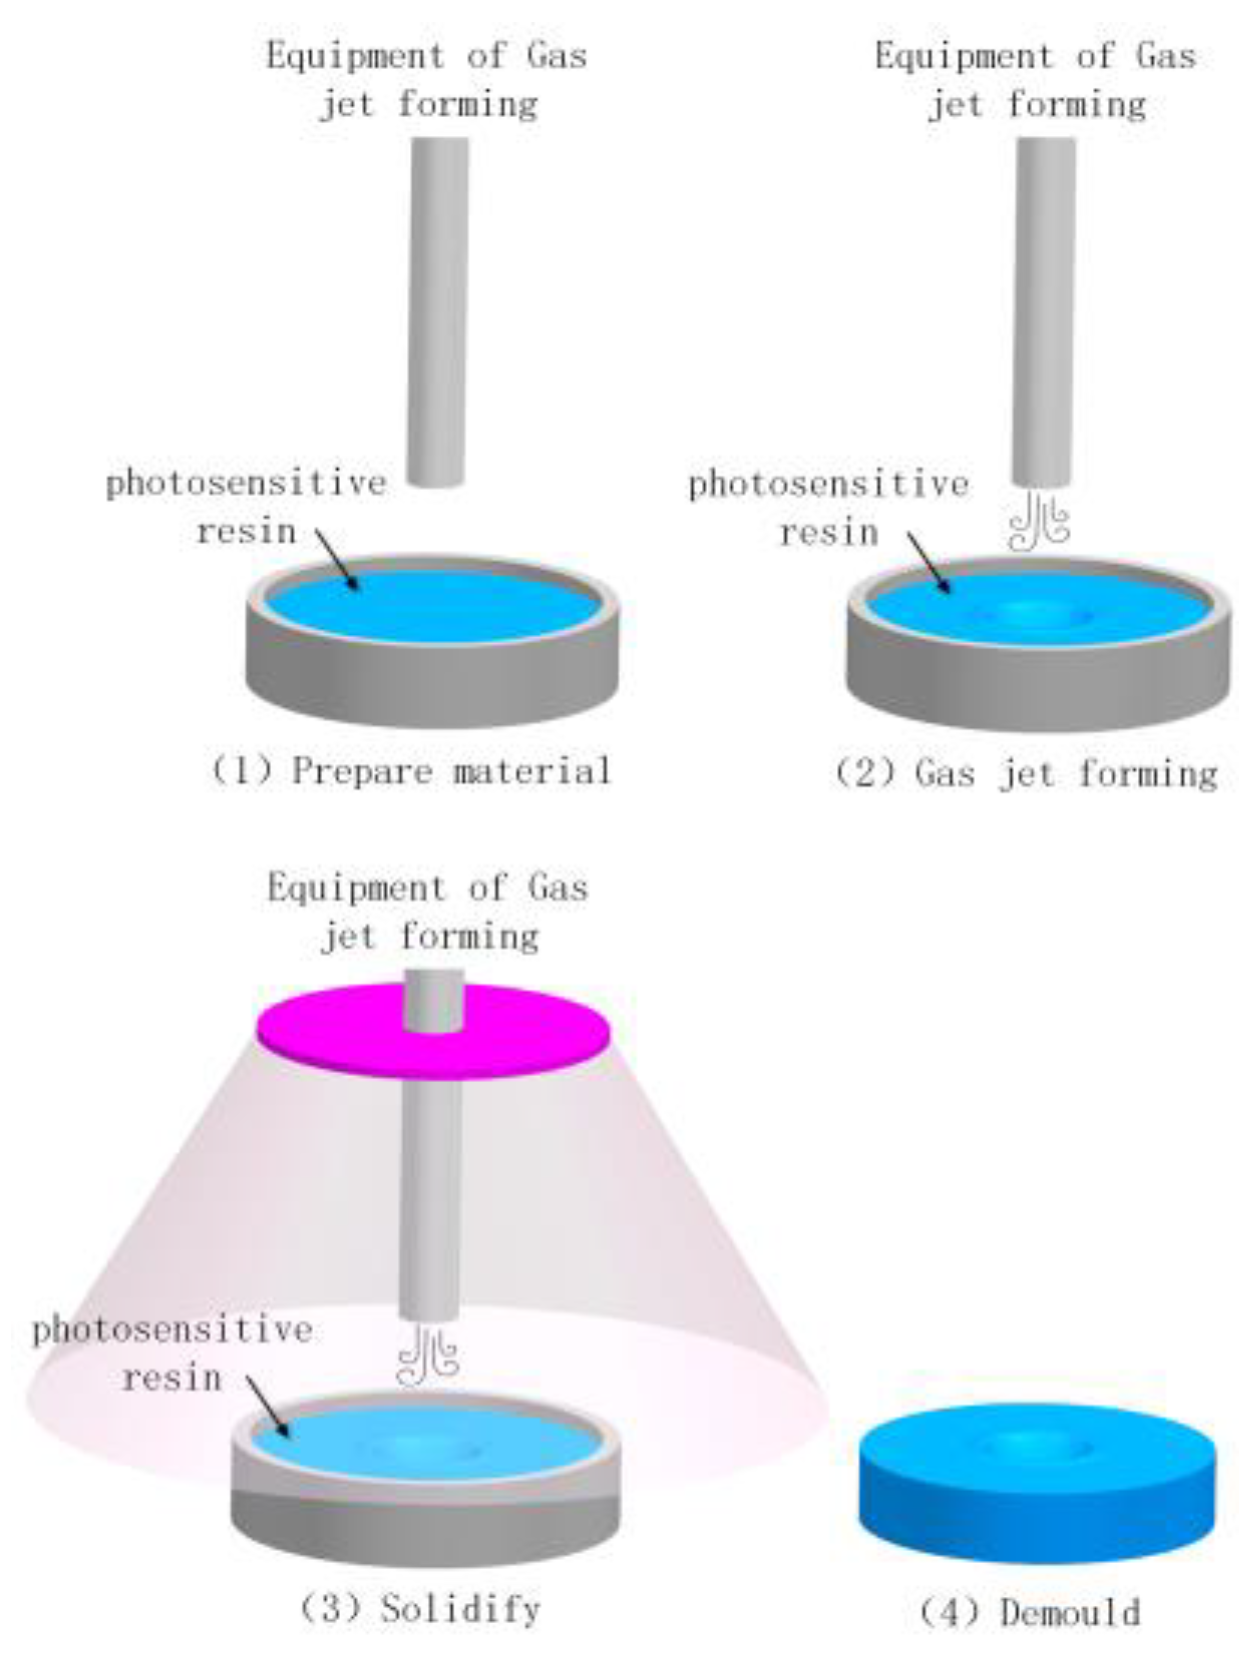
The gas jet forming of the mirror blanks was accomplished by combining the formation of the desired surface shape by the gas jet and the UV-catalysed curing of the photosensitive resin. The forming process was divided into four stages, as shown in Figure 10.
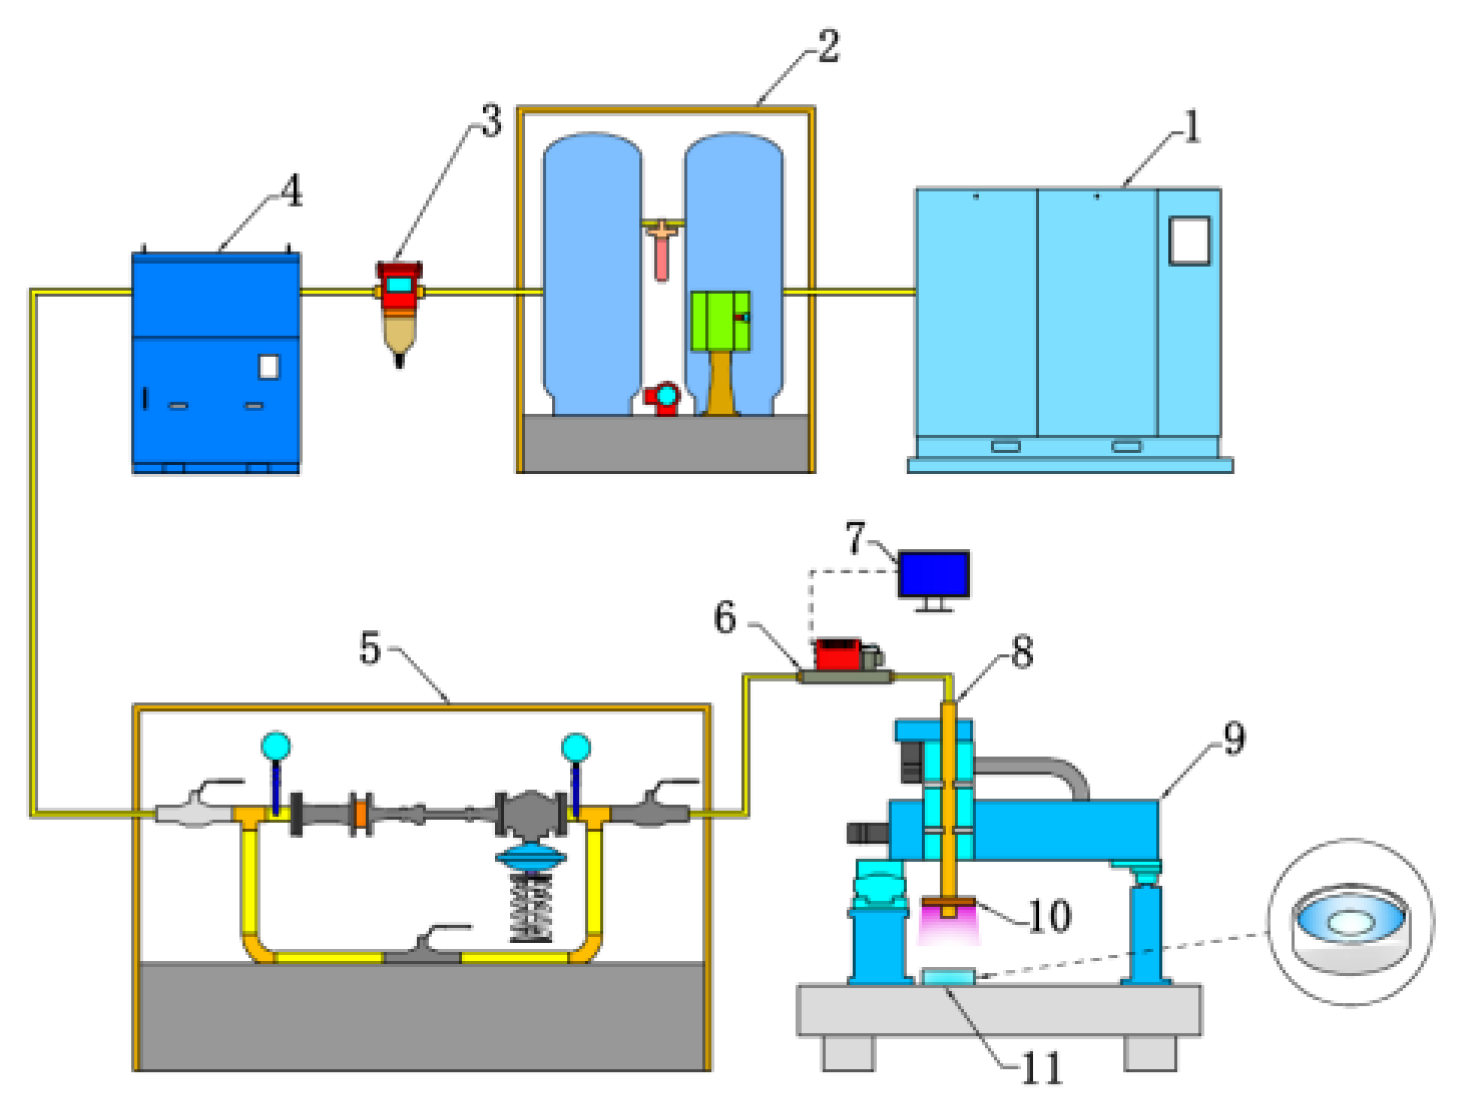
The experimental setup used in this research is shown in Figure 11. The experimental setup was adjusted for the nozzle axis position and the vertical height of the nozzle mouth from the epoxy resin surface through a precision three-axis moving platform with an accuracy of 0.01 mm.
During the experiment, the air was injected into the coupled gas tank (2) via the air compressor (1). The compressed air was released from the tank and filtered through the oil–water separator (3) and the refrigeration dryer (4) to ensure that the gas used in the experiments was clean and dry. The gas pressure was regulated via the gas MFC (5) to ensure a stable air pressure of the gas supplied during the experiment. The flow rate of the gas jet through the nozzle during the experiment was controlled using a gas jet controller (6). The experimental gas was finally jetted through the precision electroplated nozzle (8) onto the surface of the liquid epoxy resin in a transparent glass mould (10). The transparent glass mould containing the liquid epoxy resin was clamped to a marble platform (11), and the spatial position of the nozzle during the experiment was controlled by a precision three-axis moving platform (9). The forming process of the optical surface was directly observed through the transparent glass mould and recorded with a high-speed camera. The mirror blanks formed by solidifying the epoxy resin were measured using a surface profiler (Taylor Hobson PGI) on the resulting surface.

5. Experimental Results

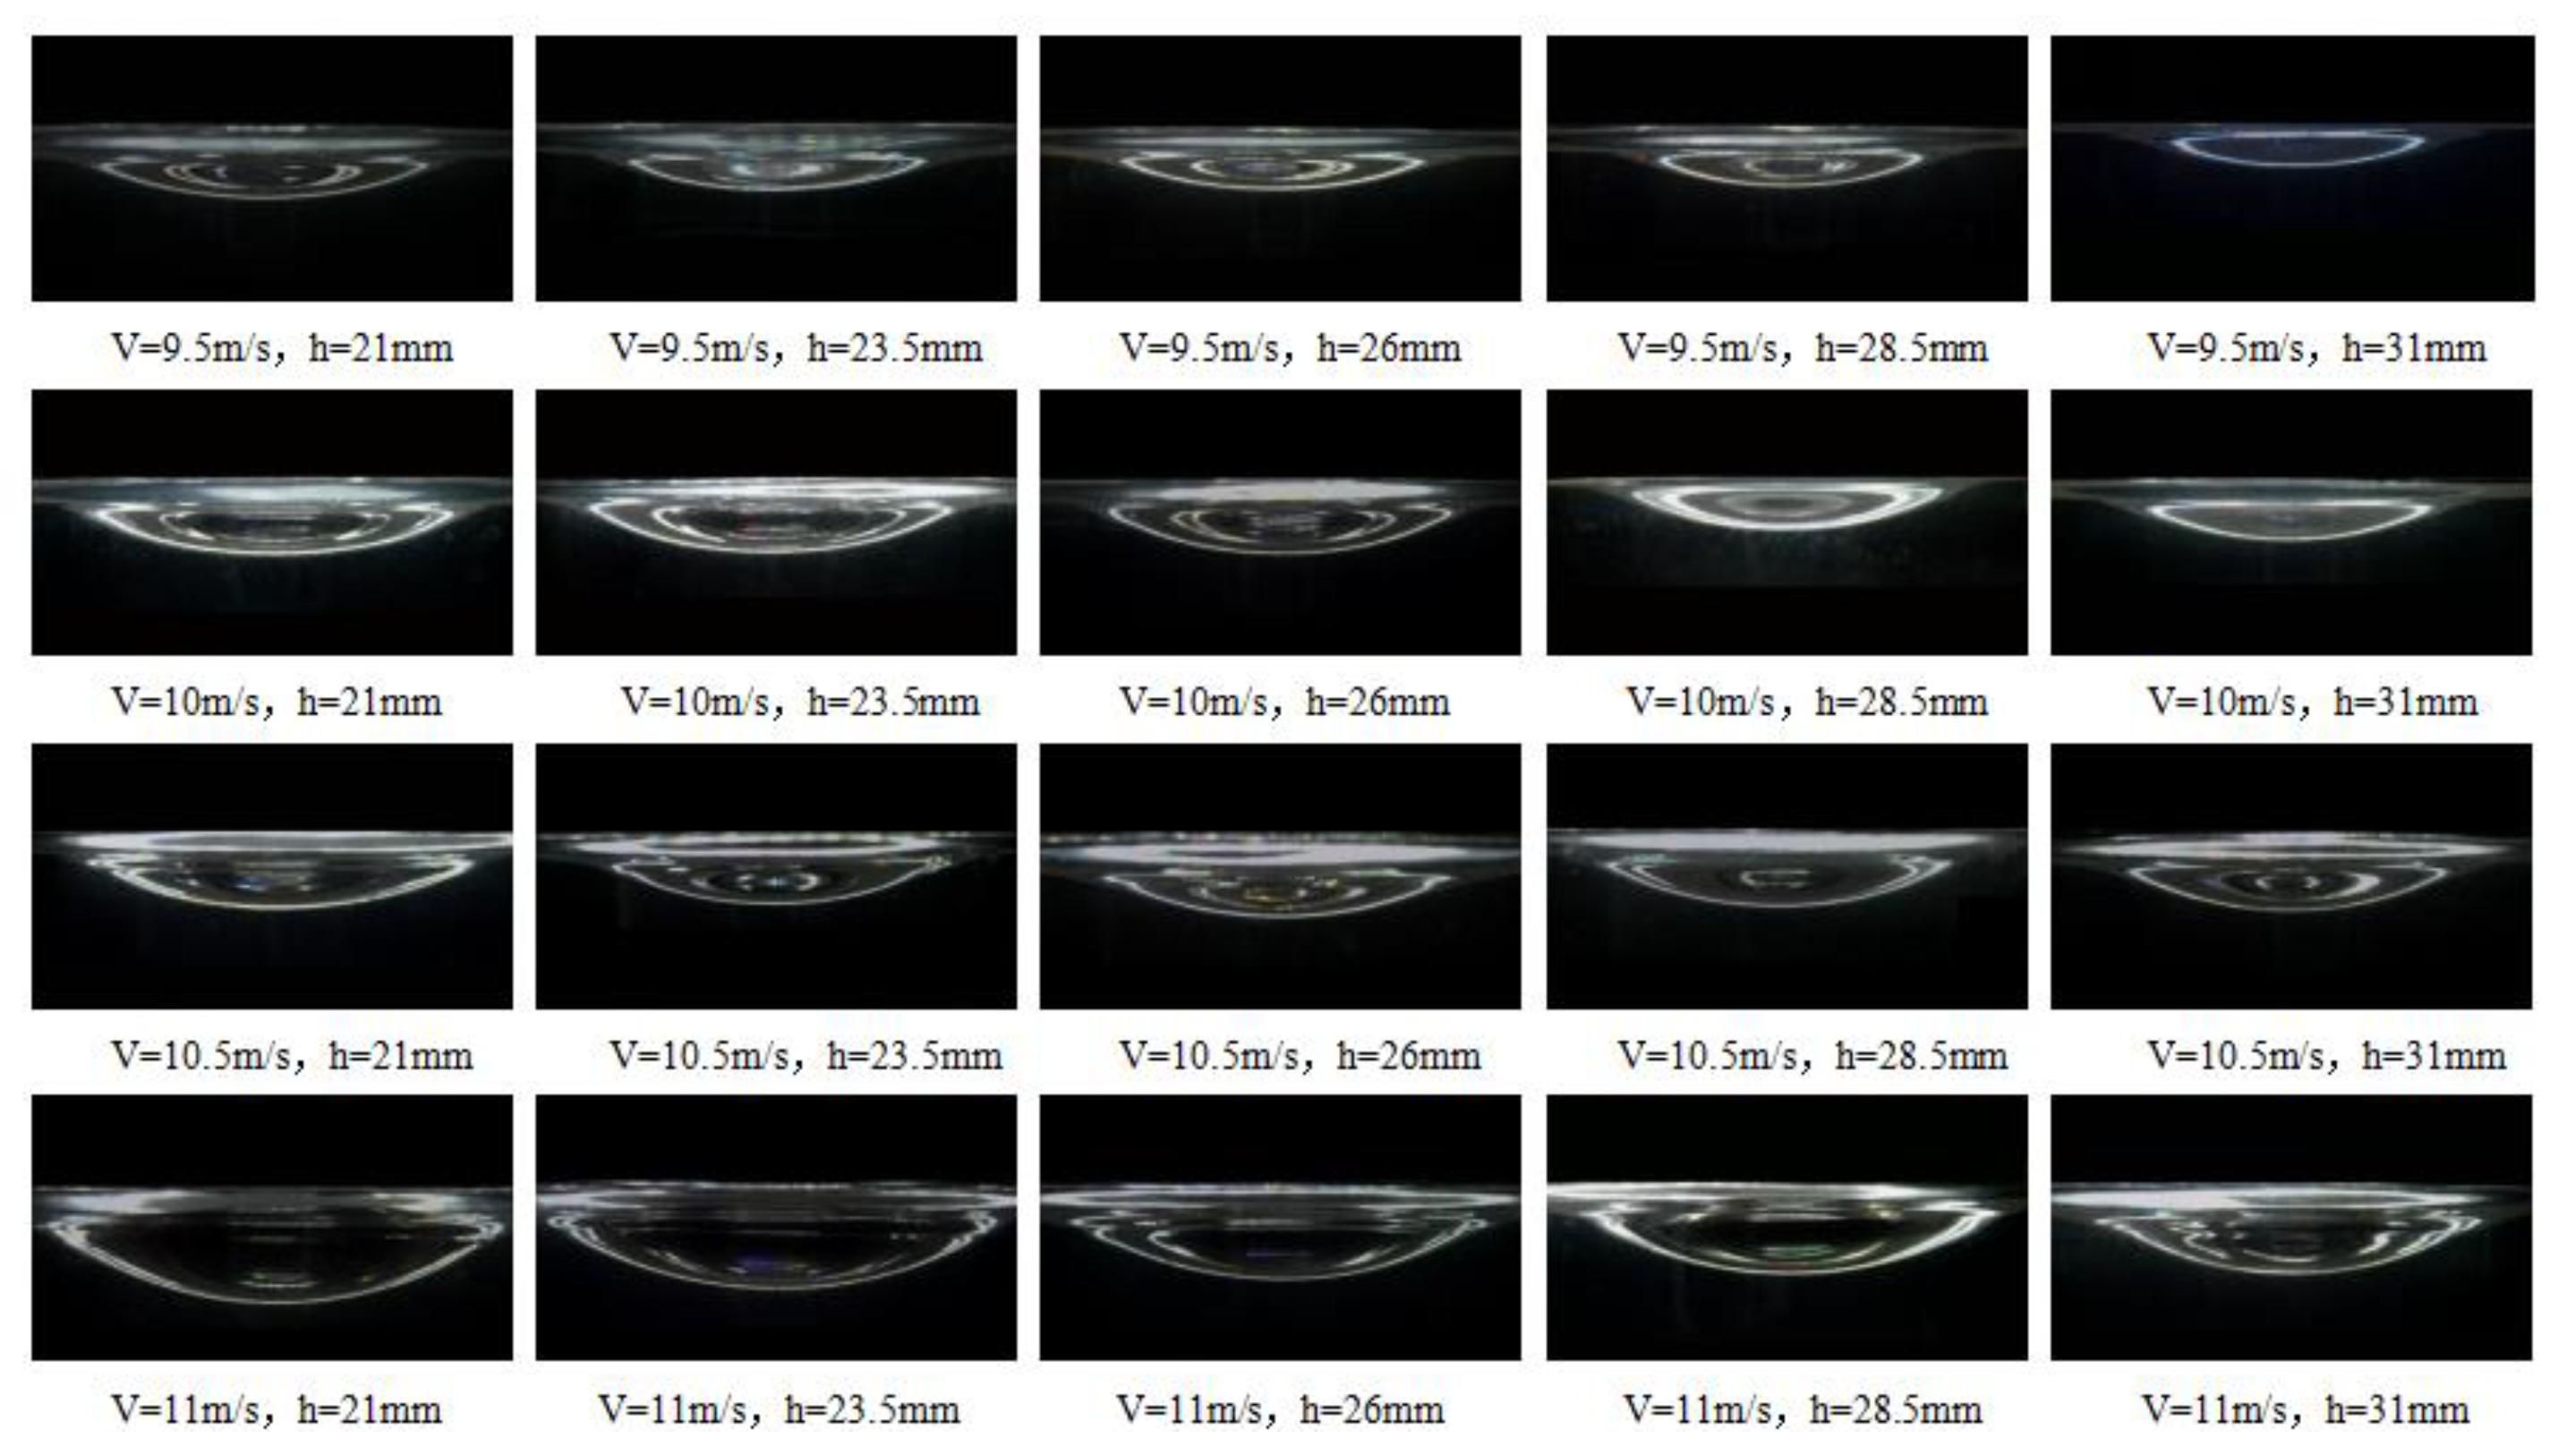
In this study, we used the equipment described above to experiment with the the gas jet forming of mirror blanks. In order to compare the experimental results with the numerical simulation results, the the gas jet forming parameters were kept consistent with the numerical simulations. The gas flow rates were 9.5 m/s, 10 m/s, 10.5 m/s, and 11 m/s. The nozzle’s height from the liquid surface was 20 mm, 22.5 mm, 25 mm, 27.5 mm, and 30 mm. Two sets of variables were used for orthogonal experiments, while single parameters were used for parallel experiments, and the results are shown in Figure 12.
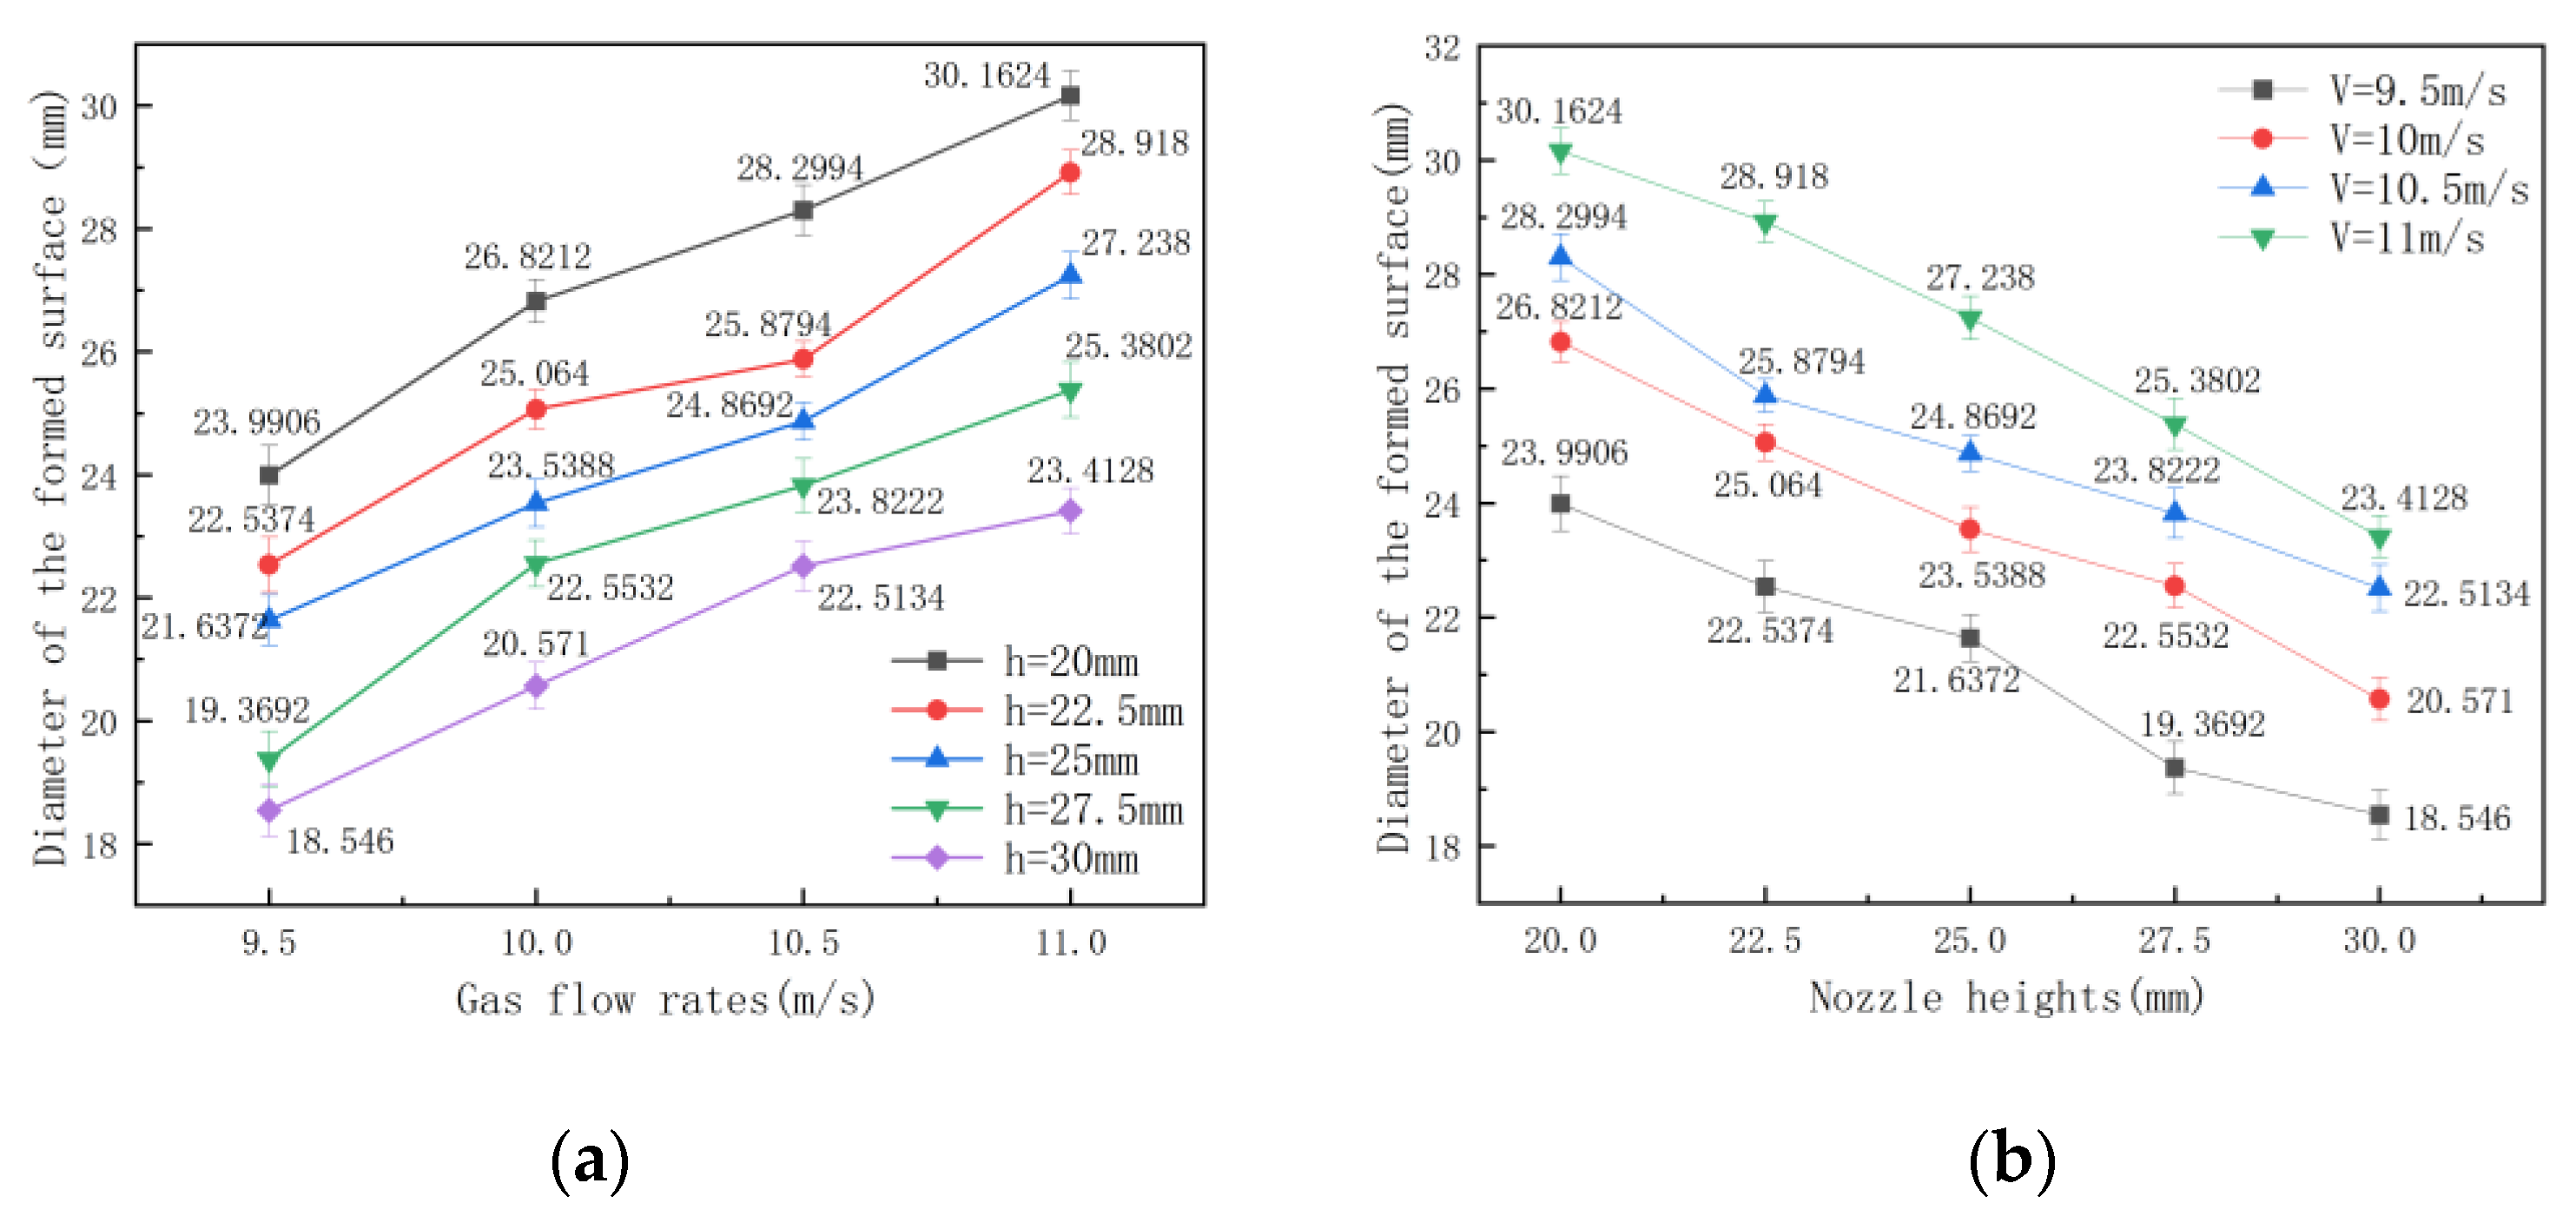
The surface shape of the mirrors was measured using a WILSON MMD-100JS profilometer in Guangzhou, China to obtain the diameter data of the surface formed by the gas jet. The principal curvature of the surface was calculated using the fitting method described in Section 3.4 to determine the principal curvature of the formed surface. The experiments were repeated three times for each set of experimental parameters, and the data obtained are shown in Figure 13.
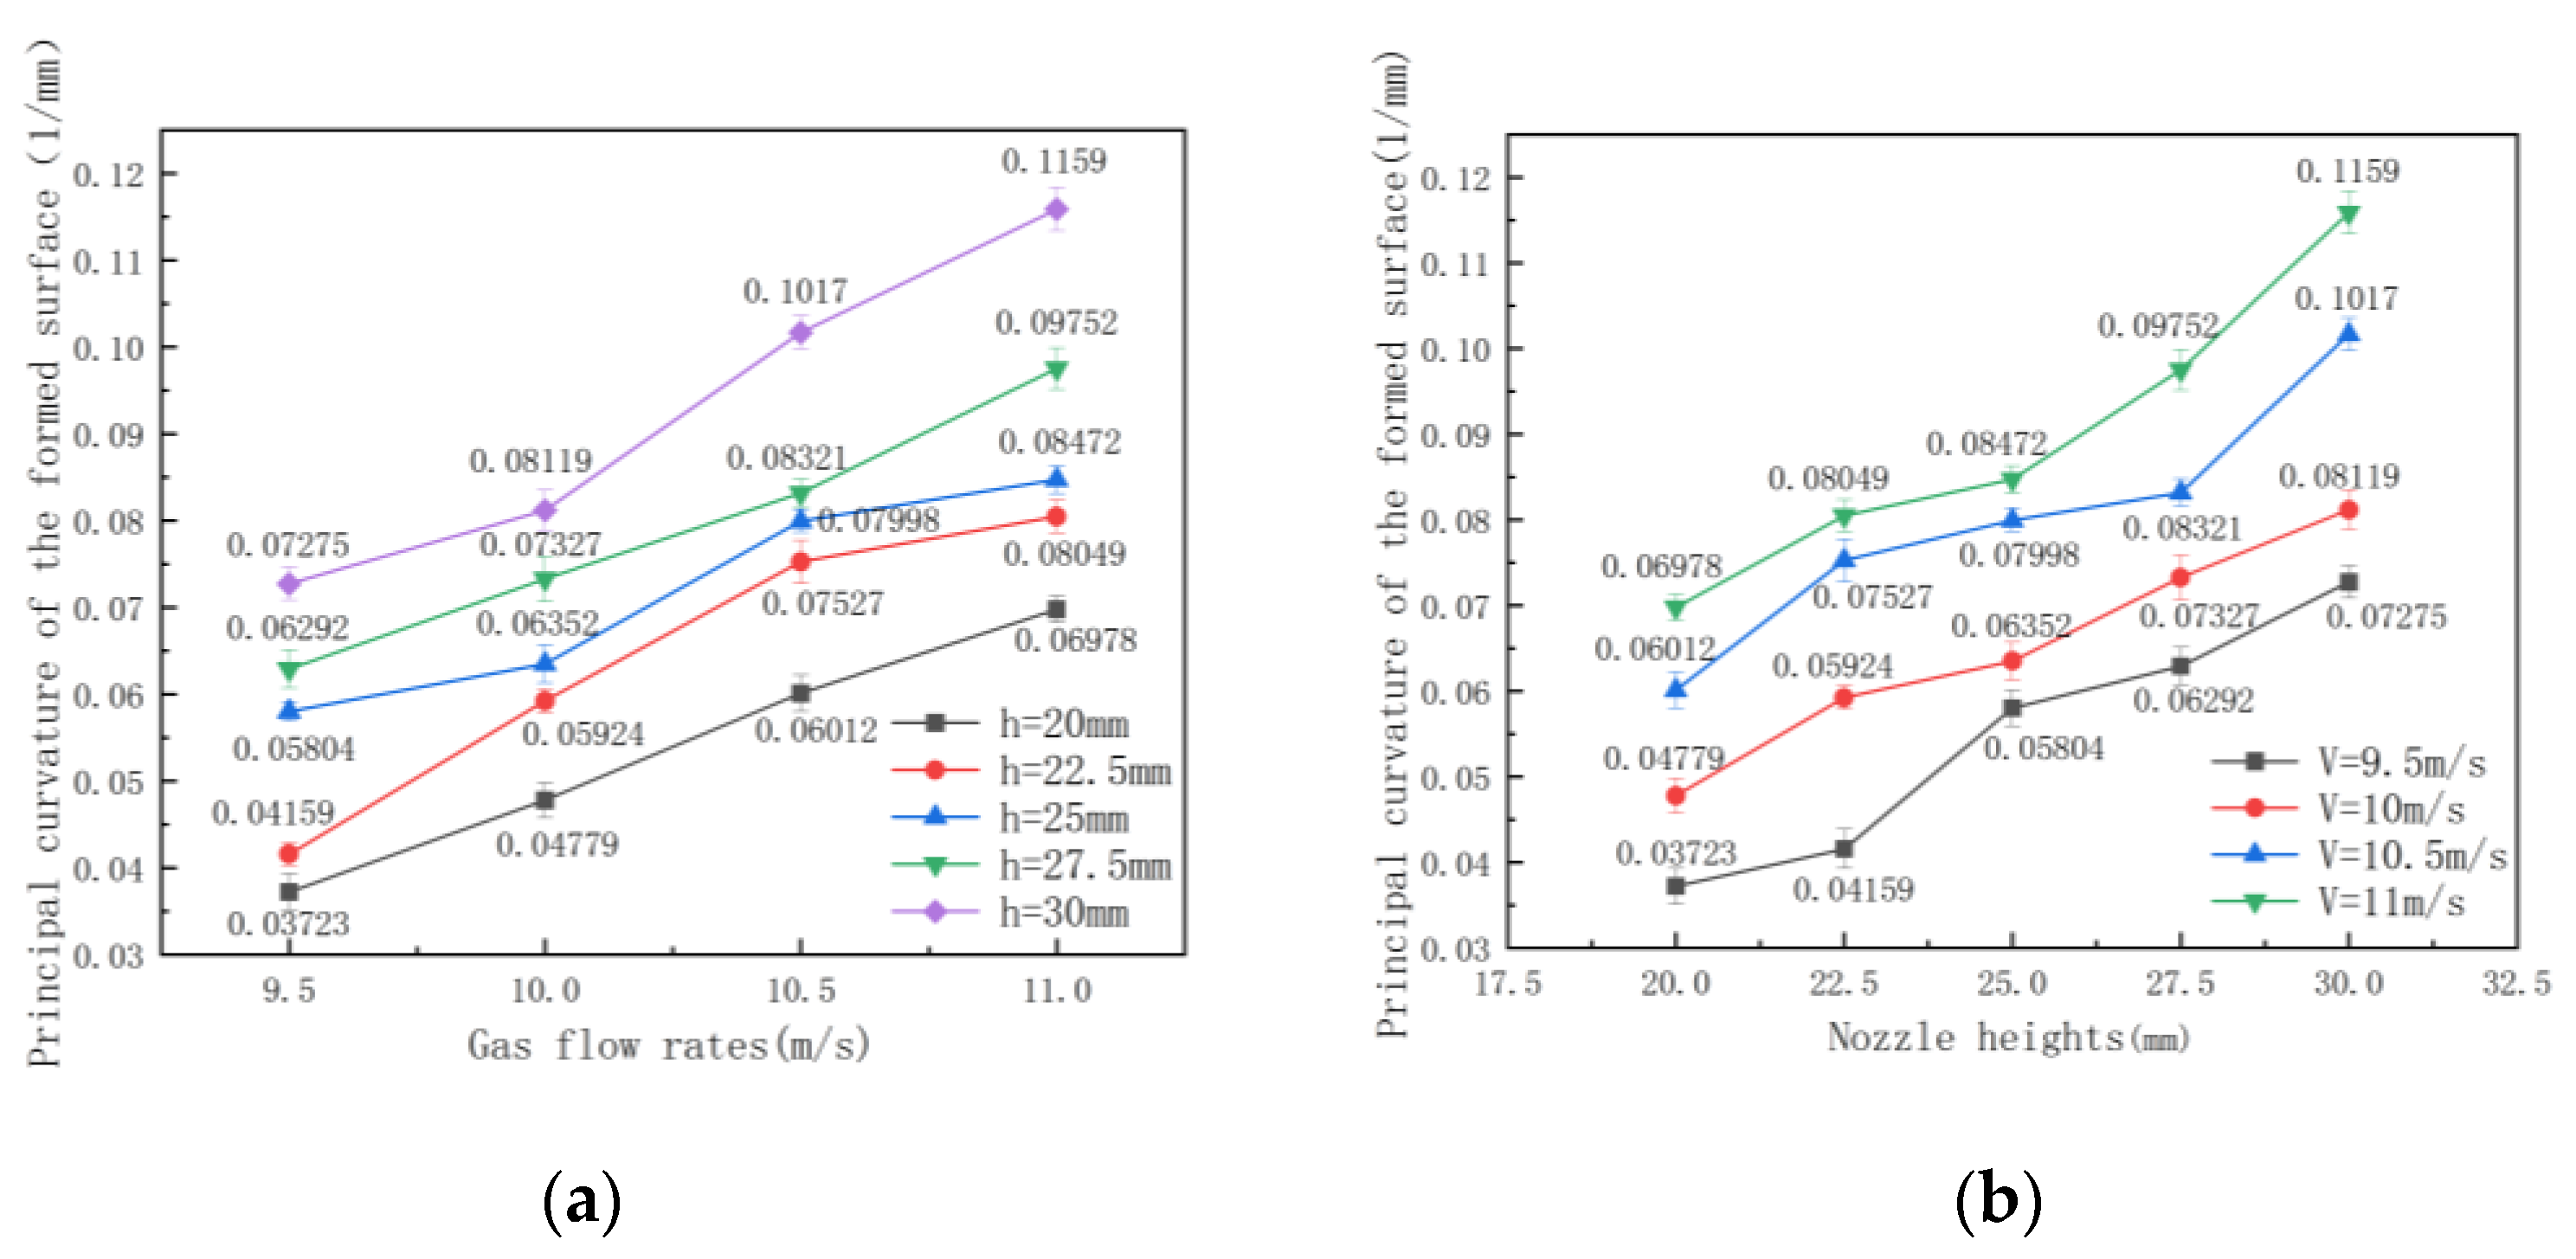
The experimental data with principal curvature for the gas jet parameters calculated by fitting the aspheric Equation (19) are shown in Figure 14.

6. Discussion

The experimental results show that the diameter of the surface formed by the gas jet increases as the gas flow rate increases and decreases as the nozzle height increases, which is consistent with the conclusions obtained above. The experimental data were compared with the numerical simulation data, and the deviations from the surface shape data obtained are shown in Table 3.
As shown in Table 3, by comparing the numerical simulations with the experimental results, it can be seen that the maximum error was 2.0708 mm and the average error was 1.07 mm for both sets of data.
Through the experimental data, it can be seen that the principal curvature of the mirror blank increases with the increase in the nozzle height and increases with the increase in the gas flow rate. The changing law of the principal curvature of the mirror blank caused by the variations of the gas jet parameters is consistent with the numerical simulations. The experimental data were compared with the numerical simulation data, and the deviations from the surface shape data obtained are shown in Table 4.
As shown in Table 4, by comparing the numerical simulations with the experimental results, it can be seen that the maximum error was 0.1079 mm−1 and the average error was 0.03665 mm−1 for both sets of data.
The analysis between the experimental data and the simulation results shows that these two methods have the same trend. However, the numerical simulation has a significant deviation in predicting the surface formed by the gas jet, and the reasons for this deviation are as follows:
Based on the momentum and mass equations, it is clear that the accuracy of the numerical simulation predictions is closely related to the rate properties within the grid. The formula for the rate property of the VOF method is as follows:
U V O F = α gas ρ gas U gas + α liq ρ liq U liq α gas ρ gas + α liq ρ liq ,
where α gas is the gas phase volume fraction, ρ gas is the gas phase physical density, Ugas is the gas phase lattice rate, α liq is the liquid phase volume fraction, ρ liq is the liquid phase physical density, and U liq is the liquid phase lattice rate.
U e r r o r = U V O F U liq = α gas ρ gas U gas + α liq ρ liq U liq α gas ρ gas + α liq ρ liq U liq ,
During the formation process, the difference in rate between the gas phase compared to the liquid phase is large. Differentiating the VOF method rate attributes U V O F and U liq yields the following final formula:
U e r r o r = α gas ρ liq ( U gas U liq ) α gas ρ gas + α liq ρ liq ,
In the VOF method, the gas and liquid phases must fill a certain grid. This means that the gas and liquid phases are in the control body, and the volume fraction sums to 1. The formula is as follows:
α gas + α liq = 1 ,
The mirror blanks were formed at a constant temperature of 20 °C, at which point the density of air is 1.225 kg/m3 and the density of the liquid phase is 977 kg/m3. Equation (24) was obtained by substituting the density data into Equation (22).
U e r r o r = 977 α gas ( U gas U liq ) α gas 1 . 225 + α liq 977 ,
In the VOF method, the accuracy of the subtype prediction in this test case is related to the difference between the mixed-phase rate property U V O F and the associated U liq . After deduction, the factors influencing U e r r o r include α gas , α liq , and the difference in rate U gas U liq between the gas and liquid phases. Assuming that within a specific grid at a certain α gas and α liq the time step is constant in this paper, the gas–liquid two-phase rate is the only factor that affects them. Since the liquid phase is a highly viscous fluid and the gas phase is air, the difference between the two phases is too significant, causing iterative errors.

7. Prediction Modelling of Surface Shape Parameters

The sizeable computational error at the interface of the gas–liquid phase in the numerical simulation is hard to correct, making it difficult to accurately predict the surface shape of the gas-jet-formed surface. Based on this issue, we accurately predicted the formed surface shape by establishing a dimensionless prediction model of the gas jet parameters and the surface shape parameters. The model was built by matching equations based on the variation trend of the experimental data and fitting the equation coefficients using the BFGS method. The prediction model for the formed surface diameter is shown in Equation (25).
d r e = β 1 + β 2 / V 0 2 + β 3 L n h ,
where V0 is the gas flow rate at the gas nozzle (m/s), h is the nozzle height (mm), and d r e is the surface diameter of the mirror blank (mm).
The BFGS method was used to fit the equation coefficients, and the results are shown in Table 5.
The gas jet parameters were set to V0 = 9.8 m/s, V0 = 10.3 m/s, h = 22 mm, and h = 24.5 mm for the orthogonal experiments, and the following conclusions can be obtained by comparing the experimental data with the calculation results of the surface diameter prediction model established in this paper: The maximum deviation of the experimental results was 0.8554 mm, and the average deviation was 0.3192 mm. The prediction accuracy of the model was much better than that of the numerical simulation.
The same method was used to build a predictive model for the principal curvature, which takes the form shown in Equation (26).
k = α 1 + α 2 v + α 3 V 0 2 + α 4 h α 5 ,
where V0 is the initial rate at the gas nozzle (m/s), h is the nozzle height (m), and k is the principal curvature of the mirror blank (mm−1). The BFGS method was used to fit the equation coefficients, and the results are shown in Table 6.
The gas jet parameters were set to V0 = 9.8 m/s, V0 = 10.3 m/s, h = 22 mm, and h = 24.5 mm for the orthogonal experiments, and the following conclusions can be obtained by comparing the experimental data with the calculation results of the principal curvature prediction model established in this paper: The maximum deviation of the experimental results was 0.00735 mm−1, and the average deviation was 0.00269 mm−1. The prediction accuracy of the model was much better than that of the numerical simulation.

8. Conclusions

In this paper, the pressure distribution at the potential core region of the gas jet was analysed theoretically and combined with numerical simulations to draw the following conclusions: The formed surface diameter increases as the flow rate increases and decreases as the nozzle height increases. The principal curvature increases with increasing flow rate and nozzle height. According to the test results, when the nozzle’s height from the liquid surface is 20–30 mm, the jet velocity is 9.5–11 m/s, the minimum value of the surface diameter formed by the gas jet is 18.5460 mm, and the maximum value is 30.1624 mm. The minimum value of the principal curvature formed by the gas jet is 0.03723 mm−1, and the maximum value is 0.1159 mm−1. The prediction of the surface parameters of the gas jet forming by the numerical simulation method was found to have large deviations in the experiments. The experimental results were compared with the simulation predictions, and it was found that the average prediction deviation of the diameter was 1.07 mm. The average prediction deviation for the principal curvature was 0.03665 mm−1, which is challenging to correct in simulation. Therefore, we developed a dimensionless prediction model of the surface curvature and surface diameter of the mirror blanks by considering the jet parameters using experimental data. The model’s average prediction error of the diameter of the formed surface was 0.3192 mm, and the average prediction error of the principal curvature of the formed surface was 0.00269 mm−1—better than the numerical simulation.

Author Contributions

W.F.: conceptualisation, methodology, software, investigation, writing—original draft. M.W.: validation, formal analysis, visualisation, software. X.Z.: validation, formal analysis, visualisation, investigation. All authors have read and agreed to the published version of the manuscript.

Funding

This research was funded by the “Basic and Applied Basic Research Fund of Guangdong Province, grant number 2021A1515110927”, the “Jilin Province Scientific and Technological Development Program, grant number 20200201006JC”, “The Open Project Program of Key Laboratory for Cross-Scale Micro and Nano Manufacturing, Ministry of Education, Changchun University of Science and Technology, grant number CMNM-KF202108”, and the “Scientific Research Project of Education Department of Guangdong Province, grant number 2022KCXTD029”.

Institutional Review Board Statement

Not applicable.

Informed Consent Statement

Informed consent was obtained from all subjects involved in the study.

Data Availability Statement

Not applicable.

Conflicts of Interest

The authors declare no conflict of interest.

References

  1. Martin, H.M.; Allen, R.G. Production of 8.4 m segments for the giant magellan telescope. SPIE Astron. Telesc. Instrum. 2012, 8450, 801–815. [Google Scholar]
  2. Ma, Z.; Peng, L.; Wang, J. Ultra-smooth polishing of high-precision optical surface. Optik 2013, 124, 6586–6589. [Google Scholar] [CrossRef]
  3. Jedamzik, R.; Werner, T.; Westerhoff, T. Production of the 4.26 m ZERODUR mirror blank for the Advanced Technology Solar telescope (ATST). SPIE Astron. Telesc. Instrum. 2014, 9151, 1012–1020. [Google Scholar] [CrossRef]
  4. Westerhoff, T.; Schäfer, M.; Thomas, A.; Weissenburger, M.; Werner, T.; Werz, A. Manufacturing of the ZERODUR 1.5-m primary mirror for the solar telescope GREGOR as preparation of light weighting of blanks up to 4-m diameter. SPIE Astron. Telesc. Instrum. 2010, 7739, 206–214. [Google Scholar]
  5. Hatefi, S.; Abou-El-Hossein, K. Review of single-point diamond turning process in terms of ultra-precision optical surface roughness. Int. J. Adv. Manuf. Technol. 2019, 106, 2167–2187. [Google Scholar] [CrossRef]
  6. Liu, Y.; Xing, Y.; Yang, C.; Li, C.; Xue, C. Simulation of heat transfer in the progress of precision glass molding with a finite element method for chalcogenide glass. Appl. Opt. 2019, 58, 7311–7318. [Google Scholar] [CrossRef] [PubMed]
  7. Fu, W.; Zhang, X. Numerical simulation assisted curve compensation in spin casting of optical mirror blank. Optik 2020, 207, 164406. [Google Scholar] [CrossRef]
  8. Fu, W.; Zhang, X. Experimental and numerical simulation study on gas jet forming of optical mirror blank. Optik 2020, 207, 164451. [Google Scholar] [CrossRef]
  9. Banks, R.B.; Bhavamai, A. Experimental study of the impingement of a liquid jet on the surface of a heavier liquid. J. Fluid Mech. 1965, 23, 229–240. [Google Scholar] [CrossRef]
  10. Molloy, N.A. Impinging jet flow in a two-phase system: The basic flow pattern. J. Iron Steel Inst. 1970, 208, 943–950. [Google Scholar]
  11. Meidani, A.R.N.; Isac, M.; Richardson, A.; Cameron, A.; Guthrie, R.I.L. Modelling Shrouded Supersonic Jets in Metallurgical Reactor Vessels. Iron Steel Inst. Jpn. 2004, 44, 1639–1645. [Google Scholar] [CrossRef] [Green Version]
  12. Ek, M.; Sichen, D. Study of Penetration Depth and Droplet Behavior in the Case of a Gas Jet Impinging on the Surface of Molten Metal using Liquid Ga–In–Sn. Steel Res. Int. 2012, 83, 678–685. [Google Scholar] [CrossRef]
  13. Kalifa, R.B.; Mahjoub Saïd, N.; Bournot, H.; Le Palec, G. Numerical Study of a Gas Jet Impinging on a Liquid Surface. In International Conference Design and Modeling of Mechanical Systems; Springer: Cham, Switzerland, 2017; pp. 661–670. [Google Scholar]
  14. Kofman, N.; Mergui, S.; Ruyer-Quil, C. Characteristics of solitary waves on a falling liquid film sheared by a turbulent counter-current gas flow. Int. J. Multiph. Flow 2017, 95, 22–34. [Google Scholar] [CrossRef]
  15. Rosler, R.S.; Stewart, G.H. Impingement of gas jets on liquid surfaces. J. Fluid Mech. 1968, 31, 163–174. [Google Scholar] [CrossRef]
  16. Vouros, A.P.; Panidis, T. Turbulent properties of a low Reynolds number, axisymmetric, pipe jet. Exp. Therm. Fluid Sci. 2013, 44, 42–50. [Google Scholar] [CrossRef]
  17. Mi, J.; Nobes, D.S.; Nathan, G.J. Influence of jet exit conditions on the passive scalarfield Of an axisymmetric free jet. J. Fluid Mech. 2001, 432, 91–125. [Google Scholar] [CrossRef] [Green Version]
  18. Banks, R.B.; Chandrasekhara, D.V. Experimental investigation of the penetration of a high-rate gas jet through a liquid surface. J. Fluid Mech. 1963, 15, 13–34. [Google Scholar] [CrossRef]
  19. Hirt, C.W.; Nichols, B.D.; Romero, N.C. SOLA: A Numerical Solution Algorithm for Transient Fluid Flows. In Energy Research and Development Administration; Energy Research and Devempment Administration: Washington, DC, USA, 1975; pp. 1–19. [Google Scholar]
  20. Nichols, B.D.; Hirt, C.W.; Hotchkiss, R.S. SOLA-VOF: A Solution Algorithm for Transient Fluid Flow with Multiple Free Boundaries; Los Alamos National Lab: Los Alamos, NM, USA, 1980. [Google Scholar] [CrossRef]
  21. Ishii, M.; Mishima, K. Two-fluid model and hydrodynamic constitutive relations. Nucl. Eng. Des. 1984, 82, 107–126. [Google Scholar] [CrossRef]
  22. Brackbill, J.; Kothe, D.; Zemach, C. A continuum method for modeling surface tension. J. Comput. Phys. 1992, 100, 335–354. [Google Scholar] [CrossRef]
  23. Jeon, S.S.; Kim, S.J.; Park, G.C. CFD Simulation of Condensing Vapor Bubble using VOF Model. World Acad. Sci. Eng. Technol. 2009, 60, 209–215. [Google Scholar]
  24. Evans, M.R.; Oliver, D.; Shekhar, S.; Harvey, F. Fast and Exact Network Trajectory Similarity Computation: A Case-study on Bicycle Corridor Planning, ACM SIGKDD. In Proceedings of the 2nd ACM SIGKDD International Workshop on Urban Computing, Chicago, IL, USA, 11 August 2013; Association for Computing Machinery: New York, NY, USA, 2013; pp. 1–8. [Google Scholar]
  25. Fréchet, M.M. Sur Quelques Points du Calcul Fonctionnel. Rend. Del Circ. Mat. Di Palermo 1906, 22, 1–72. [Google Scholar] [CrossRef] [Green Version]
  26. Chen, L.; Özsu, M.T.; Oria, V. Robust and Fast Similarity Search for Moving Object Trajectories. In Proceedings of the 2005 ACM SIGMOD International Conference on Management of Data, Baltimore, MD, USA, 14–16 June 2005; Association for Computing Machinery: New York, NY, USA, 2005; pp. 491–502. [Google Scholar]
  27. Schulz, G. Imaging Performance of Aspherices in comparison with Spherical Surfaces. Appl. Opt. 1987, 26, 5118–5142. [Google Scholar] [CrossRef] [PubMed]
Figure 1. Diagram of the mechanical equilibrium on the surface formed by the gas jet.
Applsci 13 00504 g001
Figure 2. Schematic diagram of the changes in the gas flow stream.
Applsci 13 00504 g002
Figure 3. Experimental results of the gas jet forming using the self-similarity region.
Applsci 13 00504 g003
Figure 4. The model diagram of the gas jet forming.
Applsci 13 00504 g004
Figure 5. Prediction of curves occurring at different grid densities.
Applsci 13 00504 g005
Figure 6. The results of the grid independence test.
Applsci 13 00504 g006
Figure 7. Numerical simulation results of the the gas jet forming.
Applsci 13 00504 g007
Figure 8. The diameter of the formed surface with different gas flow rates and nozzle heights in simulations. (a) is the relationship between the gas flow rate and the diameter of the forming surface. (b) is the relationship between the nozzle height and the diameter of the formed surface.
Applsci 13 00504 g008
Figure 9. The principal curvature of the formed surface with different gas flow rates and nozzle heights in simulations. (a) is the relationship between the gas flow rate and the principal curvature of the formed surface. (b) is the relationship between the nozzle height and the principal curvature of the formed surface.
Applsci 13 00504 g009
Figure 10. Schematic diagram of the process of the gas jet forming.
Applsci 13 00504 g010
Figure 11. Setup of the experimental the gas jet forming platform: (1) air compressor; (2) coupled gas tank; (3) water–oil separator; (4) refrigeration dryer; (5) gas MFC; (6) gas jet controller; (7) upper computer; (8) precision electroplated nozzle; (9) precision three-axis moving platform; (10) UV light source; (11) marble platform.
Applsci 13 00504 g011
Figure 12. Experimental results of the gas jet forming.
Applsci 13 00504 g012
Figure 13. The diameter of the formed surface with different gas flow rates and nozzle heights in the experiments. (a) is the relationship between the gas flow rate and the diameter of the formed surface. (b) is the relationship between the nozzle height and the diameter of the formed surface.
Applsci 13 00504 g013
Figure 14. The principal curvature of the formed surface with different gas flow rates and nozzle heights in the experiments. (a) is the relationship between the gas flow rate and the principal curvature of the formed surface. (b) is the relationship between the nozzle height and the principal curvature of the formed surface.
Applsci 13 00504 g014
Table 1. Gas jet parameters.
ParametersNumerical Value
Gas flow rate (m/s)9.5, 10, 10.5, 11
Nozzle height (mm)20, 22.5, 25, 27.5, 31
Table 2. Material properties.
AirPhotosensitive Resin
Density/kg·m−31.225977
Viscosity/cps1.7894 × 10−52000
Surface tension/mN·m−137.6
Table 3. Errors between numerical simulations and experimental data for the diameter of the formed surface.
ParametersErrorParametersError
V0 = 9.5 m/s, H = 20 mm1.8402V0 = 10.5 m/s, H = 20 mm1.4042
V0 = 9.5 m/s, H = 22.5 mm1.8428V0 = 10.5 m/s, H = 22.5 mm0.7813
V0 = 9.5 m/s, H = 25 mm1.5873V0 = 10.5 m/s, H = 25 mm0.5734
V0 = 9.5 m/s, H = 27.5 mm0.0746V0 = 10.5 m/s, H = 27.5 mm0.6478
V0 = 9.5 m/s, H = 30 mm0.1444V0 = 10.5 m/s, H = 30 mm1.6308
V0 = 10 m/s, H = 20 mm2.0708V0 = 11 m/s, H = 20 mm0.7312
V0 = 10 m/s, H = 22.5 mm0.8694V0 = 11 m/s, H = 22.5 mm1.3644
V0 = 10 m/s, H = 25 mm1.0398V0 = 11 m/s, H = 25 mm0.9884
V0 = 10 m/s, H = 27.5 mm1.2586V0 = 11 m/s, H = 27.5 mm1.1418
V0 = 10 m/s, H = 30 mm0.8166V0 = 11 m/s, H = 30 mm0.5922
Table 4. Errors between the numerical simulations and experimental data for the principal curvature of the formed surface.
ParametersErrorParametersError
V0 = 9.5 m/s, H = 20 mm0.01164V0 = 10.5 m/s, H = 20 mm0.02202
V0 = 9.5 m/s, H = 22.5 mm0.00086V0 = 10.5 m/s, H = 22.5 mm0.02211
V0 = 9.5 m/s, H = 25 mm0.00826V0 = 10.5 m/s, H = 25 mm0.02522
V0 = 9.5 m/s, H = 27.5 mm0.00130V0 = 10.5 m/s, H = 27.5 mm0.06659
V0 = 9.5 m/s, H = 30 mm0.00561V0 = 10.5 m/s, H = 30 mm0.07670
V0 = 10 m/s, H = 20 mm0.00824V0 = 11 m/s, H = 20 mm0.06482
V0 = 10 m/s, H = 22.5 mm0.00323V0 = 11 m/s, H = 22.5 mm0.07881
V0 = 10 m/s, H = 25 mm0.01480V0 = 11 m/s, H = 25 mm0.08948
V0 = 10 m/s, H = 27.5 mm0.00882V0 = 11 m/s, H = 27.5 mm0.09778
V0 = 10 m/s, H = 30 mm0.01875V0 = 11 m/s, H = 30 mm0.10790
Table 5. Coefficients of the prediction model for the formed surface diameter.
β 1 β 2 β 3
Density/kg·m−31.225977
Table 6. Coefficients of the prediction model for the principal curvature of the formed surface diameter.
α 1 α 2 α 3 α 4 α 5
−0.492870.07184−0.002318.280751.28306
Disclaimer/Publisher’s Note: The statements, opinions and data contained in all publications are solely those of the individual author(s) and contributor(s) and not of MDPI and/or the editor(s). MDPI and/or the editor(s) disclaim responsibility for any injury to people or property resulting from any ideas, methods, instructions or products referred to in the content.