Article

Parametric Study on Analyzing the Effect of Soil–Cement Strength on the Uplifting Behavior of HSCM Piles Installed in Marine Soft Clay

1
School of Civil and Ocean Engineering, Jiangsu Ocean University, Lianyungang 222005, China
2
State Grid Lianyungang Power Supply Company, Lianyungang 222005, China
*
Author to whom correspondence should be addressed.
Appl. Sci. 2023, 13(1), 330; https://doi.org/10.3390/app13010330
Submission received: 11 October 2022 / Revised: 13 December 2022 / Accepted: 22 December 2022 / Published: 27 December 2022
(This article belongs to the Special Issue Pile Foundation Analysis and Design)

Abstract

:
The Helix-Stiffened Cement Mixing (HSCM) pile is a composite pile constructed by grouting the soil–cement during the installation of the helical pile. A series of 3-D Finite Element Method (FEM) models were developed to investigate the uplifting behavior of HSCM piles installed in marine soft clay. The uplifting behavior of HSCM piles was compared to the Stiffened Deep Cement Mixing (SDCM) piles and the difference was discussed. The FEM results showed that the uplifting ultimate bearing capacity of the HSCM piles and SDCM piles increased with the soil–cement-strength-to-clay-adhesion ratio ( C r e f / s u ) until the ratio reached 20 and 40, respectively. The failure mode influenced the uplifting behavior of HSCM piles. At C r e f / s u     40 , 80 , the HSCM pile incurred damage at the pile–soil interface, which gradually shifted to the steel pipe and soil–cement interface as the C r e f / s u was further decreased. Based on the FEM results, the empirical formula for estimating the uplift ultimate bearing capacity of HSCM piles under different failure types was proposed, which provided reliable guidance for designing HSCM piles.

1. Introduction

The stiffened deep cement pile is a composite pile that stiffens a rigid pile into a flexible pile. Using the pile core to bear the load and spreading the load to the soil around the pile through the cement column not only give full play to the advantages of rigid piles and flexible piles but also solve the problems of the high cost of rigid piles and insufficient load-bearing performance of flexible piles [1,2,3]. In recent years, some scholars have replaced the traditional rigid pile cores with newly shaped piles and conducted research [4,5]. The Helix-Stiffened Cement Mixing (HSCM) pile replaces a traditional rigid pile core with a helical pile core. The slurry injection process was used to compensate for the disturbance of the soil by the helix plate while retaining the advantages of the convenient installation of helical piles and improving the installation technology and interface action, further enhancing the construction efficiency and load-bearing performance of the HSCM pile [4].
Vickars had earlier verified the feasibility of HSCM pile installation through field tests, which improved the stiffness and load-bearing capacity of the pile foundation through the grouting technology [6]. Khazaei and Eslami tested HSCM piles in sands by using a frustum-confined vessel (FCV). The results showed that the compressive load-bearing capacity of HSCM piles was approximately 1.54–2.2 times that of helical piles with the same parameters [7]. Mansour and El Naggar pointed out that the increased axial bearing capacity of HSCM piles originates from the lateral displacement and extrusion deformation of the sand around the pile during the diffusion of cement slurry, which increased the radial stress and internal friction angle at the pile and soil interface [8].
The factors affected by the load-bearing performance of HSCM piles were various. Shariat [9] proposed a parameter optimization method based on the Lagrangian Multiplier Method programming, capable of proposing diagrams for different design conditions to determine the best regulation and values of design parameters. Nabizadeh investigated the effect of the helix number on the axial load-bearing capacity of HSCM piles through field tests. An appropriate helix number could improve the stiffness of the pile, while an excessive helix number could increase the disturbance of the soil [10,11]. Zhuang conducted axial loading tests on HSCM piles and found that parameters including helix diameter, helix number, and drilling speed all affected the bearing capacity of HSCM piles, which was due to the change in strength and diameter of the soil–cement column, resulting in changes in skin resistance and end-bearing capacity [12]. Srijaroen investigated the effect of different soil–cement column lengths L s c on the compressive load-bearing performance of HSCM piles. When L s c was less than the helical pile length, the load-bearing efficiency increased with L s c [13]. The material parameters of the cement soil could influence the performance of the structure. Madadi [14,15] investigated the mechanical properties of lightweight expanded perlite and clay ferrocement mixtures using digital image correlation (DIC) and finite element analysis (FEA). The results showed that DIC and FEA were approximate for assessing lightweight expanded perlite and clay ferrocement mixtures. The mean values of the first crack ( F c r ) and ultimate loads were higher in the ferrocement mixed with lightweight expanded clay and perlite, respectively. The volumetric content of the lightweight aggregates contributed more to the increase in the Fcr of the ferrocement.
For the failure mode of stiffened deep cement mixing (SDCM) piles, Dong proposed the progressive and rapid failure modes based on numerical simulations under axial loading conditions: the former was related to plastic deformation of the soil around the pile, while the latter was due to concrete core cracking [16]. Wonglert found that SDCM piles under axial loading might suffer from pile and soil interface failures, end-bearing failures, and pile-core failures through simulated field tests, with the failure mode depending on various factors, including the soil–cement column length and the soil strength [2]. For the failure mode of helical piles, which were usually in cylindrical shear and individual bearing under axial loading, the failure mode depended on the ratio of helix diameter to helix spacing, S/D [17,18,19,20]. The axial failure mode of helical piles and SDCM piles had been studied, but the failure mode of HSCM piles was less researched.
Although the bearing performance of HSCM piles in sandy soils has been investigated by Mansour and Naggar [4,8], there is less research on the uplift bearing characteristics of HSCM piles in marine soft clay. Dong [16] proposed several failure modes of SDCM piles, but the failure modes of HSCM piles were unclear. It is challenging to observe the failure modes due to the complex environmental factors that often accompany field tests. Based on the above problems, this paper investigated the uplift bearing characteristics of HSCM piles in marine soft clay through numerical simulation methods based on the existing relevant tests. The reliability of the finite element model was verified using Plaxis 3D, and the effects of soil–cement strength and soil strength on the uplift bearing characteristics and the failure mode of HSCM piles were analyzed.

2. Materials and Methods

2.1. Experimental Parameters

A pile foundation field in situ test example in Lianyungang, Jiangsu, China [21] was validated and parametrically analyzed by Plaxis 3D numerical simulation to investigate the interaction and bearing characteristics of soft, soil–cement, and helical piles in marine soft clay during uplift loading.
Finite element analysis was carried out using helix-stiffened cement mixing pile HSCM-FT. The field test pile HSCM-FT was installed by the simultaneous-grouting method, using the helix plates to mix the cement slurry and soil. After, the soil–cement was consolidated entirely to be able to form a soil–cement column around the helical pile to reinforce the pile shaft, thus forming the HSCM pile. The pile installation process is shown in Figure 1.
The geometrical parameters of the helical pile included helix diameter D H = 0.26 m, pile length L = 14 m, and steel pipe diameter d = 0.09 m. The soil–cement bond diameter D s c = 0.32 m was measured through the field excavation. The site for this field test was a typical marine soft clay area distributed with deep silt layers, characterized by high water content, high plasticity, high compressibility, low undrained shear strength, and low permeability. The physical and mechanical parameters of the soil at the test site are shown in Table 1.

2.2. The FEM Parameters

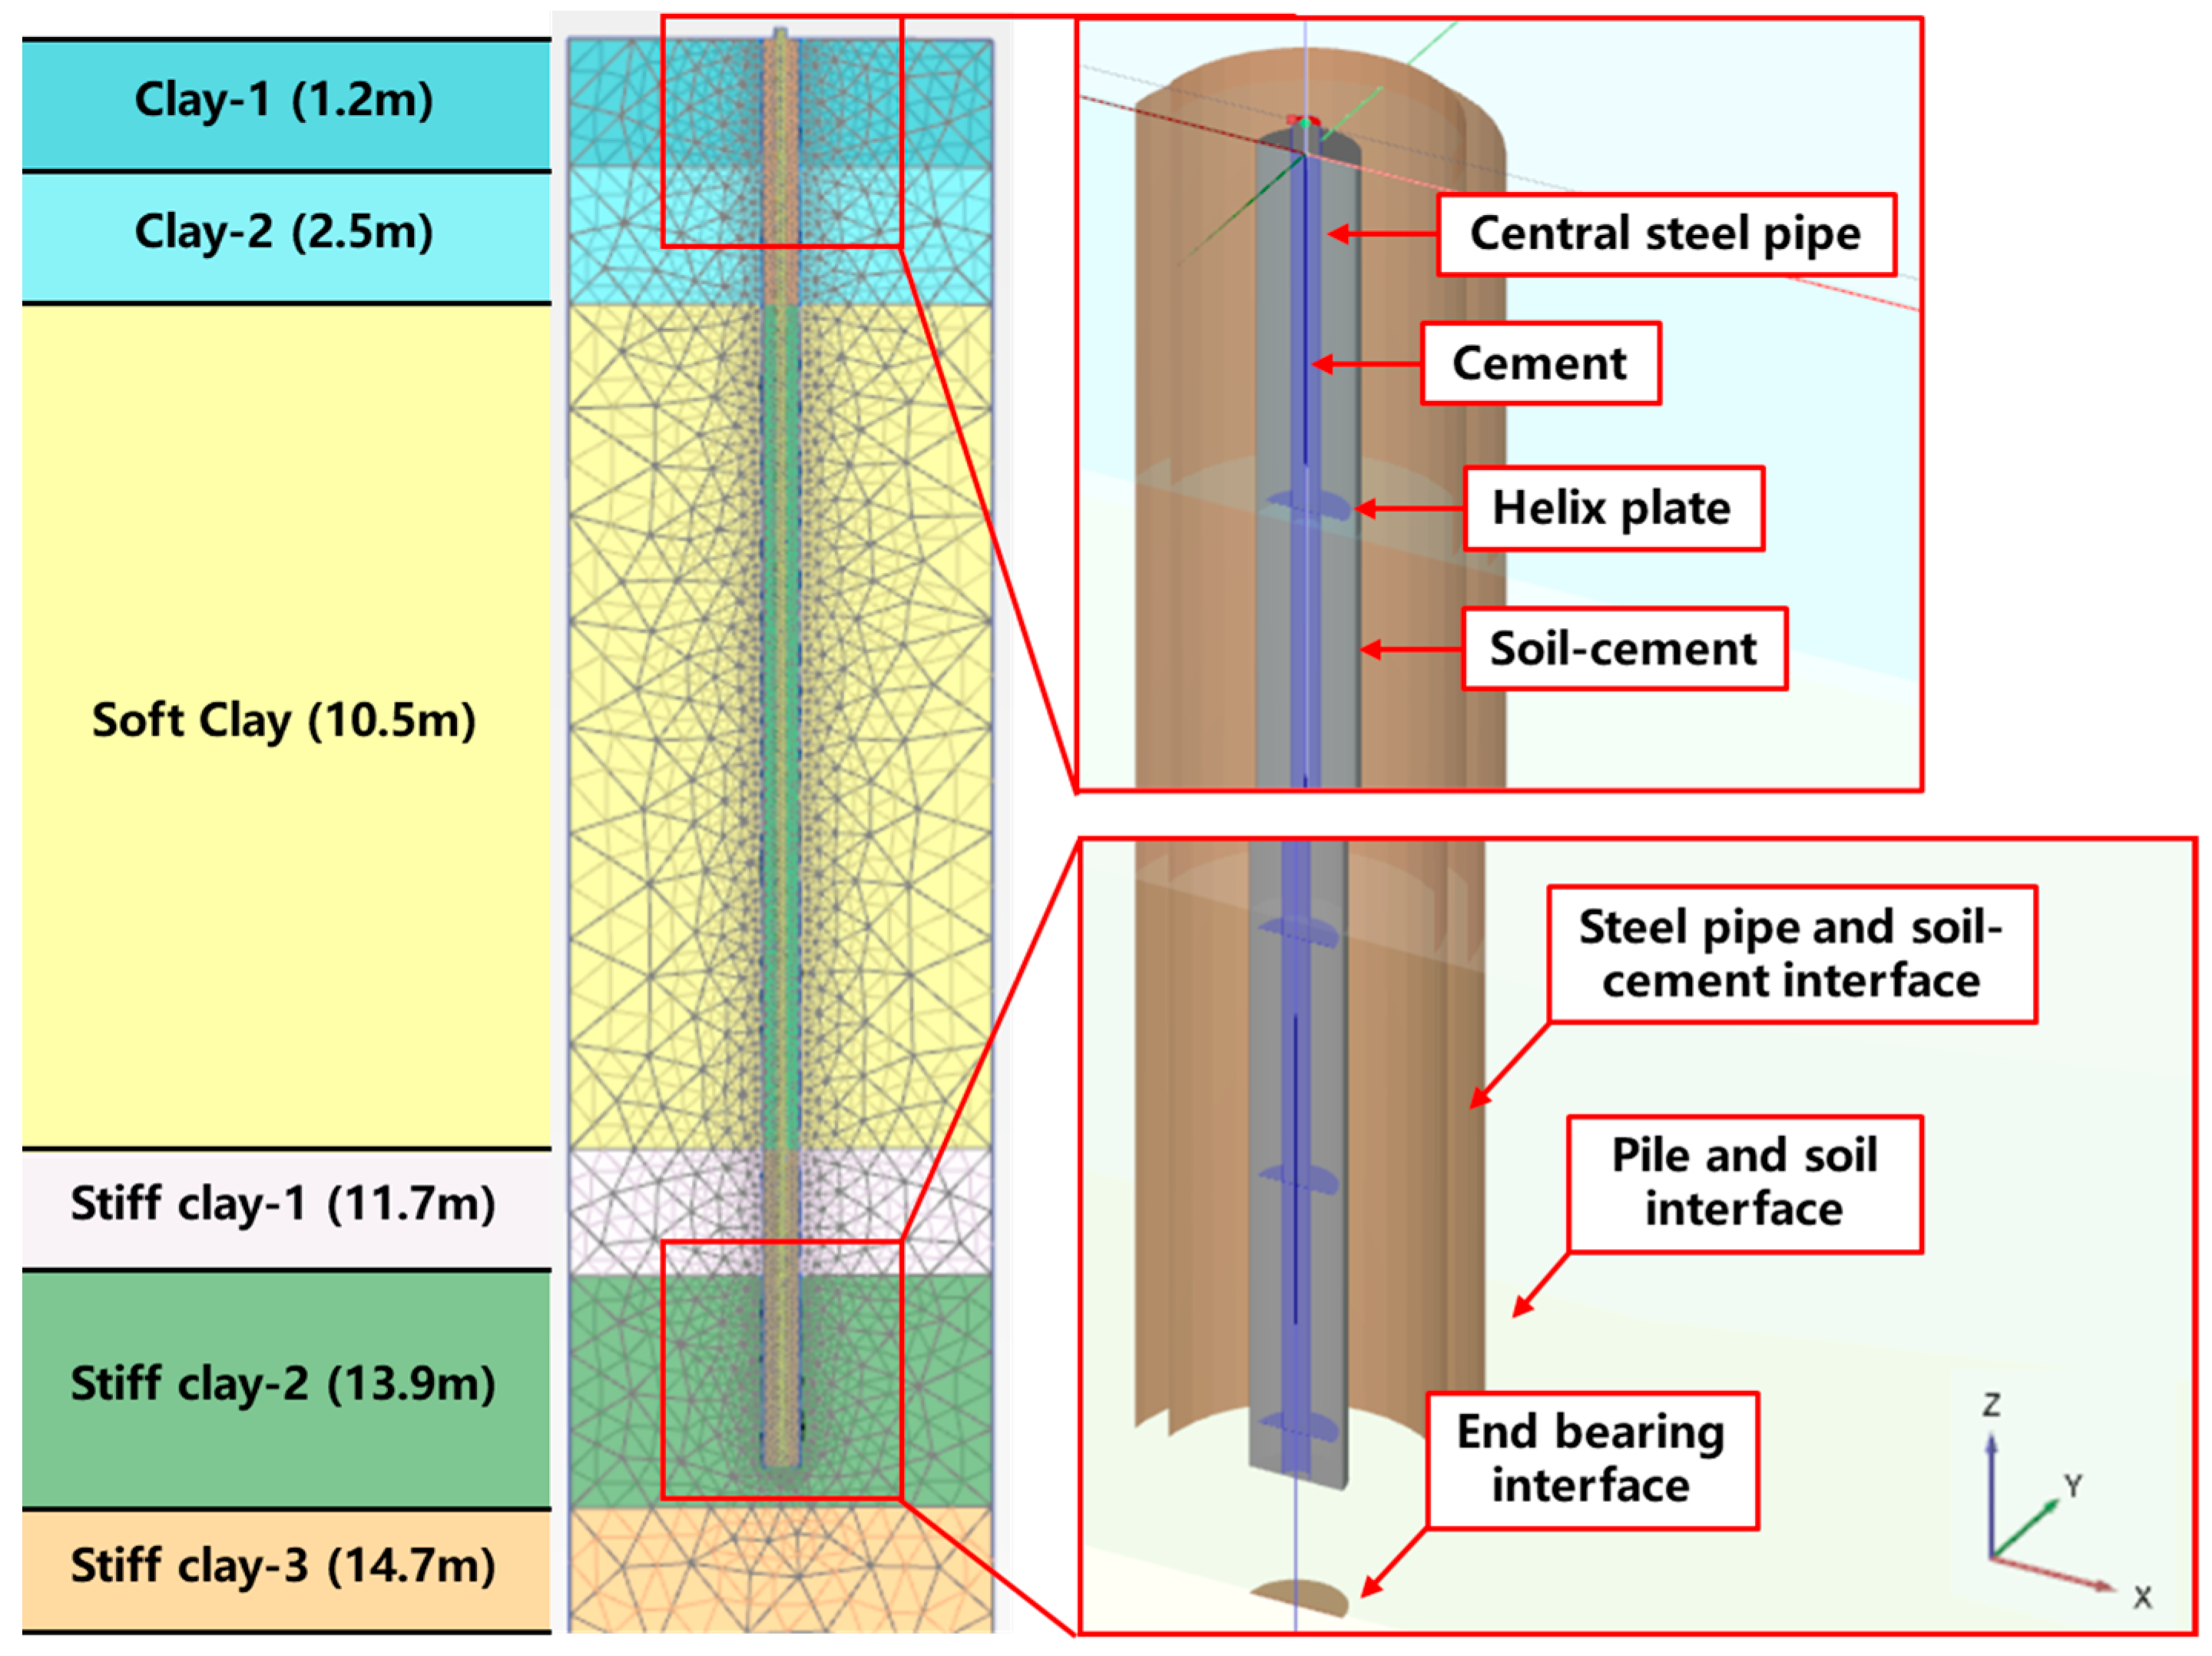
The 3D calculation model of HSCM-FT is shown in Figure 2 with 1/2 modeling due to the symmetry of the structure. The soil layers were divided into six layers according to the site exploration. The test pile model was divided into four parts: the helical pile, the cement in the steel pipe, the soil–cement column, and the interface. The interface was divided into the steel pipe and soil–cement interface, pile and soil interface, and the end-bearing interface depending on the material. The ontological model of the material uses Moore–Coulomb. The drainage type of the soil was chosen as the undrained (B) with undrained shear strength, and the soil–cement was set as a non-porous material with linear elasticity.
The helical pile was buried at a depth of 13.5 m with seven helix plates located 1.15 m, 2.65 m, 5.65 m, 8.65 m, 11.75 m, 12.55 m, and 13.35 m below the ground surface. The helix plates and the steel pipe had an elastic modulus of 200 GPa and Poisson’s ratio of 0.3. The soil–cement column was divided into three parts according to the strength of the soil to improve the calculation accuracy. The upper layer of soil–cement-1, the silt layer of soil–cement-2, the holding layer of soil–cement-3, and the corresponding steel pipe and soil–cement interface were established. The material parameters are shown in Table 2. The interface coefficient was related to the material properties and strength. According to Zhou, based on shear tests of precast piles and soil–cement, the interfacial friction coefficient was 0.116 to 0.141 when the soil–cement strength ranged from 65 to 1500 kPa [22]. This study used the strength reduction factor R i n t e r = 0.13 for the interface of the steel pipe, soil, and soil–cement. In addition, for the interface of the pile and soil in cohesive soil, R i n t e r was usually taken as 0.4.
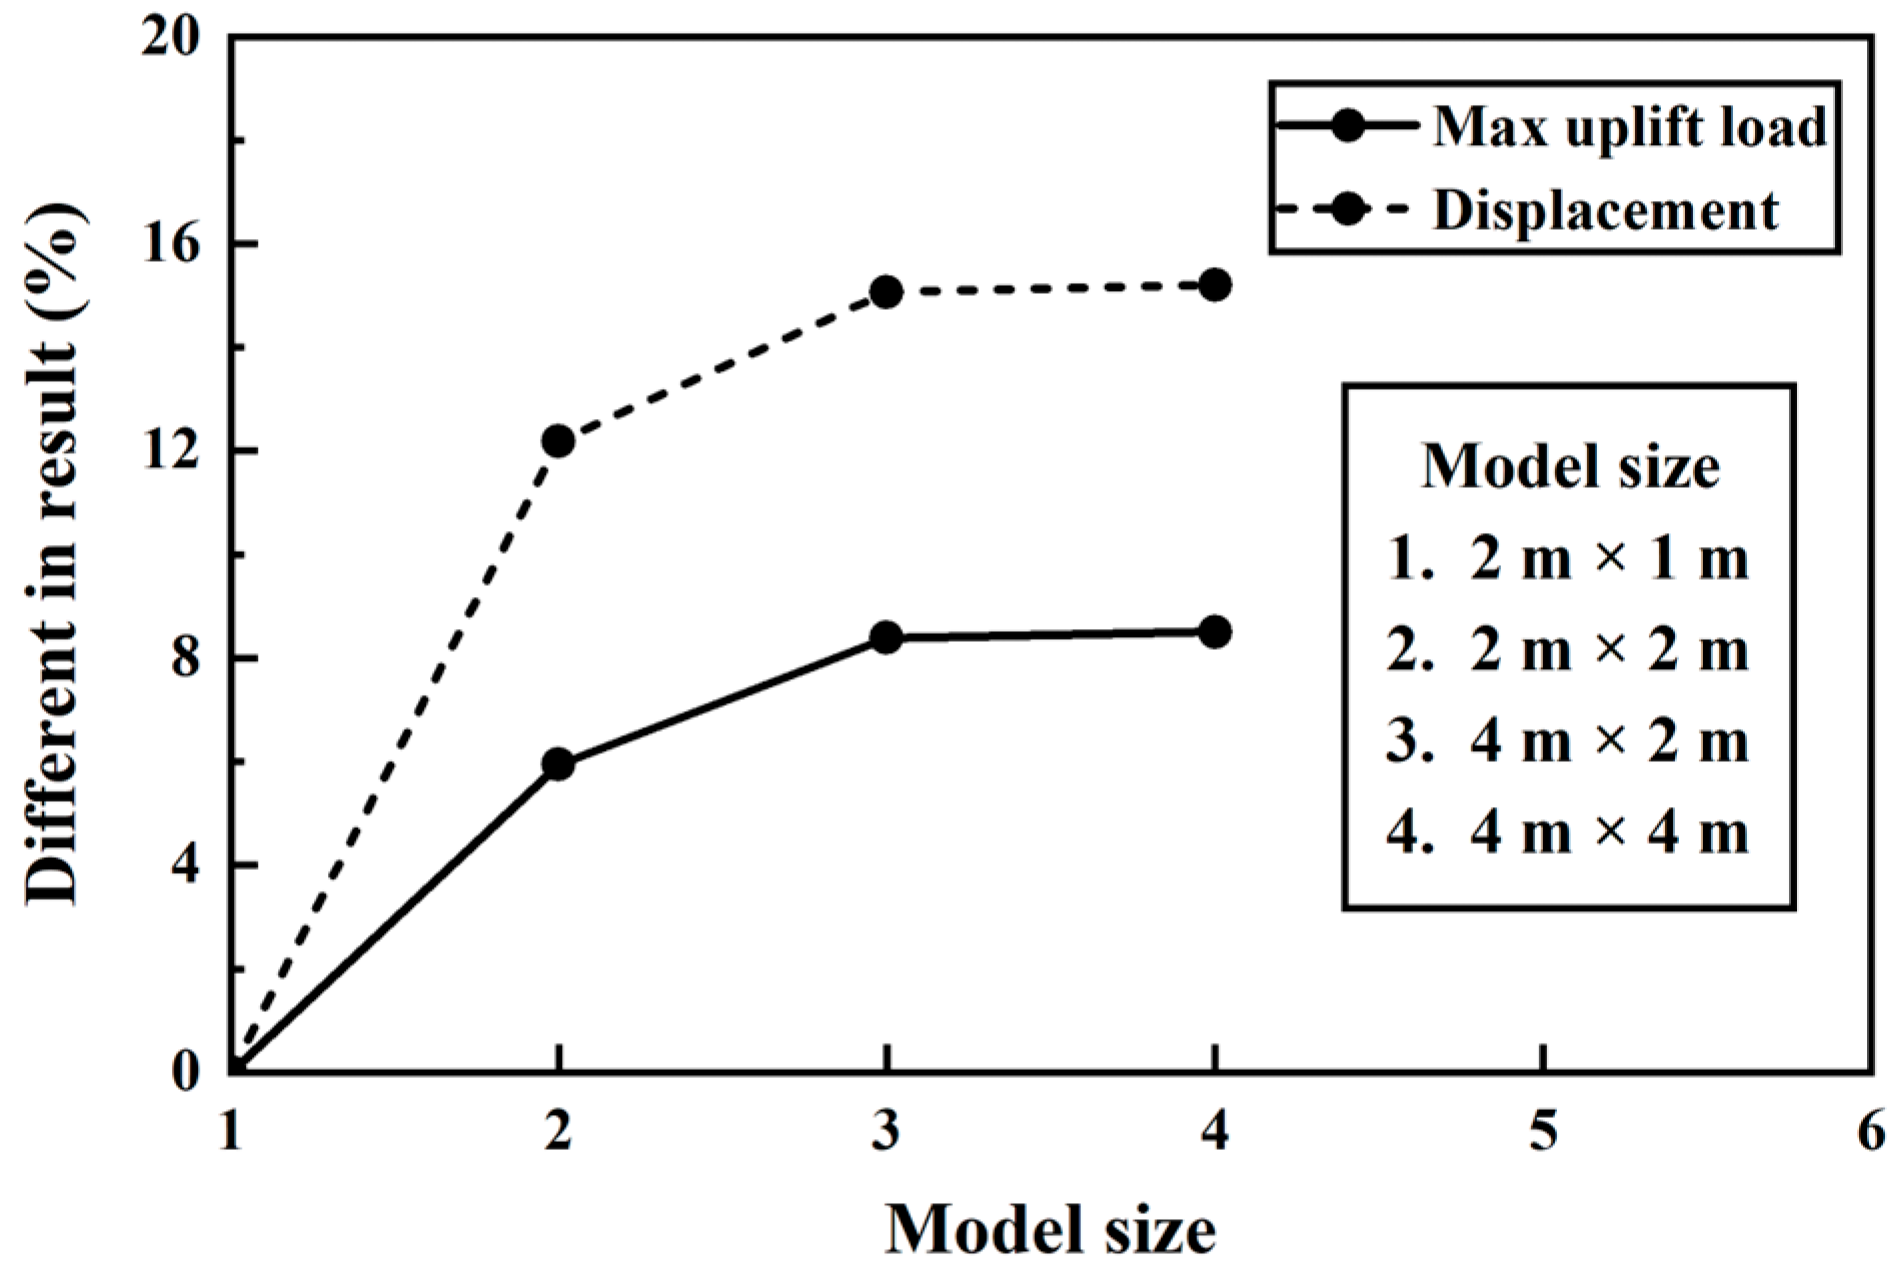
The model dimensions were evaluated by varying the boundary positions on the x and y axes to reduce the influence of boundary conditions on the pile and soil interaction until the calculations converged and reached relative stability. The model dimensions of 2 m × 1 m, 2 m × 2 m, 4 m × 2 m, and 4 m × 4 m were taken for the simulations, and the calculated results are shown in Figure 3. The variation in the ultimate bearing capacity and displacement showed that the calculated results were close when the model size was 4 m × 2 m and 4 m × 4 m. The model of 4 m × 2 m was chosen for the simulation.
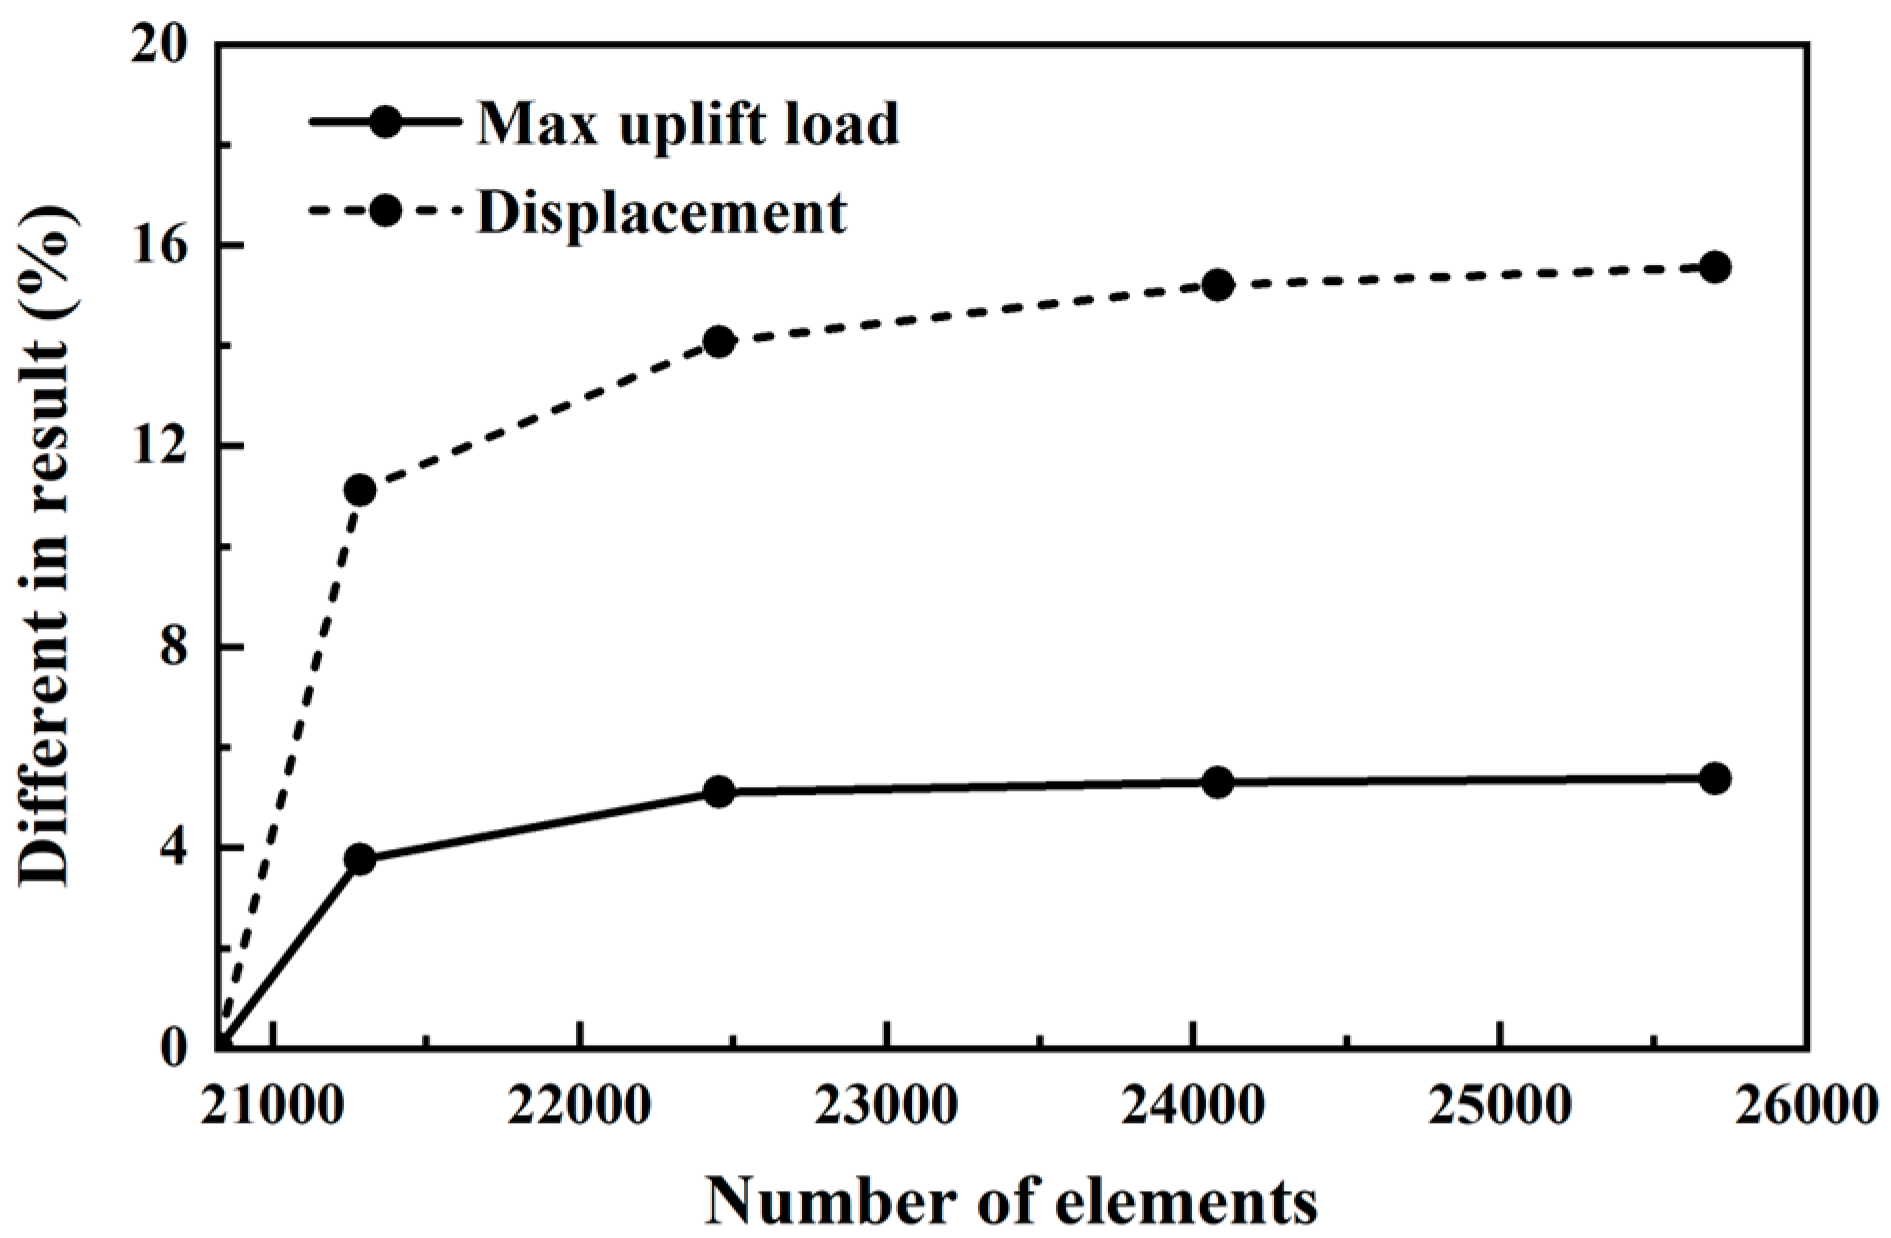
The mesh was divided into 6-node triangular cells, and the degree of mesh refinement was inversely proportional to the distance from the pile. A mesh sensitivity analysis was carried out to reduce the effect of meshing on the simulation results while ensuring computational efficiency. The results of the calculations are shown in Figure 4. The slope of the calculated deviation in the uplift ultimate bearing capacity and displacement decreased after the number of elements increased to 24,000, and the improvement of the calculation accuracy no longer had a large impact on the simulation results. The number of elements at this point was taken for the simulation.

2.3. The FEM Verification

The loading procedure for the uplift test followed the quick maintained-loaded test method as specified in standard ASTM-D3689. The uplift force on the pile head was provided by means of a hydraulic jack with a reaction beam. The cribbing supporting the weighted platform was 1.5 m away from the test pile. Two boards were placed under the cribbing to provide sufficient bearing area to prevent adverse settlement of the weighted platform. Four linear variable differential transformers were used to measure the displacement at the pile head and make sure the pile cap was leveled during the test. To obtain a complete non-linear load–displacement relationship in the tension tests, the piles were planned to be pushed beyond the designed uplift capacity until the displacement reached 40 mm.
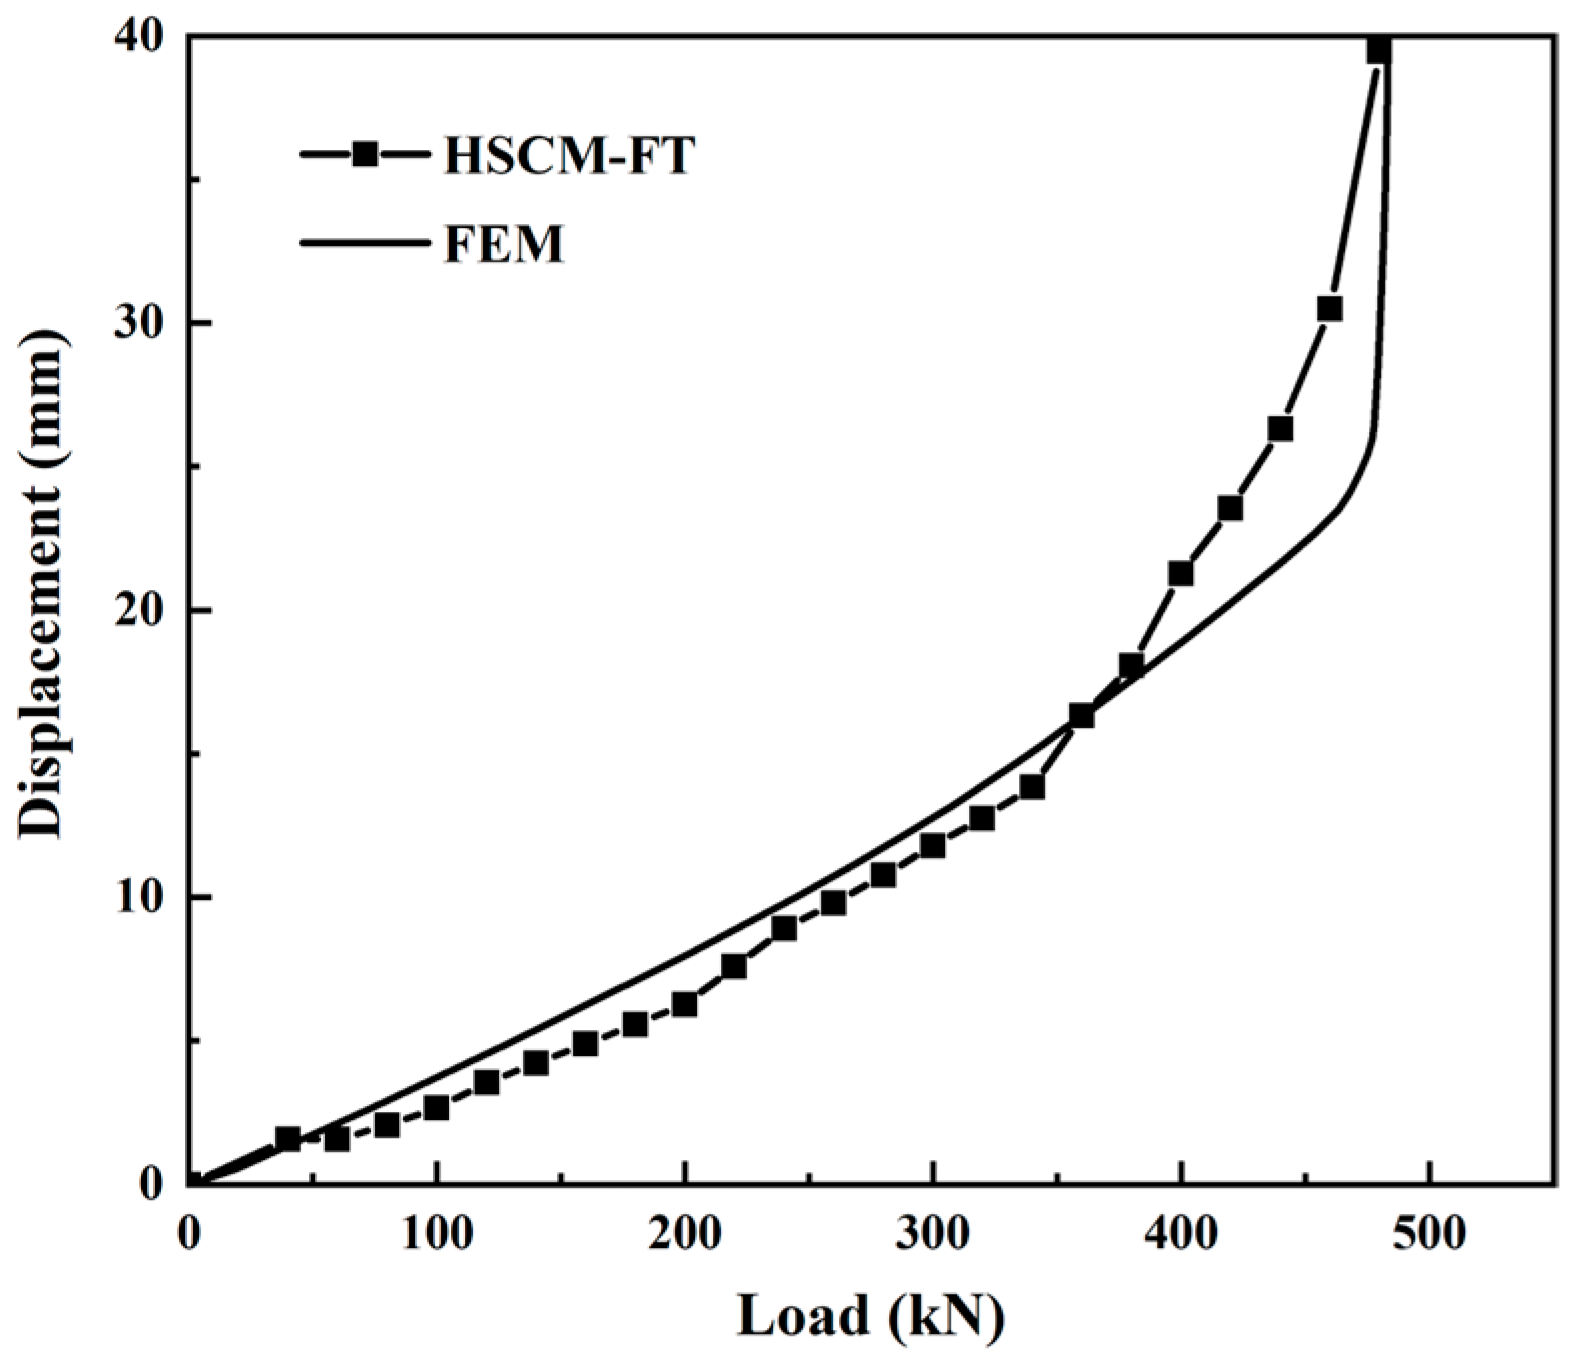
The load–displacement curves obtained by simulating the test piles and comparing them with HSCM-FT are shown in Figure 5. The simulation results showed that the load–displacement curves developed through three stages: linear, elastic–plastic, and failure. The uplift ultimate bearing capacities of HSCM-FT and FEM were judged by the inflection point method and were 460 kN and 479 kN, respectively, with an ultimate bearing capacity deviation of 4.13%. The displacements S were 30.5 mm and 25.8 mm. The above results showed that the numerical model could better simulate the actual deformation of HSCM piles in marine soft soils under the uplift load.

2.4. Numerical Simulation Schemes

This study designed two groups of numerical simulations, with six piles in each group, for a total of 12 piles, with the detailed parameters shown in Table 3. The tests were designed to simulate the uplift of HSCM piles and SDCM piles under different strength ratios ( C r e f / s u ) to investigate the influence of the relationship between the strength of the soil–cement and the strength of the soil on the bearing characteristics and failure modes of HSCM piles. In addition, the model in the calculation scheme would instead be simulated with a single layer of soil, using a second layer of clay as the base, thus reducing the impact of differences between soil layers on the simulation results.

3. Results and Discussion

3.1. Load–Settlement Curves

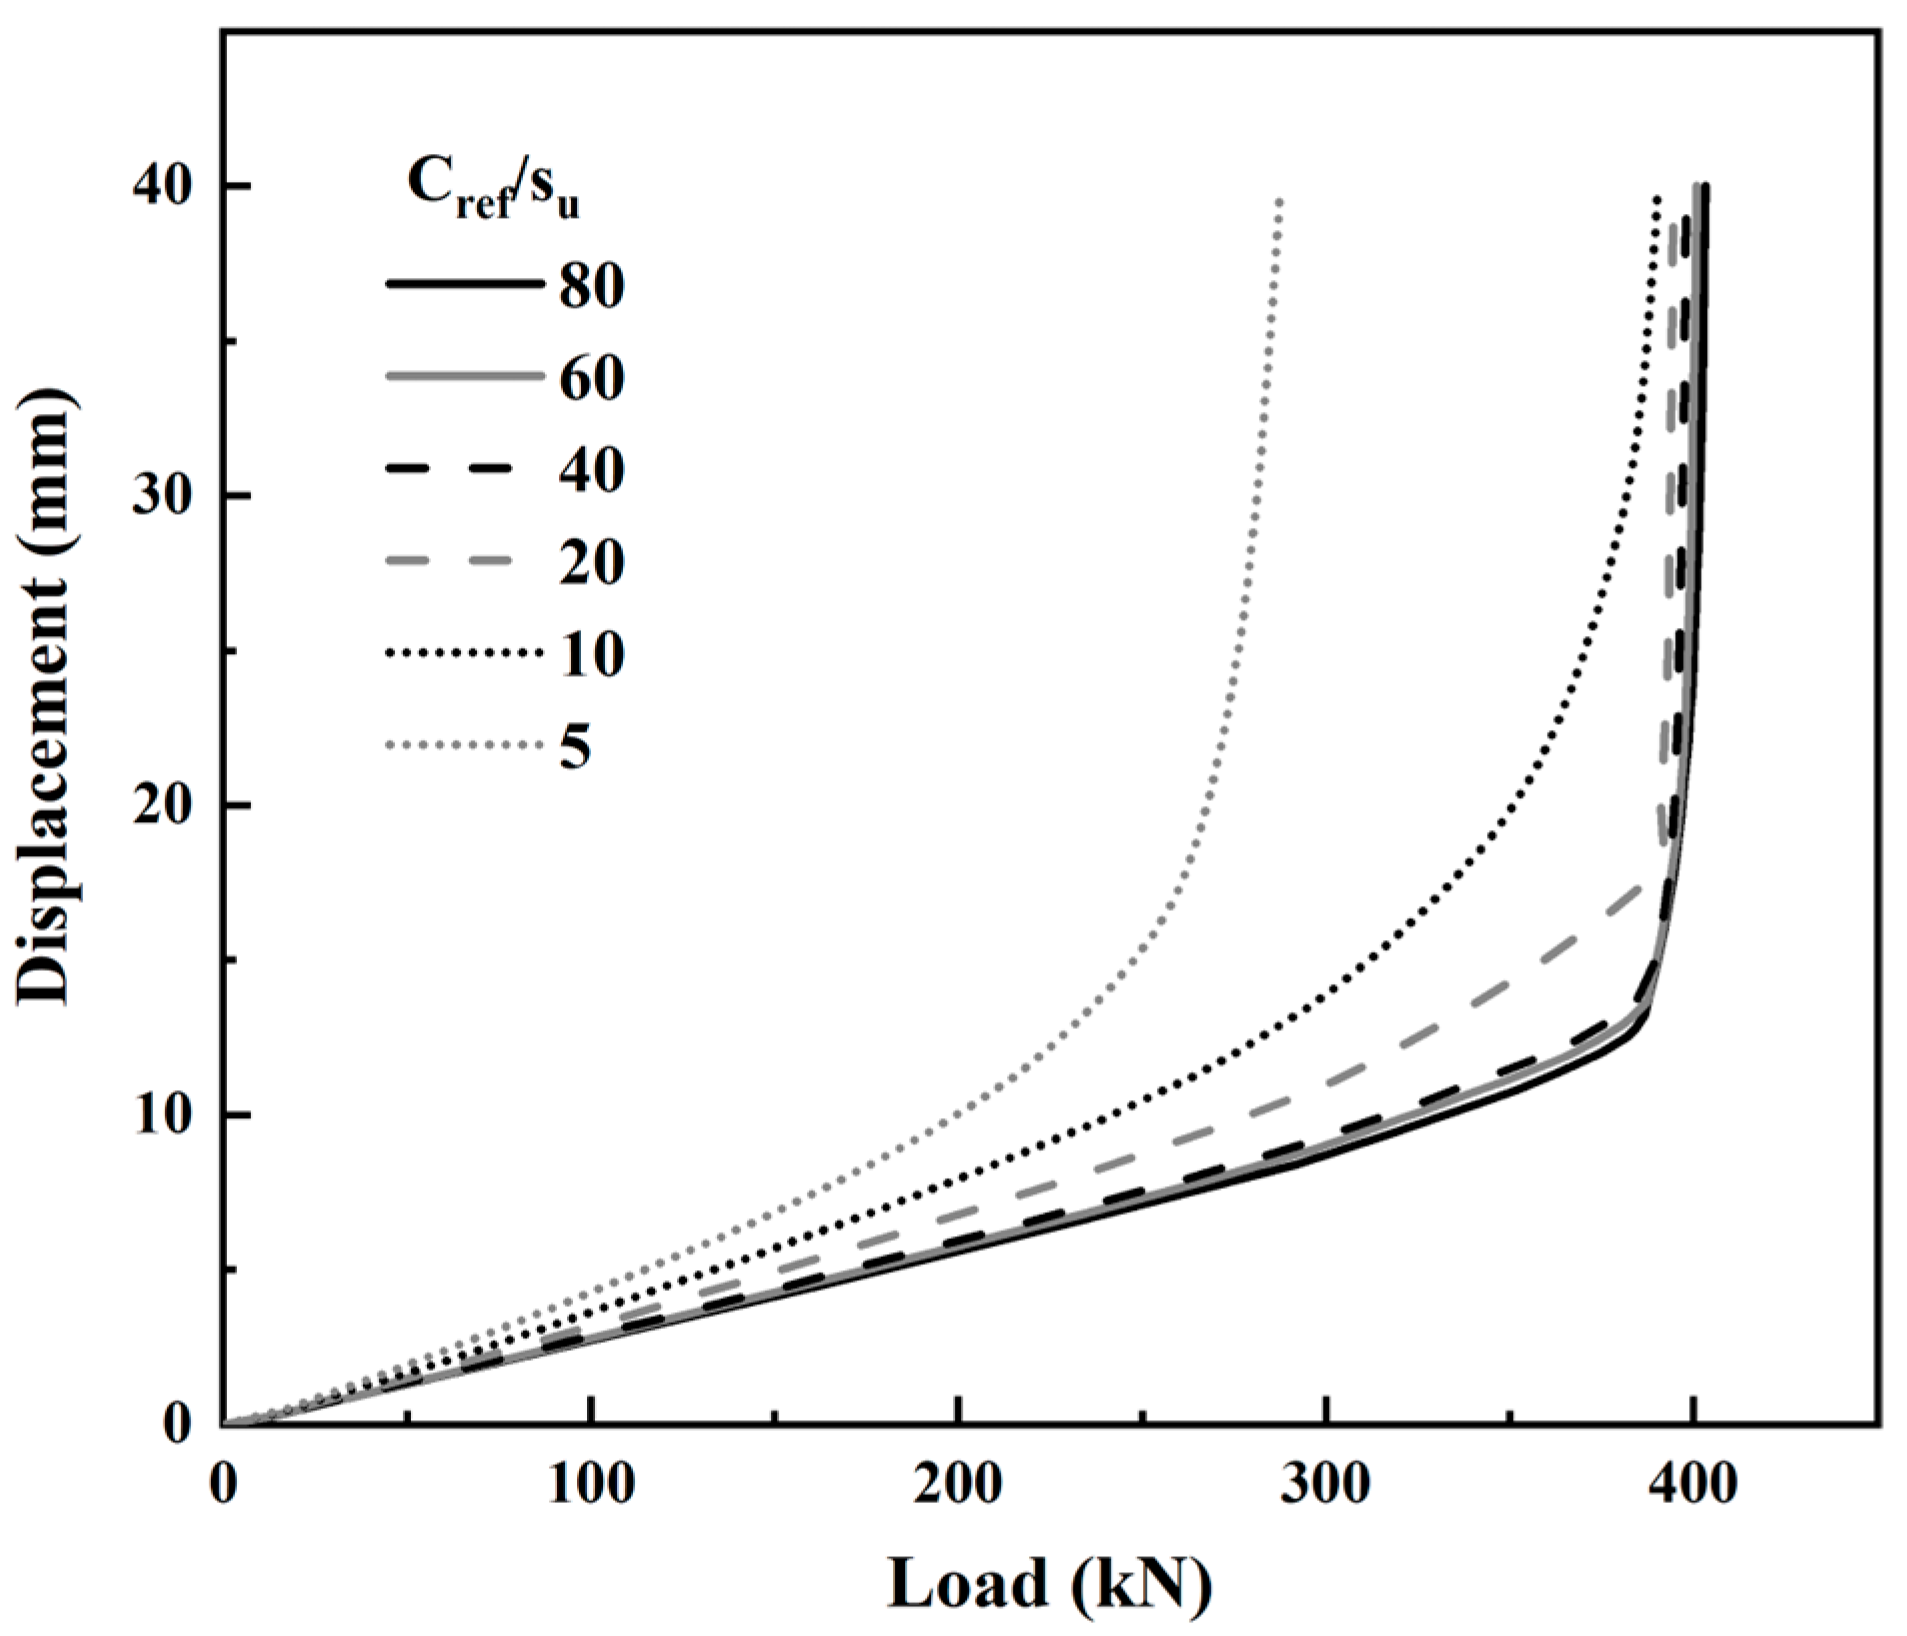
Figure 6 shows the load–displacement curves of the HSCM-1-1 under uplift loading for different C r e f / s u conditions. When C r e f / s u = 20, 40, 60, 80, the curve inflection point was evident, and it was appropriate to use the inflection point method to determine the ultimate bearing capacity, which was 386.5 kN, 386.4 kN, 387.7 kN, and 388.7 kN with displacements of 17.86 mm, 14.34 mm, 13.50 mm, 12.84 mm, respectively. When C r e f / s u = 5, 10, the curve had no obvious inflection point, which was determined by the double tangent method [23]; the uplift ultimate bearing capacity was 179 N and 260 N; the displacement was 8.67 mm and 11.07 mm, respectively. The above results showed that the soil–cement strength could affect the uplift ultimate bearing capacity of the HSCM pile. The uplift ultimate bearing capacity P 1 1 of HSCM-1-1 increased with the soil–cement strength and remained constant after reaching a certain peak.
The load–displacement curve of SDCM-1-2 is shown in Figure 7. When C r e f / s u = 5, 10, 20, 40, 60, and 80, the curve inflection point was relatively obvious, and the inflection point method was used to determine the ultimate load-bearing capacity, which was 72 kN, 138.6 kN, 273 kN, 382.8 kN, 386 kN, and 385 kN, respectively, and the displacement was 12.3 mm, 14.4 mm, 18.57 mm, 18.77 mm 16.78 mm, and 15.10 mm. The above results showed that the strength of the soil–cement affects the uplift ultimate bearing capacity of SDCM piles. The uplift ultimate bearing capacity P 1 2 of SDCM-1-2 increased with the soil–cement strength and remained constant after reaching a certain peak, similar to the variation law of the uplift ultimate bearing capacity of HSCM-1-1.
When C r e f / s u = 80, P 1 1 and P 1 2 were very close to each other with 386 N and 385 N, respectively, but the initial stiffness of SDCM-1-2 was less than HSCM-1-1. As C r e f / s u reduced, the uplift ultimate bearing capacity P u l t of the pile started to decrease, and P 1 2 decreased to a greater extent than P 1 1 , indicating that the failure mode of HSCM-1-1 and SDCM-1-2 had changed, thus causing the difference in the uplift ultimate bearing capacity.

3.2. Pile Failure Mode

To further analyze the failure mode of HSCM piles under uplift loading, the deformation calculation results of HSCM-1-1 and SDCM-1-2 were extracted, as shown in Figure 8a,b. When C r e f / s u = 80, the deformation of HSCM-1-1 and SDCM-1-2 was cylindrical, the relative slip of the soil–cement column and soil interface occurred, and the failure mode was both pile and soil interface failure. As D s c was equal for both piles, the model had the same pile and soil contact area, and therefore, P 1 1 was approximated by P 1 2 . When C r e f / s u was reduced from 80 to 20, the deformation of HSCM-1-1 increased, but the failure mode was still a pile and soil interface failure. Meanwhile, the steel pipe and soil–cement interface of SDCM-1-2 produced cohesive slip, and the failure mode changed from pile and soil interface failure to steel pipe and soil–cement interface failure. The failure mode of the HSCM-1-1 was transformed when C r e f / s u = 10 . The cohesive slip between the steel pipe and soil–cement occurred at the location of the larger helix spacing, resulting in an individual helix bearing failure. In comparison, the pile and soil interface failure still occurred at the location of the smaller helix spacing. When C r e f / s u = 5 , furthermore, the steel pipe and soil–cement interface failure occurred around the steel pipe but remained a pile and soil interface failure in the dense area of the helix plate. The above results showed that different soil–cement strengths changed in the failure mode of the HSCM pile. Pile and soil interface failure occurred when the cohesive force q u at the interface of the steel pipe and soil–cement exceeded the skin resistance f s of the pile, and steel pipe and soil–cement interface failure occurred when q u < f s . The presence of helix plates improved the q u of the steel pipe and soil–cement interface. According to Wonglert’s [2] research, the failure mode of the SDCM piles changed with different cement soil strengths. Pile soil damage occurred at higher cement soil strengths, and as the soil–cement strength decreased, damage occurred at the end of the pile core. The results of this study reached similar conclusions, but the failure interface only occurred at the position without helix plates during the lower soil–cement strength, which was due to the helical plates enhancing the interaction between the pile core and the soil–cement.

3.3. Patterns of Variation in Ultimate Bearing Capacity

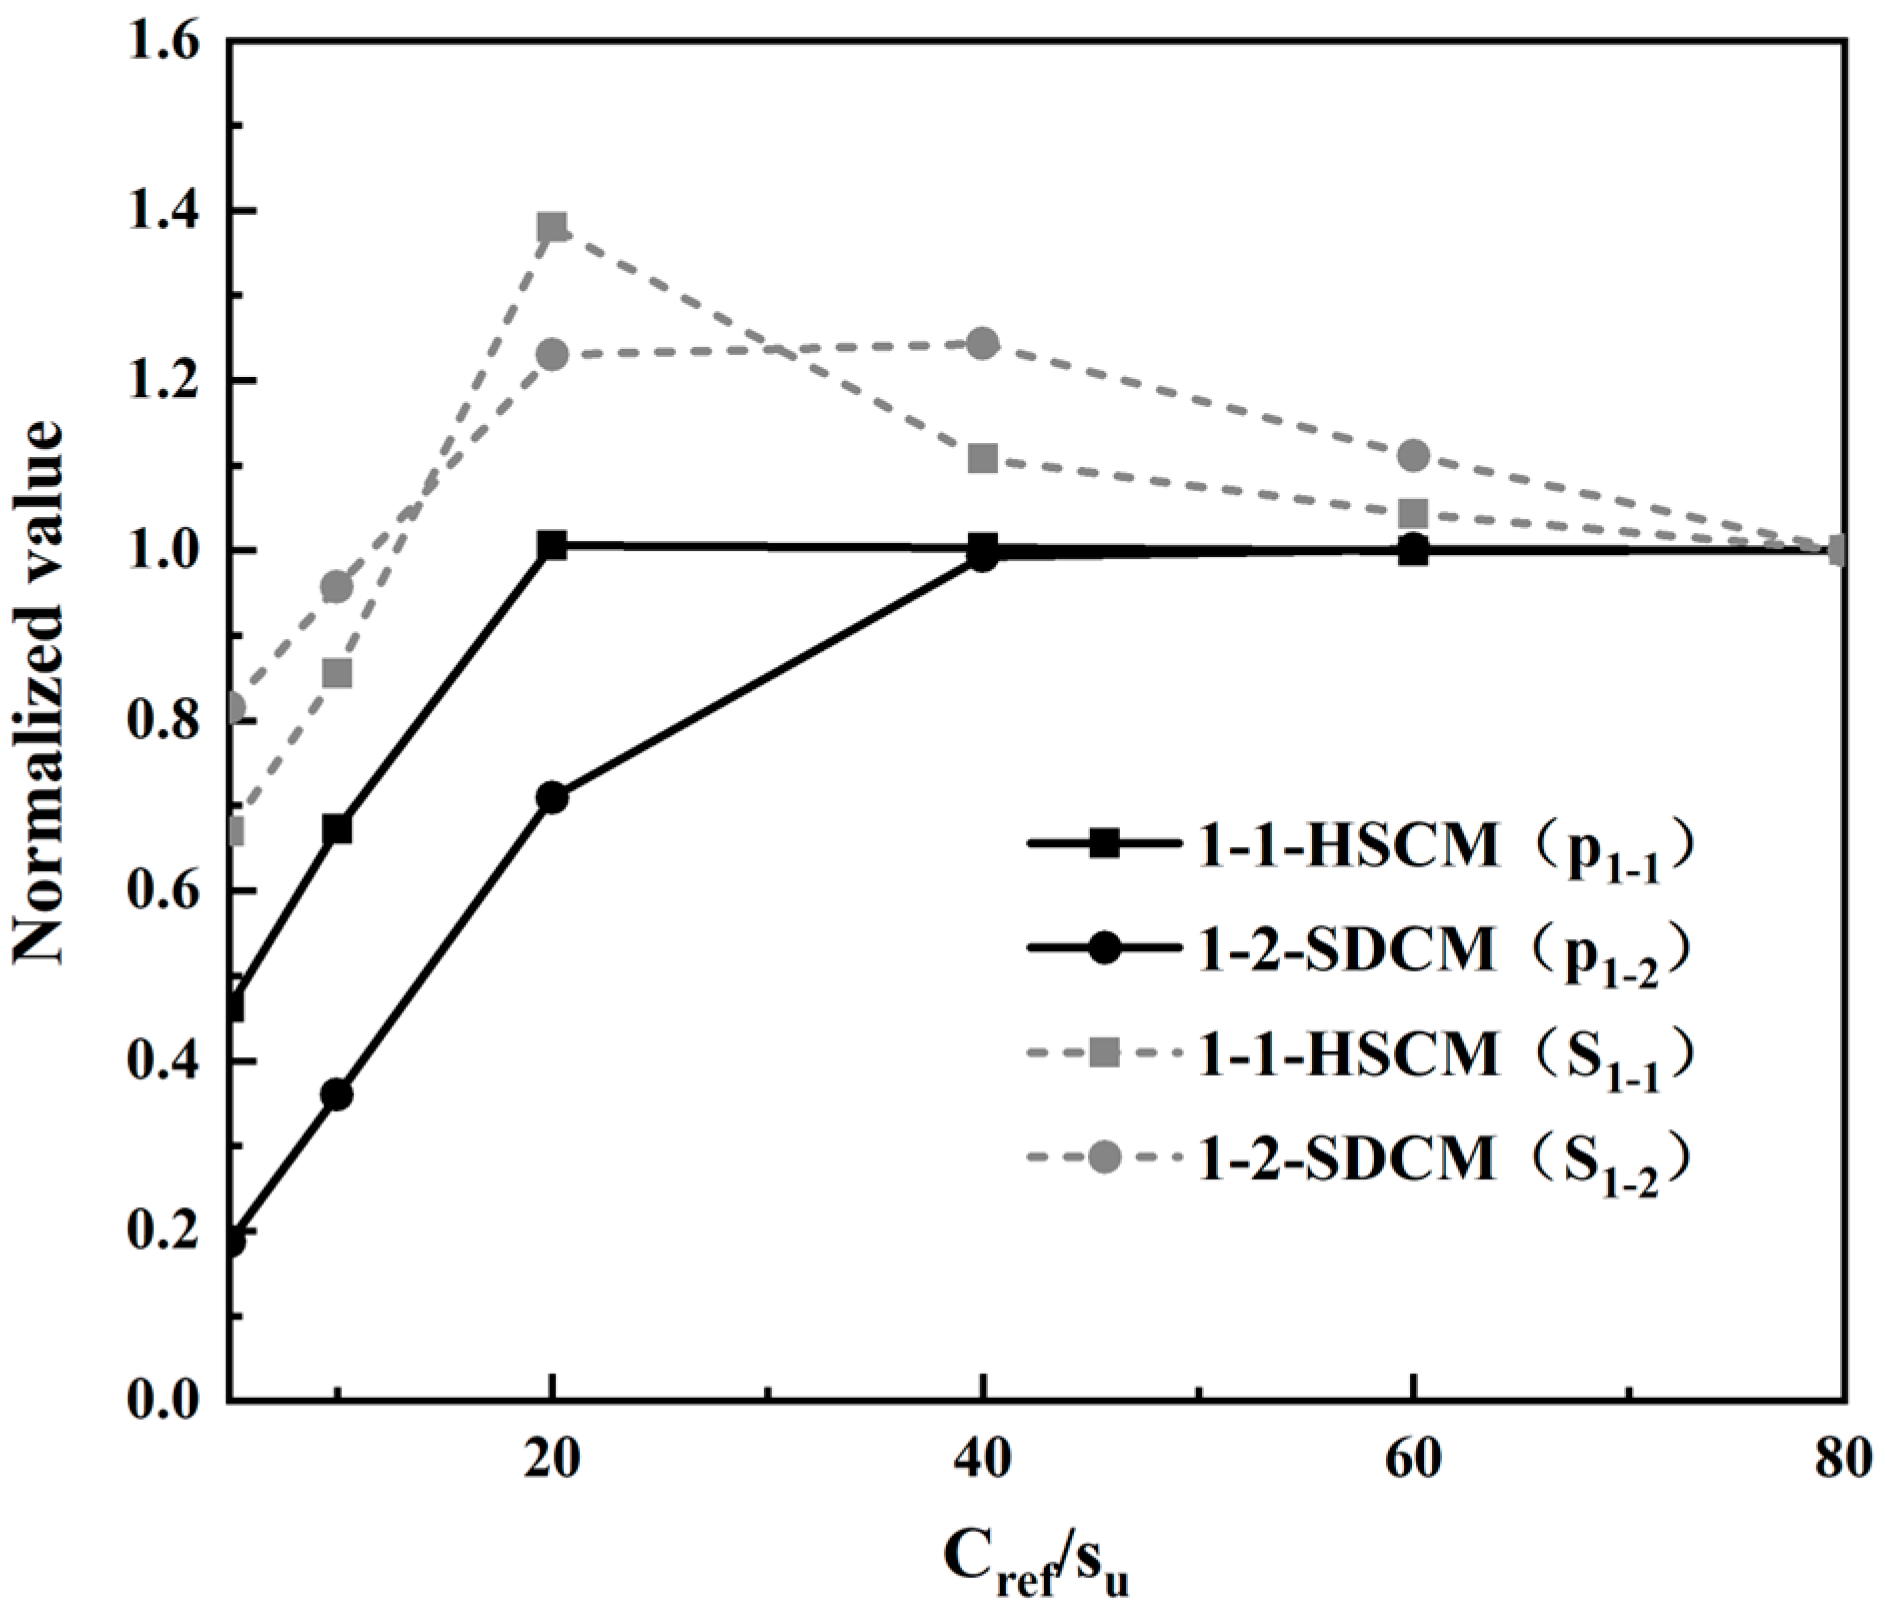
The ultimate bearing capacity and displacement of the two piles at C r e f / s u = 80 were used as the references, and all data were normalized to analyze the variation pattern between the load–displacement curves and failure modes of the two sets of tests. The standardized curves are shown in Figure 9. The curve of HSCM-1-1 showed that P 1 1 = 1.0 and displacement S 1 1 > 1.0 when C r e f / s u   40 , 80 . S 1 1 increased with the reduction in C r e f / s u , and the slope remained constant. The above results indicated that the reduction in the cement strength in this interval would not alter the pile failure mode but reduced the modulus of elasticity of the pile foundation, thus decreasing the stiffness. When C r e f / s u     20 , 40 , P 1 1 remained constant, but the slope of S 1 1 increased, indicating that the pile and soil interface failure mode was approaching the limit and the pile foundation failure mode was about to be transformed. When C r e f / s u     5 , 20 , P 1 1 < 1.0 and decreased with the soil–cement strength, and S 1 1 also showed a decreased trend, indicating that the HSCM pile failure mode had gradually changed from pile and soil interface failure to steel pipe and soil–cement interface failure.
From the curves of SDCM-1-2, P 1 2 = 1.0 and displacement S 1 2 > 1.0 when C r e f / s u     40 , 80 . S 1 2 gradually increased with the reduction in C r e f / s u , the SDCM pile exhibited pile and soil interface failure in this interval, but the slope of S 1 2 was larger compared to S 1 1 , indicating that the SDCM-1-2 stiffness decreased more rapidly. When C r e f / s u     20 , 40 , P 1 2 began to decrease and S 1 2 remained essentially constant. The above results indicated that C r e f / s u caused a gradual shift from the pile and soil interface failure to steel pipe and soil–cement interface failure in this range. 1-1-SDCM showed a higher soil–cement strength when the failure mode shift occurred compared to HSCM-1-1 and was more susceptible to steel pipe and soil–cement interface failure. When C r e f / s u     5 , 20 , the curve slopes of P 1 2 and S 1 2 were further increased, and steel pipe and soil–cement interface failure occurred in the 1-1-SDCM.
The linear fitting function of the normalized curve was established based on the simulation results to express the ultimate bearing capacity variation law of the HSCM-1-1 more intuitively. When C r e f / s u     20 , 80 , the fit function was y = 1 . When C r e f / s u 5 , 20 , the fit function was y = 0.036 x + 0.03 .

3.4. Theoretical Calculation of the Ultimate Bearing Capacity

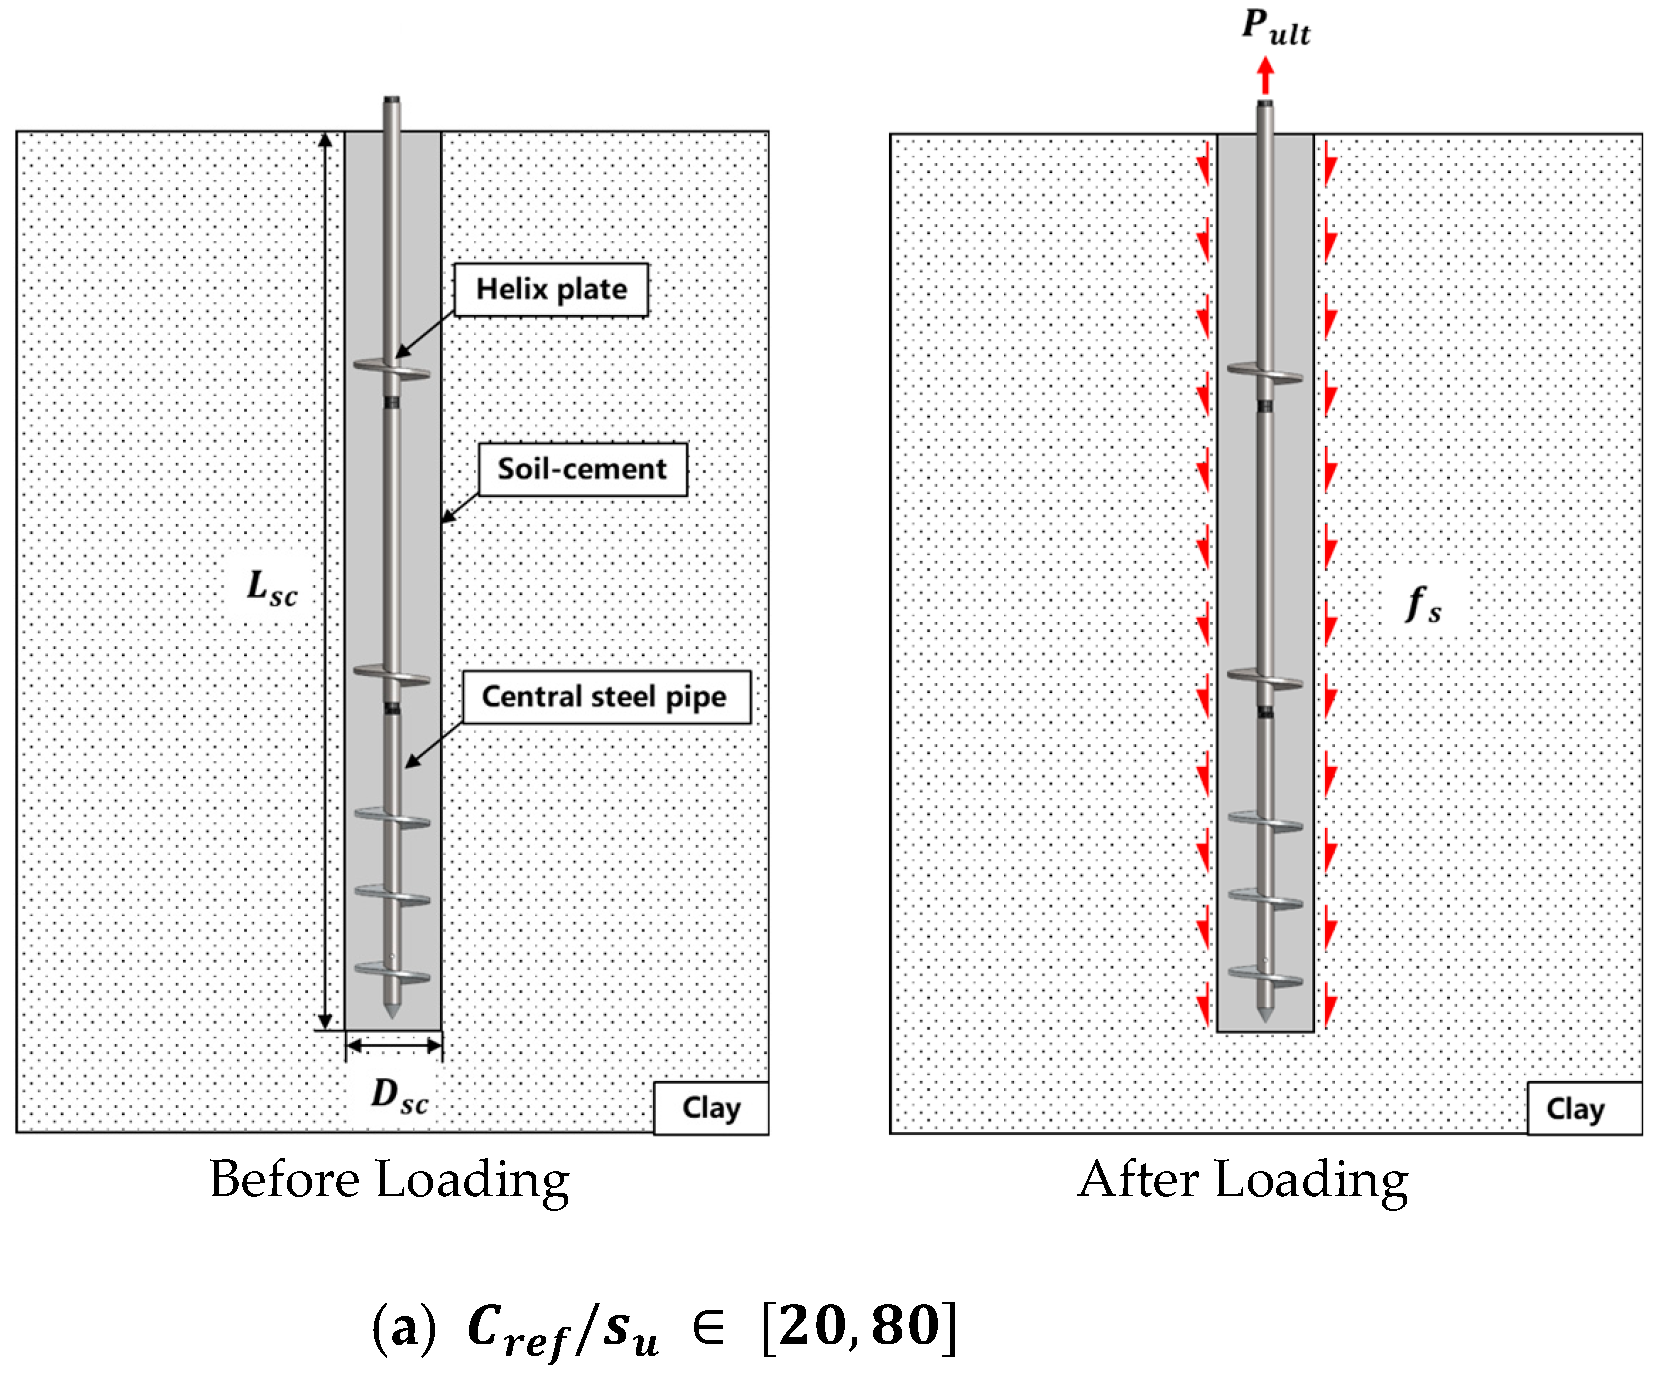
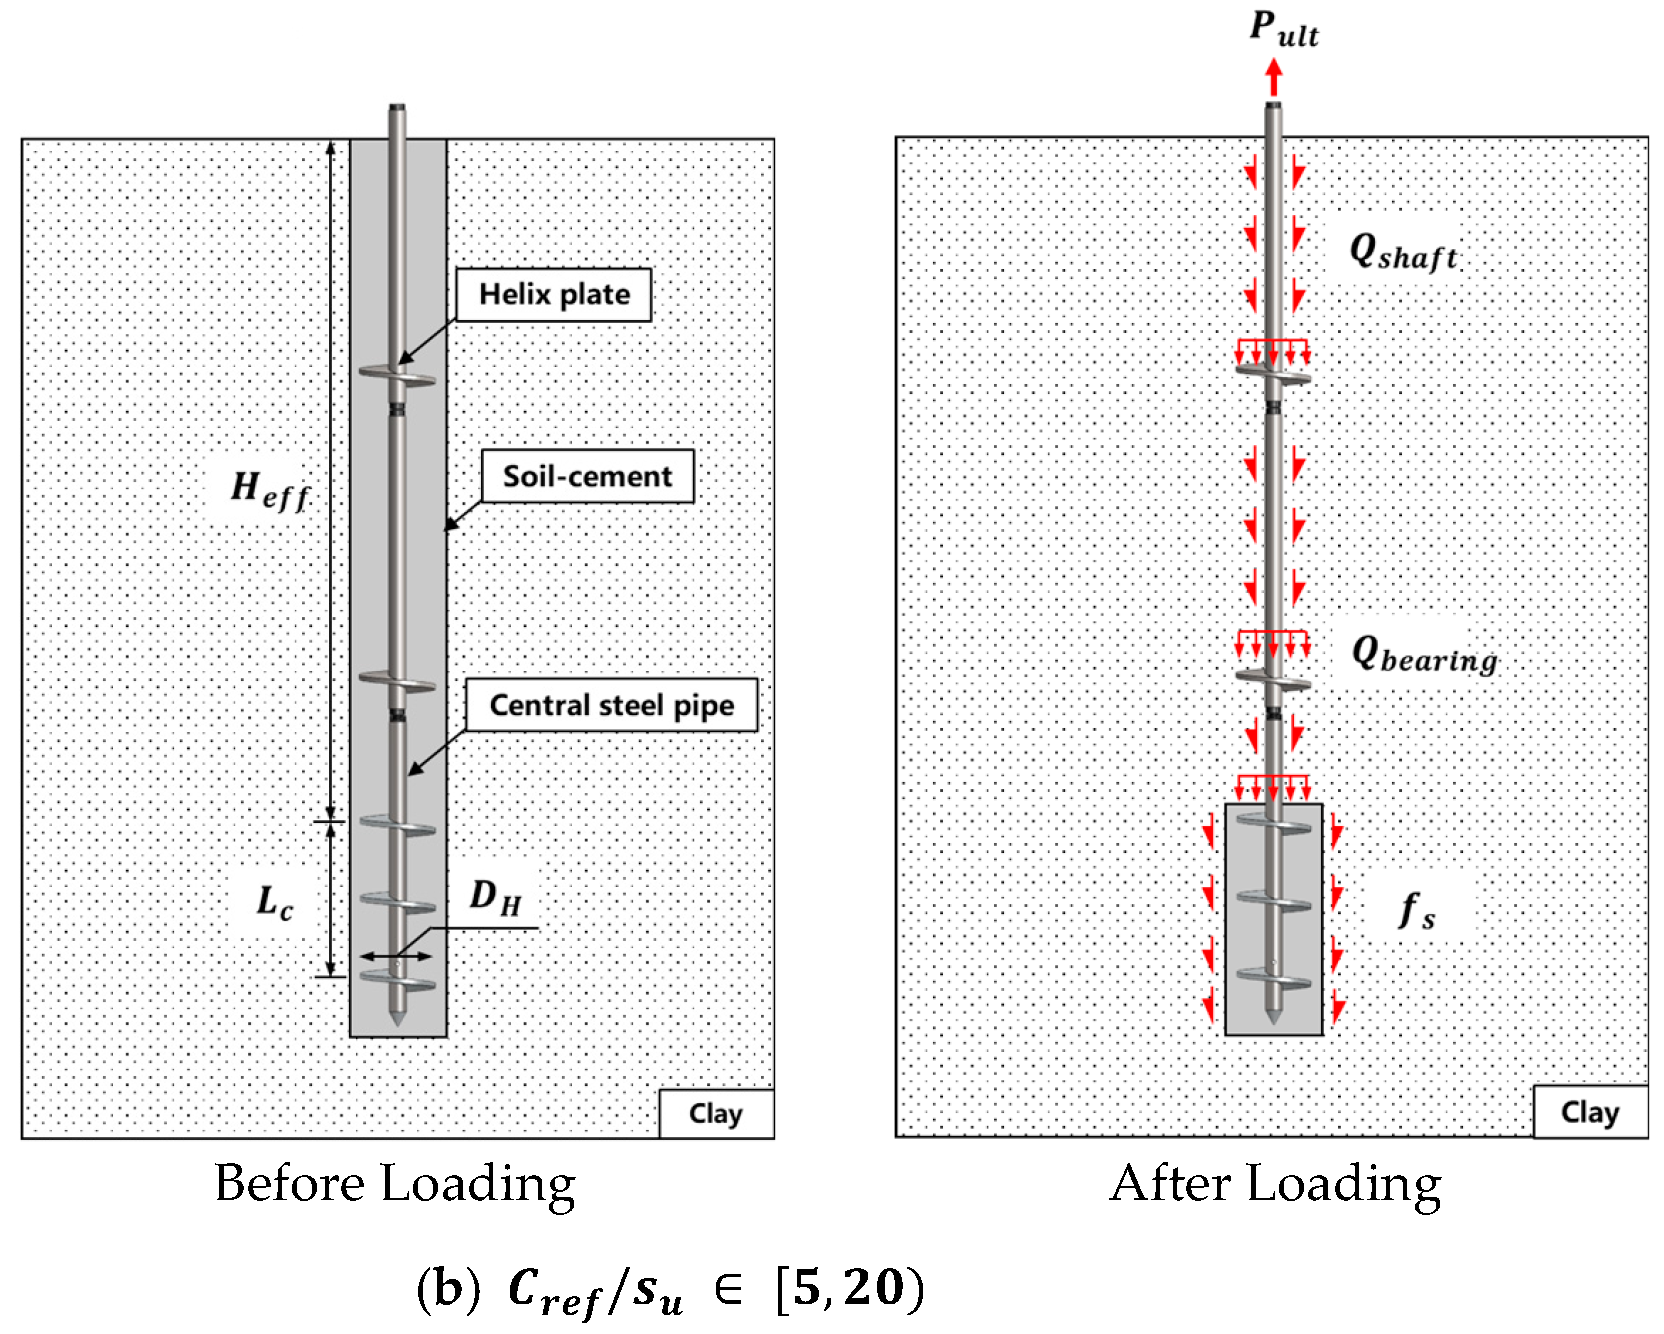
The theoretical calculations were verified by comparison with the simulation results in this study to provide the corresponding calculation formulae for the design method of HSCM piles. As variations in the strength of the soil–cement affect the failure mode of HSCM piles, the formulae for calculating the uplift capacity under different conditions should be considered. The uplift bearing capacity of the HSCM pile was mainly generated by the pile and soil interaction when C r e f / s u     20 , 80 , similar to the SDCM pile, as shown in Figure 10a. The failure mode of the HSCM pile gradually changed from pile and soil interface failure to steel pipe and soil–cement interface failure when C r e f / s u   5 , 20 . The calculation of the uplift bearing capacity was essentially the problem of the interaction between the helical pile, the soil–cement column, and the soil around the pile, as shown in Figure 10b.
The uplift bearing capacity of the HSCM pile was mainly composed of f s and the self-weight of the pile W p i l e when C r e f / s u     20 , 80 . The uplift bearing capacity of the HSCM pile consisted of the end-bearing force Q b e a r i n g of the helix plate, the skin resistance Q s h a f t of the steel pipe, and the skin resistance f s of the local soil–cement column when C r e f / s u     5 , 20 . The calculation of the uplift bearing capacity for different failure modes is shown in Equations (1)–(4). The adhesion coefficient α of the interface could be taken as 1.05 when calculating the skin resistance between the soil–cement and the clay, but the adhesion coefficient between each interface in different failure modes should also be considered. Combined with the segmentation function of the HSCM-1-1 normalization curve, the adhesion coefficient could be extrapolated as shown in Equation (5). When C r e f / s u     5 , 20 , a correction value related to the soil–cement strength should be added to the calculation model in Figure 10b, as shown in Equation (6), as the failure of the contact surface between the steel pipe and the soil–cement was gradual.
Q u = f s + W p i l e ,     C r e f s u 20 , 80 Q b e a r i n g + Q s h a f t + f s + δ ,     C r e f s u 5 , 20
f s = π α D s c L s c s u
Q b e a r i n g = N u A H s u
Q s h a f t = π α d H e f f s u
α = 1.05 ,     C r e f s u 20 , 80 0.036 × C r e f s u + 0.03 ,     C r e f s u 5 , 20
δ = 13.68 × C r e f s u 65 ,     C r e f s u 5 , 20
where Q u is the calculated value of the uplift ultimate bearing capacity, kN; α is the adhesion coefficient; L s c is the soil–cement column length, m; D s c is the soil–cement column diameter, m; N u is the uplift bearing capacity coefficient, taken as 9 in this study; D H is the helix plate diameter, m; H e f f is the effective length, m; δ is the correction value related to the soil–cement strength.
The comparison of the theoretical bearing capacity of the HSCM pile obtained by the formula and the simulation results is shown in Figure 11. The deviations between the calculated values of the uplift capacity of HSCM piles and the simulation results were in the range of 2% to 4%, providing a basis for the design method of HSCM piles.

4. Conclusions

This paper investigated the uplift bearing characteristics of HSCM piles in marine soft clay by numerical simulation methods based on the existing relevant tests. The reliability of the FEM was verified using Plaxis 3D, and the influence of the soil–cement strength and soil strength on the uplift bearing characteristics and failure mode of HSCM piles was analyzed. The main conclusions were as follows:
(1) The ratio of soil–cement strength to soil strength ( C r e f / s u ) affected the uplift bearing characteristics of HSCM piles. The uplift bearing capacity increased with the C r e f / s u and remained constant after reaching a specific peak.
(2) HSCM piles had different failure modes under uplift loading, which were influenced by C r e f / s u . At C r e f / s u     40 , 80 , the pile–soil interface of the FEM was damaged. At C r e f / s u     5 , 20 , the soil–cement strength was insufficient, which led to damage of the steel pipe and soil–cement interface of the FEM.
(3) The results of the finite element analysis were combined to propose a formula for calculating the uplift ultimate bearing capacity of HSCM piles in marine soft clay, which provides a reference for the design of HSCM piles.
The current research only analyzed limited design parameters and documented their relationship with the uplift bearing characteristics of HSCM piles. More parameters (including helix arrangement, helix number, and soil–cement diameter) should be analyzed subsequently to establish a complete mechanical model for predicting HSCM pile mechanical performance and inverse parameter optimization.

Author Contributions

Conceptualization, X.Z. and Y.H.; methodology, X.Z.; software, X.Z.; validation, X.Z., Z.Z., Y.H. and C.W.; formal analysis, X.Z.; investigation, Y.H.; resources, Z.Z.; data curation, X.Z. and Y.H.; writing—original draft, X.Z.; writing—review and editing, Z.Z., Y.H., C.W. and X.L.; visualization, X.Z. and Y.H.; supervision, Z.Z. and X.L.; project administration, Z.Z.; funding acquisition, Z.Z. and X.L. All authors have read and agreed to the published version of the manuscript.

Funding

This research was funded by Jiangsu Province Key Research and Development Program, grant number BE2021681.

Data Availability Statement

All data, models, or codes that support the findings of this study are available from the corre-sponding author upon reasonable request.

Acknowledgments

In particular, the authors would like to express their appreciation to friends and colleagues who helped in the lab tests. The authors would like to acknowledge the funding support provided by the State Grid Corporation of China.

Conflicts of Interest

The authors declare no conflict of interest.

References

  1. Zhu, S.; Chen, C.; Cai, H.; Mao, F. Analytical modeling for the load-transfer behavior of stiffened deep cement mixing (SDCM) pile with rigid cap in layer soils. Comput. Geotech. 2022, 144, 104618. [Google Scholar] [CrossRef]
  2. Wonglert, A.; Jongpradist, P.; Jamsawang, P.; Larsson, S. Bearing capacity and failure behaviors of floating stiffened deep cement mixing columns under axial load. Soils Found. 2018, 58, 446–461. [Google Scholar] [CrossRef]
  3. Voottipruex, P.; Bergado, D.; Suksawat, T.; Jamsawang, P.; Cheang, W. Behavior and simulation of deep cement mixing (DCM) and stiffened deep cement mixing (SDCM) piles under full scale loading. Soils Found. 2011, 51, 307–320. [Google Scholar] [CrossRef] [Green Version]
  4. Mansour, M.A.; El Naggar, M.H. Optimization of grouting method and axial performance of pressure grouted helical piles. Can. Geotech. J. 2021, 59, 702–714. [Google Scholar] [CrossRef]
  5. Zhou, J.-J.; Wang, K.-H.; Gong, X.-N.; Zhang, R.-H. Bearing capacity and load transfer mechanism of a static drill rooted nodular pile in soft soil areas. J. Zhejiang Univ. Sci. A 2013, 14, 705–719. [Google Scholar] [CrossRef] [Green Version]
  6. Vickars, R.A.; Clemence, S.P. Performance of helical piles with grouted shafts. In New Technological and Design Developments in Deep Foundations; Dennis, N.D.J., Castelli, R., O’Neill, M.W., Eds.; American Society of Civil Engineers: Reston, VA, USA, 2000; pp. 327–341. [Google Scholar]
  7. Khazaei, J.; Eslami, A. Postgrouted helical piles behavior through physical modeling by FCV. Mar. Georesources Geotechnol. 2017, 35, 528–537. [Google Scholar] [CrossRef]
  8. Mansour, M.A. Performance of Pressure Grouted Helical Piles Under Monotonic Axial and Lateral Loading. Ph.D. Thesis, The University of Western Ontario, London, ON, Canada, 2019. [Google Scholar]
  9. Shariat, M.; Shariati, M.; Madadi, A.; Wakil, K. Computational Lagrangian Multiplier Method by using for optimization and sensitivity analysis of rectangular reinforced concrete beams. Steel Compos. Struct. 2018, 29, 243–256. [Google Scholar]
  10. Nabizadeh, F.; Choobbasti, A.J. Field study of capacity helical piles in sand and silty clay. Transp. Infrastruct. Geotechnol. 2017, 4, 3–17. [Google Scholar] [CrossRef]
  11. Nabizadeh, F.; Choobbasti, A.J. The performance of grouted and un-grouted helical piles in sand. Int. J. Geotech. Eng. 2017, 13, 516–524. [Google Scholar] [CrossRef]
  12. Zhuang, X.; Zong, Z.; Huang, Y.; Wang, P. Analysis of the installation effect on the axial performance of pressure-grouted helical piles in clay by small-scale model tests. Buildings 2022, 12, 992. [Google Scholar] [CrossRef]
  13. Srijaroen, C.; Hoy, M.; Horpibulsuk, S.; Rachan, R.; Arulrajah, A. soil–cement screw pile: Alternative pile for low- and medium-rise buildings in soft Bangkok clay. J. Constr. Eng. Manag. 2021, 147, 04020173. [Google Scholar] [CrossRef]
  14. Madadi, A.; Eskandari-Naddaf, H.; Gharouni-Nik, M. Lightweight ferrocement matrix compressive behavior: Experiments versus finite element analysis. Arab. J. Sci. Eng. 2017, 42, 4001–4013. [Google Scholar] [CrossRef]
  15. Madadi, A.; Tasdighi, M.; Eskandari-Naddaf, H. Structural response of ferrocement panels incorporating lightweight expanded clay and perlite aggregates: Experimental, theoretical and statistical analysis. Eng. Struct. 2019, 188, 382–393. [Google Scholar] [CrossRef]
  16. Dong, P.; Qin, R.; Chen, Z. Bearing capacity and settlement of concrete-cored DCM pile in soft ground. Geotech. Geol. Eng. 2004, 22, 105–119. [Google Scholar] [CrossRef]
  17. Mohajerani, A.; Bosnjak, D.; Bromwich, D. Analysis and design methods of screw piles: A review. Soils Found. 2016, 56, 115–128. [Google Scholar] [CrossRef] [Green Version]
  18. Spagnoli, G.; de Hollanda Cavalcanti Tsuha, C. A review on the behavior of helical piles as a potential offshore foundation system. Mar. Georesour. Geotechnol. 2020, 38, 1013–1036. [Google Scholar] [CrossRef]
  19. Bagheri, F.; El Naggar, M. Effects of installation disturbance on behavior of multi-helix piles in structured clays. DFI J.-J. Deep. Found. Inst. 2015, 9, 80–91. [Google Scholar] [CrossRef]
  20. Lutenegger, A.J. Cylindrical shear or plate bearing?—Uplift behavior of multi-helix screw anchors in clay. In Contemporary Topics in Deep Foundations; American Society of Civil Engineers: Reston, VA, USA, 2009; pp. 456–463. [Google Scholar]
  21. Huang, Y.; Zhuang, X.; Wang, P.; Zong, Z. Axial behavior of pressure grouted helical piles installed in marine soft clay based on full-scale field tests. Geotech. Geol. Eng. 2022, 40, 5799–5812. [Google Scholar] [CrossRef]
  22. Zhou, J.; Yu, J.; Gong, X.; El Naggar, M.H.; Zhang, R. The effect of cemented soil strength on the frictional capacity of precast concrete pile–cemented soil interface. Acta Geotech. 2020, 15, 3271–3282. [Google Scholar] [CrossRef]
  23. Wu, D.; Liu, H.-L.; Kong, G.-Q.; Ng, C.W.W.; Cheng, X.-H. Displacement response of an energy pile in saturated clay. Proc. Inst. Civ. Eng.-Geotech. Eng. 2018, 171, 285–294. [Google Scholar] [CrossRef]
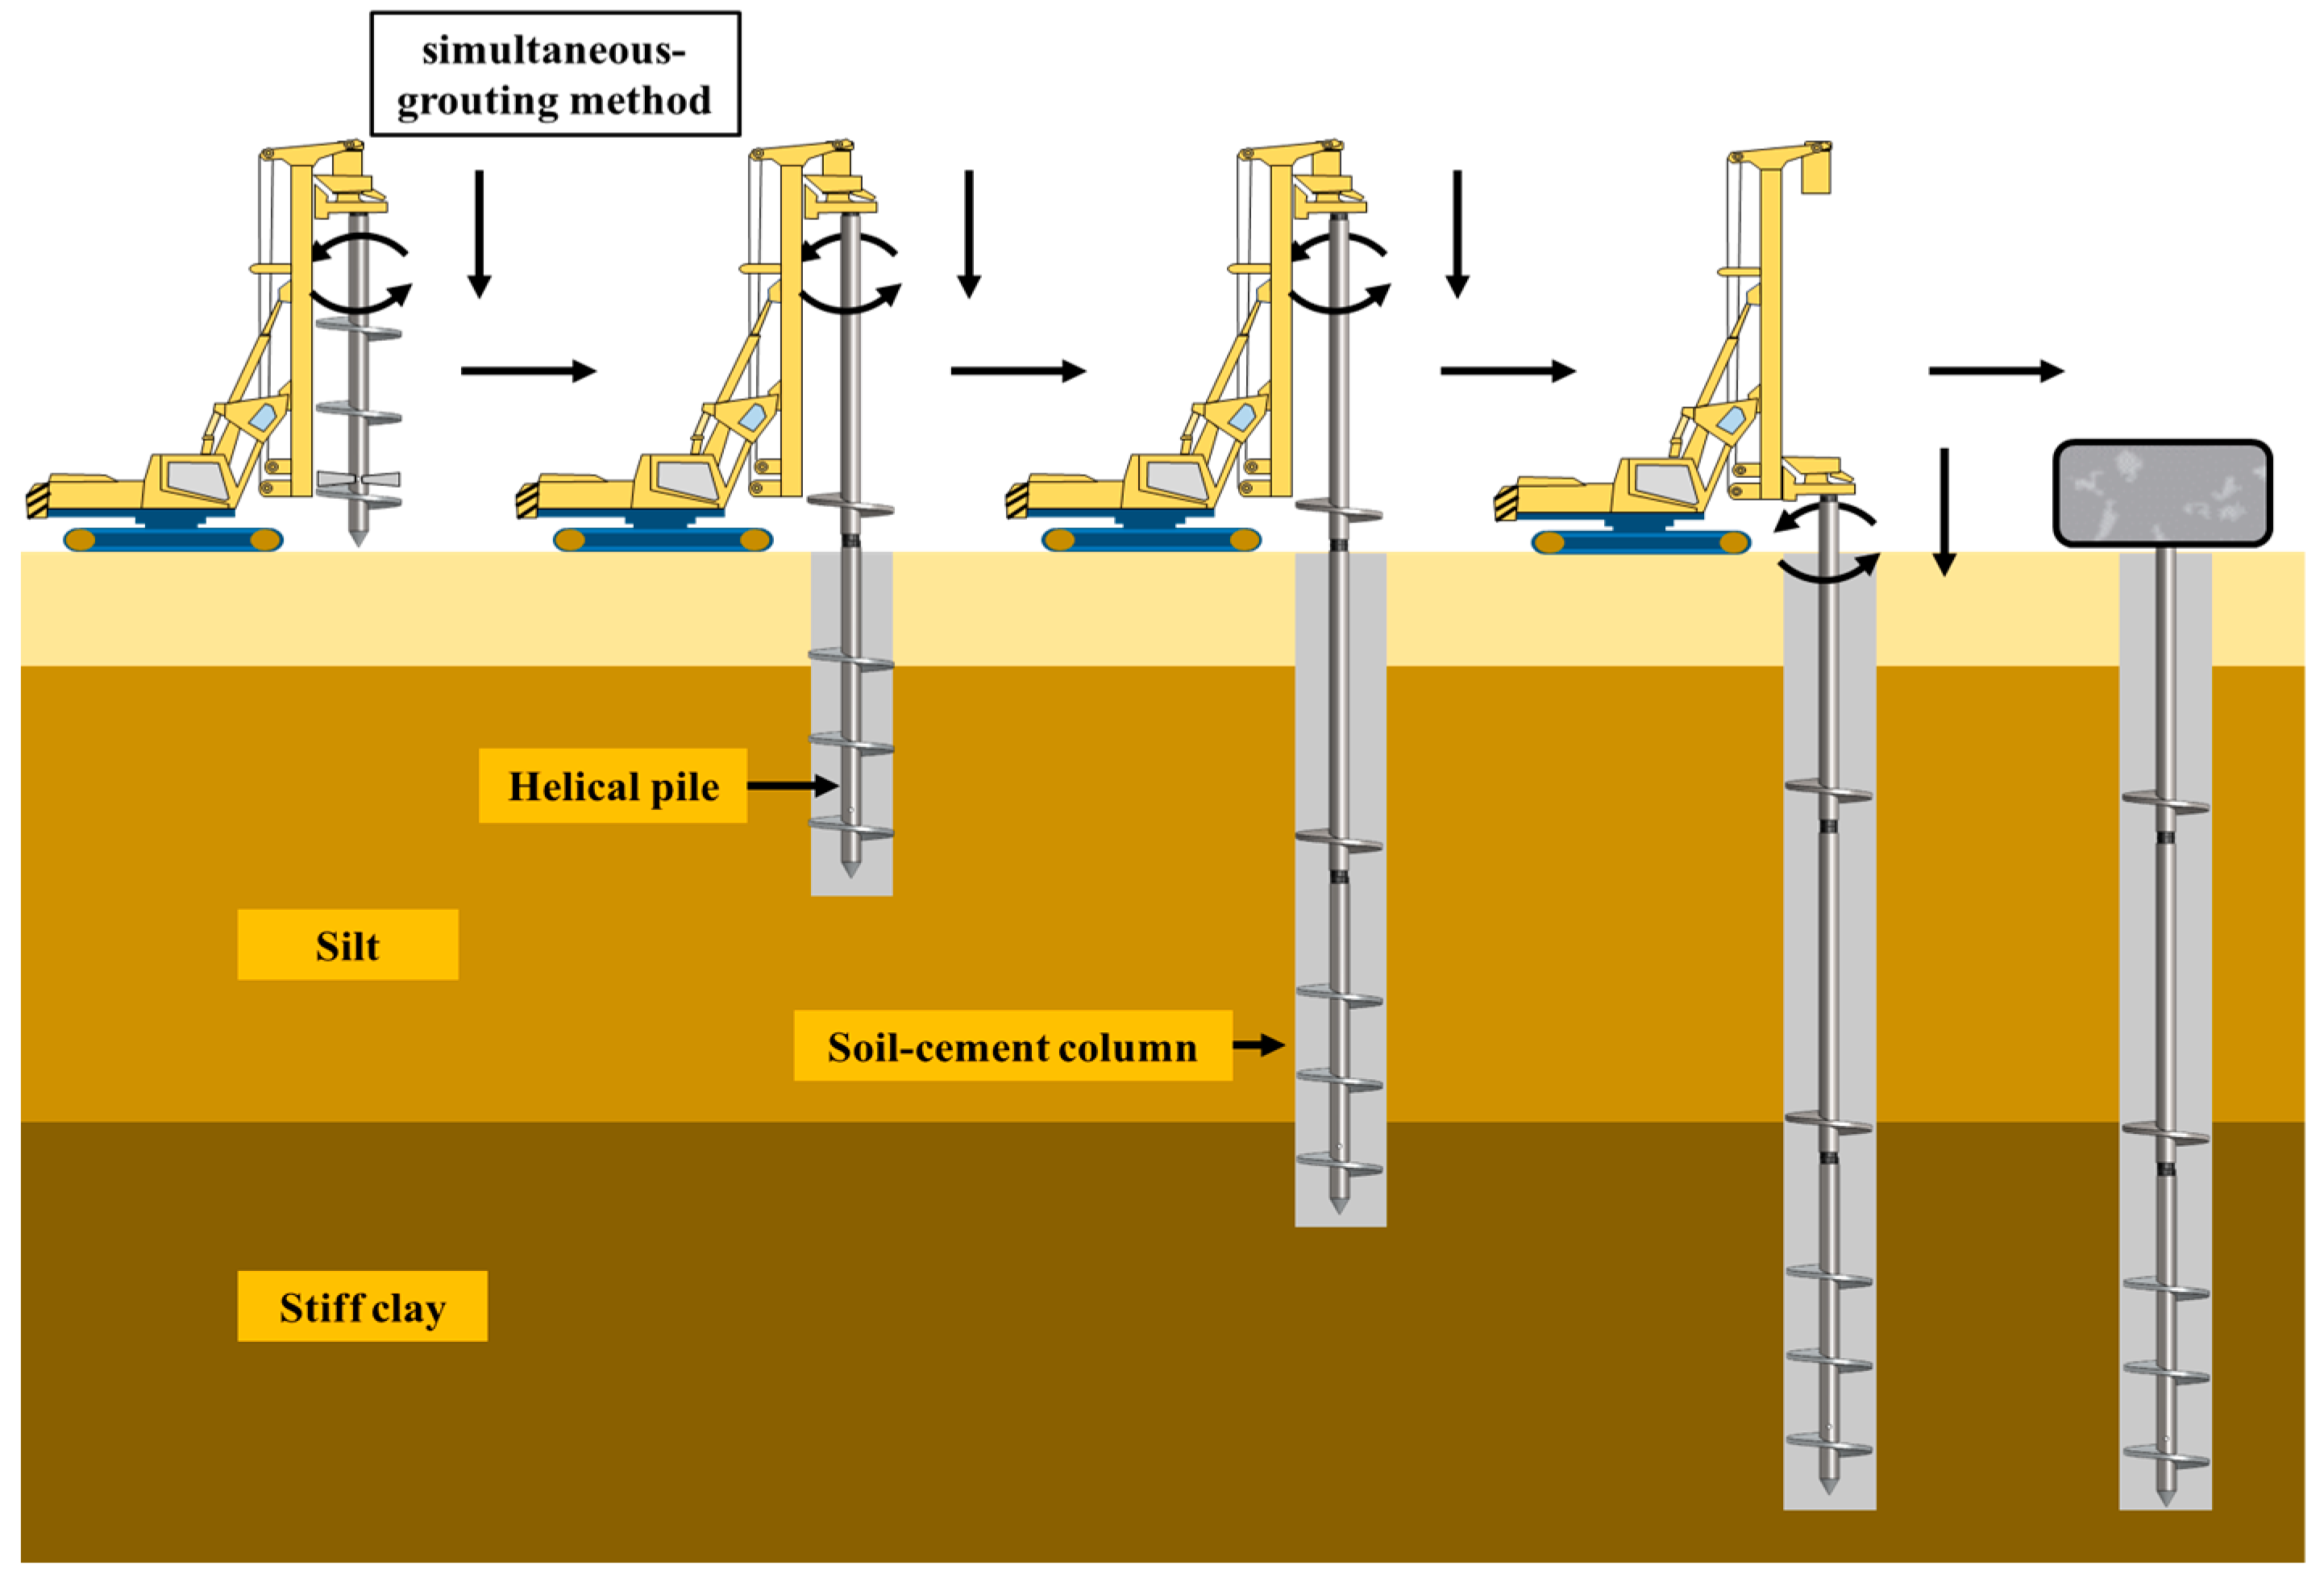
Figure 1. The installation process of HSCM-FT.
Applsci 13 00330 g001
Figure 2. Diagram of the FEM.
Applsci 13 00330 g002
Figure 3. Selection of boundary conditions.
Applsci 13 00330 g003
Figure 4. Selection of mesh.
Applsci 13 00330 g004
Figure 5. Comparison of field test and simulation results.
Applsci 13 00330 g005
Figure 6. Load–displacement curve of HSCM-1-1.
Applsci 13 00330 g006
Figure 7. Load–displacement curve of SDCM-1-2.
Applsci 13 00330 g007
Figure 8. Calculated deformation results with different C r e f / s u conditions.
Applsci 13 00330 g008aApplsci 13 00330 g008b
Figure 9. Normalized curves of load and displacement.
Applsci 13 00330 g009
Figure 10. Diagram of the theoretical calculation model.
Applsci 13 00330 g010aApplsci 13 00330 g010b
Figure 11. Comparison of simulation results with theoretically calculated values.
Applsci 13 00330 g011
Table 1. Marine soft clay physical properties.
Soil LayerWeight
γ kN/m3
Compression Modulus
E S   ( kN / m 2 )
Undrained Shear Strength
s u   ( kN / m 2 )
Clay-118.40345026.17
Clay-219.47532027.16
Silt16.5717905.68
Stiff clay-120.479860102.00
Stiff clay-220.6510,000114.36
Stiff clay-320.089360227.70
Table 2. Material parameters of FEM.
InterfaceElastic Modulus
E   ( kN / m ² )
Compressive   Strength   of   Soil Cement   C r e f   ( kN / m ² ) Tension   Strength   of   Soil Cement   C i n c   ( kN / m ² )
Pile and soil-184.8 × 10342442.4
Pile and soil-219.2 × 103969.6
Pile and soil-334.6 × 1041728172.8
Steel pipe and soil–cement-184.8 × 10342442.4
Steel pipe and soil–cement-219.2 × 103969.6
Steel pipe and soil–cement-334.6 × 1041728172.8
Table 3. Numerical simulation schemes.
Pile TypeID C r e f / s u Dsc (m)
HSCMHSCM-1-15, 10, 20, 40, 60, 800.32
SDCMSDCM-1-25, 10, 20, 40, 60, 800.32
Disclaimer/Publisher’s Note: The statements, opinions and data contained in all publications are solely those of the individual author(s) and contributor(s) and not of MDPI and/or the editor(s). MDPI and/or the editor(s) disclaim responsibility for any injury to people or property resulting from any ideas, methods, instructions or products referred to in the content.