Abstract
The observation of mobility tests can greatly help neurodegenerative disease diagnosis. In particular, among the different mobility protocols, the sit-to-stand (StS) test has been recognized as very significant as its execution, both in terms of duration and postural evaluation, can indicate the presence of neurodegenerative diseases and their advancement level. The assessment of an StS test is usually done by physicians or specialized physiotherapists who observe the test and evaluate the execution. Thus, it mainly depends on the experience and expertise of the medical staff. In this paper, we propose an automatic visual system, based on a low-cost camera, that can be used to support medical staff for neurodegenerative disease diagnosis and also to support mobility evaluation processes in telehealthcare contexts. The visual system observes people while performing an StS test, then the recorded videos are processed to extract relevant features based on skeleton joints. Several machine learning approaches were applied and compared in order to distinguish people with neurodegenerative diseases from healthy subjects. Real experiments were carried out in two nursing homes. In light of these experiments, we propose the use of a quadratic SVM, which outperformed the other methods. The obtained results were promising. The designed system reached an accuracy of demonstrating its effectiveness.
1. Introduction
In recent years, a growing body of literature has presented both technologies and methodologies in the context of active assisted living (AAL) for addressing several issues [1] related to the health and well-being of people. Wearable sensors, smart everyday objects and environmental sensors have been proposed to develop systems for basic activity monitoring (vital signs monitoring, physical activity, cognitive training and many others) and also for preventive measures and telehealthcare diagnosis [2,3,4]. Data processing can be afforded with simple data analysis techniques when threshold-based or distance-based methods can be applied, or with more complex methodologies such as machine learning ones, when complex data have to be analyzed and processed [5,6,7].
In this paper, we consider one issue that is relevant for medical staff and mainly concerns the older population, particularly people with dementia or neurodegenerative diseases. The assessment of the motor skills of the elderly can significantly assist in the diagnosis of neurodegenerative diseases and the evaluation of their progress. Motion skills are generally evaluated through the observation of mobility tests administrated and rated by physicians or specialized physiotherapists in controlled situations [8,9,10]. The resulting assessments depend on the experience and expertise of the evaluator. The use of technologies for the automatic evaluation of mobility tests can guarantee an objective assessment of the mobility abilities of the elderly. Different mobility protocols are available to check the motion abilities of older people. These protocols, defined by medical staff, consist of several mobility tests such as balance, walking, or sit to stand (StS).
In this paper, we focus our attention on the StS test, as it is significant for quantifying the functional strength of the lower limbs or identifying the movement strategies a person uses to complete transitional movements between sitting and standing. Thus, its execution, in terms of duration and body posture, can indicate the presence of neurodegenerative disease and its level of advancement. In the StS test, the person sits down and stands up several times with their arms crossed on the chest.
Various instrumented systems have been proposed for real-time assessment of the mobility capabilities of older people. The majority of works propose wearable sensors based on inertial measurement units or inertial and magnetic measurement systems for the physical function evaluation of individuals such as postural stability or fall detection [11,12,13]. Among the possible mobility tests, the walking test is undoubtedly the one that has received the most significant attention from the scientific community [14], and several technologies, both wearable and environmental, have been used to provide data on gait parameters for automatic analysis [15,16,17]. These sensors include accelerometers, gyroscopes and magnetometers, which are used to measure the acceleration or angular velocity of the body or of the body segments they are attached to [18]. Although wearable sensors return valid information related to the movement of people, they present some drawbacks as their output strictly depends on the position at which they are placed, their orientation and the activities to be monitored [19,20]. As a consequence, different wearable sensor modalities were proposed in [21] to mitigate the shortcomings of each sensor. In [22,23,24,25,26], wearable sensors were mostly used to monitor StS transitions and duration. The main drawback of the approaches based on wearable sensors is that older people, especially those with neurological disorders, do not readily accept wearing unfamiliar devices.
Contrary to wearable sensors, nonwearable ones, such as vision-based systems, are noninvasive for people as they are placed in the environment. For instance, they can be characterized by cameras that acquire video information about the human body, and then, by using image processing techniques, extract relevant parameters useful for the analysis of motion abilities [27,28,29,30]. A preliminary experiment for the analysis of the StS test, based on vision systems, was presented in [31] to demonstrate the ability of web cameras to detect sits transitions and stands phases in the StS test. Successively, two orthogonal cameras were used in [32] to create a 3D model in voxel space and identify the regions of the StS transitions. An RGB camera was used with an instrumented chair in [33] to have additional information related to the movement of the center of pressure of the observed subject. In [34], instead, a motion capture system was employed to demonstrate that video-based approaches could extract events in the StS test as well as force plates or inertial sensors. A Kinect camera was employed in [35] to measure the mean velocity of the StS transitions in order to assess fall risks.
The central leitmotif of the cited works is the segmentation over time of the phases of the StS for an estimate of the time required for the execution of several repetitions (typically a five-time StS). However, recent evidence supports posture analysis during the test execution to provide insight into disease diagnosis [36,37]. For this reason, we focus on using low-cost RGB cameras to extract skeletal information that can evaluate the execution of the StS test in terms of duration and postural attitude, as well as what physicians do within their evaluations. In addition, vision-based motion analysis systems can collect accurate kinematic data in a noninvasive way and represent good support for medical diagnosis in hospitals and clinics or telehealthcare contexts.
This paper proposes a complete framework, consisting of a low-cost vision-based experimental setup and processing modules, that observes older people while performing the StS mobility test and automatically distinguishes patients with neurodegenerative diseases from healthy subjects. In particular, the main contributions of this work are as follows:
- The experimental setup is based on a low-cost RGB camera, usually employed for video surveillance applications. This makes the sensorial framework more flexible and practical as it can be easily used in hospitals or retirement homes to support medical staff or in domestic contexts for telehealthcare applications.
- Real data were acquired and processed to validate the proposed system. A surveillance camera was installed in two nursing homes hosting patients with neurodegenerative diseases and healthy elderly. Several video acquisition sessions were carried out while subjects performed an StS test.
- The proposed system automatically classifies patients with neurodegenerative problems and healthy subjects, emulating the complex decision process of expert physiotherapists. The video data were processed to select the most informative features and to provide a more generalized model to improve the decision process.
- Different machine learning methods were compared using metrics such as accuracy, sensitivity and precision, to extract the one with the best performance in correspondence with the selected features.
- In light of the carried out comparisons, we propose the best combination of features and machine learning methodology that provides the best performance in this real context.
The remainder of this paper is structured as follows. Section 2 gives an overview of the proposed system and a description of data acquisition and feature extraction phases. In Section 3, the experiments carried out to compare different classifiers with different features are deeply described, and the results are commented on. Finally, the discussion is reported in Section 4, whereas Section 5 gives conclusive remarks.
2. Materials and Methods
Neurodegenerative diseases affect motor neurons, reducing functional mobility. Therefore, people suffering from neurodegenerative disorders could present limitations in functional mobility, especially with the progress of the disease. Everyday movements such as standing, bending and walking can be compromised, contributing significantly to the subject’s quality of life. In this work, we propose a vision-based system aiming to predict whether a person is suffering from neurodegenerative disorders by observing the execution of the StS test. Patients with neurodegenerative diseases and control subjects were asked to perform the five-time StS test (see Figure 1). Specifically, the participant started the test sitting on a chair with their arms crossed at the wrists and held against the chest. Then, the participant rose from the chair by levering on both legs, reached a standing position with complete distention of the spine (where possible), and then resat and repeated the exercise. The participant was instructed to sit fully between each stand. The test ended when the participant resat for the fifth time. A video camera, placed in front of the subject, recorded the StS exercise. The camera was a low-cost RGB camera usually used in surveillance contexts. The videos were preprocessed to collect and extract information about people’s postures during the exercise execution. A feature extraction phase was then applied to select the most significant features useful for training machine learning approaches. Meanwhile, machine learning approaches were applied to the acquired data and compared to gain insight into those performing better than others in this challenging context.
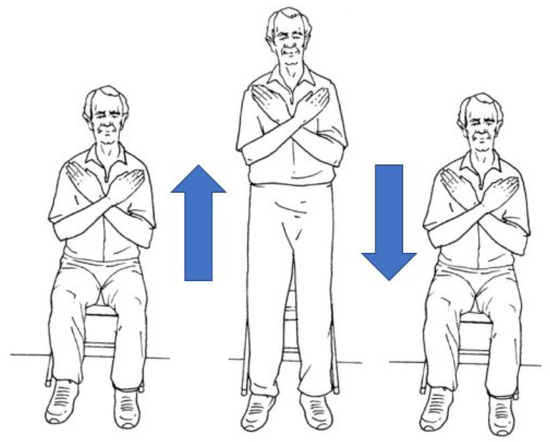
Figure 1.
Sit-to-stand test.
2.1. Acquisition Setup
For the data acquisition, a low-cost RGB monocular camera was installed in two different nursing institutes [38]. The camera used in this work was the HIK-Vision DS-2CD2385FWD-I camera with a 2.8 mm focal length and a 4K resolution at 20 fps. The camera was installed in the gym of the institutes, where people usually execute mobility tests, so the medical staff periodically can monitor the motion abilities of older people following a defined protocol. The camera was placed as shown in Figure 2, at a height h = 2 m above the floor and a horizontal distance d = 3 m from the wall against which the chair was leaning. The camera was tilted down to an angle of about .
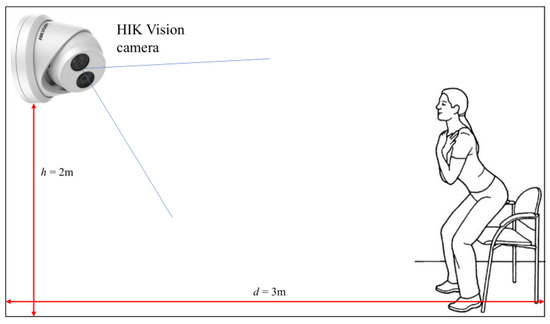
Figure 2.
System setup: the HIK Vision camera is placed in front of the subject.
2.2. Data Acquisition and Preprocessing
The older people who participated in this study gave their written informed consent. There were 13 people affected by neurodegenerative diseases at the early stage and 18 healthy people, both aged in a range between 60 and 95 years. The subjects were recorded while performing the StS test in two separate acquisition sessions three months apart. Several problems emerged during the acquisition phase, as some people who participated in the first acquisition session were no longer able to perform the test independently in the second session. However, at the end of the acquisition phase, 32 videos of patients with neurodegenerative diseases and 19 videos of healthy subjects were recorded during the execution of the StS test.
Once the video sequences of RBG images were acquired, they were appropriately processed in order to remove image distortion. Both extrinsic and intrinsic camera parameters were extracted in a calibration phase to correct the image distortion.
Then, the videos were processed to extract the skeletons of the observed people by using the OpenPose library [39]. OpenPose is a multiperson 2D pose estimation algorithm that detects the skeletons of all people present in the scene, returning the 2D coordinates of skeleton joints. In our study, the videos had to be analyzed to extract and track only the skeleton relative to the subject performing the StS test. Figure 3 shows two sample frames of the videos acquired in the two different nursing homes. The skeletons of other persons present in the scene, such as the physiotherapist or relatives, had to discarded. For this reason, a skeleton tracking procedure was developed to maintain only the skeleton information of the subject of interest while discarding the others.
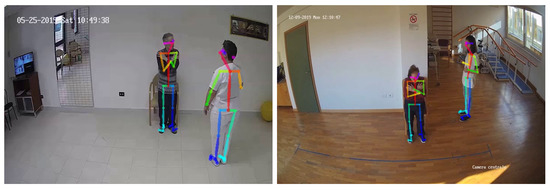
Figure 3.
Sample frames of the videos acquired in the two different nursing homes.
Figure 4 shows the result of the developed tracking procedure. For the sake of clarity, only the coordinates of one joint (the nose) are plotted both in the case of a sick patient (Figure 4a) and a healthy subject (Figure 4b). As can be seen, before tracking, the coordinates of the joint are misaligned among skeletons. Once the skeleton of the patient is manually indicated in the first frame, the procedure tracks the skeleton in the entire video. Thus, after tracking, the joint coordinates are correctly assigned to the skeleton of interest.
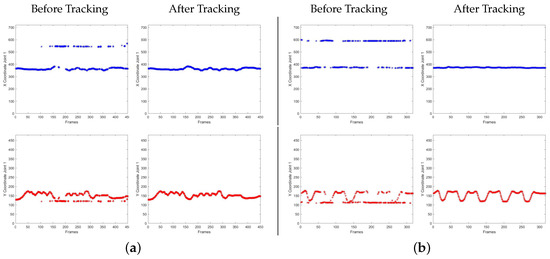
Figure 4.
Plots of x and y coordinate of nose joint (joint 1) before and after applying the tracking procedure, in the case of a sick patient (a) and healthy subject (b), respectively.
2.3. Feature Extraction and Data Augmentation
In this work, the skeleton model used in the OpenPose procedure was the Body_25 model, which considers 25 joints as shown in Figure 5a. In our study, the joints relative to the feet, eyes and ears were discarded, as they did not affect the analysis of movements involved in the StS test. Therefore, the total number of considered joints was as shown in Figure 5b.
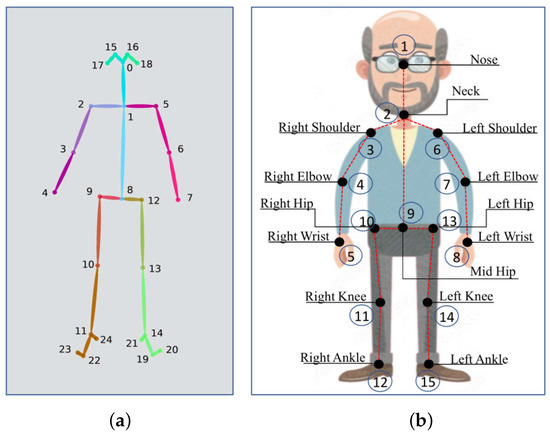
Figure 5.
(a) Skeleton joints extracted by using Body_25 model in OpenPose. (b) Skeleton joints used in this study.
Considering the 2D coordinates of the skeleton joints, calculated by OpenPose, significant features could be extracted before training the classifiers. This study estimated two types of geometric features to capture the subjects’ posture during the execution of the StS test. Furthermore, the derivatives of the geometric features were also estimated to capture the dynamics of the posture. Due to the difference in body sizes of the subjects and the variations in camera location and orientation, features were first normalized to make them invariant to these variations.
Joint-to-joint distances and angles were considered as geometric features. These were calculated for each frame of the acquired videos. Given K skeleton joints, let us denote by the coordinates of joint j in frame i. The distance features, indexed by d, were calculated between all couples of joints as follows:
where represents the normalization factor, which was defined as the sum of two distances: (1) the distance between the joints of the right and left shoulders and (2) the distance between the joints of the neck and mid hip. The total number of distance features in each frame was .
Analogously, angle features, indexed by a, were calculated considering triplets of joints. Let and be the vectors defined by three different body joints in frame i; the angle features were calculated as follows:
In this case, the total number of possible angles in each frame was . Considering both distance and angle features, their first-order and second-order derivatives were calculated to approximate the velocity and acceleration of the subject’s posture during the StS test. These features could be defined as follows:
where is the considered interval of frames. Analogously, the velocity and acceleration of the angle features could be similarly estimated.
The length of these feature vectors depended on the number of frames of the acquired videos and could be very dissimilar among the subjects, as they executed the StS test according to their abilities. Indeed, some patients affected by neurodegenerative diseases were unable to stand up. The length of the feature vectors highly affects the dimension of the training set to be provided to any machine learning approach. Furthermore, since we aimed to use only real data, the dataset of acquired videos presented some limitations, such as a high data dimensionality, a low quantity of data and imbalanced data due to the limited number of subjects participating in the experiment (13 patients with neurodegenerative diseases and 18 healthy subjects). In order to enrich the dataset and to face in part the aforementioned limitations, the SMOTE (synthetic minority oversampling technique) data oversampling approach was applied to the training set [40]. The SMOTE technique is a popular oversampling method that improves random oversampling, creating synthetic new instances that balance the minority class samples augmenting the available dataset.
3. Results
As described in Section 2.2, during the data acquisition phase, 41 videos were acquired: 32 videos of patients with neurodegenerative diseases and 19 videos of healthy subjects. The dataset was divided into a training set and a testing set by randomly considering of the videos for training and the remaining for testing. The random choice of the sample videos in the two sets was maintained fixed for all the experiments in order to be sure to compare fairly the performance of classifiers on the same elements. Furthermore, the training set was oversampled by applying the SMOTE procedure. The following machine learning methods were used to classify patients with neurodegenerative diseases and healthy subjects:
- K-nearest neighbors with (KNN)
- Decision tree (DT)
- Support vector machines with linear kernel (SVM-L), with quadratic kernel (SVM-Q) and with cubic kernel (SVM-C)
- Feedforward neural networks with Relu activation functions and different architecture configurations: one fully connected hidden layer of size 10 (NN-N), of size 25 (NN-M) and of size 100 (NN-W).
The classifiers were trained with a five-fold cross-validation technique. The popular metrics of accuracy, sensitivity and precision (see Table 1) were used for measuring the performance of the obtained classification models.

Table 1.
Definition of metrics used to compare the classification models.
In Table 1, TP = true positives, TN = true negatives, FP = false positives and FN = false negatives. Notice that a positive prediction (output class = 1) classified the subject as affected with neurodegenerative disease, whereas a negative prediction (output class = 0) referred to a healthy subject. Accuracy provides general information on how correct the classification model is overall. However, when dealing with binary classification problems, especially in medical contexts, as in our study, it is important to have information about predictions classified as false positives and false negatives. Thus, sensitivity and precision better characterize model performance relative to a specific category. Indeed, precision or positive predictive value provides the percentage of relevant results, whereas sensitivity gives the percentage of relevant results that are successfully classified.
Different experimental sessions were carried out in order to find the best compromise between computational cost and classifiers’ performance. Due to the great heterogeneity of people participating in the experiment because of different people’s characteristics such as age, disease severity, body size and motor abilities, the variance in times of execution of the StS was considerably high. Therefore, the acquired videos had different lengths in terms of the number of frames. The length of the videos of healthy subjects varied between 206 and 532 frames, whereas that relative to the videos of patients affected by neurodegenerative diseases varied between 233 and 825 frames. Thus, considering the whole video, the dimension of the input feature vector could be very high, producing high computational costs. To tackle this issue, we decided to reduce the number of frames to be processed by defining a step parameter s. Thus, we process one frame every s in the video. Different values for s (, , ) were fixed considering the minimum and maximum lengths of the videos of the entire dataset and the camera frame rate. In the following sections, the results obtained for the case of are shown. This case represents the best one considering both computational cost and feature vector dimension. Additional experiments carried out by using values of produced a degradation of the classifiers’ performance.
Ablation Study
An ablation study was carried out considering different combinations of features. In the first set of experiments, normalized distances () and normalized distances combined with velocity () and acceleration () were used as feature vectors provided to all the considered classifiers. Table 2 lists the results obtained in these cases. SVM-L, in case of normalized distances, performed better with respect to the other classifiers, reaching an accuracy of and for both precision and sensitivity. However, the high sensitivity of the NN-M was noteworthy. Figure 6 better details these percentages by comparing the confusion matrices of SVM-L and NN-M, respectively. As can be seen, in the bottom row of the matrices, NN-M can better predict patients with neurodegenerative diseases with respect to SVM-L. However, NN-M reveals a deterioration in the correct classification of healthy subjects.

Table 2.
Classification results when normalized distances () and normalized distances plus velocity () and acceleration () were used as feature vectors. The maximum percentages are highlighted in bold.
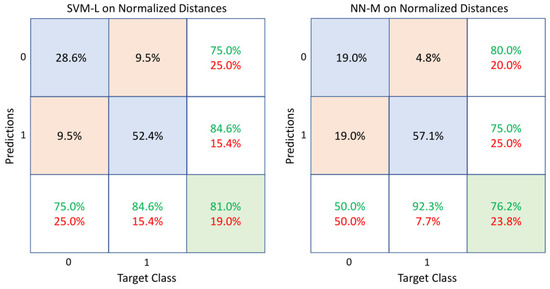
Figure 6.
Confusion matrices of SVM-L and NN-M when normalized distances were used as feature vectors. The diagonal cells show the correctly classified observations (accuracies), whereas the off-diagonal cells show the incorrectly classified ones. The far-right column of each matrix shows the precision or positive predictive value (green) and the false discovery rate (red). The bottom row shows the sensitivity or true positive rate (green) and the false negative rate (red). Class 0 and class 1 represent healthy subjects and sick patients, respectively.
When the geometric feature of normalized distance () was combined with the kinematic features of velocity () and acceleration (), in general, all the considered classifiers performed better than the previous case (see Table 2). The KNN classification technique showed maximum percentages of accuracy (), sensitivity () and precision (), respectively. However, although a great improvement was obtained, the high dimensionality of the feature vectors introduced a high computational cost.
The study continued by considering the angles as geometric features and then, the angles combined with the kinematic features of velocity () and acceleration (). Table 3 compares the results obtained in these cases. It is evident that the combined use of angles and kinematic features involved an increase in performance with respect to using only the angles, but with a notable growth in computational cost. However, some considerations must be done about the obtained results. To this aim, Figure 7 shows the confusion matrices of two sample cases: SVM-Q on angle features and NN-W on angles plus velocity and acceleration. It is important to notice the sensitivity values in the bottom row of the matrices, which refer to the correct classifications within each category. The case of NN-W on angles, velocity and acceleration provides a very good sensitivity rate for class 0 (healthy) but poor values for class 1 (sick patient), whereas SVM-Q on angles can reasonably classify both classes.

Table 3.
Classification results when angles () and angles plus velocity () and acceleration () were used as feature vectors. The maximum percentages are highlighted in bold.
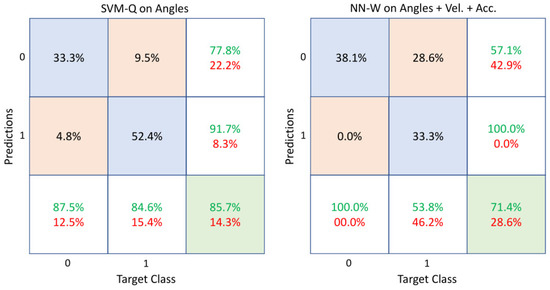
Figure 7.
Confusion matrices of SVM-Q and NN-W when angles and angles plus velocity and acceleration were used as feature vectors, respectively. The diagonal cells show the correctly classified observations (accuracies), whereas the off-diagonal cells show the incorrectly classified ones. The far-right column of each matrix shows the precision or positive predictive value (green) and the false discovery rate (red). The bottom row shows the sensitivity or true positive rate (green) and the false negative rate (red). Class 0 and class 1 represent healthy subjects and sick patients, respectively.
In light of the results presented above, to find a good compromise between good classification performance and computational cost, a final study was carried out combining normalized distances () and angles () as a feature vector. As seen in Table 4, all the considered classifiers generally showed good performance with respect to the previous results listed in Table 2 and Table 3. This emerged not only by considering the accuracy metric but also by the sensitivity and precision rates which indicated a high percentage of correct classifications in both classes. For completeness, the confusion matrices of two classifiers (SVM-Q and NN-N) are shown in Figure 8 to better analyze these results. SVM-Q provided better results among all. It is also helpful to discuss the results of the KNN, SVM-L and SVM-C, which behaved similarly. Furthermore, NN-N was the second-best performing classifier and exhibited similar behaviors as the remaining classifiers based on neural networks (NN-M and NN-W). The classifiers that provided high precision rates could better classify healthy subjects. In contrast, those with high sensitivity rates could correctly classify patients with neurodegenerative problems.

Table 4.
Classification results when the combination of normalized distances () and angles () was used as a feature vector. The classifier providing better performance is highlighted in bold.
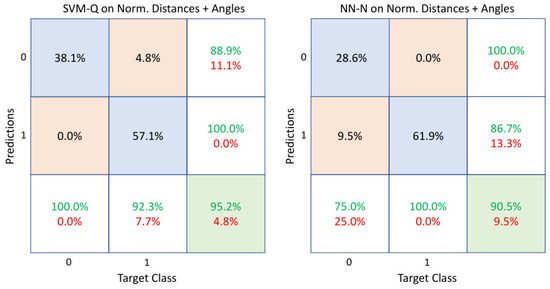
Figure 8.
Confusion matrices of SVM-Q and NN-N when the combination of normalized distances and angles was used as a feature vector. The diagonal cells show the correctly classified observations (accuracies), whereas the off-diagonal cells show the incorrectly classified ones. The far-right column of each matrix shows the precision or positive predictive value (green) and the false discovery rate (red). The bottom row shows the sensitivity or true positive rate (green) and the false negative rate (red). Class 0 and class 1 represent healthy subjects and sick patients, respectively.
4. Discussion
The aim of this work was to investigate the use of a visual system based on a single commercial RGB camera, for distinguishing patients with neurodegenerative diseases from healthy ones by analyzing the StS test. Many neurodegenerative disorders, such as Alzheimer’s or Parkinson’s disease, are characterized by motor dysfunction, often culminating in the loss of movement. Therefore, the early detection of neurodegenerative signals, such as motor degeneration, is essential for appropriately supporting both patients and doctors for further clinical investigations.
The results shown in the previous section clearly prove the effectiveness of the proposed system which represents a valid instrument in this domain. As shown in Table 2, Table 3 and Table 4, classic machine learning methodologies were able to clearly separate patients suffering from neurodegenerative diseases from healthy subjects reaching high accuracy rates of up to . Two types of geometric features were used as input to the machine learning methods: joint-to-joint distances and angles. Furthermore, kinematic features such as the velocity and the acceleration evaluated on both distances and angles were combined with the geometric features in order to investigate their effect on classifiers’ performance. In general, the SVM methods outperformed the other classifiers when using as features the distances, the angles and the angles combined with velocity and acceleration (see Table 2 and Table 3). In these cases, an accuracy rate of up to was achieved. In the case of using distances combined with velocity and acceleration, the method which exhibited better performance was KNN, reaching for the accuracy rate (see Table 2).
These results confirmed that the considered features, both geometric and kinematic, were able to characterize the posture variations of the subjects and to detect motor dysfunctions typical of patients with neurodegenerative diseases. Finally, the last study regarding the combination of the geometric features alone, allowed us to make an additional consideration. Indeed, in this case, the highest percentages of correct classifications were obtained. This emerged not only by considering the accuracy metric, which reached but also by considering the sensitivity and precision rates, which achieved percentage values of up to . These results highlighted that was possible to ignore kinematic features since only the geometric ones were enough to characterize the postural variations of the people. At the same time, this result is equally important as it represents a good compromise between classification performance and computational cost.
5. Conclusions and Future Work
In this paper, we proposed a vision-based system for automatically classifying patients with neurodegenerative diseases and healthy subjects while they perform the StS test. Usually, physicians or expert physiotherapists do that by observing people directly. One of the main points of the proposed system was the analysis of real data acquired by a low-cost commercial camera installed in two different retirement houses hosting elderly people. The aim was to support the medical staff in diagnosing neurodegenerative disorders, by using this type of automatic system that is less dependent on human expertise and that can significantly support remote analysis.
The use of commercial surveillance cameras for the analysis of the StS test has rarely been used in literature, especially for supporting neurodegenerative disease diagnosis. For this reason, the lack of public datasets and the poor literature coverage in this context did not allow us to make direct comparisons with other works. Nonetheless, the investigation of such a system based on a visual sensor is very important for the development of automatic devices able to monitor the health status of older people in both private homes and nursing institutes.
Therefore, in this work, several classical machine learning methodologies, such as SVM, decision tree, neural networks and K-nearest neighbors were applied to the acquired video data to distinguish patients suffering from neurodegenerative diseases and healthy subjects. At the same time, the analysis of the performance of the classifiers over different features allowed us to identify the better one. In general, the obtained good results in terms of classification accuracy, sensitivity and precision encourage us to continue the study and the improvement of the proposed visual system by investigating additional machine learning methodologies. The principal limit to applying more complex machine learning approaches, such as deep ones, remains in the limited dimension of the actual data set. Data augmentation can help manage this issue, but the final size often remains insufficient. On the other side, applying deep neural networks, which are principally characterized by multiple layers in the network, could be very helpful in this context. Deep neural networks can manipulate more abstract representations of the data providing features at higher and higher levels of abstraction. Furthermore, a particular type of deep neural network, known as a recurrent neural network, can extract information from data sequences and is particularly useful for analyzing video streams and learning long-term dependencies of data.
In light of these considerations, future work will be devoted to a massive data acquisition phase during physiotherapy sessions of elderly patients for recording videos and collecting the associated physician’s evaluations for comparisons. Particular attention will be given to the fundamental issues related to the use of deep learning approaches regarding data volume, data representation and overfitting. Indeed, when a model is trained on a limited dataset, it may learn the peculiarities of the training set and fails to adapt to new data. In conclusion, our future work will regard the acquisition of a substantial quantity of new data in order to study and apply deep learning methods for investigating feature selection, feature reduction and the generalization abilities of the learned models to prevent overfitting problems.
Author Contributions
Conceptualization, G.C. and T.D.; methodology, G.C. and T.D.; software, G.C.; validation, G.C. and T.D., formal analysis, G.C. and T.D.; investigation, G.C.; resources, G.C. and T.D.; data processing, G.C.; writing—original draft preparation, G.C.; writing—review and editing, G.C. and T.D.; visualization, G.C.; supervision, T.D. All authors have read and agreed to the published version of the manuscript.
Funding
This research received no external funding.
Institutional Review Board Statement
Not applicable.
Informed Consent Statement
Informed consent was obtained from all subjects involved in the study for the video acquisition. Written informed consent for publication was not necessary since participating patients cannot be identified.
Data Availability Statement
Not applicable.
Acknowledgments
The authors would like to thank G. Bono and M. Attolico for their administrative and technical support.
Conflicts of Interest
The authors declare no conflict of interest.
Abbreviations
The following abbreviations are used in this manuscript:
| StS | Sit to Stand |
| SMOTE | Synthetic minority oversampling technique |
| ML | Machine learning |
| DT | Decision tree |
| KNN | K-nearest neighbors |
| SVM | Support vector machine |
| SVM-L | Support vector machine with linear kernel |
| SVM-Q | Support vector machine with quadratic kernel |
| SVM-C | Support vector machine with cubic kernel |
| NN-N | Narrow neural network |
| NN-M | Medium neural network |
| NN-W | Wide neural network |
References
- Cicirelli, G.; Marani, R.; Petitti, A.; Milella, A.; D’Orazio, T. Ambient Assisted Living: A Review of Technologies, Methodologies and Future Perspectives for Healthy Aging of Population. Sensors 2021, 21, 3549. [Google Scholar] [CrossRef]
- Maskeliunas, R.; Damasevicius, R.; Segal, S. A Review of Internet of Things Technologies for Ambient Assisted Living Environments. Future Internet 2019, 11, 259. [Google Scholar] [CrossRef]
- Climent-Perez, P.; Spinsante, S.; Mihailidis, A.; Florez-Revuelta, F. A review on video-based active and assisted living technologies for automated lifelogging. Expert Syst. Appl. 2020, 139, 112847. [Google Scholar] [CrossRef]
- Alhomsan, M.N.; Hossain, M.A.; Rahman, S.M.M.; Masud, M. Situation Awareness in Ambient Assisted Living for Smart Healthcare. IEEE Access 2017, 5, 20716–20725. [Google Scholar] [CrossRef]
- Myszczynska, M.A.; Ojamies, P.N.; Lacoste, A.M.B.; Neil, D.; Saffari, A.; Mead, R.; Hautbergue, G.M.; Holbrook, J.D.; Ferraiuolo, L. Applications of machine learning to diagnosis and treatment of neurodegenerative diseases. Nat. Rev. Neurol. 2020, 16, 440–456. [Google Scholar] [CrossRef]
- Bianchi, V.; Bassoli, M.; Lombardo, G.; Fornacciari, P.; Mordonini, M.; Munari, I.D. IoT Wearable Sensor and Deep Learning: An Integrated Approach for Personalized Human Activity Recognition in a Smart Home Environment. IEEE Internet Things J. 2019, 6, 8553–8562. [Google Scholar] [CrossRef]
- Forkan, A.; Khalil, I.; Tari, Z.; Foufou, S. A context-aware approach for long-term behavioural change detection and abnormality prediction in ambient assisted living. Pattern Recognit. 2015, 48, 628–641. [Google Scholar] [CrossRef]
- Soubra, R.; Chkeir, A.; Novella, J. A systematic review of thirty-one assessment tests to evaluate mobility in older adults. Biomed Res. Int. 2019, 2019, 1354362. [Google Scholar] [CrossRef]
- Buckley, C.; Alcock, L.; McArdle, R.; Rehman, R.Z.U.; Del Din, S.; Mazzà, C.; Yarnall, A.J.; Rochester, L. The role of movement analysis in diagnosing and monitoring neurodegenerative conditions: Insights from gait and postural control. Brain Sci. 2019, 9, 34. [Google Scholar] [CrossRef]
- Romeo, L.; Marani, R.; Lorusso, N.; Angelillo, M.; Cicirelli, G. Vision-based Assessment of Balance Control in Elderly People. In Proceedings of the IEEE Medical Measurements and Applications, MeMeA, Bari, Italy, 1 June–1 July 2020; Volume 9137110. [Google Scholar]
- Subramaniam, S.; Faisal, A.I.; Deen, M.J. Wearable Sensor Systems for Fall Risk Assessment: A Review. Front. Digit. Health 2022, 4, 921506. [Google Scholar] [CrossRef]
- Xie, J.; Guo, K.; Zhou, Z.; Yan, Y.; Yang, P. ART: Adaptive and Real-time Fall Detection Using COTS Smart Watch. In Proceedings of the 6th International Conference on Big Data Computing and Communications (BIGCOM), Deqing, China, 24–25 July 2020. [Google Scholar]
- Pierleoni, P.; Belli, A.; Palma, L.; Paoletti, M.; Raggiunto, S.; Pinti, F. Postural stability evaluation using wearable wireless sensor. In Proceedings of the IEEE 23rd International Symposium on Consumer Technologies (ISCT), Ancona, Italy, 19–21 June 2019. [Google Scholar]
- Cicirelli, G.; Impedovo, D.; Dentamaro, V.; Marani, R.; Pirlo, G.; D’Orazio, T. Human Gait Analysis in Neurodegenerative Diseases: A Review. IEEE J. Biomed. Health Inform. 2022, 26, 229–242. [Google Scholar] [CrossRef]
- Greene, B.; McGrath, D.; O’Neill, R.; O’Donovan, K.; Burns, A.; Caulfield, B. TAn adaptive gyroscope-based algorithm for temporal gait analysis. Med. Biol. Eng. Comput. 2010, 48, 1251–1260. [Google Scholar] [CrossRef]
- Anwary, A.R.; Yu, H.; Vassallo, M. Optimal foot location for placing wearable IMU sensors and automatic feature extraction for gait analysis. IEEE Sens. J. 2018, 18, 2555–2567. [Google Scholar] [CrossRef]
- Razak, A.A.; Zayegh, A.; Begg, R.; Wahab, Y. Foot plantar pressure measurement system: A review. Sensors 2012, 12, 9884–9912. [Google Scholar] [CrossRef]
- Hanawa, H.; Hirata, K.; Miyazawa, T.; Sonoo, M.; Kubota, K.; Fujino, T.; Kokubun, T.; Kanemura, N. Validity of inertial measurement units in assessing segment angles and mechanical energies of elderly persons during sit-to-stand motion. In Proceedings of the 58th Annual Conference of the Society of Instrument and Control Engineers of Japan (SICE), Hiroshima, Japan, 10–13 September 2019. [Google Scholar]
- Brognara, L.; Palumbo, P.; Grimm, B.; Palmerini, L. Assessing Gait in Parkinson’s Disease Using Wearable Motion Sensors: A Systematic Review. Diseases 2019, 7, 18. [Google Scholar] [CrossRef]
- Adamowicz, L.; Karahanoglu, F.I.; Cicalo, C.; Zhang, H.; Demanuele, C.; Santamaria, M.; Cai, X.; Patel, S. Assessment of Sit-to-Stand Transfers during Daily Life Using an Accelerometer on the Lower Back. Sensors 2020, 20, 6618. [Google Scholar] [CrossRef]
- Bhardwaj, S.; Khan, A.A.; Muzammil, M.; Khan, S.M. ANN based classification of sit to stand transfer. Mater. Today Proc. 2020, 24, 1029–1034. [Google Scholar] [CrossRef]
- Matthew, R.P.; Seko, S.; Bajcsy, R. Fusing motion-capture and inertial measurementsfor improved joint state recovery: An application for sit-to-stand actions. In Proceedings of the 39th Annual International Conference IEEE Engineering in Medicine and Biology Society (EMBC), Jeju City, Republic of Korea, 11–15 July 2017; pp. 1893–1896. [Google Scholar]
- Zheng, E.; Chen, B.; Wang, X.; Huang, Y.; Wang, Q. On the design of a wearable multi-sensor system for recognizing motion modes and sit-to-stand transition. Int. J. Adv. Robot. Syst. 2014, 11, 30. [Google Scholar] [CrossRef]
- Shukla, B.; Bassement, J.; Vijay, V.; Yadav, S. Instrumented Analysis of the Sit-to-Stand Movement for Geriatric Screening: A Systematic Review. Bioengineering 2020, 7, 139. [Google Scholar] [CrossRef]
- Tulipani, L.; Meyer, B.; Fox, S.; Solomon, A.; McGinnis, R.S. The Sit-to-Stand Transition as a Biomarker for Impairment: Comparison of Instrumented 30-Second Chair Stand Test and Daily Life Transitions in Multiple Sclerosis. IEEE Trans. Neural Syst. Rehabil. Eng. 2022, 30, 1213–1222. [Google Scholar] [CrossRef]
- Park, C.; Sharafkhaneh, A.; Bryant, M.S.; Nguyen, C.; Torres, I.; Najafi, B. Toward Remote Assessment of Physical Frailty Using Sensor-based Sit-to-stand Test. J. Surg. Res. 2021, 263, 130–139. [Google Scholar] [CrossRef]
- Colyer, S.; Evans, M.; Cosker, D.P.; Salo, A. Review of the Evolution of Vision-Based Motion Analysis and the Integration of Advanced Computer Vision Methods Towards Developing a Markerless System. Sports Med. Open 2018, 4, 24. [Google Scholar] [CrossRef]
- Cebanov, I.; Dobre, C.; Gradinar, A.; Ciobanu, R.; Stanciu, V. ART: Adaptive and Real-time Fall Detection Using COTS Smar Activity Recognition for Ambient Assisted Living using off-the shelf Motion sensing input devices. In Proceedings of the Global IoT Summit (GIoTS), Aarhus, Denmark, 17–21 June 2019. [Google Scholar]
- Ryselis, K.; Petkus, T.; Blazauskas, T.; Maskeliunas, R.; Damasevicius, R. Multiple Kinect based system to monitor and analyze key performance indicators of physical training. Hum. Centric Comput. Inf. Sci. 2020, 10, 51. [Google Scholar] [CrossRef]
- Li, T.; Chen, J.; Hu, C.; Ma, Y.; Wu, Z.; Wan, W.; Huang, Y.; Jia, F.; Gong, C.; Wan, S.; et al. Automatic timed up-and-go sub-task segmentation for Parkinson’s disease patientsusing video-based activity classification. IEEE Trans. Neural Syst. Rehabil. Eng 2018, 26, 2189–2199. [Google Scholar] [CrossRef]
- Allin, S.; Mihailidis, A. Sit to Stand Detection and Analysis. In Proceedings of the AAAI Fall Symposium: AI in Eldercare: New Solutions to Old Problems, Arlington, VA, USA, 7–9 November 2008. [Google Scholar]
- Banerjee, T.; Skubic, M.; Keller, J.; Abbott, C. Sit-to-Stand Measurement for In-Home MonitoringUsing Voxel Analysis. IEEE J. Biomed. Health Inform. 2014, 18, 1502–1509. [Google Scholar] [CrossRef]
- Shukla, B.K.; Jain, H.; Vijay, V.; Yadav, S.K.; Mathur, A.; Hewso, D.J. A Comparison of Four Approaches to Evaluate the Sit-to-Stand Movement. IEEE Trans. Neural Syst. Rehabil. Eng. 2022, 38, 1317–1324. [Google Scholar] [CrossRef]
- Shia, V.; Bajcsy, R. Vision-based Event Detection of the Sit-to-Stand Transition. In Proceedings of the MOBIHEALTH 2015, London, UK, 14–16 October 2015. [Google Scholar]
- Ejupi, A.; Brodie, M.; Gschwind, Y.J.; Lord, S.R.; Zagler, W.L.; Delbaere, K. Kinect-Based Five-Times-Sit-to-Stand Test for Clinical and In-Home Assessment of Fall Risk in Older People. Gerontology 2016, 62, 118–124. [Google Scholar] [CrossRef]
- Thomas, J.; Hall, J.; Bliss, R.; Guess, T. Comparison of Azure Kinect and optical retroreflective motion capture for kinematic and spatiotemporal evaluation of the sit-to-stand test. Gait Posture 2022, 94, 153–159. [Google Scholar] [CrossRef]
- Cippitelli, E.; Gasparrini, S.; Spinsante, S.; Gambi, E.; Verdini, F.; Burattini, L.; Nardo, F.D.; Fioretti, S. Validation of an optimized algorithm to use Kinect in a non-structured environment for Sit-to-Stand analysis. In Proceedings of the Annual International Conference of the IEEE Engineering in Medicine and Biology Society, Milan, Italy, 25–29 August 2015. [Google Scholar]
- Romeo, L.; Marani, R.; Petitti, A.; Milella, A.; D’Orazio, T.; Cicirelli, G. Image-Based Mobility Assessment in Elderly People from Low-Cost Systems of Cameras: A Skeletal Dataset for Experimental Evaluations. In Lecture Notes in Computer Science (Including Subseries Lecture Notes in Artificial Intelligence and Lecture Notes in Bioinformatics); Springer: Berlin/Heidelberg, Germany, 2020; Volume 12338, pp. 125–130. [Google Scholar]
- Cao, Z.; Hidalgo, G.; Simon, T.; Wei, S.; Sheikh, Y. OpenPose: Realtime multi-person 2D pose estimation using Part Affinity Fields. IEEE Trans. Pattern Anal. Mach. Intell. 2021, 43, 172–186. [Google Scholar] [CrossRef]
- Chawla, N.V.; Bowyer, K.W.; Hall, L.O.; Kegelmeyer, W.P. SMOTE: Synthetic Minority Over-sampling Technique. J. Artif. Intell. Res. 2002, 16, 321–357. [Google Scholar] [CrossRef]
Disclaimer/Publisher’s Note: The statements, opinions and data contained in all publications are solely those of the individual author(s) and contributor(s) and not of MDPI and/or the editor(s). MDPI and/or the editor(s) disclaim responsibility for any injury to people or property resulting from any ideas, methods, instructions or products referred to in the content. |
© 2022 by the authors. Licensee MDPI, Basel, Switzerland. This article is an open access article distributed under the terms and conditions of the Creative Commons Attribution (CC BY) license (https://creativecommons.org/licenses/by/4.0/).