Abstract
The classification and extraction of street tree geometry information in road scenes is crucial in urban forest biomass statistics and road safety. To address the problem of 3D fine extraction of street trees in complex road scenes, this paper designs and investigates a method for extracting street tree geometry and forest parameters from vehicle-mounted LiDAR point clouds in road scenes based on a Gaussian distributed regional growth algorithm and Voronoi range constraints. Firstly, a large number of non-tree and other noise points, such as ground points, buildings, shrubs and vehicle points, are filtered by applying multi-geometric features; then, the main trunk of the street tree is extracted based on the vertical linear features of the tree and the region growth algorithm based on Gaussian distribution; secondly, a Voronoi polygon constraint is established to segment the single tree canopy region with the main trunk center of mass; finally, based on the extracted locations of the street trees and their 3D points, the tree growth parameters of individual trees are obtained for informative management and biomass estimation by combining geometric statistical methods. In this paper, the experimental data from vehicle-borne LiDAR point clouds of different typical areas were selected to verify that the proposed Gaussian-distributed regional growth algorithm can achieve fine classification and extraction of tree growth parameters for different types of roadside trees, with accuracy, recall and F1 values reaching 96.34%, 97.22% and 96.45%, respectively. This research method can be used for the extraction of 3D fine classification of street trees in complex road environments, which in turn can provide support for the safety management of traffic facilities and forest biomass estimation in urban environments.
1. Introduction
Intelligent transportation unmanned autonomous driving urgently needs high-precision navigation maps, and obtaining information on the location and details of feature targets in complex road scenes through telemetry is an important support for achieving accurate positioning and navigation. In traffic management, the 3D geometric, topographical and semantic information of trees in road scenes has certain reference value for fine lane navigation, traffic accident analysis and vehicle safety assessment. For the construction of high-precision navigation maps and intelligent traffic management needs, fast and accurate extraction of relevant features in the driving environment is the current research hot spot in the construction of "smart cities". However, at the data source level, targets such as trees with large differences between top and bottom geometric features cannot be extracted finely by deciphering traditional single 2D images, and the current mainstream tree recognition extraction method uses 3D LiDAR (Light Detection and Ranging) as the data source. LiDAR technology has gradually become one of the important data sources for earth observation and target classification and identification with its ability to acquire information about the surrounding environment quickly and in real time. LiDAR is a high-precision sensor for measuring the position and shape of objects and forming high-quality 3D point cloud images [1,2], and it has been widely used in recent years for autonomous driving [3,4,5], 3D modeling [6,7,8,9], generating high-precision maps [10,11], tree biomass estimation [12,13] and other fields.
Street tree extraction is divided into airborne LiDAR and ground-based LiDAR (including vehicle-mounted, backpack and base station types) depending on the LiDAR data source. Airborne LiDAR point clouds are characterized by rapid acquisition and large geographical coverage; therefore, airborne LiDAR is mainly used for tree information extraction and biomass estimation, reducing data costs while preserving the extent of individual tree canopies and facilitating simplified tree population statistics extraction and biomass estimation. The ground-based LiDAR point cloud can capture the geometric information of trees with high accuracy in all directions, facilitating the extraction of salient features of individual trees to obtain accurate tree parameters for road environment refinement management and stock estimation.
Currently, tree classification extraction based on LiDAR point cloud data consists of two parts: extraction of trunks and extraction of crowns.
(1) Trunk extraction methods can be classified as: model-based extraction, structural feature-based extraction and knowledge template matching-based extraction methods.
1) Model-based extraction method: the tree trunk presents a cylindrical-like geometry. Liang et al. [14,15] and Cabo et al. [16] applied a 3D cylindrical model to extract the trunk; Lehtomaki et al. [17] applied coaxial cylinders of different size radii to fit the trunk; Li et al. [18] applied an adaptive radius cylindrical model to fit the trunk from the bottom up; Raumonen et al. [19] and Hackenberg et al. [20] used a columnar surface fitting approach; and there are also a number of methods that apply RANSAC (random sample consensus) linear fitting models based on verticality [21,22,23]. However, such methods for fitting trunks are strongly influenced by the density and geometry of trunk points, and regular model-fitting methods cannot extract the trunk completely when it is obscured by other types of feature points (e.g., bushes) or when the trunk is tilted to a large extent.
2) Extraction methods based on structural features: tree trunks have rod-like features with high verticality, density and continuity. Many studies have used clustering and segmentation methods to extract trunks based on structural features. Lehtomaki et al. [24] combined a priori knowledge of tree height, location and number of points to cluster and separate trunks; Archige et al. [25] used trunk orientation and geometric information to segment trunks; Xia et al. [26] used multi-scale shape and size geometric features to achieve extraction; Tao et al. [27] applied DBSCAN (Density-Based Spatial Clustering of Applications with Noise) to distinguish trunks by density; Hao et al. [28] extracted horizontal deviations of points from centroids in a hierarchical manner in the z-direction; and Wu et al. [29] searched for upper and lower voxels over a range of heights to achieve vowelized trunk extraction. Thanh et al. [30] applied trunk points using horizontal profile analysis and minimum vertical height criterion extraction, and Tang et al. [31] applied Euclidean distance clustering and minimum cut extraction. The computation of structural features depends on the sparsity of neighborhoods points and is influenced by noisy points, and the extraction accuracy of structural feature-based extraction methods is low for small target trunks and incomplete irregular trunks. Hui et al. [32] proposed a street tree extraction and segmentation method based on the spatial geometric features of object primitives, applying a normal vector angle threshold between neighborhood points to divide the original point cloud into different primitives, and extracting trunk points through the linear features between primitives and the aspect ratio of the primitive bounding box, which can improve the robustness and accuracy of stem detection, but there is room for improvement in the integrity performance of stem detection for some irregular stems, such as the detection of severely curved trunk points.
3) Extraction methods based on knowledge template matching: knowledge templates are combinations of features, and threshold combinations of different feature values can extract different features, separating tree trunks based on the combined feature differences between tree trunks and other feature targets. Pu et al. [33] achieved feature classification based on knowledge-based feature recognition, and super voxels are a feature fusion method; Wu [29] et al. and Fan [34] et al., in the segmentation process, applied feature hyper voxels of tree trunks; Li [21,35] combined prior knowledge, pole extraction and component separation to distinguish trees from other features; and Wang et al. [36] applied the Hough forest of hyper voxel neighborhoods to detect pole-like features including tree trunks. Voxelization is often applied to template matching methods, but the choice of size of voxelization is critical to the extraction results. Moreover, this method requires a large amount of a priori knowledge, and the processing is time consuming.
(2) The acquisition of a single tree canopy point cloud can be divided into two aspects: classification and extraction.
1) Methods for canopy classification: The canopy layer of trees is a distinct part that distinguishes them from other features and has significantly different features from other features in the application of machine learning classification methods. Huang et al. [37] used Euclidean clustering for point cloud coarse processing and then applied SVM to extract single trees; Huang and You [38] used statistical pole description to conform to the application of SVM for different pole features (including trees, streetlights, billboards, etc.); Wu et al. [39] used super voxel processing and then applied SVM and random forest processing to classify different pole features, respectively, as well as applying 3D convolutional neural networks for large-field point cloud classification [40]. The machine learning approach requires a large amount of manual labeling and training, is suitable for target classification in large scenes, is time consuming and has low extraction accuracy when targeting specified features, and the extraction accuracy depends on the sample.
2) Methods for canopy extraction: The canopy point cloud consists of a haphazard collection of leaves and branches extending from the tree trunk, and there are fewer regular features used for extraction. The current crown extraction relies on the location and geometric shape features of the trunk, and the crown points are attributed to the specified trunk by means of region growing algorithms and clustering. Weinman et al. [41] designed a mean drift clustering and shape analysis method to extract the crown points; Xu et al. [42] used a bottom-up hierarchical clustering method; Yadav et al. [43] and Xu et al. [44] attributed the canopy points to tree vertices.
The region growth algorithm is the most commonly used method for extracting crown points through trunk points. The application of the algorithm to tree extraction involves innovations in two main areas: the selection of seed points and the choice of growth paths (growth constraints). Firstly, there is the selection of seed points based on local elevation differences and density [45], the selection of seed points based on the criterion that the trunk is near the horizontal center of the canopy and smaller in diameter than the canopy [46], and the use of the planar coordinates of the center of gravity of the super voxels as seed points for growth [34]. Secondly, for the selection of growth paths, researchers have designed competing region growth [29], breadth-first search algorithms [34] and dual growth methods [46], and to solve the problem of inter-canopy layer contact or overlap, region growth algorithms combined with Dijkstra’s method [47,48] and Voronoi constraints [49,50,51] to achieve single tree segmentation. However, the shape and size of the tree, the distance between the tree and the LiDAR resulting in non-uniformity of the canopy density distribution and the absence of trunk points when the trunk is blocked by cars and green belts, which can easily lead to incorrect selection of seed point locations or incomplete growth during area growth, are still bottlenecks for improvement.
In summary, the above methods of street tree extraction have the following shortcomings:
- The extraction of trunks relies on more regular geometric features and is less accurate if parts of the trunk are bent or heavily obscured;
- The results of canopy extraction depend to a large extent on the position of the trunk, which cannot be extracted when the trunk is heavily obscured;
- When there is a large gap between the canopy and trunk or between the canopy and crown, it is not possible to apply the regional growth algorithm to extract the canopy layer;
- The informatization of tree geometric parameters is the key to forestry surveys and 3D applications, and there is a lack of methods for the fine-grained analysis of tree parameters.
To address the above-mentioned existing methods where the density of both trunk and crown points are unevenly distributed, this paper proposes a mobile LiDAR point cloud and region growth algorithm based on Gaussian distribution to extract the trunk and crown of the road environment and combines Voronoi (Tyson polygon) constrained segmentation to automate the segmentation of overlapping single trees to achieve 3D fine information and geometric parameter extraction of single trees.
2. Materials and Methods
2.1. Technical Process
In this paper, a region growth algorithm based on Gaussian distribution (GDRG) is designed to extract the point clouds of street trees in the road environment based on the mobile LiDAR point cloud data. Firstly, the original mobile LiDAR point cloud data is pre-processed, including ground point filtering and filtering the building point cloud based on the projected area of the building façade; then, the location of a single tree is located based on the vertical linear features of the tree trunk and the trunk point cloud is extracted by clustering based on the GDRG algorithm; secondly, the pseudo-trunk is removed based on the simple geometric rules of the trunk; then, the GDRG algorithm is applied again to extract the canopy point cloud of each tree separately. Finally, the Voronoi diagram constraint is used to partition the tree group and calculate the geometric features of the individual trees. The detailed technical flow of the method is shown in Figure 1.
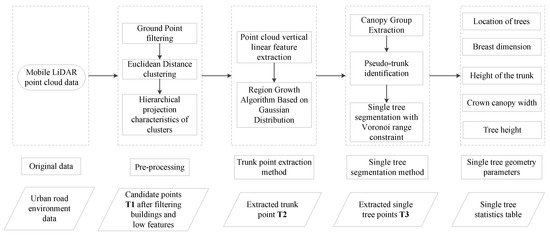
Figure 1.
Flow chart of street tree extraction from mobile LiDAR data.
2.2. Non-Tree Points Filtering Pre-Processing
The original point cloud is filtered by a slope-based filtering algorithm, and the candidate points are mainly the infrastructure target point clouds on both sides of the road, where the building façade points and some shrub points also interfere with the extraction of the tree trunk point cloud. This paper distinguishes and filters the non-tree point sets such as building facades, vehicles, shrub points and tree points by the difference in projection geometric scale between the building facades, vehicles and shrubs.
Candidate points were obtained by applying the Euclidean distance clustering algorithm to cluster clusters with a relative elevation threshold (1.5 m is used in this paper, is a range value, approximately equal to about 1/2 the height of a standard tree in the study area and is mainly used to separate part of the trunk from the crown for subsequent projection). Each cluster was stratified into upper and lower parts for each clustering cluster.
The overall and lower parts of the clusters are projected raster in the horizontal plane, with the number of pixels containing the point cloud for each cluster being for the overall raster projection, for the lower part raster projection, and the area of the enclosing rectangle being . The overall and lower part projections of the buildings, trees and shrubs are shown in Figure 2.
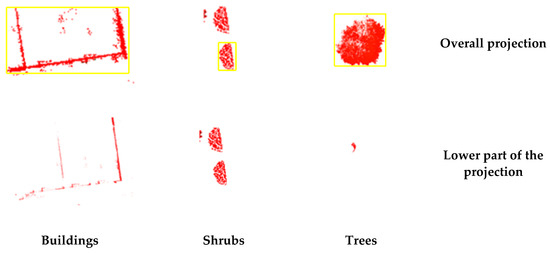
Figure 2.
Projection differences of different ground objects (the yellow border represents the outer rectangle of the clusters).
a. Area difference is calculated. The calculation formula is shown in (1).
In the candidate point , the projection of the building is striped and the empty raster inside the outer rectangle is the majority; the area difference is close to 0. The projection of other infrastructure such as trees is circular and there is no empty raster inside the outer rectangle; the area difference is close to 1. Calculate the average value of the area difference for all projection units, then eliminate the projection cells with an area difference less than , so the building point can be removed.
b. Proportional calculation . The calculation formula is shown in (2).
The ratio of vehicles and shrubs is close to 1; while the ratio of trees is close to 0, calculate the average value of the proportional factor for all projection units, and eliminate the projection cells with a proportional factor more than , by which the shrub and vehicle points can be removed.
After removing some of the noisy clusters, the candidate point was obtained.
2.3. Regional Growth Algorithm for Gaussian Distribution (GDRG) to Extract Trunks
The trunk portion of the street tree in candidate point has strong vertical geometric properties, which can be used to extract part of the trunk point cloud and locate the position of the trunk. The verticality eigenvalues are calculated via principal component analysis (PCA) [52,53] of the global point cloud and solution for the eigenvalues, which are calculated as follows (3).
indicates the verticality eigenvalue of each point in the range 0 to 1; and ( > ) are the first and second eigenvalues, respectively.
The candidate point set includes a large number of trees and some point clouds containing pole parts such as streetlights and billboards. Calculating the vertical linear features can extract the pole parts of different infrastructures and filter part of the point cloud set that does not have vertical features (such as cars and canopy of trees). The verticality of the point cloud is calculated based on the neighborhood points of each point, then some points are incorrectly represented as vertical, e.g., the points in the tree canopy have irregularity and the vertical feature values of some points are calculated to meet the threshold, or some points in the tree trunk are lacking of extraction from the same trunk because they are obscured and subject to neighborhood noise points that do not reach the threshold.
The candidate point set was extracted after verticality to obtain a point set with missing points in the pole part of the infrastructure point cloud and to extract an incomplete trunk point set.
This section proposes a method for finding missing rod points in the extracted point set from the original point cloud data, a region growth algorithm based on Gaussian distribution (GDRG). The extracted points are used as seed points to find the points that match the rules in the original point cloud through the Gaussian distribution law, and the grown points are clustered and merged into a single trunk point set.
The GDRG algorithm is an interval estimation method that focuses on the points within the confidence interval of the Gaussian distribution in the sample point set as the candidate seeds for growth. Confidence interval estimation for a Gaussian distribution involves creating an interval containing the parameters to be estimated for the normal distribution of the sample at a given probability value. This confidence interval [] is an interval of values derived from the sample that may contain the overall parameters and is usually obtained by adding or subtracting the estimation error from the sample statistic. The lower and upper limits of the confidence interval and are calculated in (4).
where denotes the mean of the estimated parameters; denotes the value in the table of normally distributed values at a confidence level of ; n denotes the number of samples; denotes the standard deviation of the sample, reflecting the degree of dispersion of the whole sample from the sample mean; and is the standard error of the sample.
The seed points are selected from the trunk points and searched in the neighborhood. The set of points searched is used as a sample, and the difference between the sample points and the seed points in the and directions, and , respectively, are used as parameters for interval estimation. The distribution of the trunk point set is robust, with possible trunk and seed points having parameter errors within the confidence interval of the Gaussian distribution, while the outliers have larger errors and are not within the confidence interval, and the points within the confidence interval are added to the growing point set. The GDRG algorithm is shown in Figure 3. The pseudocode of the algorithm set is in Table 1.
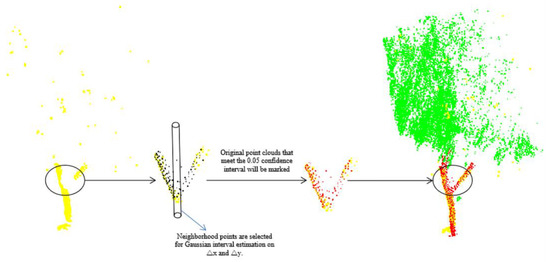
Figure 3.
Region growth algorithm based on Gaussian distribution (yellow points represent partial trunk points extracted by vertical features, black points represent points in the original data, red points represent tree points grown by Gaussian distribution algorithm, and green points are tree crown points).

Table 1.
Algorithm table for GDRG.
Find the black neighborhood points (points to be judged) based on the yellow points (points that have grown). Randomly select a yellow point as the initial seed point to find the 20 nearest neighbor points, calculate the distance difference between the neighborhood points and the seed point in the x and y directions, and then calculate the Gaussian distribution of the difference, set to establish a confidence level of 0.05 confidence interval. The points that meet this confidence interval are added to the red point set, and the next nearest point in the remaining neighborhood point set is repeatedly grown as a new seed point. The algorithm is terminated when there are no new points to be added or when all remaining points to be added do not qualify for the confidence interval.
The set of points that ends the growth is the set of clustering points of the first trunk; the new initial seed points that are not marked by the growth are reselected in the candidate point set, and the algorithm is repeated to obtain the set of clustering points of the next N trunks, which is the set of clustering points of the trunks in the candidate point set T2.
The extracted point set is processed by a GDRG algorithm to obtain a candidate point set T2. The candidate point set T2 complements the clustering of various rod point sets, but there are still pseudo-rod point sets clustered due to the irregular growth of the canopy point cloud.
2.4. Single Tree Segmentation Method with Voronoi Range Constraint
2.4.1. Canopy Group Extraction
The rod clusters were labeled in the original point cloud and the canopy point set was grown using the rod point set as seed points again applying an RG (regional growth) algorithm with optimized seed points method (Figure 4). Three improvements were made to the RG algorithm:
(1) Due to the distance between some of the tree canopies and the distance at the trunk apex, the neighborhood search of the RG algorithm for the canopies applies the nearest neighbor method, using the trunk apex as the initial point to search for growth.
(2) To prevent seed points from growing from the trunk vertex down to the noise point, the height of the next canopy candidate at the initial seed point should be greater than the initial seed point height .
(3) Due to the large gaps between some of the canopies, a vertical constraint is added to the selection of the next canopy candidate point of the initial seed point, i.e., the next batch of seed points of the trunk vertex is the nearest neighbor of a vertex within a cylindrical range with the vertex as the center and a horizontal radius and a height greater than .
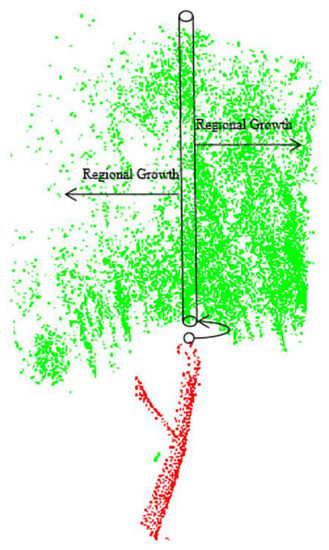
Figure 4.
RG algorithm with optimized seed points method (red points represent trunk points, green points are tree crown points, the red point in the black circle is the top point of the trunk, the set of points in the the black cylinder are candidate seed points, and the arrows on the cylinder represent the subsequent growth direction of the candidate points).
2.4.2. Pseudo-trunk Identification
The trunk extracted in Section 2.3 above has a partial set of pseudo-trunk points. Considering that there may be trunks in the study area that are too heavily obscured to extract the correct trunk and grow a crown, the pseudo-pole sections and pseudo-trees were identified after the full crown was grown through the pseudo-pole.
Pseudo-trunks were identified by applying a crown-to-trunk matching method. Each full-grown canopy cluster has trunks. A minimum enclosing box is applied to the set of pseudo-trunk points in each canopy to calculate geometric features and set geometric rule thresholds for the different features, and the set of pseudo-trunk points that do not meet the threshold conditions are eliminated. The geometric rules include: (1) Volume , which calculates the volume of the rectangular minimum enclosing box for each set of rod clustered points; this rule is valid for the recognition of streetlights and billboards. (2) Height difference , the height difference from the lowest to the highest point of the enclosing box of the rod part of the clustering cluster; this rule is valid for the recognition of partially noisy points. (3) Groundedness , calculation of the average DEM of each region and the difference in elevation between the lowest points of the minimum enclosing boxes of the clustered clusters. Pseudo-clustered clusters of poles larger than the threshold are excluded, and this rule is valid for the identification of pseudo-trunks in the canopy.
The eligible rod clusters are identified after filtering by the three rules above, and the correct trunk is matched to the corresponding canopy. If a crown has no matching trunk, the tree is severely missing trunk points; if a crown cluster has multiple trunks, the canopy area may overlap tree groups and is a focus for subsequent single wood segmentation.
2.4.3. Single Tree Segmentation Method with Voronoi Range Constraint
In the experimental area, there is an overlapping situation between arrays, where trees are close to each other or the canopies grow in opposite directions and overlap and shade each other, resulting in multiple trees clustering into one category after the area has grown. In order to partition single trees, this paper applies Voronoi diagrams (Tyson polygons) [52] to solve the problem of multiple trees overlapping each other.
The solution for the 3D gravity of each trunk cluster is used to represent the true location of each tree, and the gravity is displayed as 3D points. The absence of noise points above the set of tree points in the candidate points and the fact that each tree is not of the same height results in the coordinates of each prime not being uniform in height. The main purpose of the method in this section is to segment overlapping tree groups, and if a 3D Voronoi diagram is created with the gravity coordinates, it may lead to over-segmentation of the different tree canopies, so the gravity is projected in 2D. The 2D Voronoi diagram automatically divides the plane into n polygonal regions centered on the gravity according to the positions of the gravities in the Euclidean plane, and the polygons are non-overlapping and adjacent.
After the 2D projection of the center of mass, a Voronoi diagram is created for the 2D center of mass points at the same height to determine the extent of the plane to which a single tree belongs, and then all canopy points with height information within the plane are obtained. As shown in Figure 5, the Voronoi diagram interval partition is established with the centroid point of the trunk in the experimental area.

Figure 5.
Segmentation of overlapping trees by Voronoi diagram (The black points represents the planar projection of the trunk centroid points).
After the candidate points are filtered via the noise point filtering process, the shrub points within the canopy range are eliminated and the candidate points in each polygon buffer created with the Voronoi diagram area contain only tree points. The candidate points in each buffer are extracted separately to achieve automatic segmentation of a single tree, and a single tree point cluster is obtained.
2.5. Calculation of Tree Geometry Parameters
(1) Position of the street tree. In Section 2.4.3, the coordinates of the projection of the center of mass of the trunk on the XOY plane are solved to represent the position of the street tree.
(2) Breast dimension. The diameter of the raster cell after projection of the trunk cluster in the XOY plane is the breast dimension.
(3) Trunk height. The height of the apex of the trunk cluster is the height of the trunk.
(4) Canopy crown width. The extracted canopy is projected on the XOY plane to approximate the shape of a circle, and the diameter calculated by the formula for the area of a circle is the canopy width of each tree.
(5) Tree height. The height of the apex of the tree crown.
3. Results
3.1. Data Sources and Threshold Parameters
The experimental area of this paper is vehicle-mounted LiDAR urban environment data from the competition data of the 7th National LiDAR Conference Data Processing Competition in 2021, which is the road scene around the College of Surveying and Mapping and the College of Civil Engineering of Henan University of Technology acquired by SSW-2 vehicle-mounted laser scanner laser point cloud, and features include ground, street trees, buildings, green belts, public infrastructure, pedestrians, etc. Among them, there are independent street trees, connected street trees, and there are also street trees and streetlights and other cross phenomena; because of a small number of street trees point cloud due to obscuration and other reasons, there will be some missing.
Due to the presence of different tree species, this study divided the experimental area into three parts based on the distribution of the three trees in the current experimental area (including small poplar trees, large poplar trees and willow) (Figure 6). Experimental areas and are dominated by small poplar trees with a small number of large poplar trees, while experimental area contains mainly willows and large poplar trees. The geometric characteristics of the three species differ from each other, with the small poplar trees having the same characteristics as the common trees in the road environment, showing a regular shaped trunk with a denser canopy; the large poplar trees differs from the small poplar trees in that the canopy has more branches and leaves but larger gaps between the leaves, and the canopy is much less dense than the small poplar trees in terms of the morphology of the point clouds; in contrast to the growth direction of the other species, the willow has a pendulous canopy and In contrast to the other species, the willow canopy is pendulous and shows a tendency to extend downwards, with the point cloud pattern showing branches going vertically downwards from the top of the tree and obscuring part of the trunk.
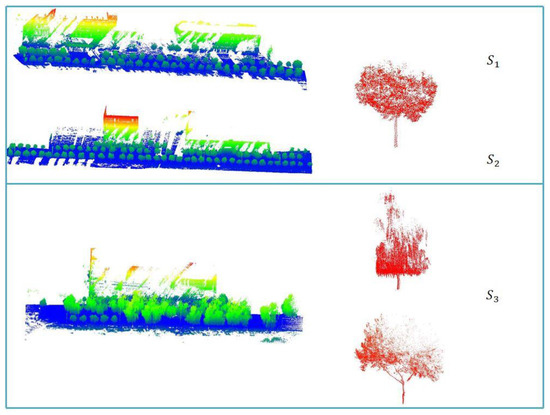
Figure 6.
Overview of the study area: On the left is the schematic diagram of the three study areas, and on the right is the main tree species in each study area (in the study areas and , the tree species is small poplar tree; is willow and large poplar tree).
The point cloud data from the three experimental areas and the representation of the different tree species are shown in Figure 6, and statistical information on the data from the experimental areas is presented in Table 2.

Table 2.
Point cloud data information statistics result.
The parameter threshold statistics for the main algorithms in this paper are shown in Table 3, with a linear feature linearity threshold greater than 0.8.

Table 3.
Algorithm parameter threshold setting.
3.2. Experimental Results
The results of the filtered pre-processing of the three study areas are shown in Figure 6 (, and are shown counterclockwise in Figure 6, respectively). In the flatter school area, the slope filtering is very effective in removing ground points, and the rules set up in this study for removing noise points such as buildings, vehicles and pedestrians also have some applicability, including two indicators for area difference and scale calculation . As can be seen in Figure 7, point clouds with clusters that better match the characteristics of buildings, shrubs and vehicles were removed. However, there are still some points that are not removed, such as the residual points of buildings in the blue circle in Figure 7. Due to the incomplete scan of the building as a whole, some small parts of the building are separated from the overall cluster after applying Euclidean clustering, and such small parts meet the rules for filter pre-processing and are not eliminated in this step.
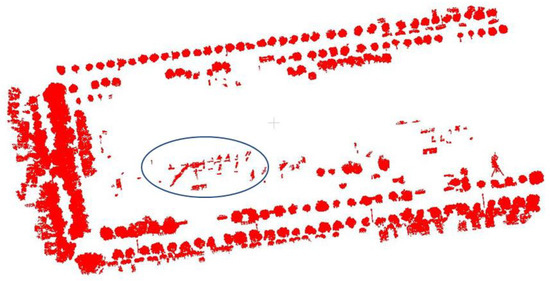
Figure 7.
Filtering and pre-processing results (building residues in blue circles).
The non-tree points left by the filter pre-processing include some building points and bicycle points that are closely connected to tree trunks, etc. The building points are not excluded in the area difference projection filtering because the top surface has a projected width. The bicycle points close to the tree are in the same cluster as the tree trunk and are retained in the scale calculation filtering because they meet the threshold conditions.
The results obtained after the vertical linear extraction () process and the trunk point extraction process based on the GDRG algorithm are shown in Figure 8. The building points left by the filtering pre-processing are further simplified by the vertical linear extraction process, keeping the more clearly expressed components such as doors, windows and columns. The bicycles near the trunk of the tree are extracted by vertical linear extraction, and the connection with the trunk points is removed, so that only a small number of bicycle points are retained.
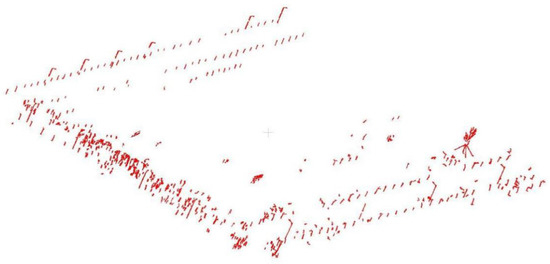
Figure 8.
Tree trunk extraction by the GDRG algorithm.
The GDRG algorithm was subsequently designed to extract the complete set of rod points from the original data using points with vertical linear characteristics as the initial seed points, while the trunk point set accounts for the majority of the rod point set. GDRG algorithm is suitable for a variety of irregular trunks, and the algorithm for region growing is more suitable for irregular cluster extraction than the previously proposed fitting methods based on the class cylinder model, because region growing uses the neighborhood The idea of point planning marks the points that match the conditions as the same class, but also considers the case of overfitting of neighborhood points. Therefore, this paper adds the constraint of Gaussian distribution of neighborhood points to the region growing algorithm. The GDRG algorithm takes the initial seed point as the reference point, and continuously eliminates the unqualified points by adding the neighborhood points of subsequent candidate seed points to the set of initial seed points and performing Gaussian distribution confidence interval ( = 0.05) judgement, so as to obtain the final set of robust trunk points. Additionally, when some of the canopy points are added to the initial set of seed points and a Gaussian distribution judgment in the and directions is performed, the canopy points that do not meet the threshold interval will be eliminated. At the same time, the seed points extracted from the vertical linear feature do not include the canopy points, so the GDRG algorithm can take into account the overfitting problem and extract the complete set of trunk candidates.
As not all points with vertical linear features are trunk points, such as the three cases in Figure 9, the street light poles in Figure 9a have vertical features and the complete streetlights are extracted after applying the GDRG algorithm; for the residual points of the buildings in Figure 9b, some of the door posts conform to the feature rules and some of the door and window contour points are extracted after applying the same area growth; the case in Figure 9c exists in , where the vertical features of the willow tree are obvious and the extracted clusters of tufts are more than the trunk and gathered around the trunk, which easily interferes with the correct identification of the trunk. Therefore, this paper designed a method to eliminate pseudo-trunks, and the result of trunk point distribution is shown in Figure 10. Pseudo-trunks were identified and eliminated under the constraint of geometric rules, including volume , height difference and groundability , but some of the tufts were closer to the ground and larger in size, resulting in a single tree with multiple trunks.
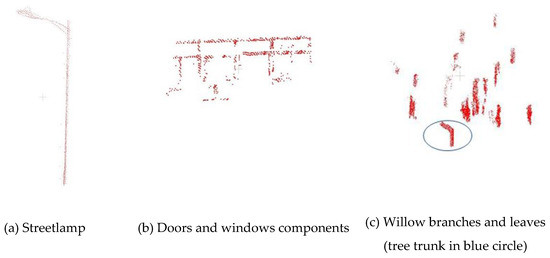
Figure 9.
The pseudo-tree trunk was extracted.

Figure 10.
Results of tree trunk extraction in the study area.
The results of growing a crown based on pseudo-trunk vertices and identifying the pseudo-tree results (single tree extraction results) are shown in Figure 11. The RG algorithm with optimized seed points is used to extract trees with large gaps between trunk points. Using the nearest neighbor, vertical constraint and height constraint to find seed points will avoid one of the pitfalls of the area growth algorithm, namely that the seed points go in the direction of growth that leads to dead loops or incomplete growth, to ensure that the overall growth direction is cascaded from the bottom up along the trunk position and to reduce the chance of growth towards neighboring trees.

Figure 11.
Single tree extraction results.
After canopy group extraction, there are still many overlapping canopy layers in the study area. The results of automatically dividing the range of partially overlapping trees by generating Voronoi diagrams with trunk masses are shown in Figure 12. Although the attribution of some points between the overlapping trees is disputed, the automatic division is far superior to manual visual interpretation of the segmentation.
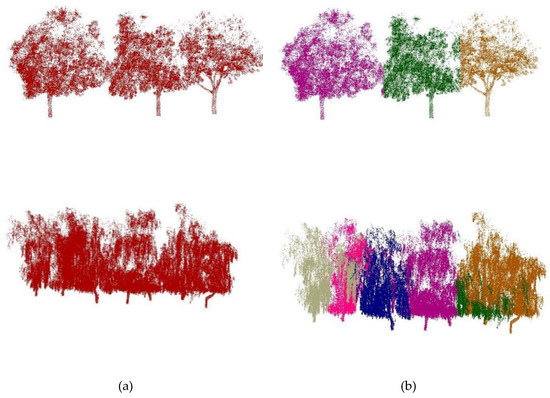
Figure 12.
Results of single tree segmentation constrained by Voronoi graph. (a) represents the unsegmented tree points, (b) represents the single tree result represented by different colors after Voronoi graph segmentation.
The method in this paper conducts experiments for three datasets, based on the original mobile LiDAR data with single trees separated by manual visual inspection as the real reference data, while three metrics, accuracy , recall and , are selected to quantitatively evaluate the results of the tree extraction experiments, which are calculated in Equations (5)–(7).
denotes the true value of the number of single trees extracted from the study area; denotes the number of non-trees extracted from the study area by the algorithm in this paper; and denotes the number of single trees that the algorithm in this paper failed to extract from the study area. The results of the extraction of single trees from the three study areas by the method in this paper are shown in Figure 11, and the results of the quantitative evaluation are shown in Table 4.

Table 4.
Accuracy evaluation of the experimental results.
4. Discussion
4.1. Comparative Analysis
In order to objectively evaluate the performance of our method in segmenting single street trees within the data of the 7th National LiDAR Conference Data Processing Competition 2021, the latest validated method of Hui et al. [32] was chosen for comparative analysis, who used the same experimental area as in this paper. Hui et al. proposed a street tree extraction and segmentation method based on the spatial geometric features of object primitives, which applying a normal vector angle threshold between neighborhood points to divide the original point cloud into different primitives, extracting trunk points through the linear features between primitives and the aspect ratio of the primitive bounding box, and proposing a voxel shortest path analysis method to obtain an individual tree optimization separation result. Hui et al. method uses five metrics, namely extraction rate, matching rate, commission error, omission error and F1 score, to evaluate the accuracy of individual tree segmentation results, respectively, which are slightly different from the accuracy evaluation metrics in this paper. Where the matching rate is the same as the recall in this paper, the F1-score is the same as the F1-score, and the accuracy is equal to 1 minus the commission error. The results of Hui et al.’s method accuracy evaluation of conversion and a comparison with our method are shown in Table 5.

Table 5.
Comparison of precision evaluation results.
As can be seen from Table 4, the difference in recall between the two methods for extracting single trees is not significant, while the accuracy of our method is much greater than that of Hui et al. It is shown that both methods provide a more complete extraction of street trees in the experimental area, but the advantage of our method is that there is less identification of other non-tree points as single trees. Due to the primitive connectivity proposed by Hui et al.’s method, some of the non-tree points connected to tree points are extracted, which in turn affects the accuracy of the extraction. Moreover, there are many weeping willows in the experimental area , and these willow branches close to the ground are often mistaken for branches, thus increasing the number of incorrectly extracted row trees [32] and leading to a lower extraction accuracy by the method of Hui et al. In contrast, we propose a pseudo-trunk identification method that improves the accuracy of willow extraction in through the geometric features and groundedness of candidate trunk clusters that distinguish them from pendants. Furthermore, in terms of completeness of irregular trunk (stem) point extraction, Hui et al.’s method of extracting trunk points through linear features between primitives and the aspect ratio of the primitive bounding box is suitable for inclined trunk extraction. However, there were willows with partially bent trunks in the experimental area , and the method of Hui et al. was only able to extract some of the trunk points, although the remaining trunk points are planned into the complete single tree when the tree points are subsequently extracted based on primitive connectivity, but our GDRG algorithm still outperforms the method of Hui et al. on the integrity of the trunk extraction.
4.2. Causes of Tree Errors and Missing Extractions
1) Trees filtered too close to buildings. This type of error is mainly present in and , as shown in Figure 13 (five trees in each blue circle), when the tree canopy is too close to the building, the application of Euclidean distance clustering in the filtering pre-processing step will result in the trees and buildings being combined into one cluster and filtered in the next step of the projection rule processing. Due to the trees being too close to the building, the number of trees missed in and is 10 and 6, respectively. It can be seen from Figure 11 that the subsequent extraction of trunks of single trees by the GDRG algorithm will be correctly extracted and significantly improved, if the trees behave as overlapping groups after ignoring the influence of buildings. The recall rates in the study areas and is improved by about 10.87% and 11.76%, respectively.
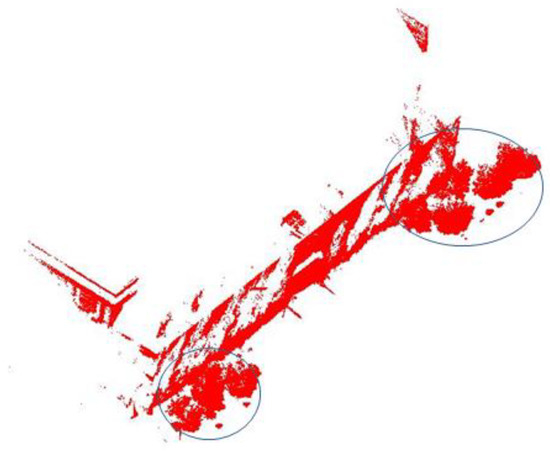
Figure 13.
Accuracy errors by trees near buildings.
The filtering pre-processing step is a secondary algorithm before tree extraction, the key algorithm in this paper is in the subsequent extraction, so if replacing part of the pre-processing process or adding certain rule constraints can solve this kind of problem. The extraction accuracy of the study area is significantly improved after solving the preprocessing problem, indicating that the algorithm in this paper has high applicability to the extraction results of trees with shape and distribution patterns in .
2) Error extraction of tree associated parts. In the study areas and , part of the infrastructure connected to the tree was identified as the same cluster extracted. The street light pole shown in Figure 14a was not identified as a pseudo-trunk because it was partially obscured and part of the pole was inside the tree, so the overhanging pole was extracted simultaneously when the canopy was grown by applying the GDRG algorithm. As shown in Figure 14b, the top of the billboard is connected to the canopy and the small size of the billboard pole is identified as a pseudo-trunk, and canopy growth with the billboard part resulted in incorrect extraction.
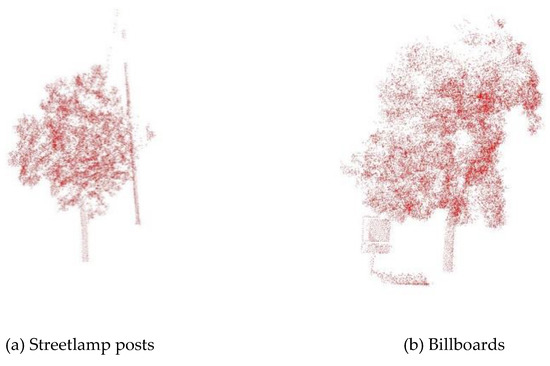
Figure 14.
Bad extraction of infrastructure points.
3) The trunk points were not extracted because they were non-significant. The trees that were not extracted in were due to a low number of trunk points, as the trunks of these trees were not extracted by applying the GDRG algorithm or the volume of the trunk clusters did not meet the threshold to be identified as street light poles in the pseudo-pole identification and were rejected; thus, it was not possible to grow the canopy based on the trunks resulting in missing extractions.
Another situation where a single tree cannot be extracted and segmented occurs in , where the five trees shown in Figure 15a (represented by different colors) are processed by the algorithm to obtain three trees with inadequate segmentation shown in Figure 15b (red boxes indicate different segmentation results). The problem of overgrowth of the blue and yellow trees is caused by the fact that the red and green trunks have fewer points that match the linear feature and are thus eliminated by the identification of pseudo-trunks. Once the other three trees have grown, the single tree segmentation used for the Voronoi constraint requires five trunk centroids, but the actual calculation results in only three trunk centroids, and the three Voronoi diagram ranges created with the three trunk centroids incorrectly segment five trees.
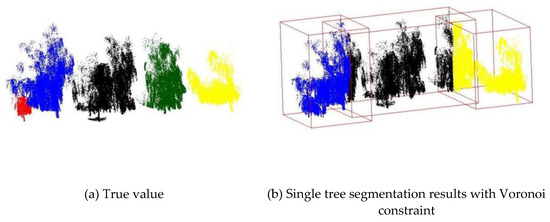
Figure 15.
Willow under segmentation results.
4.3. Comparative Advantages of Our Extraction Method
1) Problems oriented towards the bending of the trunk. There are many irregularly shaped tree trunks in the study area of this paper, and the inability to obtain complete trunk backside points due to vehicle-mounted LiDAR scanning along the road causes some of the trunks to appear circular in their horizontal projection. Model-based extraction methods such as those applied by Liang et al. [14,15] and Cabo et al. [16] to extract tree trunks using a 3D cylindrical model are influenced by the density and geometry of the trunk points, and such methods will not be able to be applied to the extraction of curved tree trunks in the study area of this paper. A single willow tree in the study area is shown in Figure 16, and the trunk of the tree has an irregular shape. When the distance threshold of the bent trunk point is greater than the fitted radius, all trunk points from that point onwards cannot be extracted but the algorithm in this paper can still extract the trunk in its entirety. In contrast to the model fitting approach, although the irregular trunk points cannot be extracted by applying only a single feature extraction method (e.g., vertical linear features in this paper), the extracted feature points can be used to locate the trunk points, and the remaining trunk points can be extracted by applying a GDRG algorithm to use the feature trunk points as seed points. At the same time, the rule of Gaussian distribution prevents the wrong extraction of the crown point tree from the original data. In the critical region between the trunk point and the crown point, although there are some crown points in the neighborhood of the trunk point, these crown points are not within the confidence interval of the Gaussian distribution, thus avoiding the seed point growing in the direction of the crown point.
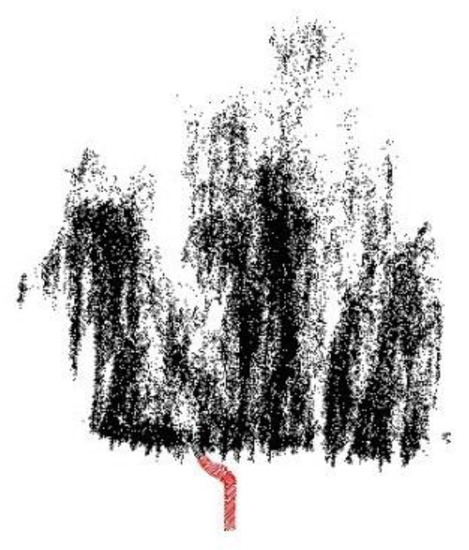
Figure 16.
Results of tree trunk bending (the red points represent tree trunk points extracted by our method).
2) Problems oriented towards the low canopy point density. In the case of poplar tree in Figure 17, for example, the method of selecting seed points based on local elevation differences and density by Yue et al. [46] was only able to extract some of the canopy points that were less distant from the apex of the trunk due to the large spacing between the majority of canopy points and trunk points; Li et al. [47] selected seed points based on the criterion that the trunk was near the horizontal center of the crown and smaller in diameter than the crown, but poplar trees was unable to extract the trunk points due to missing or irregularly distributed canopy points. Li et al. [47] selected seed points based on the criterion that the trunk is near the horizontal center of the crown and smaller in diameter than the crown, but poplar trees have a large offset in the center due to missing or irregularly distributed canopy points, and in this case, Li et al.’s method was unable to extract the trunk points.
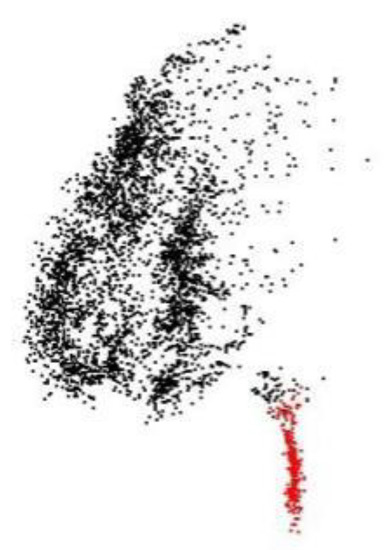
Figure 17.
Extraction results of trees with large canopy gaps.
In this paper, the RG algorithm with optimized seed points using the extracted trunk vertices as initial points can solve most of the problems of large canopy gaps.
3) Problems oriented towards the severe trunk point missing. When trunk points are severely missing, the salient features of trunk points cannot be applied, so the three types of methods summarized above for extracting trunk points are unable to extract the trunk and extract the canopy points. The method in this paper mainly solves the extraction problem of missing trunk points of poplar trees, see the extraction results in Figure 18 (the points in the red box are the extraction results of non-trunk trees). Part of the top trunk points are hidden in the canopy, and the trunk is extracted in the canopy extraction step based on the trunk top points by applying the GDRG algorithm with optimized seed points. However, the trunk points are rejected in the pseudo-pole identification resulting in part of the tree canopy not being matched to the trunk, but the willow trunk in was mostly hidden in the tufts and canopies, and the extracted trunk points were identified as pseudo-trunks due to non-compliance with volume and height rules and the overlapping of willow trees resulting in multiple willow trees sharing the same trunk, so the problem of missing willow trunk points has not been resolved.
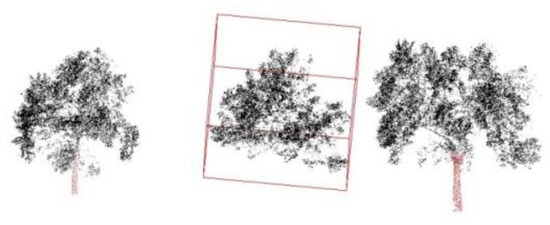
Figure 18.
Extraction results of poplar tree without trunk.
4.4. Error Analysis of Tree Parameter Extraction
In this paper, four parameters of trees in the study area were counted: tree center position, tree height, crown width, breast dimension and trunk height. Table 6 shows the information on the parameters of the trees represented by the intercepted three experimental blocks numbered 1, 10 and 20, respectively.

Table 6.
Statistical table of geometric parameters of trees.
In this paper, we only analyze the position of the trees for error, because the geometry of the trees in the experimental area is not completely regular, which tends to cause a large overall error in the parameters. Trunk height and tree height errors are easily influenced by noise points, and errors will increase substantially when noise points are identified with the corresponding parameter values; crown width is automatically segmented by the Voronoi constraint, and the attribution of crown points in overlapping tree groups is the main cause of crown width errors; the error in breast diameter for regular trunks is small, but the breast diameter calculated for curved trunks is a multiple of the true breast diameter, which is likely to cause large coarse differences.
The overall error of the tree centers in the three study areas is shown in Table 7. It can be seen that the overall error in is 2.378 m, which is a large difference from S1 and because the trunk of some willows were not extracted in the single tree extraction results of and the canopy of this part of the willow was attributed to the neighboring willow with trunk, so this type of willow shares the same trunk with the neighboring willow, as in the case of the under-segmented willow in Figure 15b. Therefore, when calculating the standard deviation of position, the standard deviation of the distance between the center of the trunk and the shared trunk in the true value will be calculated, resulting in a large coarse difference affecting the overall error.

Table 7.
Standard deviation of center position.
The centroid distance error of the trees in and is within 15 cm, and the overall error of only reaches 3.4 cm, indicating the applicability of this paper’s GDRG algorithm for extraction single poplar tree trunks.
5. Conclusions
This paper proposes a technique for automatic refinement extraction of roadside trees in vehicle-mounted LiDAR point clouds based on a Gaussian distribution of the region growth (GDRG) algorithm. A statistical method is designed and studied for single roadside tree segmentation and parameter informatization, including the GDRG algorithm based on trunk points and optimized seed points, single tree segmentation with crown point Voronoi diagram constraints and tree geometric parameter calculation, which can provide support for road environmental safety informatization, road safety information management and forest biomass estimation. This method solves, to a certain extent, the problems of classification extraction of curved or irregular tree trunks, low completeness of results due to small density of crown points and serious missing tree trunk points. At the same time, our method has more parameter thresholds and lower accuracy in the segmentation and extraction of willow tree groups due to the connection of buildings and trees; these issues are subject to further study in the future. In terms of application, the accurate extraction of the geometric parameters of the street tree point cloud is only part of the equation. The problem of missing target points due to points being obscured during the scanning process also requires tracking and completion of the missing points. The extracted points are used for 3D reconstruction to meet the needs of high-precision map construction.
Author Contributions
Conceptualization, Y.W.; methodology, Y.W., Y.L. and H.C.; software, Y.W. and Y.L.; validation, Y.L. and H.C.; formal analysis, Y.L. and H.C.; investigation, Y.L. and H.C.; resources, Y.W. and Y.L.; data curation, H.C. and S.L.; writing—original draft preparation, Y.L., H.C. and S.L.; writing—review and editing, Y.W. and Y.L.; visualization, Y.L. and H.C.; supervision, Y.W.; project administration, Y.W. All authors have read and agreed to the published version of the manuscript.
Funding
This research was funded by the National Natural Science Foundation of China (Nos. 41971423 and 31972951), the Natural Science Foundation of Hunan Province (No. 2020JJ3020) and Open Fund of State Key Laboratory of Public Big Data of Guizhou University (No. PBD2022-02).
Institutional Review Board Statement
Not applicable.
Informed Consent Statement
Not applicable.
Data Availability Statement
No new data were created or analyzed in this study. Data sharing is not applicable to this article.
Conflicts of Interest
The authors declare no conflict of interest.
References
- Giorgi, L.; Bruno, G.; Nijhof, J.; Urban, P.J.; Vall-Llosera, G.; Ponzini, F.; Ladvánszky, J. Subcarrier multiplexing RF plans for analog radio over fiber in heterogeneous networks. J. Light. Technol. 2016, 34, 3859–3866. [Google Scholar] [CrossRef]
- Nagy, B.; Benedek, C. 3D CNN-based semantic labeling approach for mobile laser scanning data. IEEE Sens. J. 2019, 19, 10034–10045. [Google Scholar] [CrossRef]
- Lin, X.; Wang, F.; Yang, B.; Zhang, W. Autonomous vehicle localization with prior visual point cloud map constraints in GNSS-challenged environments. Remote Sens. 2021, 13, 506. [Google Scholar] [CrossRef]
- Wang, Z.; Yu, B.; Chen, J.; Liu, C.; Zhan, K.; Sui, X.; Xue, Y.; Li, J. Research on lidar point cloud segmentation and collision detection algorithm. In Proceedings of the 2019 6th International Conference on Information Science and Control Engineering (ICISCE), Shanghai, China, 20–22 December 2019; IEEE: New York, NY, USA, 2019; pp. 475–479. [Google Scholar]
- Yin, D.; Zhang, Q.; Liu, J.; Liang, X.; Wang, Y.; Chen, S.; Maanpää, J. Interest point detection from multi-beam light detection and ranging point cloud using unsupervised convolutional neural network. IET Image Process. 2020, 15, 369–377. [Google Scholar] [CrossRef]
- Sarakinou, I.; Papadimitriou, K.; Georgoula, O.; Patias, P. Underwater 3D modeling: Image enhancement and point cloud filtering. Int. Arch. Photogramm. Remote Sens. Spat. Inf. Sci. 2016, XLI-B2, 441–447. [Google Scholar] [CrossRef]
- Yu, C.; Ji, F.; Xue, J. Cutting Plane Based Cylinder Fitting Method With Incomplete Point Cloud Data for Digital Fringe Projection. IEEE Access 2020, 8, 149385–149401. [Google Scholar] [CrossRef]
- Tachella, J.; Altmann, Y.; Mellado, N.; McCarthy, A.; Tobin, R.; Buller, G.S.; Tourneret, J.; McLaughlin, S. Real-time 3D reconstruction from single-photon lidar data using plug-and-play point cloud denoisers. Nat. Commun. 2019, 10, 4984. [Google Scholar] [CrossRef]
- Tachella, J.; Altmann, Y.; Ren, X.; McCarthy, A.; Buller, G.S.; Mclaughlin, S.; Tourneret, J.Y. Bayesian 3D reconstruction of complex scenes from single-photon lidar data. SIAM J. Imaging Sci. 2019, 12, 521–550. [Google Scholar] [CrossRef]
- Mi, X.; Yang, B.; Dong, Z.; Chen, C.; Gu, J. Automated 3D Road Boundary Extraction and Vectorization Using MLS Point Clouds. IEEE Trans. Intell. Transp. Syst. 2021, 23, 5287–5297. [Google Scholar] [CrossRef]
- Zai, D.; Li, J.; Guo, Y.; Cheng, M.; Lin, Y.; Luo, H.; Wang, C. 3-D road boundary extraction from mobile laser scanning data via supervoxels and graph cuts. IEEE Trans. Intell. Transp. Syst. 2017, 19, 802–813. [Google Scholar] [CrossRef]
- Xu, D.; Wang, H.; Xu, W.; Luan, Z.; Xu, X. LiDAR applications to estimate forest biomass at individual tree scale: Opportunities, challenges and future perspectives. Forests 2021, 12, 550. [Google Scholar] [CrossRef]
- Lu, J.; Wang, H.; Qin, S.; Cao, L.; Pu, R.; Li, G.; Sun, J. Estimation of aboveground biomass of Robinia pseudoacacia forest in the Yellow River Delta based on UAV and Backpack LiDAR point clouds. Int. J. Appl. Earth Obs. Geoinf. 2020, 86, 102014. [Google Scholar] [CrossRef]
- Liang, X.; Hyyppä, J.; Kukko, A.; Kaartinen, H.; Jaakkola, A.; Yu, X. The Use of a Mobile Laser Scanning System for Mapping Large Forest Plots. IEEE Geosci. Remote Sens. Lett. 2014, 11, 1504–1508. [Google Scholar] [CrossRef]
- Liang, X.; Litkey, P.; Hyyppa, J.; Kaartinen, H.; Vastaranta, M.; Holopainen, M. Automatic stem mapping using single-scan terrestrial laser scanning. IEEE Trans. Geosci. Remote Sens. 2011, 50, 661–670. [Google Scholar] [CrossRef]
- Cabo, C.; Ordoñez, C.; García-Cortés, S.; Martínez, J. An algorithm for automatic detection of pole-like street furniture objects from Mobile Laser Scanner point clouds. ISPRS J. Photogramm. Remote Sens. 2014, 87, 47–56. [Google Scholar] [CrossRef]
- Lehtomäki, M.; Jaakkola, A.; Hyyppä, J.; Kukko, A.; Kaartinen, H. Performance analysis of a pole and tree trunk detection method for mobile laser scanning data. Int. Arch. Photogramm. Remote Sens. Spat. Inf. Sci. 2011, 38, 197–202. [Google Scholar] [CrossRef]
- Li, L.; Li, Y.; Li, D. A method based on an adaptive radius cylinder model for detecting pole-like objects in mobile laser scanning data. Remote Sens. Lett. 2016, 7, 249–258. [Google Scholar] [CrossRef]
- Raumonen, P.; Kaasalainen, M.; Akerblom, M.; Kaasalainen, S.; Kaartinen, H.; Vastaranta, M.; Holopainen, M. Comprehensive quantitative tree models from terrestrial laser scanner data. Remote Sens. 2013, 5, 491–520. [Google Scholar] [CrossRef]
- Hackenberg, J.; Morhart, C.; Sheppard, J.; Spiecker, H.; Disney, M. Highly accurate tree models derived from terrestrial laser scan data: A method description. Forests 2014, 5, 1069–1105. [Google Scholar] [CrossRef]
- Li, F.; Oude Elberink, S.; Vosselman, G. Pole-like road furniture detection and decomposition in mobile laser scanning data based on spatial relations. Remote Sens. 2018, 10, 531. [Google Scholar] [CrossRef]
- Arachchige, N.H.; Perera, S.N.; Maas, H.G. Automatic processing of mobile laser scanner point clouds for building facade detection. Int. Arch. Photogramm. Remote Sens. Spat. Inf. Sci. 2012, 39, 187–192. [Google Scholar] [CrossRef]
- Li, Y.; Hu, Q.; Wu, M.; Liu, J.; Wu, X. Extraction and simplification of building façade pieces from mobile laser scanner point clouds for 3D street view services. ISPRS Int. J. Geo-Inf. 2016, 5, 231. [Google Scholar] [CrossRef]
- Lehtomäki, M.; Jaakkola, A.; Hyyppä, J.; Kukko, A.; Kaartinen, H. Detection of vertical pole-like objects in a road environment using vehicle-based laser scanning data. Remote Sens. 2010, 2, 641–664. [Google Scholar] [CrossRef]
- Hetti Arachchige, N. Automatic tree stem detection—A geometric feature based approach for MLS point clouds. ISPRS Ann. Photogramm. Remote Sens. Spat. Inf. Sci. 2013, 2, 109–114. [Google Scholar] [CrossRef]
- Xia, S.; Wang, C.; Pan, F.; Xi, X.; Zeng, H.; Liu, H. Detecting stems in dense and homogeneous forest using single-scan TLS. Forests 2015, 6, 3923–3945. [Google Scholar] [CrossRef]
- Tao, S.; Wu, F.; Guo, Q.; Wang, Y.; Li, W.; Xue, B.; Hu, X.; Li, P.; Tian, D.; Li, C.; et al. Segmenting tree crowns from terrestrial and mobile LiDAR data by exploring ecological theories. ISPRS J. Photogramm. Remote Sens. 2015, 110, 66–76. [Google Scholar] [CrossRef]
- Hao, W.; Wang, Y.; Li, Y.; Shi, Z.; Zhao, M.; Liang, W. Hierarchical extraction of pole-like objects from scene point clouds. Opt. Eng. 2018, 57, 083106. [Google Scholar] [CrossRef]
- Wu, B.; Yu, B.; Yue, W.; Shu, S.; Tan, W.; Hu, C.; Huang, Y.; Wu, J.; Liu, H. A voxel-based method for automated identification and morphological parameters estimation of individual street trees from mobile laser scanning data. Remote Sens. 2013, 5, 584–611. [Google Scholar] [CrossRef]
- Thanh Ha, T.; Chaisomphob, T. Automated localization and classification of expressway pole-like road facilities from mobile laser scanning data. Adv. Civ. Eng. 2020, 2020, 5016783. [Google Scholar] [CrossRef]
- Tang, Y.; Xiang, Z.; Jiang, T. Semantic classification of pole-like traffic facilities in complex road scenes based on LiDAR point cloud. Trop. Geogr. 2020, 40, 893–902. [Google Scholar]
- Hui, Z.; Li, Z.; Jin, S.; Liu, B.; Li, D. Street tree extraction and segmentation from mobile LiDAR point clouds based on spatial geometric features of object primitives. Forests 2022, 13, 1245. [Google Scholar] [CrossRef]
- Pu, S.; Rutzinger, M.; Vosselman, G.; Elberink, S.O. Recognizing basic structures from mobile laser scanning data for road inventory studies. ISPRS J. Photogramm. Remote Sens. 2011, 66, S28–S39. [Google Scholar] [CrossRef]
- Fan, W.; Chenglu, W.; Jonathan, L. Automated extraction of urban trees from mobile LiDAR point clouds[C]//2nd ISPRS international conference on computer vision in remote sensing (CVRS 2015). SPIE 2016, 9901, 159–164. [Google Scholar]
- Li, F.; Elberink, S.O.; Vosselman, G. Pole-like street furniture decompostion in mobile laser scanning data. ISPRS Ann. Photogramm. Remote Sens. Spat. Inf. Sci. 2016, 3. [Google Scholar] [CrossRef]
- Wang, H.; Wang, C.; Luo, H.; Li, P.; Cheng, M.; Wen, C.; Li, J. Object detection in terrestrial laser scanning point clouds based on Hough forest. IEEE Geosci. Remote Sens. Lett. 2014, 11, 1807–1811. [Google Scholar] [CrossRef]
- Huang, P.; Chen, Y.; Li, J.; Yu, Y.; Wang, C.; Nie, H. Extraction of street trees from mobile laser scanning point clouds based on subdivided dimensional features. In Proceedings of the 2015 IEEE International Geoscience and Remote Sensing Symposium (IGARSS), Milan, Italy, 26–31 July 2015; IEEE: New York, NY, USA, 2015; pp. 557–560. [Google Scholar]
- Huang, J.; You, S. Pole-like object detection and classification from urban point clouds. In Proceedings of the 2015 IEEE International Conference on Robotics and Automation (ICRA), Seattle, WA, USA, 26–30 May 2015; IEEE: New York, NY, USA, 2015; pp. 3032–3038. [Google Scholar]
- Wu, F.; Wen, C.; Guo, Y.; Wang, J.; Yu, Y.; Wang, C.; Li, J. Rapid localization and extraction of street light poles in mobile LiDAR point clouds: A supervoxel-based approach. IEEE Trans. Intell. Transp. Syst. 2016, 18, 292–305. [Google Scholar] [CrossRef]
- Huang, J.; You, S. Point cloud labeling using 3rd convolutional neural network. In Proceedings of the 2016 23rd International Conference on Pattern Recognition (ICPR), Cancun, Mexico, 4–8 December 2016; IEEE: New York, NY, USA, 2016; pp. 2670–2675. [Google Scholar]
- Weinmann, M.; Weinmann, M.; Mallet, C.; Brédif, M. A classification-segmentation framework for the detection of individual trees in dense MMS point cloud data acquired in urban areas. Remote Sens. 2017, 9, 277. [Google Scholar] [CrossRef]
- Xu, S.; Xu, S.; Ye, N.; Zhu, F. Automatic extraction of street trees’ nonphotosynthetic components from MLS data. Int. J. Appl. Earth Obs. Geoinf. 2018, 69, 64–77. [Google Scholar] [CrossRef]
- Yadav, M.; Khan, P.; Singh, A.K.; Lohani, B. Generating GIS database of street trees using mobile LiDAR data. ISPRS Ann. Photogramm. Remote Sens. Spat. Inf. Sci. 2018, 4, 233–237. [Google Scholar] [CrossRef]
- Xu, S.; Ye, N.; Xu, S.; Zhu, F. A supervoxel approach to the segmentation of individual trees from LiDAR point clouds. Remote Sens. Lett. 2018, 9, 515–523. [Google Scholar] [CrossRef]
- Yue, G.; Liu, R.; Zhang, H.; Zhou, M. A method for extracting street trees from mobile LiDAR point clouds. Open Cybern. Syst. J. 2015, 9, 204–209. [Google Scholar] [CrossRef][Green Version]
- Li, L.; Li, D.; Zhu, H.; Li, Y. A dual growing method for the automatic extraction of individual trees from mobile laser scanning data. ISPRS J. Photogramm. Remote Sens. 2016, 120, 37–52. [Google Scholar] [CrossRef]
- Bremer, M. Eigenvalue and graph-based object extraction from mobile laser scanning point clouds. ISPRS Ann. Photogramm. Remote Sens. Spat. Inf. Sci. 2013, 8, 55–60. [Google Scholar] [CrossRef]
- Yang, J.; Kang, Z.; Akwensi, P.H. A skeleton-based hierarchical method for detecting 3-D pole-like objects from mobile LiDAR point clouds. IEEE Geosci. Remote Sens. Lett. 2018, 16, 801–805. [Google Scholar] [CrossRef]
- Zhong, L.; Cheng, L.; Xu, H.; Wu, Y.; Chen, Y.; Li, M. Segmentation of individual trees from TLS and MLS data. IEEE J. Sel. Top. Appl. Earth Obs. Remote Sens. 2016, 10, 774–787. [Google Scholar] [CrossRef]
- Kang, Z.; Yang, J.; Zhong, R.; Wu, Y.; Shi, Z.; Lindenbergh, R. Voxel-based extraction and classification of 3-D pole-like objects from mobile LiDAR point cloud data. IEEE J. Sel. Top. Appl. Earth Obs. Remote Sens. 2018, 11, 4287–4298. [Google Scholar] [CrossRef]
- Li, Y.; Li, P.; Dong, Y.; Fan, H. Automatic extraction and classification of pole-like objects from vehicle LiDAR point cloud. Acta Geod. Cartogr. Sin. 2020, 49, 724–735. (In Chinese) [Google Scholar]
- Hoppe, H.; DeRose, T.; Duchamp, T.; McDonald, J.; Stuetzle, W. Surface reconstruction from unorganized points. ACM SIGGRAPH Comput. Graph. 1992, 26, 71–78. [Google Scholar] [CrossRef]
- Neuville, R.; Bates, J.; Jonard, F. Estimating Forest Structure from UAV-Mounted LiDAR Point Cloud Using Machine Learning. Remote. Sens. 2021, 13, 352. [Google Scholar] [CrossRef]
Disclaimer/Publisher’s Note: The statements, opinions and data contained in all publications are solely those of the individual author(s) and contributor(s) and not of MDPI and/or the editor(s). MDPI and/or the editor(s) disclaim responsibility for any injury to people or property resulting from any ideas, methods, instructions or products referred to in the content. |
© 2022 by the authors. Licensee MDPI, Basel, Switzerland. This article is an open access article distributed under the terms and conditions of the Creative Commons Attribution (CC BY) license (https://creativecommons.org/licenses/by/4.0/).