Abstract
Road cycling is an endurance sport characterized by several anthropometric performance factors, such as reduced body mass and body fat percentage. As the power to weight ratio is considered one of the most important markers of performance in this sport discipline, it is speculated that anthropometric factors could relate to the physiological parameters found in road cyclists of different performance levels. The current study aimed to describe the anthropometric differences across road cyclists of different performance levels and to assess whether anthropometric values could relate to physiological markers that are commonly used to classify road cyclists, according to their performance level. We classified 46 cyclists as recreationally trained, trained, well trained and professional, according to their VO2max, and performed graded exercise tests and complete anthropometric assessments. The results showed that there were no significant anthropometric differences between trained, well trained and professional cyclists, with only recreationally trained cyclists exhibiting larger perimeters and skinfolds than professional cyclists. Further, although physiological performance, such as VO2max and respiratory compensation point, correlated negatively with several skinfolds and perimeters, these correlations remained restrained and did not distinguish between cyclists of different specialties.
1. Introduction
Road cycling is an endurance sport discipline characterized by a broad range of performance factors, which can be categorized as physiological, psychological and anthropometric parameters [1]. Road cyclists need to tolerate extremely high training volumes in order to develop a wide range of physiological adaptations: either maximal (maximal oxygen consumption-VO2max) or submaximal (both ventilatory thresholds and gross efficiency) [2]. At the same time, cyclists present several well-developed psychological capabilities, such as the ability to endure suffering, to avoid negative self-talk or to pace correctly [3]. Regarding the anthropometric factors, previous studies have shown that road cyclists are generally characterized by low body mass and body mass index (BMI), low percentage of body fat and reduced waist to hip ratio [4]. However, previous research has highlighted that there is significant variation in these parameters across cyclists of different specialties, such as sprinters, time trialists, general classification riders or climbers [5,6].
Anthropometric assessment is a widely implemented methodology in the practical field for the following reasons: reduced costs, lack of complex equipment and easy implementation in the field setting [7]. However, anthropometric assessment also presents several setbacks. In order to guarantee a minimal degree of inter- and intra-observer variability, the anthropometrist must be highly skilled and qualified, and even when this is the case, the variability in measurements may be too large to allow comparisons between athletes assessed in different facilities [7]. One of the most interesting characteristics of whole-body anthropometry is the possibility to measure skinfolds and perimeters in different body parts, which may be of interest in sports disciplines, in which specific muscle groups are being predominantly used, as in the case of road cycling.
Although the main body composition parameters, such as body mass, fat mass or muscle mass, have already been well studied in road cyclists, there is a lack of knowledge regarding the trends in skinfolds and perimeters in cyclists of different performance levels. Given that higher performing cyclists are characterized by a lower body mass, body fat percentage and increased power to weight ratio, differences in anthropometric measurements could be expected across performance groups, at least theoretically. Accordingly, the objectives of the current study were the following: (1) Describe the anthropometric differences across cyclists of different performance levels and (2) Assess whether anthropometric values could relate to physiological markers that are commonly used to classify road cyclists according to their performance levels.
2. Materials and Methods
2.1. Research Design
The present study was a descriptive design with four different performance levels. A total of 46 cyclists (median age 38 years, IQR from 33 to 44 years) were recruited for the study. Following the guidelines proposed by de Pauw et al., participants were classified into 4 categories according to their VO2max: recreationally trained (n = 14), trained (n = 11), well trained (n = 10) and professional (n = 11) [8]. Descriptive data of each group is provided in Table 1. The inclusion criteria were: (a) current owner of a cycling license (World Tour, Elite/U23, Masters, or recreational); (b) absence of surgical procedures and injuries in the 6 months prior to the study; and (c) absence of drug use in the 6 months prior to the study. After being informed of the benefits and potential risks of the investigation, each subject completed a health-screening questionnaire and provided written informed consent before participation in the study [9]. The study followed the ethical guidelines of the 2013 Declaration of Helsinki and received approval from the Research Ethics Committee of the autonomous region of Aragon, Spain (PI19/447).

Table 1.
Summary of results and group comparisons.
2.2. Data Collection
Participants completed the anthropometric evaluation in a fasted state and in the morning hours (8:00–10:00 a.m.) to control for diurnal hormonal variations. Data were collected under similar environmental conditions (17–18 °C, 45–55% relative humidity). First, the body mass of all cyclists was assessed through the electrical impedance method (BC-602; Tanita Co., Tokyo, Japan). Height was measured with a SECA 214 stadiometer (Seca; Hamburg, Germany), which was graduated up to 1 mm. Following these measurements, a single certified ISAK-2 anthropometrist measured 4 skinfolds and 4 perimeters following the guidelines proposed by the International Society for the Advancement of Kinanthropometry (ISAK) [10]. A Harpenden skinfold caliper (Baty International, London, United Kingdom) was used for skinfold measurements [11]. Body fat percentage was estimated with the 4-skinfold formula, first calculating body density (D = C − Mxlog10S 4 skinfolds) and later body fat percentage ((495/Body Density) − 450) [10].
After a two hours rest, during which participants had breakfast, all of them completed a graded exercise test (GXT) until exhaustion in which VO2max and respiratory compensation point (RCP) were assessed (CPX/D; Med Graphics, St Paul, MN). Participants performed the test on their own bike set on a Tacx Neo 2T Smart bike trainer (Tacx International, Rijksstraatweg, the Netherlands). Power output was measured with the Favero Assioma pedals [12]. The GXT commenced at a workload of 150 W, with 25-W increments every 3 min until exhaustion [13]. In all cases, a 5-min warm-up at 100 W was allowed before commencement of the test. The assessment ended after a plateau of the VO2 curve was reached or, when not seen, at voluntary fatigue when 100% of the estimated maximal heart rate (HRmax), a rate of perceived exertion of ≥18, and a respiratory exchange ratio of ≥1.15, were attained [14].
2.3. Statistical Analysis
Data cleaning, manipulation, and analyses were performed in R (v4.2.1; R Foundation for Statistical Computing, Vienna, Austria). Data were inspected visually, and normality was tested using the Shapiro–Wilks test. Accordingly, a central tendency was summarized with medians and dispersion within the interquartile range (IQR). Group differences were assessed with Kruskal–Wallis’s rank sum tests (χ2). Effect sizes were reported with ordinal ε2 and their 95% confidence intervals (CI), estimated using the bootstrap method. Magnitudes were interpreted; ε2 < 0.01 = very small; 0.01 ≤ ε2 < 0.06, small; 0.16 ≤ ε2 < 0.14, medium; and ε2 ≥ 0.14, large. Pairwise comparisons were made using Dunn’s all-pairs comparison tests, applying Holm corrections. Univariate correlations were explored using Spearman rank correlation coefficients (ρ). Correlation coefficients were interpreted; ρ < 0.05, Tiny; 0.05 ≤ ρ < 0.1, Very small; 0.1 ≤ ρ < 0.2, Small; 0.2 ≤ ρ < 0.3, Medium; 0.3 ≤ ρ < 0.4, Large; and ρ ≥ 0.4, Very large. Statistical significance was assumed when p < 0.05.
3. Results
Participant classification resulted in a cohort of 14 Recreationally Trained (VO2max = 50 [48, 53] mL/min/kg, RCP = 3.12 [3, 3.54] W/kg), 11 Trained (VO2max = 59 [57, 62] mL/min/kg, RCP = 3.92 [3.8, 4.07] W/kg), 10 Well Trained (VO2max = 66 [65, 66] mL/min/kg, RCP = 4.5 [4.28, 4.65] W/kg), and 11 Professional (VO2max = 72 [72, 74] mL/min/kg, RCP = 4.95 [4.76, 5.24] W/kg). A summary of group-wise participant characteristics can be found in Table 1.
Group comparisons revealed that Professionals were younger (p = 0.014) and had lower body mass (p = 0.003), body mass index (p = 0.005), and fat mass (p = 0.006) than Recreationally Trained. However, no differences were identified for the trained and well-trained cyclists. In addition, Triceps Brachii (p = 0.004), Subscapularis (p = 0.019), and Abdominal (p = 0.012) skinfolds were also lower in Professionals compared with Recreationally Trained, but no differences were identified with the Trained and Well-trained groups, nor for the Biceps Brachii, Suprailiac, Thigh, and Calf skinfolds.
On the other hand, whilst Hip (p < 0.001), Waist (p = 0.005), and Thigh (p = 0.015) perimeters were also lower in the Professionals, compared with the Recreationally Trained cyclists, no differences were identified with the Trained and Well Trained, nor for the Hip–Waist ratio and the Calf perimeter. Comparison statistics are provided in Table 1.
Both VO2max and RCP correlated negatively with body mass (ρ = −0.60, 95% CI [−0.76, −0.36], p < 0.001; and ρ = −0.65, 95% CI [−0.79, −0.43], p < 0.001, respectively), BMI (ρ = −0.54, 95% CI [−0.73, −0.29], p < 0.001; and ρ = −0.58, 95% CI [−0.75, −0.34], p < 0.001, respectively) and fat mass (ρ = −0.53, 95% CI [−0.72, −0.28], p < 0.001; and ρ = −0.53, 95% CI [−0.71, −0.27], p < 0.001, respectively); Triceps Brachii (ρ = −0.56, 95% CI [−0.74, −0.32], p < 0.001; and ρ = −0.51, 95% CI [−0.7, −0.25], p < 0.001, respectively) and Abdominal (ρ = −0.53, 95% CI [−0.72, −0.28], p < 0.001; and ρ = −0.51, 95% CI [−0.7, −0.25], p < 0.001, respectively) skinfolds; as well as Waist (ρ = −0.53, 95% CI [−0.72, −0.28], p < 0.001; and ρ = −0.58, 95% CI [−0.75, −0.34], p < 0.001, respectively) and Hip (ρ = −0.61, 95% CI [−0.77, −0.38], p < 0.001; and ρ = −0.65, 95% CI [−0.80, −0.44], p < 0.001, respectively) perimeters. A complete set of univariate Spearman correlation coefficients is presented in Figure 1.
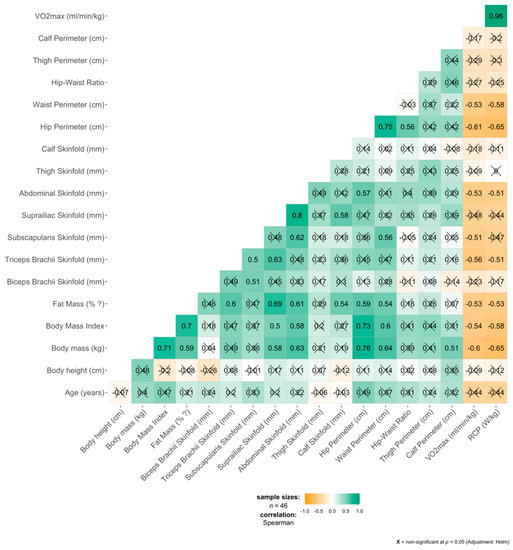
Figure 1.
Summary of correlations using Spearman coefficients. Direction and magnitudes are highlighted by colors according to the legend scale. Non-significant correlations (Holm adjusted p > 0.05) are crossed.
4. Discussion
This was the first study to assess the anthropometric differences between cyclists of different performance levels, with special emphasis on skinfolds and perimeters. The main findings were the following: (1) There were no significant anthropometric differences between trained, well trained and professional cyclists, with only recreationally trained cyclists exhibiting larger perimeters and skinfolds; (2) Although physiological performance factors, such as VO2max and RCP, correlated negatively with several skinfolds and perimeters, these correlations remained restrained.
Road cycling is an endurance sport in which the power to weight ratio plays a crucial role in performance. Body mass, BMI, height and skeletal muscle mass are normally exposed as determining factors in the role of the cyclist and his or her performance [6]. A recent study performed on cyclists of different categories reported lower relative fat mass and higher muscle mass in professional cyclists [15]. These results seem gender irrelevant, as lower body mass and reduced skinfolds were also reported in female elite cyclists [16]. Thus, it could be expected that higher performing cyclists would exhibit several anthropometrical characteristics, such as reduced body mass, body fat percentage and BMI. Further, differences in skinfolds and perimeters could also be expected, given that these parameters are normally used to estimate body fat. However, the data displayed in the current study showed differences only between recreationally trained and professional cyclists. This finding supports the fact that anthropometric factors are necessary for optimal performance, but do not distinguish between already performing cyclists and those who excel in the sport [4]. Instead, as has previously been proposed, these parameters may be more useful for differentiation between the cycling specialties of already performing cyclists [6].
Regarding this differentiation at the elite level of the sport, a recent study analyzed the anthropometric factors of 76 male professional cyclists of different specialties [6]. In this study, there were differences across the specialties even when all the cyclists had a similar performance level. This further suggests that anthropometric factors may be related to the cycling specialty of each cyclist, regardless of the performance level. Particularly, there are relevant differences between climbers and sprinters, with larger body mass, girths and skinfolds reported for sprinters [17]. These findings have been frequently reported in the literature, with similar differences in other cycling disciplines, such as track cycling, where sprinters showed a greater BMI, muscle mass and limb girth, and lower fat percentage than endurance cyclists [18]. Similar findings have also been reported in female cyclists, with lower body mass and skinfolds in road versus track athletes [19]. It should be highlighted, however, that although no significant differences were reported between the three most performing groups of the current study, there was a general tendency towards reduced skinfolds and perimeters with increasing performance level. This tendency supports the importance of a correct optimization of body composition in order to perform at a high level [5].
One of the main interests of the current study was to explore the relationship between physiological parameters, such as VO2max and RCP, with anthropometric variables. Accordingly, VO2max and RCP correlated negatively with body mass, BMI and fat mass; triceps brachii and abdominal skinfolds; as well as waist and hip perimeters. As both VO2max and RCP are values that are normalized to the body weight, it is normal to find that body mass, BMI and fat mass correlate negatively with these physiological markers [16]. The other correlations, although they represent findings that were reported for the first time in road cyclists, remained only in the 0.5–0.6 range. This finding could be related to the fact that each performance group contained participants that could be classified in different cycling specialties, such as sprinters, climbers, time trial cyclists or general classification riders. It is well known that these specialties require different anthropometric characteristics in order to perform, and this could have resulted in correlations that were different from what could be expected when only one type of rider is analyzed across different performance levels [20,21].
The current study presented one important limitation: cyclists were divided into performance groups according to a physiological marker, such as VO2max. It is well known that classifying endurance athletes according to this, and other similar markers, may result in erroneous classifications in specific cases: for example, there are professional cyclists who excel in the sprinting category who do not reach the VO2max status of a professional athlete. Further, there are recreational athletes who reach excellent VO2max values but never reach the summit of their sport discipline due to deficiencies in other important performance factors, such as tactical or psychological skills [8]. Thus, and as proposed by other authors, it could be interesting to verify whether the results reported in the current study would apply to cyclists classified according to their true performance level, verified by a marker that would consider all the performance factors that are relevant for the sport.
5. Conclusions
According to the results presented in the current study, although there was a tendency towards lower perimeters, skinfolds, BMI, body mass and body fat percentage in higher performing cyclists, no significant anthropometric differences existed between trained, well trained and professional cyclists, with only recreationally trained cyclists exhibiting larger perimeters and skinfolds than professional cyclists. Further, although physiological performance factors, such as VO2max and RCP, correlated negatively with several skinfolds and perimeters, these correlations were weak and did not distinguish between riders of different specialties. Given the results obtained in the current study and those recovered from previous literature, anthropometric factors seem to be more useful for the differentiation between cycling specialties, rather than differentiating between performance levels.
Author Contributions
Methodology, N.G.; Formal analysis, R.C.-S.; Writing—review & editing, S.S.; Supervision, I.L.-L. All authors have read and agreed to the published version of the manuscript.
Funding
This research received no external funding.
Institutional Review Board Statement
The study received approval from the Research Ethics Committee of the autonomous region of Aragon, Spain (PI19/447).
Informed Consent Statement
Written informed consent has been obtained from the patient(s) to publish this paper.
Data Availability Statement
Not applicable.
Acknowledgments
The authors thank all the road cyclists for their participation in this study.
Conflicts of Interest
The authors declare no conflict of interest.
References
- Sitko, S.; Cirer-Sastre, R.; Corbi, F.; López-Laval, I. Power assessment in road cycling: A narrative review. Sustainability 2020, 12, 5216. [Google Scholar] [CrossRef]
- Lucia, A.; Hoyos, J.; Chicharro, J.L. Physiology of professional road cycling. Sport. Med. 2001, 31, 325–337. [Google Scholar] [CrossRef] [PubMed]
- Spindler, D.J.; Allen, M.S.; Vella, S.A.; Swann, C. The psychology of elite cycling: A systematic review. J. Sport. Sci. 2018, 36, 1943–1954. [Google Scholar] [CrossRef]
- Sánchez-Muñoz, C.; Zabala, M.; Muros, J.J. Nutritional intake and anthropometric changes of professional road cyclists during a 4-day competition. Scand. J. Med. Sci. Sports 2016, 26, 802–808. [Google Scholar] [CrossRef] [PubMed]
- Muros, J.J.; Sánchez-Muñoz, C.; Hoyos, J.; Zabala, M. Nutritional intake and body composition changes in a UCI World Tour cycling team during the Tour of Spain. Eur. J. Sport Sci. 2019, 19, 86–94. [Google Scholar] [CrossRef]
- Sánchez-Muñoz, C.; Mateo-March, M.; Muros, J.J.; Javaloyes, A.; Zabala, M. Anthropometric characteristics according to the role performed by World Tour Road cyclists for their team. Eur J. Sport Sci. 2022, 30, 1–8. [Google Scholar] [CrossRef]
- Lee, S.Y.; Gallagher, D. Assessment methods in human body composition. Curr. Opin. Clin. Nutr. Metab. Care 2008, 11, 566–572. [Google Scholar] [CrossRef]
- De Pauw, K.; Roelands, B.; Cheung, S.S.; de Geus, B.; Rietjens, G.; Meeusen, R. Guidelines to classify subject groups in sport-science research. Int J. Sport. Physiol. Perform. 2013, 8, 111–122. [Google Scholar] [CrossRef]
- Warburton, D.E.R.; Jamnik, V.; Bredin, S.S.D.; Shephard, R.J.; Gledhill, N. The 2019 Physical Activity Readiness Questionnaire for Everyone (PAR-Q+) and electronic Physical Activity Readiness Medical Examination (ePARmed-X+). Health Fit. J. Can. 2018, 11, 80–83. [Google Scholar] [CrossRef]
- Durnin, J.V.; Womersley, J.V.G.A. Body fat assessed from total body density and its estimation from skinfold thickness: Measurements on 481 men and women aged from 16 to 72 years. Br. J. Nutr. 1974, 32, 77–97. [Google Scholar] [CrossRef]
- Tanner, J.M.; Whitehouse, R.H. The Harpenden skinfold caliper. Am. J. Phys. Anthropol. 1955, 13, 743–746. [Google Scholar] [CrossRef]
- Montalvo-Pérez, A.; Alejo, L.B.; Valenzuela, P.L.; Castellanos, M.; Gil-Cabrera, J.; Talavera, E.; Lucia, A.; Barranco-Gil, D. Validity of the favero assioma duo power pedal system for measuring power output and cadence. Sensors 2021, 24, 2277. [Google Scholar] [CrossRef] [PubMed]
- Sitko, S.; Cirer-Sastre, R.; Corbi, F.; López-Laval, I. Relationship between functional threshold power, ventilatory threshold and respiratory compensation point in road cycling. J. Sport. Med. Phys. Fit. 2022, 62, 626–632. [Google Scholar] [CrossRef] [PubMed]
- Beltz, N.M.; Gibson, A.L.; Janot, J.M.; Kravitz, L.; Mermier, C.M.; Dalleck, L.C. Graded exercise testing protocols for the determination of vo2max: Historical perspectives, progress, and future considerations. J. Sport. Med. (Hindawi Publ. Corp.) 2016, 2016, 3968393. [Google Scholar] [CrossRef] [PubMed]
- Alejo, L.B.; Montalvo-Pérez, A.; Valenzuela, P.L.; Revuelta, C.; Ozcoidi, L.M.; de la Calle, V.; Mateo-March, M.; Lucia, A.; Santalla, A.; Barranco-Gil, D. Comparative analysis of endurance, strength and body composition indicators in professional, under-23 and junior cyclists. Front. Physiol. 2022, 5, 945552. [Google Scholar] [CrossRef]
- Haakonssen, E.C.; Barras, M.; Burke, L.M.; Jenkins, D.G.; Martin, D.T. Body composition of female road and track endurance cyclists: Normative values and typical changes. Eur. J. Sport Sci. 2016, 16, 645–653. [Google Scholar] [CrossRef]
- Van der Zwaard, S.; de Ruiter, C.J.; Jaspers, R.T.; de Koning, J.J. Anthropometric clusters of competitive cyclists and their sprint and endurance performance. Front. Physiol. 2019, 9, 1276. [Google Scholar] [CrossRef]
- Muros, J.J.; Mateo-March, M.; Zabala, M.; Sánchez-Muñoz, C. Anthropometric differences between world-class professional track cyclists based on specialty (endurance vs. sprint). J. Sports Med. Phys. Fit. 2022, 62, 1481–1488. [Google Scholar] [CrossRef]
- Coyle, E.F.; Feltner, M.E.; Kautz, S.A.; Hamilton, M.T.; Montain, S.J.; Baylor, A.M.; Abraham, L.D.; Petrek, G.W. Physiological and biomechanical factors associated with elite endurance cycling performance. Med. Sci. Sport. Exerc. 1991, 23, 93–107. [Google Scholar] [CrossRef]
- Lucía, A.; Joyos, H.; Chicharro, J.L. Physiological response to professional road cycling: Climbers vs. time trialists. Int. J. Sport. Med. 2000, 21, 505–512. [Google Scholar] [CrossRef]
- Sanders, D.; Heijboer, M. Physical demands and power profile of different stage types within a cycling grand tour. Eur. J. Sport Sci. 2019, 19, 736–744. [Google Scholar] [CrossRef] [PubMed]
Disclaimer/Publisher’s Note: The statements, opinions and data contained in all publications are solely those of the individual author(s) and contributor(s) and not of MDPI and/or the editor(s). MDPI and/or the editor(s) disclaim responsibility for any injury to people or property resulting from any ideas, methods, instructions or products referred to in the content. |
© 2022 by the authors. Licensee MDPI, Basel, Switzerland. This article is an open access article distributed under the terms and conditions of the Creative Commons Attribution (CC BY) license (https://creativecommons.org/licenses/by/4.0/).