1. Introduction
When it comes to the machines being used in the everyday life of co-workers, the engineer has to consider many parameters to avoid any kind of injury to the user. Therefore, it is necessary to calculate not only how rigid the components have to be to withstand the emerging static forces, but also the dynamic behaviour.
Rigid bodies are generally capable of transferring structure-borne sound and vibration, thus inducing vibration into the connected machine parts. At the boundaries of the machine connecting it with the environment, this results in radiation of sound and vibrations in the direct surroundings of the machine.
A machine element is generally defined by the selection of material and its functional and geometrical shape. These parameters affect the damping properties due to both the stiffness of the material itself, influencing the frequency behaviour, and the outer shape of the element, acting as an impedance difference.
So far, the impact of the shape of the inner geometry, filled with powder, has not been evaluated completely. Different studies show an influence of the degree of filling, but the assertion is not fully clear, and some are even contradictory. Whilst powder-based dampers are mostly considered as frictional dissipation elements, the influence of impedance differences in combination with frictional dissipation has not been evaluated completely.
In order to construct and build more energy-efficient systems, lightweight constructions play an important role. To make machine parts such as transmission gears lighter, one strategy could be to reduce material usage by integrating cavities. Even if an engineer ensures that there are no static mechanical problems caused by these material savings, the savings could lead to a massive modification of the stiffness of machine elements. An integrated damping behaviour could be useful for lightweight systems if it acts as a sink for dynamically caused issues.
The aim of this research approach was to implement mechanical damping behaviour in the transmission path of structures and constructions. To reach this goal, it was necessary to either increase the damping factor of the structure by using different material properties of alternative materials or by adding geometrical impedance elements. In this approach, different geometric shapes were investigated for their damping; and the samples were manufactured using SLM with 100% filling. The research of Hollkamp and Gordon shows that with a filling volume of 100% of a particle damper, there is hardly any system damping left [
1]; Künnecke shows the opposite [
2]. The discrepancy is intended to prove the improved damping and to investigate the different geometric shapes. In addition, Fowler et al. highlight that the volume dimensions in the direction of the oscillation movement are particularly decisive for absorption [
3].
Information on the development of damping by changing the inner geometry was gathered by performing the following steps: First, the state of the art concerning powder-based dampers and particle dampers was illuminated briefly. In the next step, the design of measurements and test plan were evaluated, and the measurement setup was specified. In the following section, the calculation of the comparison parameters for the measurement setup is discussed. In
Section 4 the calculated parameters, to qualify the damping of the samples, are composed for further comparison. After a short evaluation of the validity of the gathered data in the last section, a conclusion about the influence of inner shape is drawn.
2. State of the Art
Using the freedom of design which comes with additive manufacturing methods, it is possible to implement geometries that cannot be manufactured with conventional manufacturing methods. For the production of these 3D-printed parts, a powder-based laser manufacturing system can be used. The possibilities offered by 3D printing are widely known and described, for example, in the article by Aboulkhair et al., where the use of 3D−printing technologies in terms of freedom of design, processability, and parameters is examined [
4].
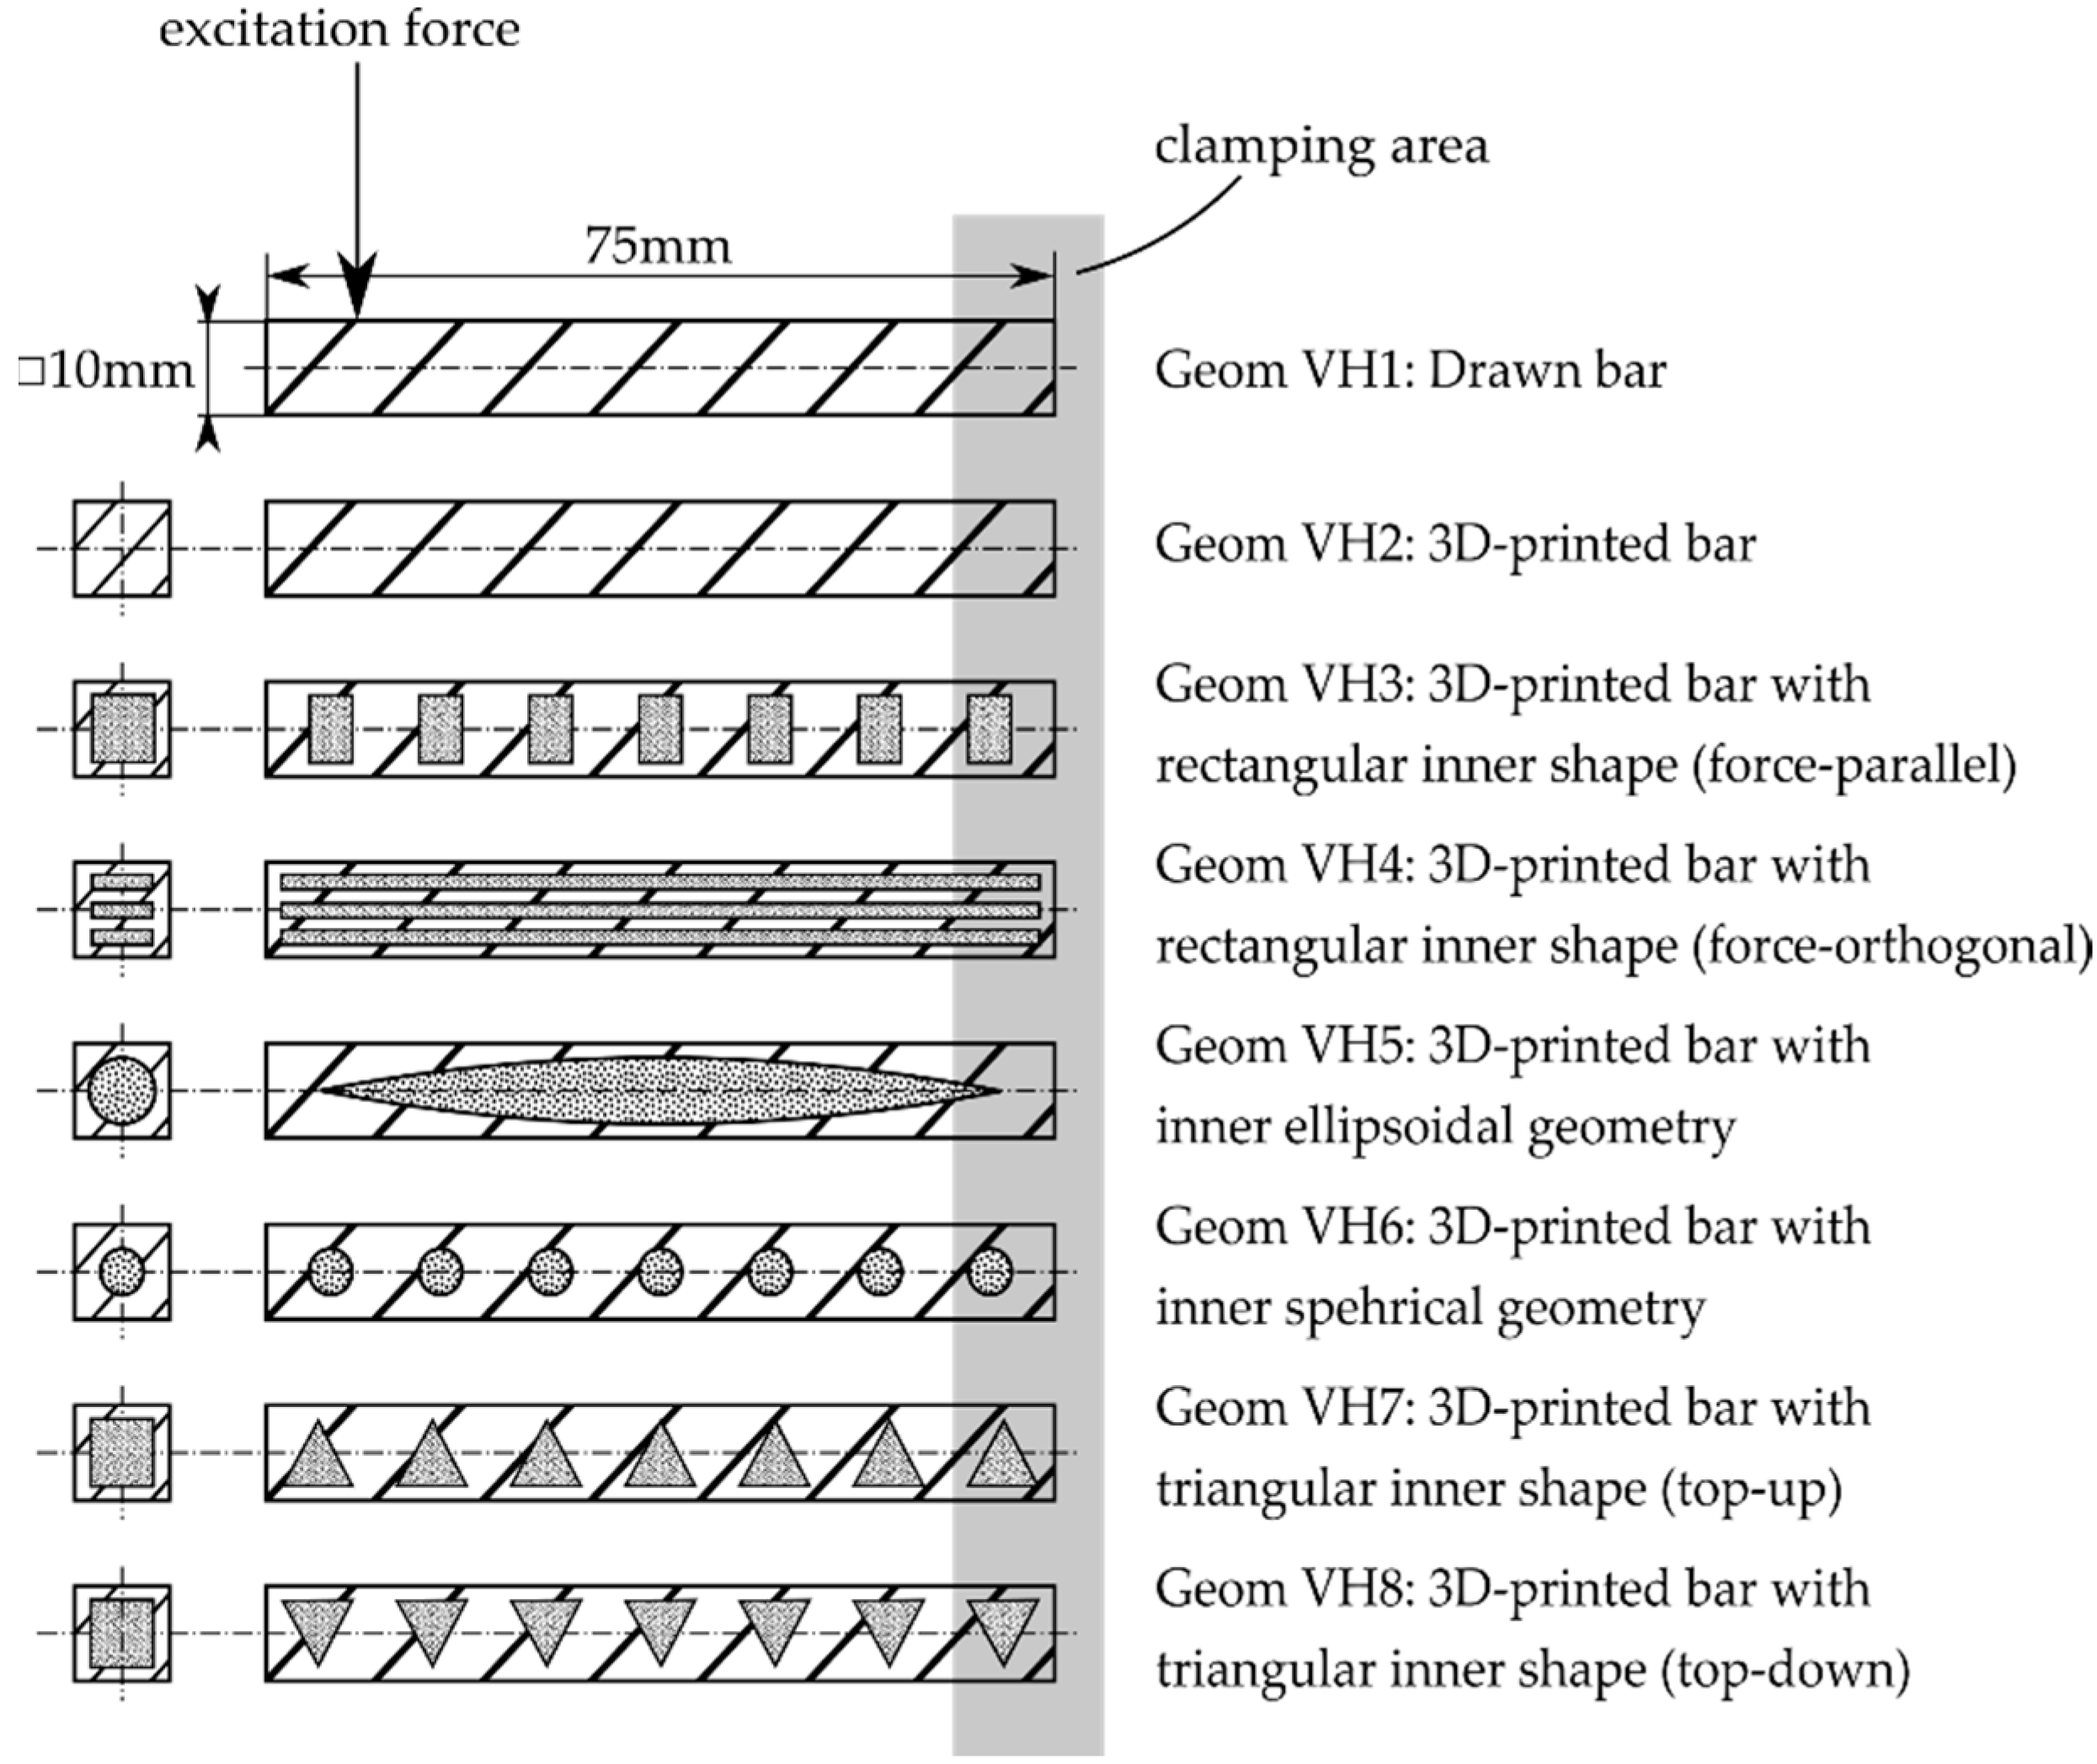
Moreover, it has to be assumed that different manufacturing methods will have a direct impact on the damping behaviour of materials. In addition to the manufacturing method, the impact of inner geometries in a metal bar is investigated. A selection of investigated samples with different damping behaviours are shown below. While the shape of the inner structure is changed in different samples, the ratio between powder chambers and solid material is constant over the different samples with inner geometries.
The general principle of powder-based dampers using additive methods has been investigated in other studies. Several parameters for the design of powder dampers have already been developed. The damper itself, consisting of powder and the surrounding structure, is defined by their characteristics. Hollkamp and Gorden investigated the influence of particle size, the density of particle-filled space, the location of the particles and further parameters concerning the powder [
1]. Other studies have shown the impact of the height of varying excitation forces [
5] or the ratio of masses between the powder and rigid body.
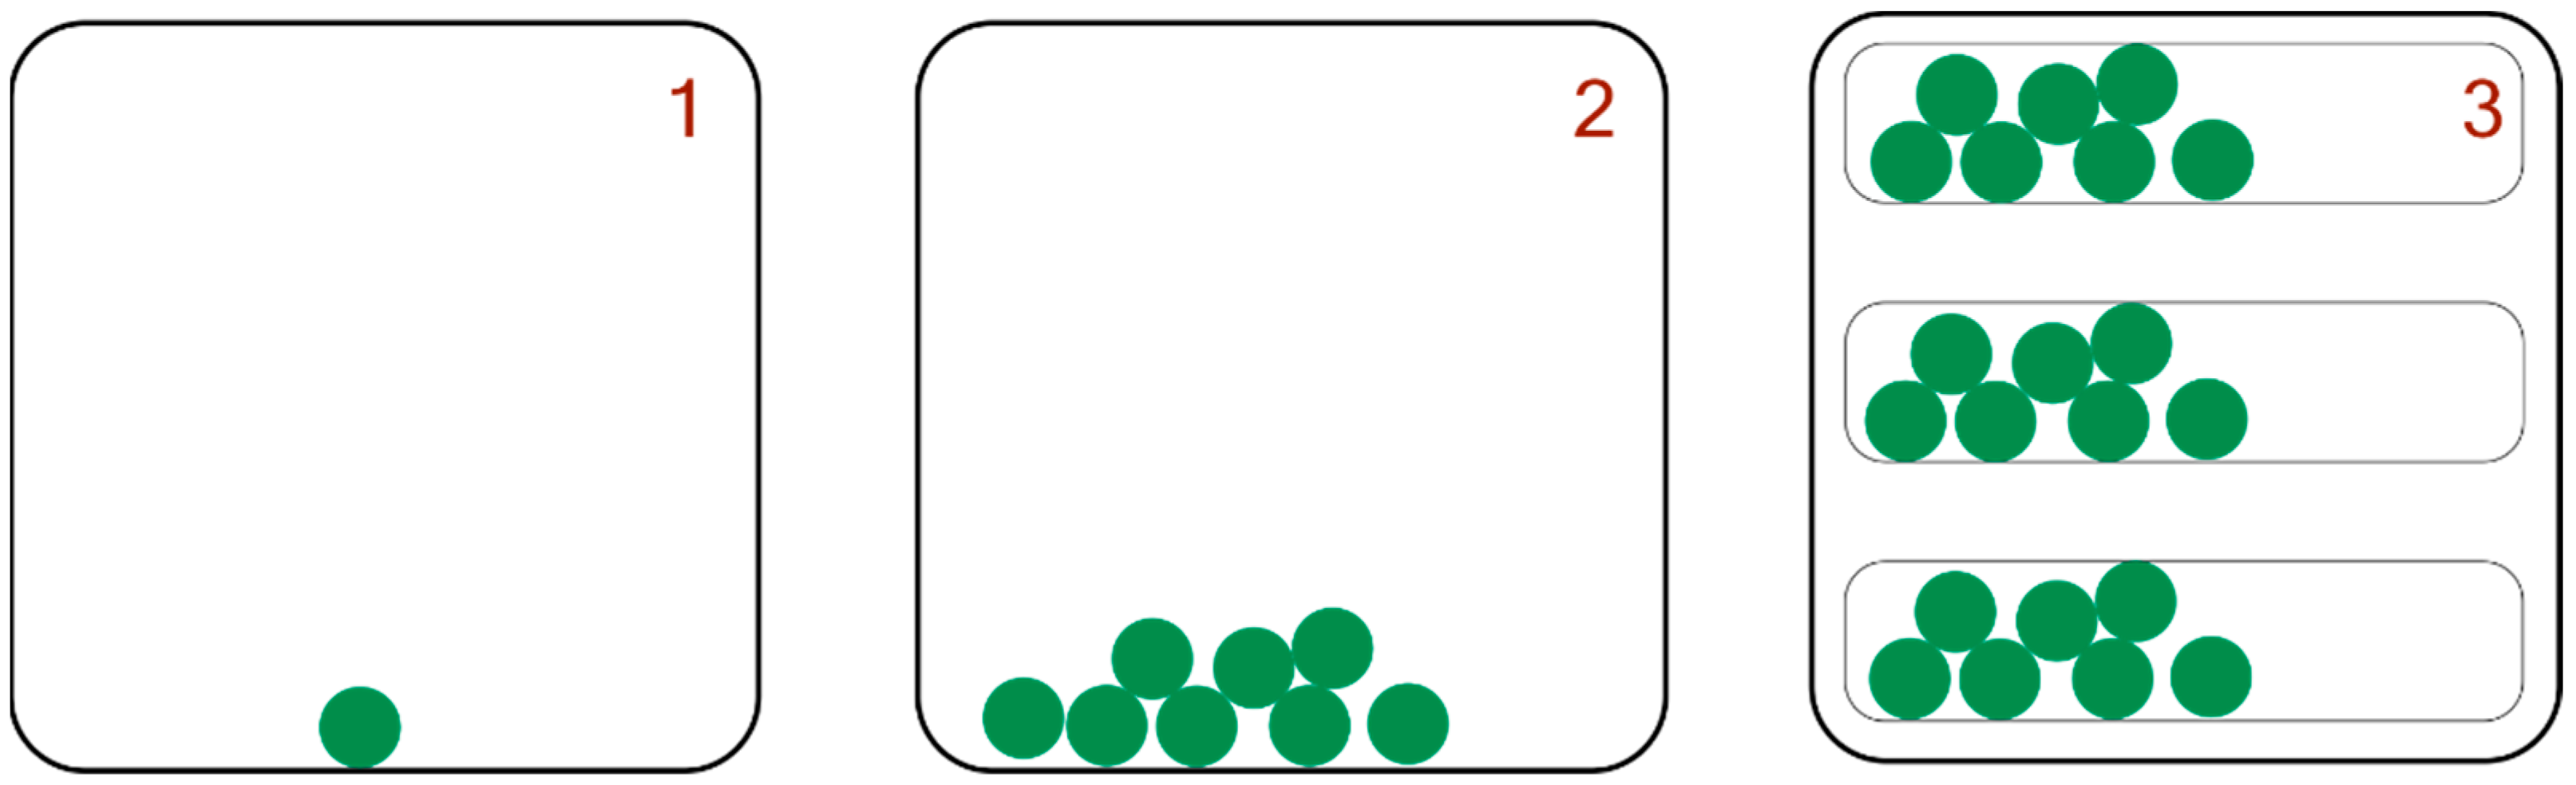
Lu et al. provided a review of the development of particle dampers so far and about the theoretical configurations. Moreover, an overview of the existing design concepts for particle-based dampers is given in [
6]. A selection of design concepts is shown in
Figure 1.
Gagnon et al. summarised the methods for simulating and measuring the dynamic impact of powder-based dampers [
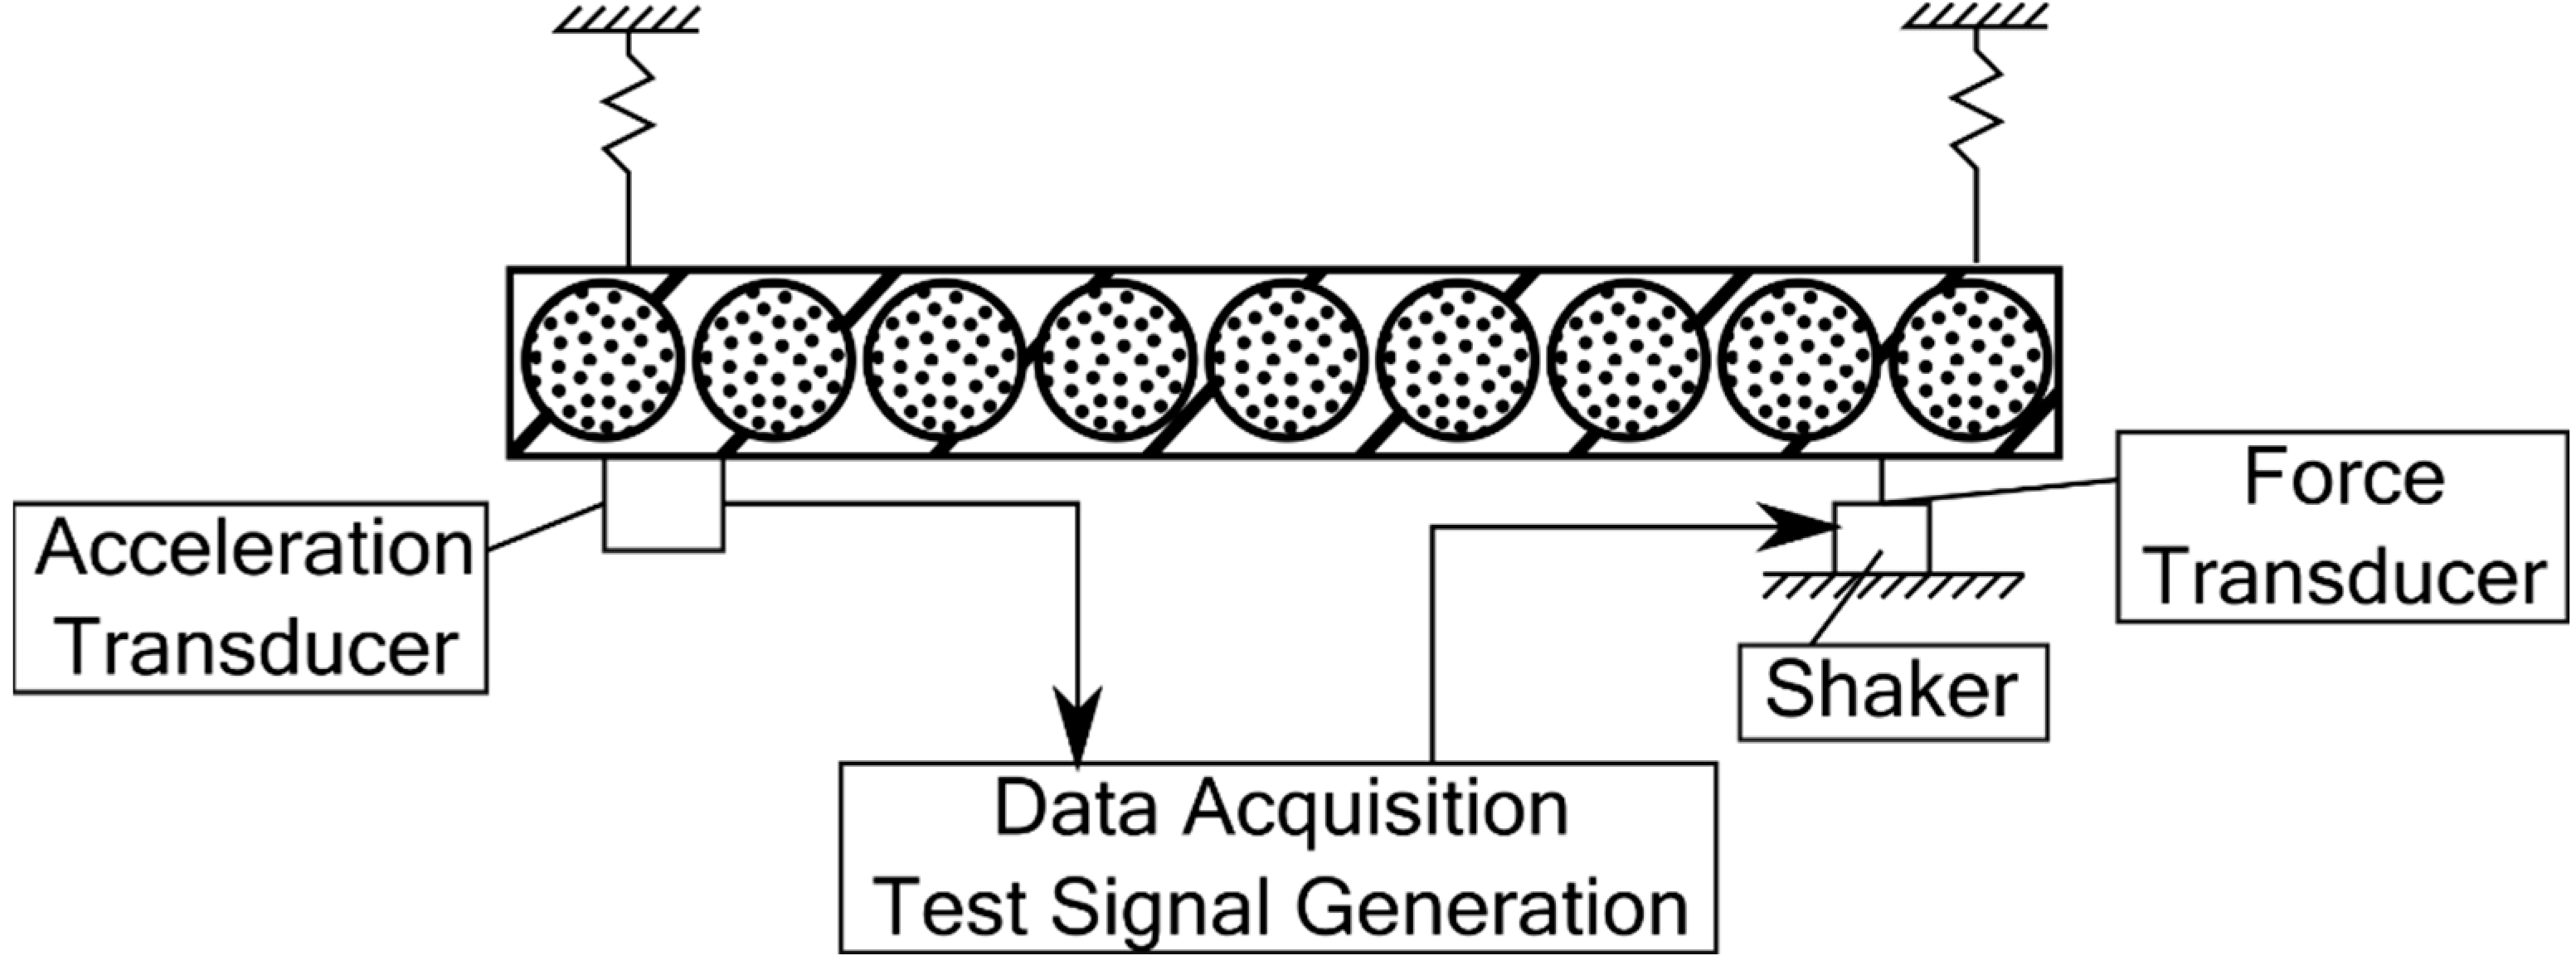
7]. In their study, they showed the differences in measured outer geometries, and analysed frequencies for transient excitation and the used powder/particle size and classes of material. Most of the mentioned studies employed a transient excitation of a beam and the effect of the excitation was measured with accelerometers. The study by Xu et al. [
8], as an example of this measurement setup, used a shaker and accelerometer to analyse the damping capacity. The measurement setup is shown in
Figure 2.
In their study, they used simulation methods to analyse the frequency behaviour of particle dampers with longitudinally and transversally oriented inner geometries in beam-shaped samples. For the simulation of modal characteristics, they used a numerical approach to calculate the stiffness and damping of the bar. They evaluated this approach by comparing it with measurement data, while the variables in the mentioned expressions were unknown until then. They are investigating the amplitude spectrum of the acceleration of a beam sample with and without particles inside a cavity. They showed that the frequencies of a high acceleration amplitude are almost constant while the magnitude of amplitudes are significantly lower with particles inside the cavitys.
A few studies also used forces in the shape of the Dirac impulse for excitation by using an impulse hammer, [
7]. The use of transient excitation is often limited in terms of amplitude because high-bandwidth and high-amplitude equipment is expensive and complicated to handle for small specimens.
For this approach, the shape of the inner geometries will be investigated. This is highly relevant for mechanical construction because workplace requirements for employees lead to the necessity for machines and parts which avoid the development of unwanted vibrations and sound propagation.
Moreover, the presented work investigated the bending vibration, because it is relevant in a variety of technical applications. For target systems such as crossheads or lightweight structures in mechanical transmission systems, the dynamical bending behaviour of parts plays an essential role. Especially when it comes to weight savings in construction to reduce the energy demand, more limp elements are used to reduce material usage. As an example of dynamic behaviour and its impact on construction, the study of Shweiki et al. can be mentioned. The study showed that the number and position of the cavities in a gear are highly related to its overall stiffness. They analysed the failure behaviour and positioning mismatches caused by the deformation of gears using the finite element method [
9].
The type of damping can be classified according to VDI 3830 by the cause of occurrence. A distinction can be made between material damping, contact-surface damping, damping in guides, electromechanical damping, and the energy released to the surrounding medium. In addition, the causes can be differentiated according to internal or external damping. Material damping and contact-surface damping belong to the inner damping since the damping forces act within the system boundary [
10].
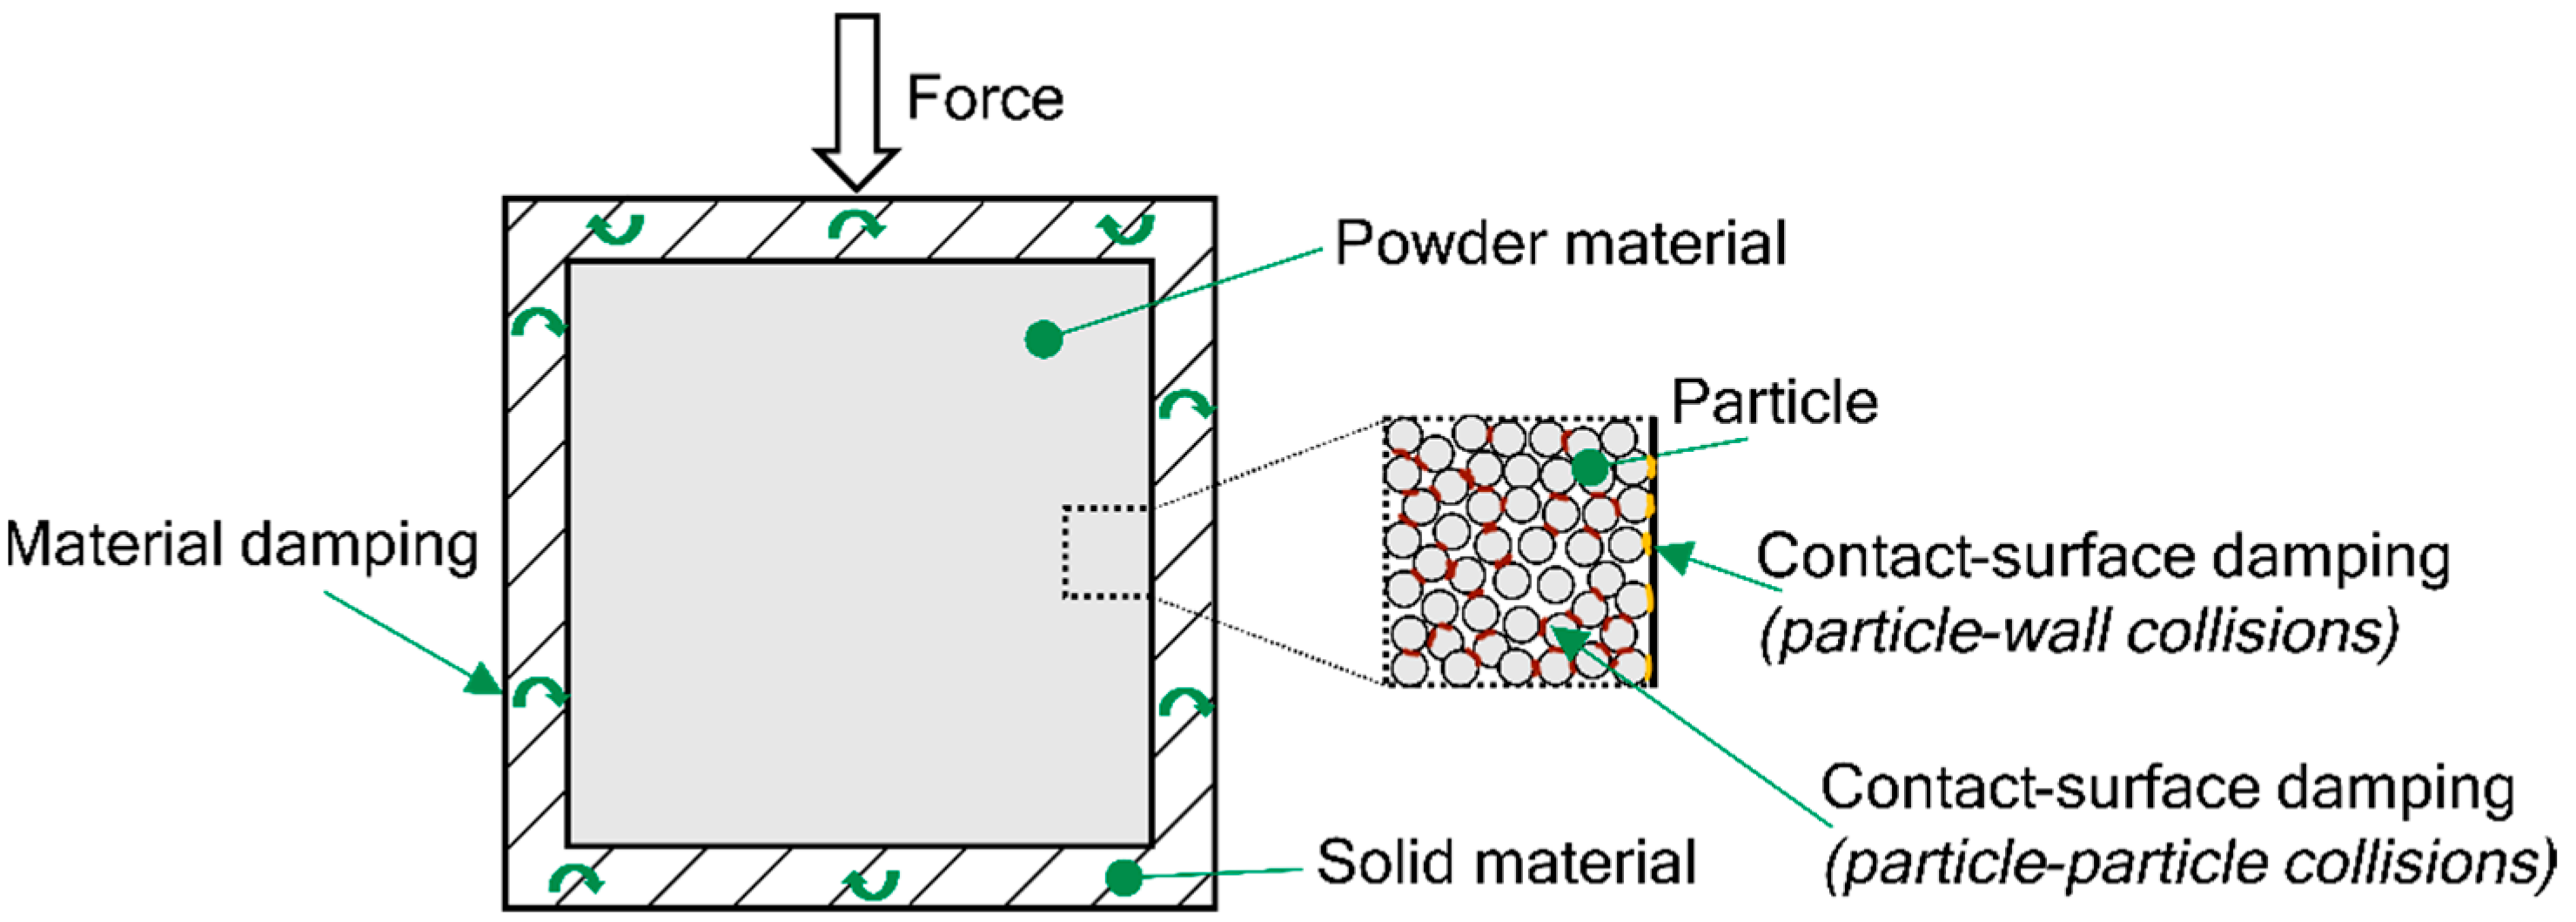
In classical damping systems, the stored deformation energy is converted into heat. This is different from particle dampers, where direct absorption of kinetic energy takes place. Inelastic collisions between particle–particle and particle–wall collisions generate friction inside the damper, which causes the energy dissipation of the particle damper. In addition, there is an exchange of momentum between the solid and the powder material [
2]. In this sense, the particle damper, according to VDI 3830, works with material damping and contact-surface damping. When designing the test specimen, care must be taken to ensure that there are as many contact surfaces as possible between the solid and powder material, and that there is also as much volume as possible for material damping in order to achieve good damping coefficients.
Figure 3 shows the possible damping mechanisms for a powder-based damping structure.
3. Experimental Design and Implementation
As a base material for this approach, it was necessary to choose a material that is not only easily available for engineering and construction purposes—such as conventional steel—but also usable and processable in additive manufacturing machines. Stainless steel 316L/1.4404 was chosen to compare the damping behaviour of the drawn bar and 3D-printed samples.
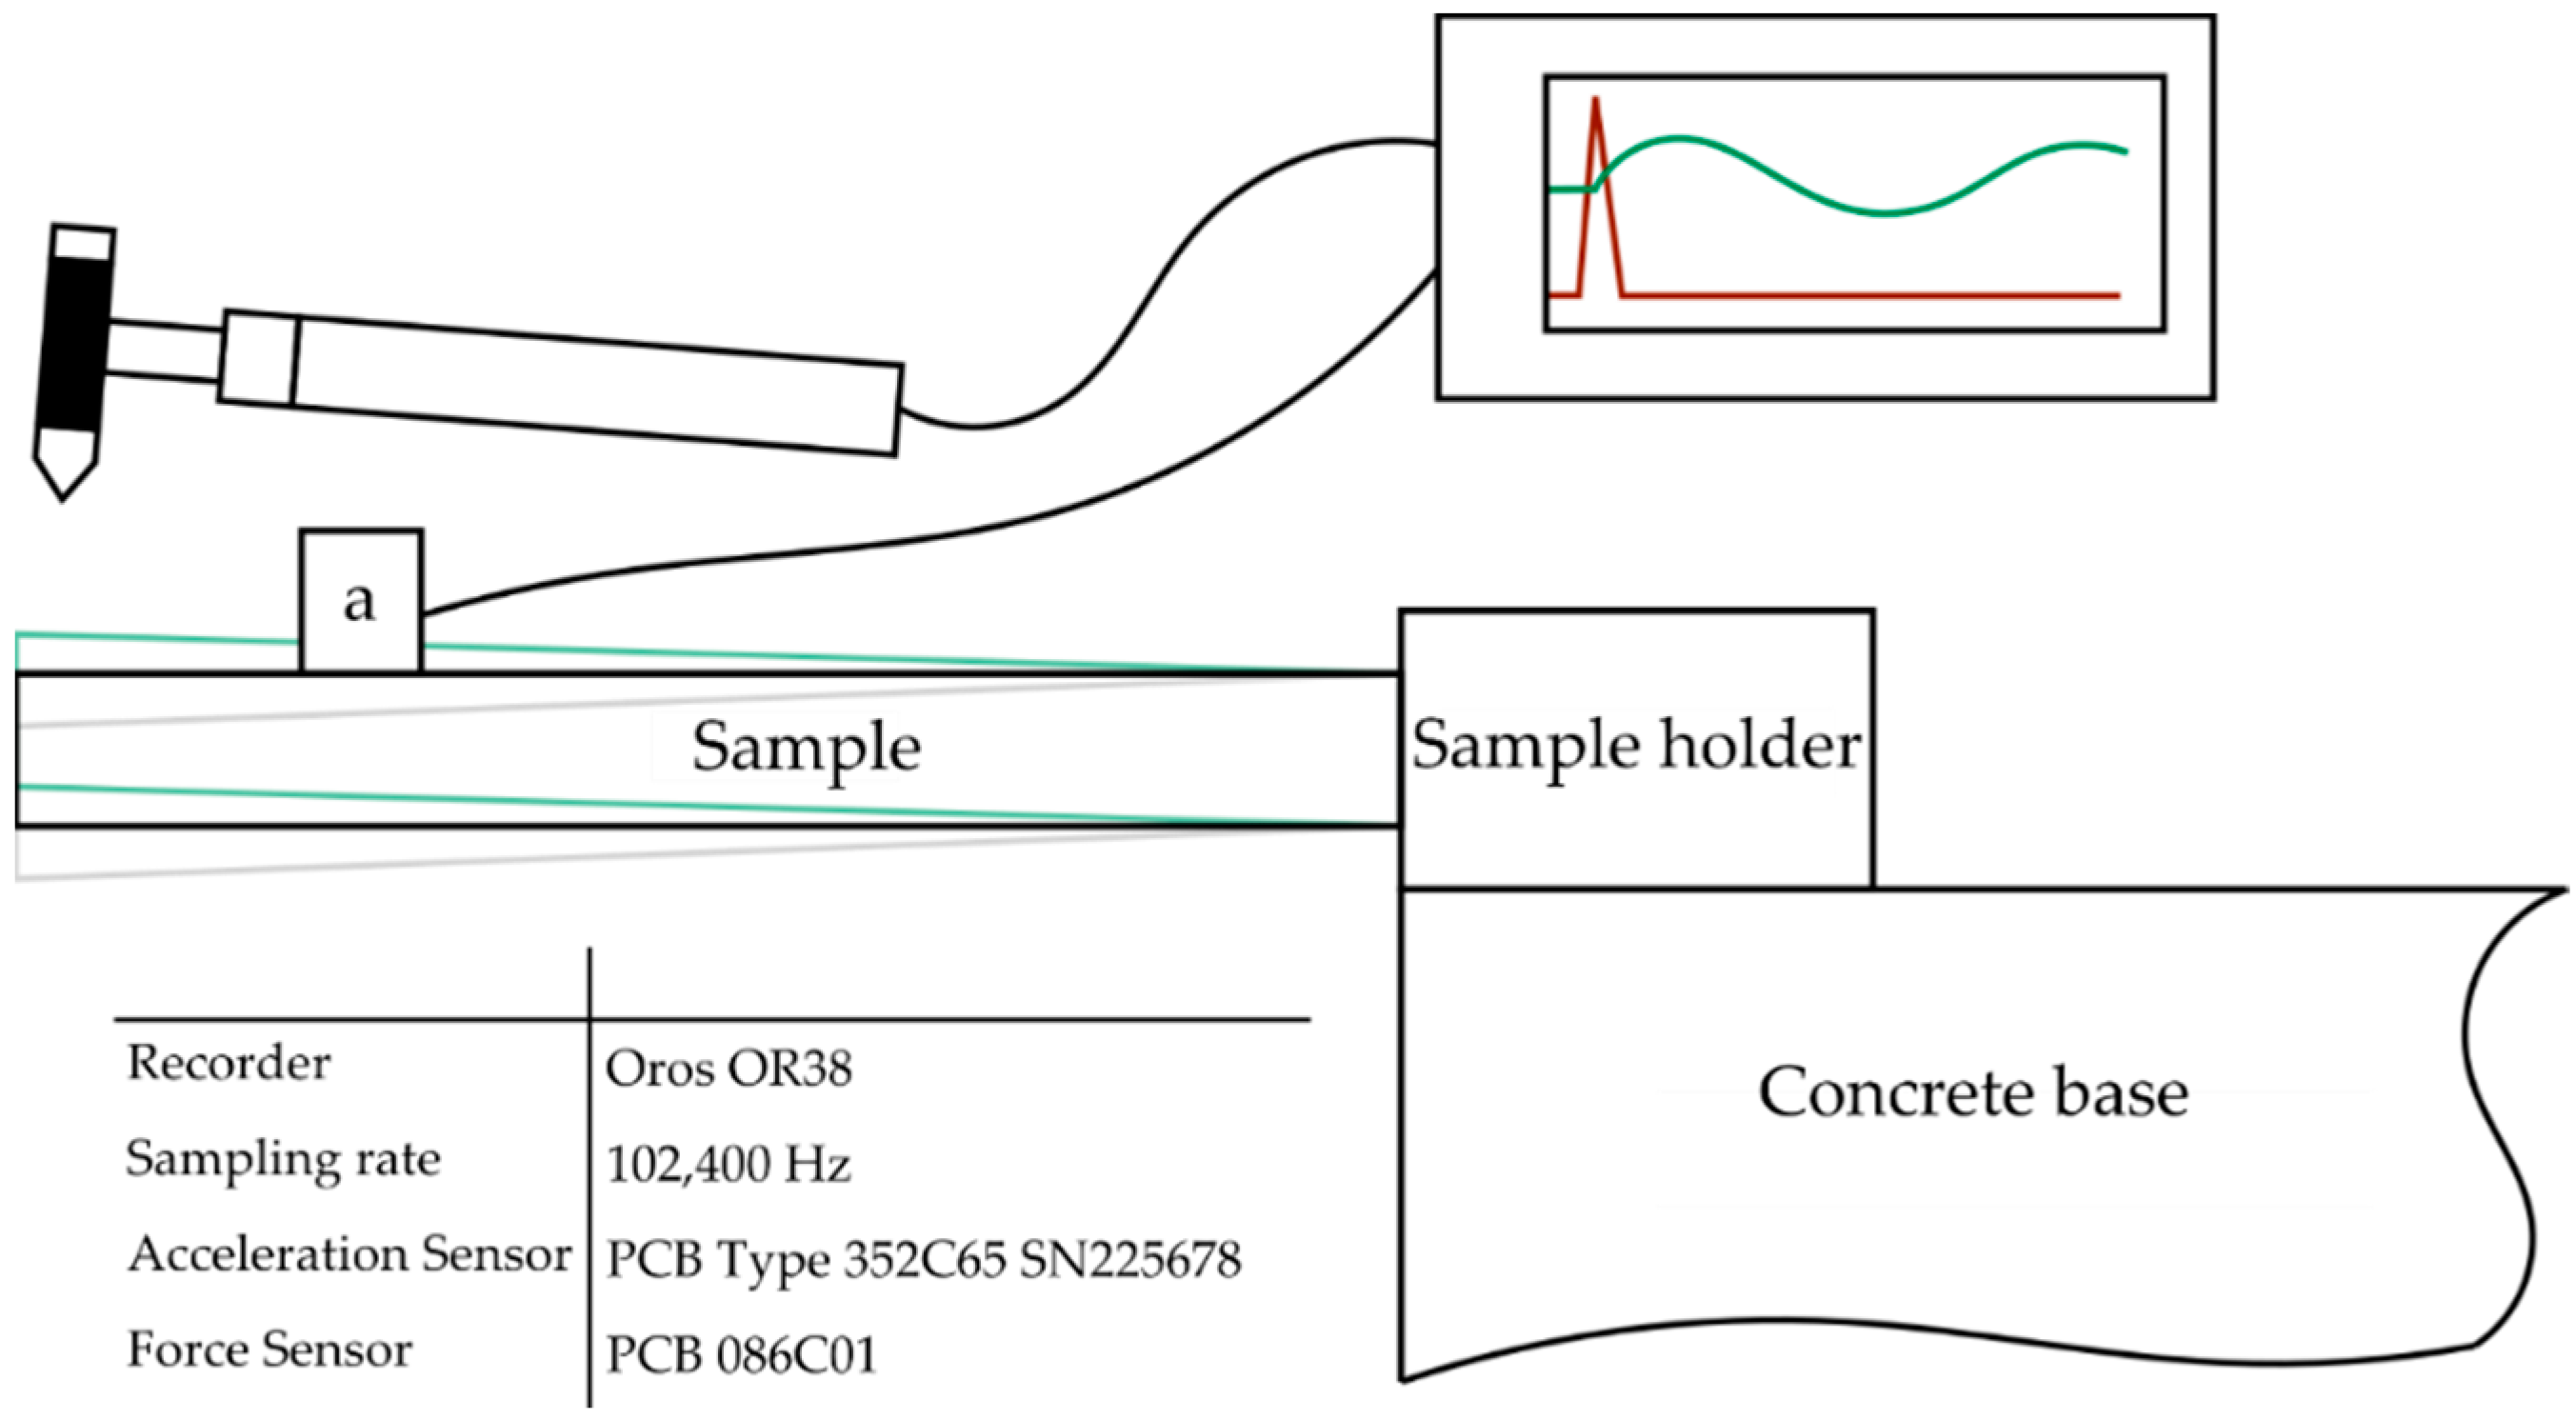
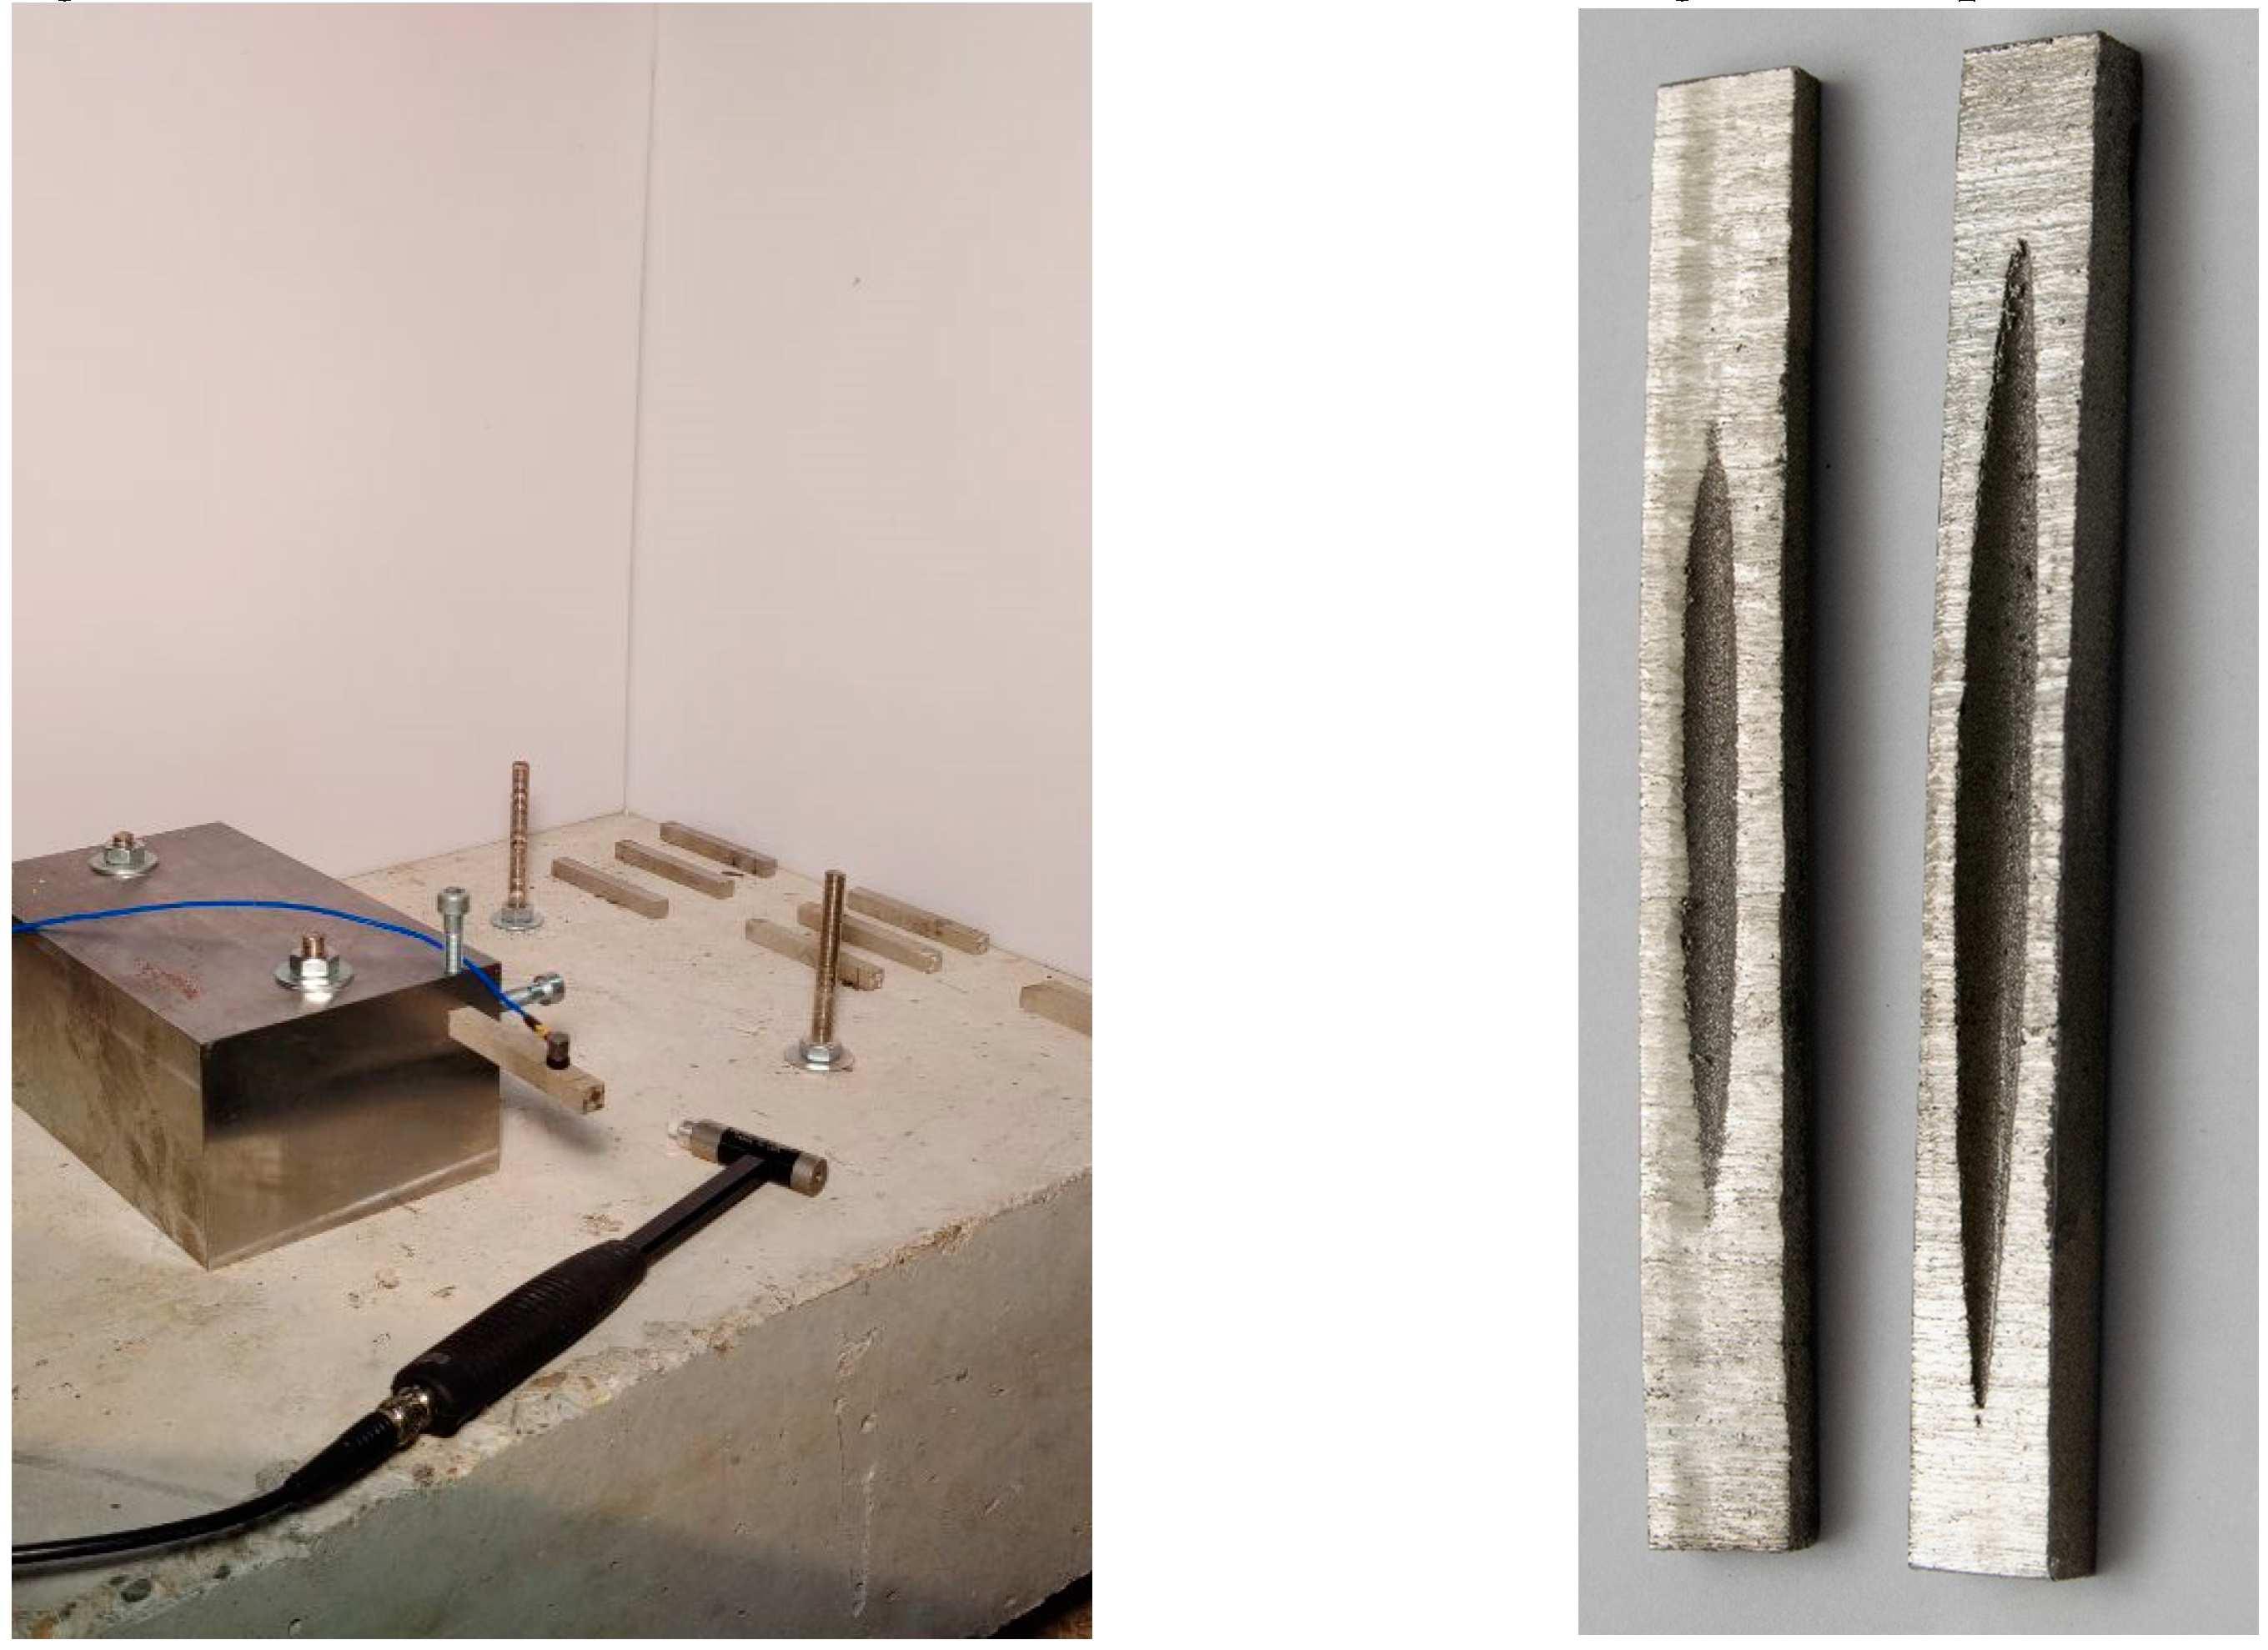
An oscillation test was performed to analyse the damping capability for this approach. The measurement setup is shown in
Figure 4. For this purpose, a number of specimens per each measurement series were clamped into a sample holder. With an impulse hammer, a Dirac impulse was then induced to start a free oscillation. When comparing the investigated structures with the structures in
Figure 4, it can easily be seen that the geometries “Geom VH3-8” in
Figure 5 comply with particle damper (c) and the multi-unit particle damper (d). “Geom VH1” and “Geom VH2” were used as reference for the evaluation.
To compare the geometry and shape retention, the specimens were cut in the middle and the cross-section was analysed optically as shown in
Figure 6.
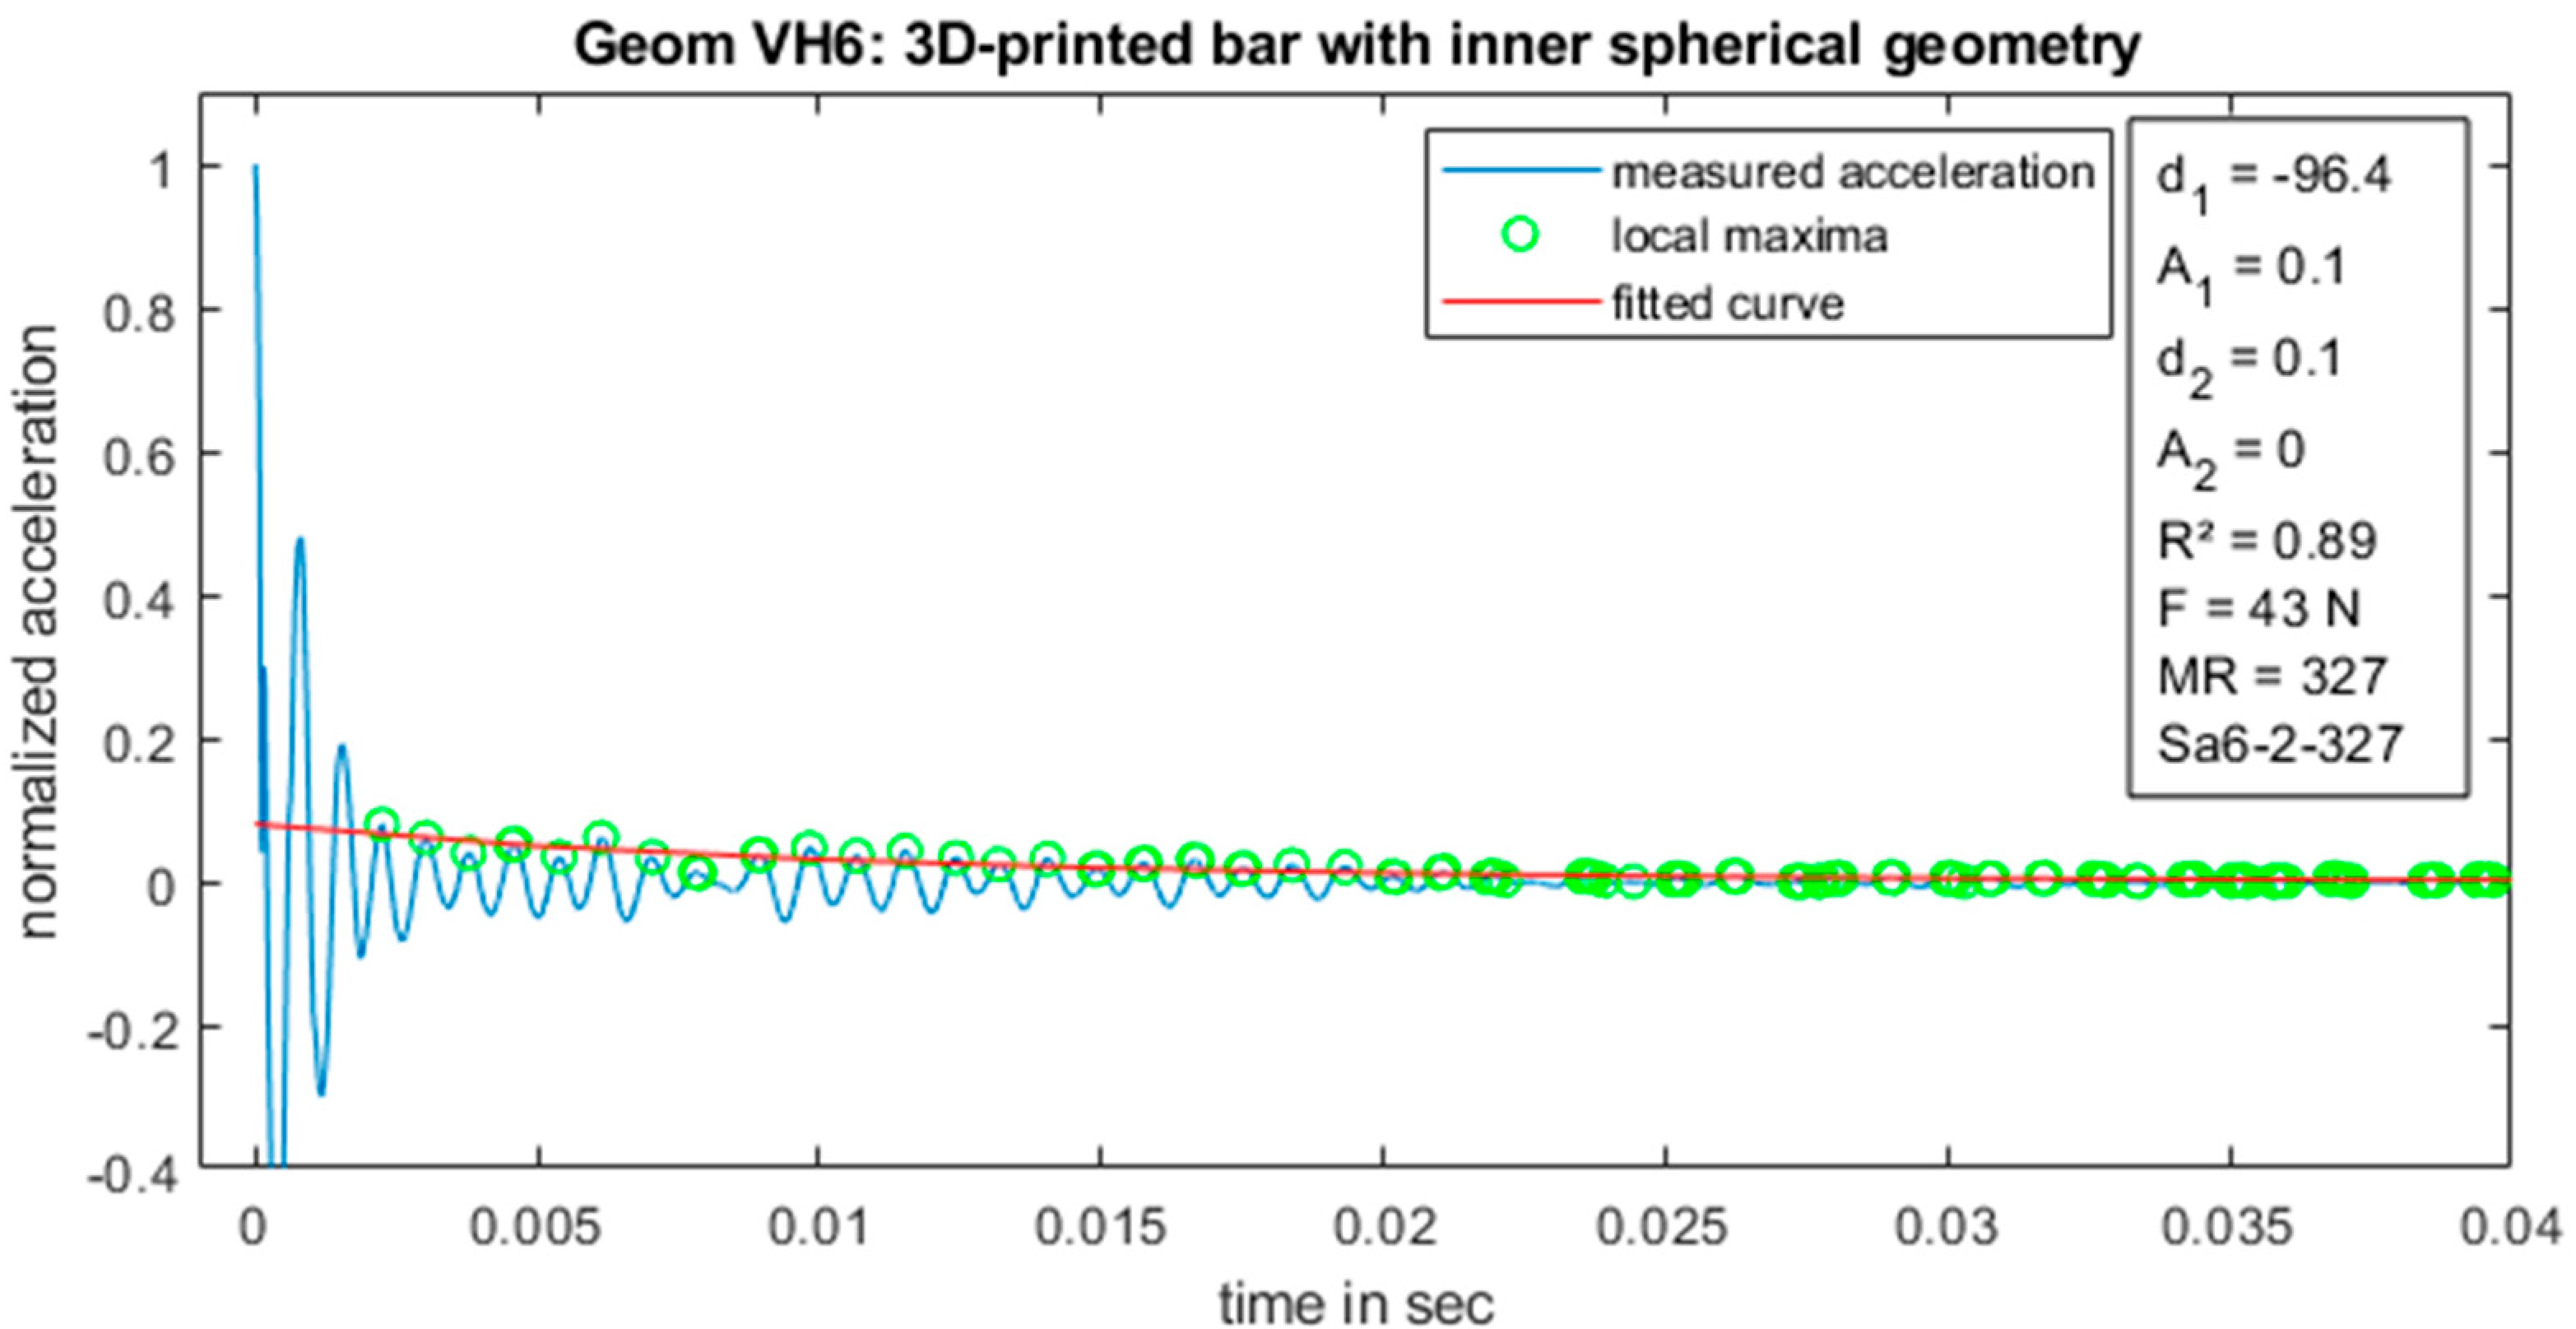
When comparing the inner structures of the shown geometries under consideration of the presence of sharp edges, the samples can be sequenced as: “Geom VH6” has no sharp edge in any direction because it is a spherical geometry, while “Geom VH3, 4, 7 and 8” have different edge lengths in relation to the force direction. These different lengths were considered as impedance elements affecting the dynamical behaviour. Therefore, the length of impedance elements was systematically modified.
The free oscillation was plotted based on the data from the acceleration sensor. Due to the excitation with an impulse hammer, the excitation force depended on the testing personnel. One measurement series consisted of at least three samples which were exposed to forces between 35 and 70 N. The forces were recorded to analyse a possible interrelationship between excitation forces and the parameters, which described the decrease in acceleration amplitude. For comparability, the mean value of the excitation force was 43 N with a standard deviation of 6.5 N. Every sample was tested up to 20 times in order to analyse samples under comparable settings.
For the comparison of damping coefficient, in this approach the reduction of acceleration over time was investigated. Assuming that the amplitude, â
damp, of a sinusoidal wave is time-dependent, the following expression (1) can describe the acceleration over time. The widely used logarithmic decrement is not applicable because some of the measured datasets show a superimposed oscillation. With the shown equation, it is possible to calculate the
R2 value for each point and thus exclude those data from global evaluation. For comparability, it is assumed that the oscillation could be described as a cosine function, starting (t = 0) with the maximum deflection initiated through the impulse hammer.
For the amplitude function, â
damp, an initial function had to be chosen. Referring to the aim of this research approach, which is concerned with the investigation of damping, it had to be an asymptotic function converging to zero. In the context of damped oscillations, first- and second-order (2) exponential functions are widely used.
The equation is based on two exponential functions; the parameters d1 and d2 in the exponent are dependent on the damping factors D1 and D2 and the angular natural frequency ω0.
When analysing the measurement data, it was readily apparent that a precise match between the data and amplitude function was not to be expected. For that reason, the R-squared coefficient of determination was calculated for each measurement and each sample. For a good determination, an R-squared of at least 85% was required.
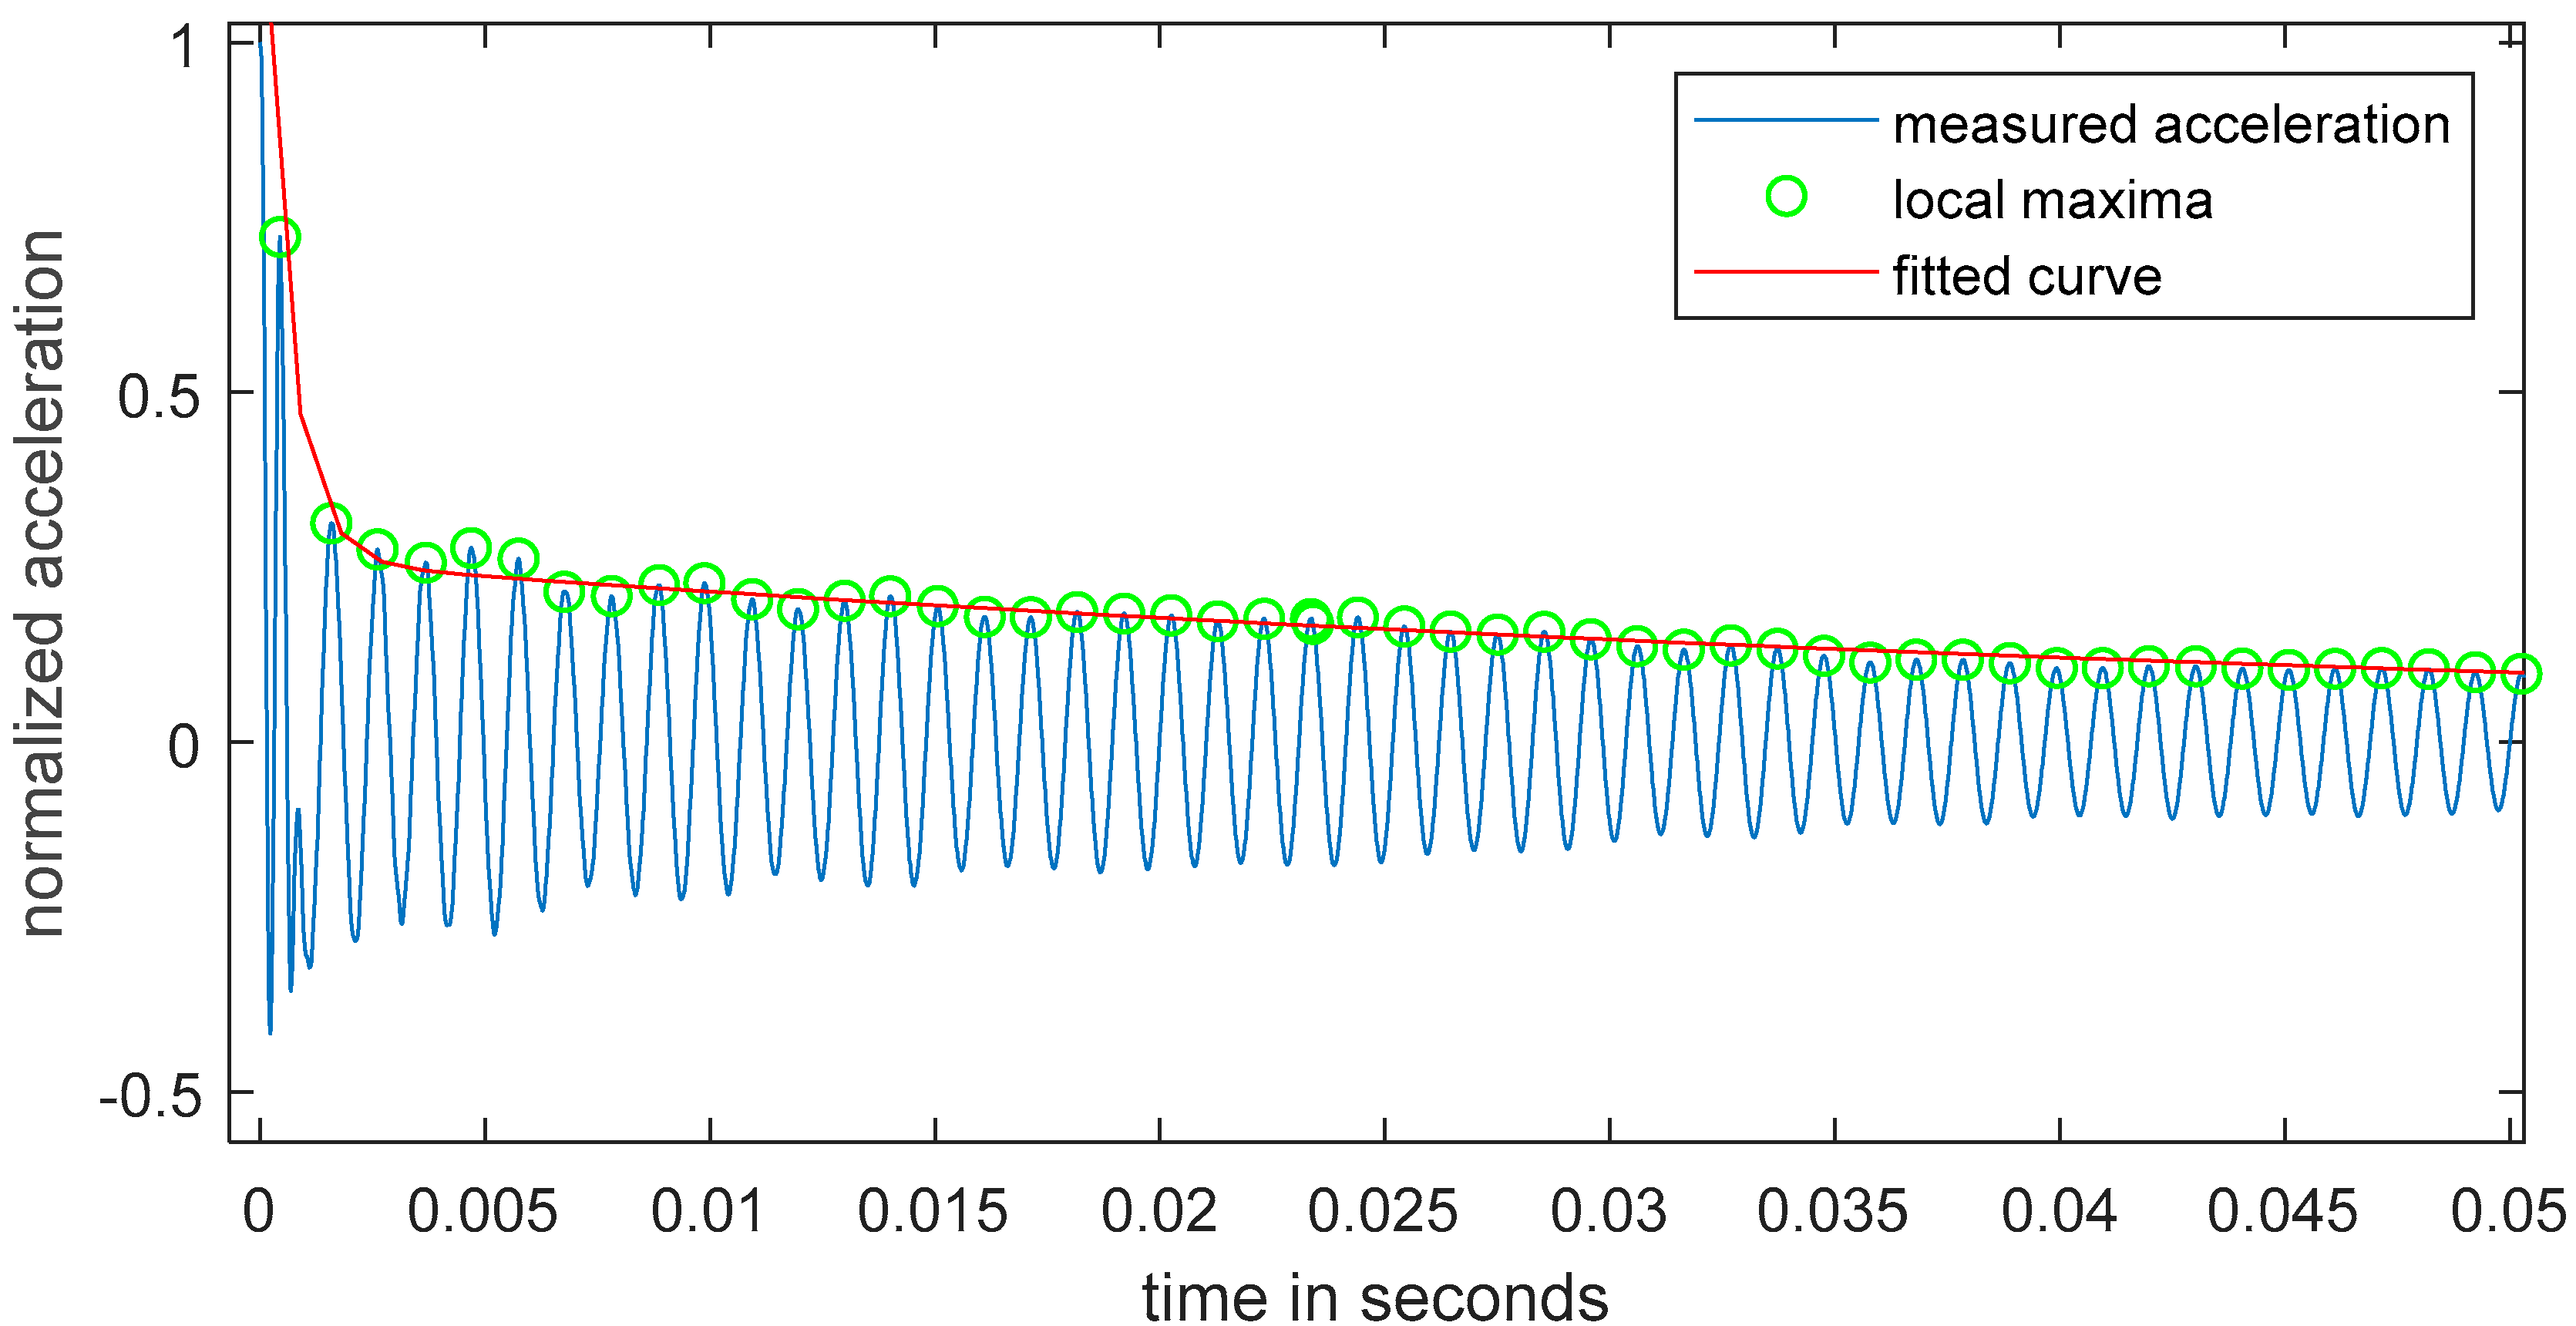
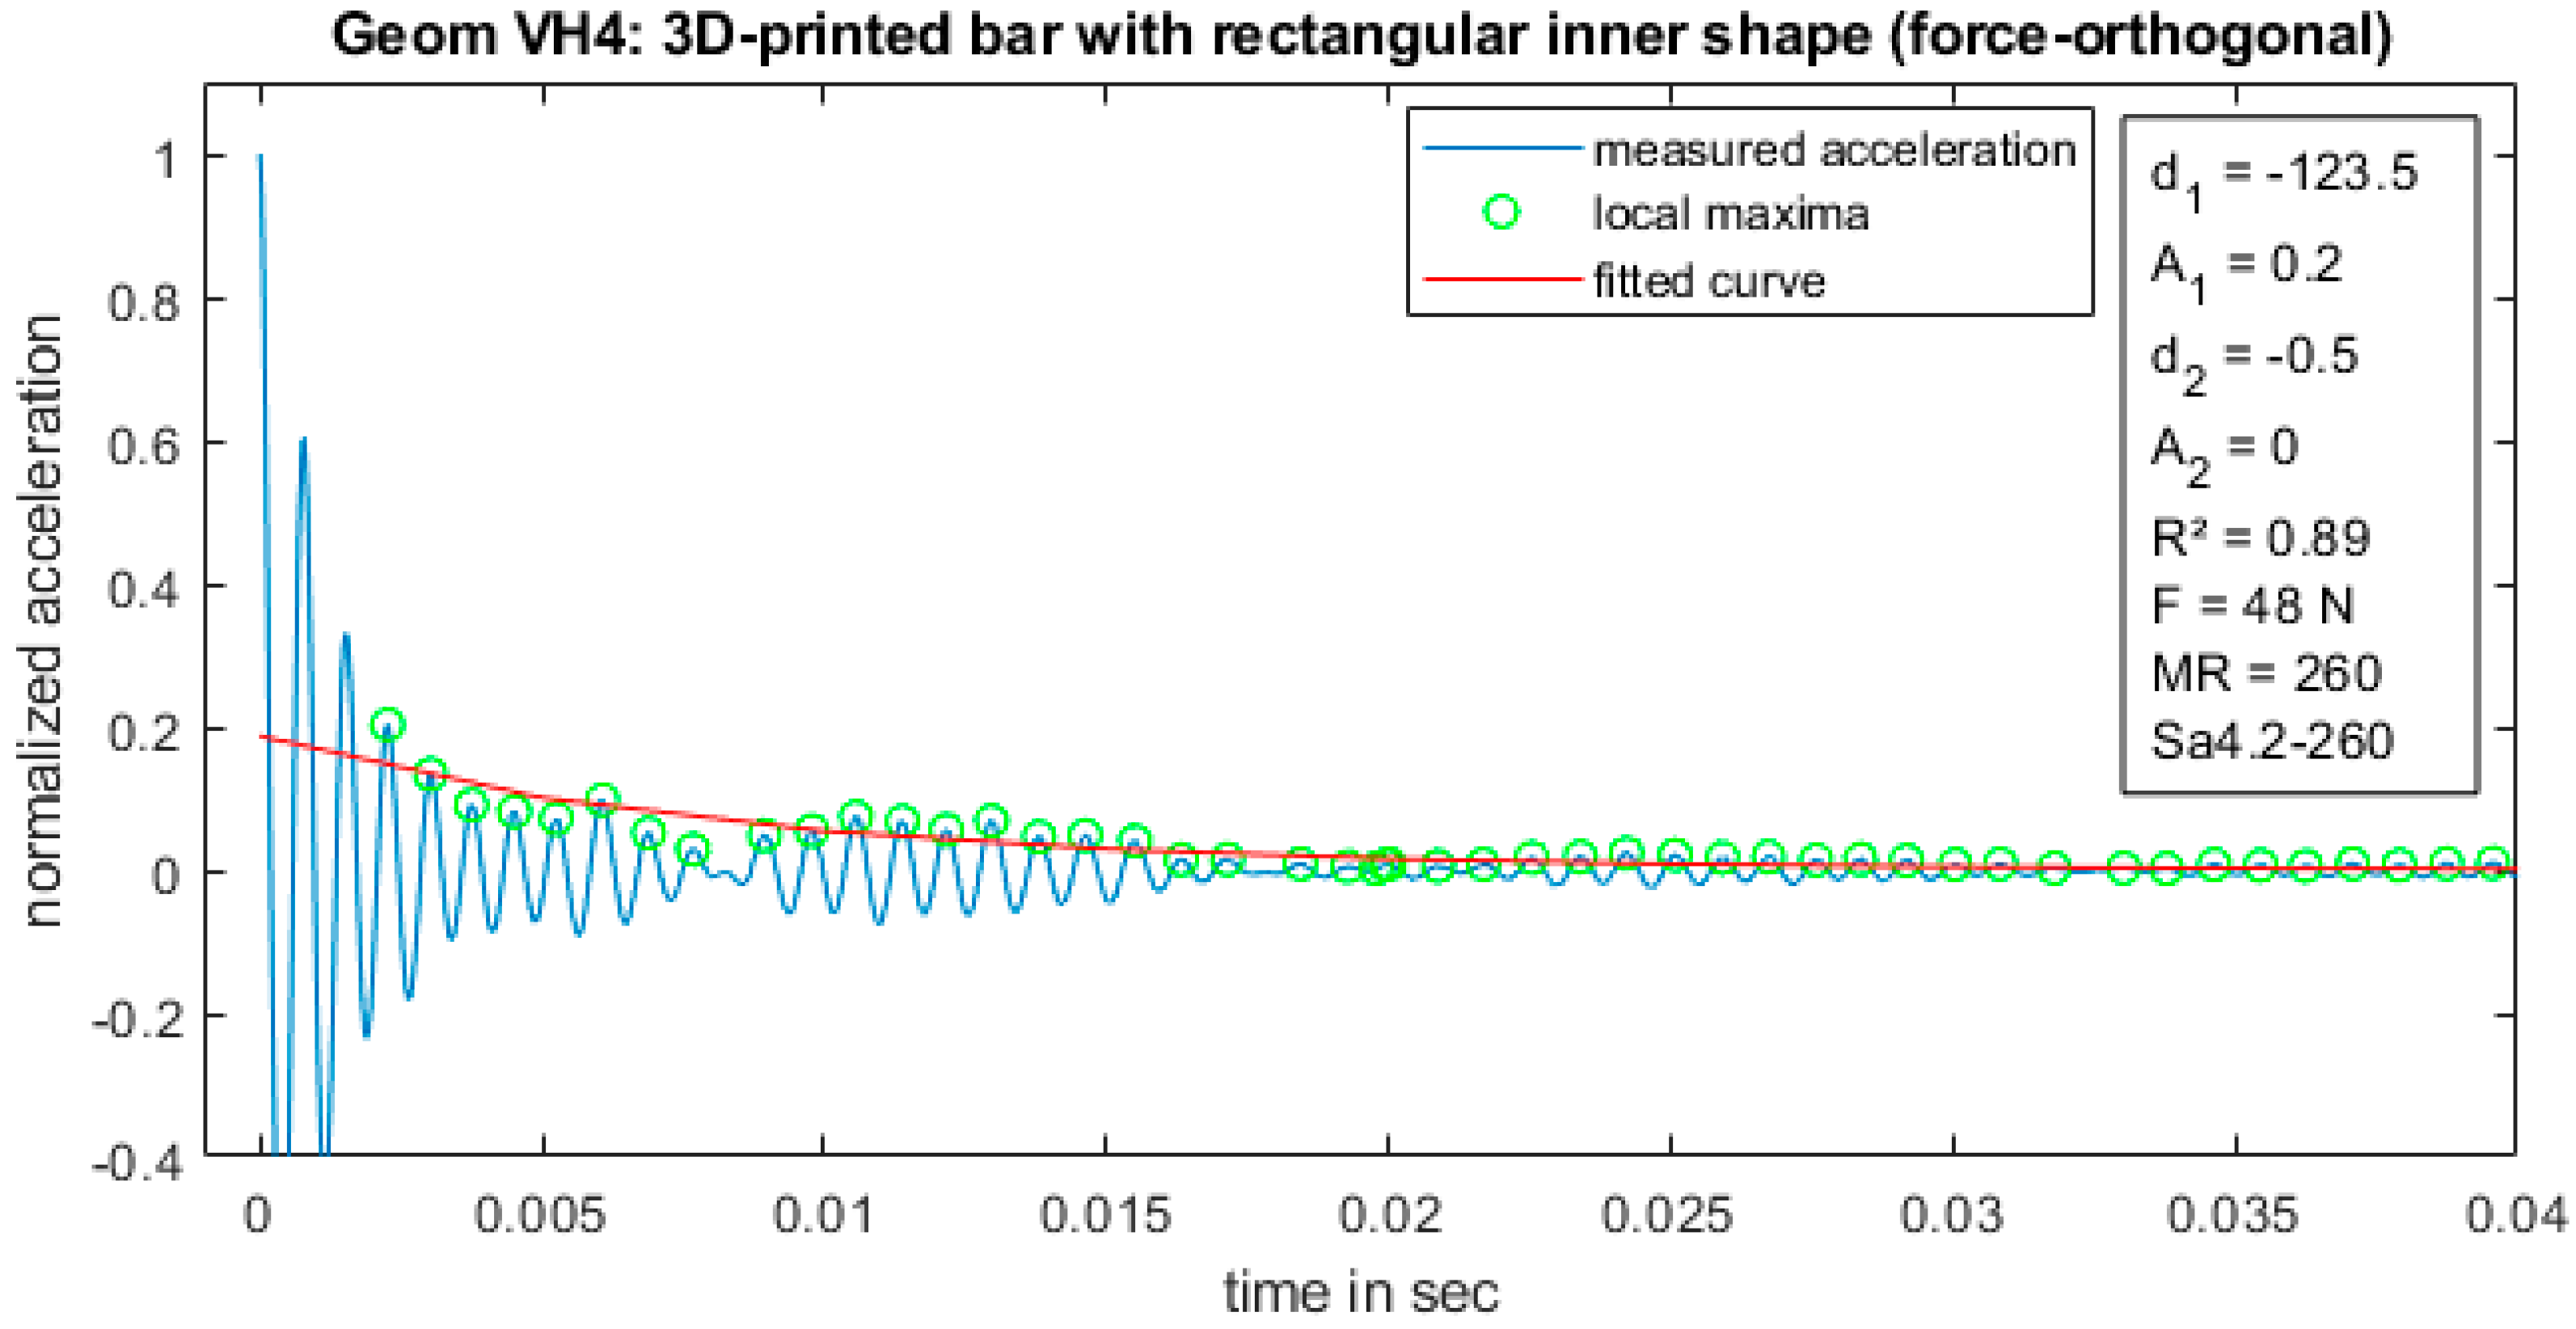
Figure 7 shows the general procedure for the evaluation process of the measured acceleration data. The green-marked high points of acceleration are the database for the fitted curve. The figure shows a sample which is printed but has no inner geometry. For the data shown, the coefficient of determination is 91%. The fitted function was calculated by the four parameters mentioned in Equation (2). Using those four parameters, the damping capacity of the measurements could be compared.
For further accuracy of the measured data, every measurement was analysed manually to make sure that, except for the measured R2 parameter, it was free from external acceleration.
4. Results
The shapes shown in the
Figure 5 oscillation are discussed in the following.
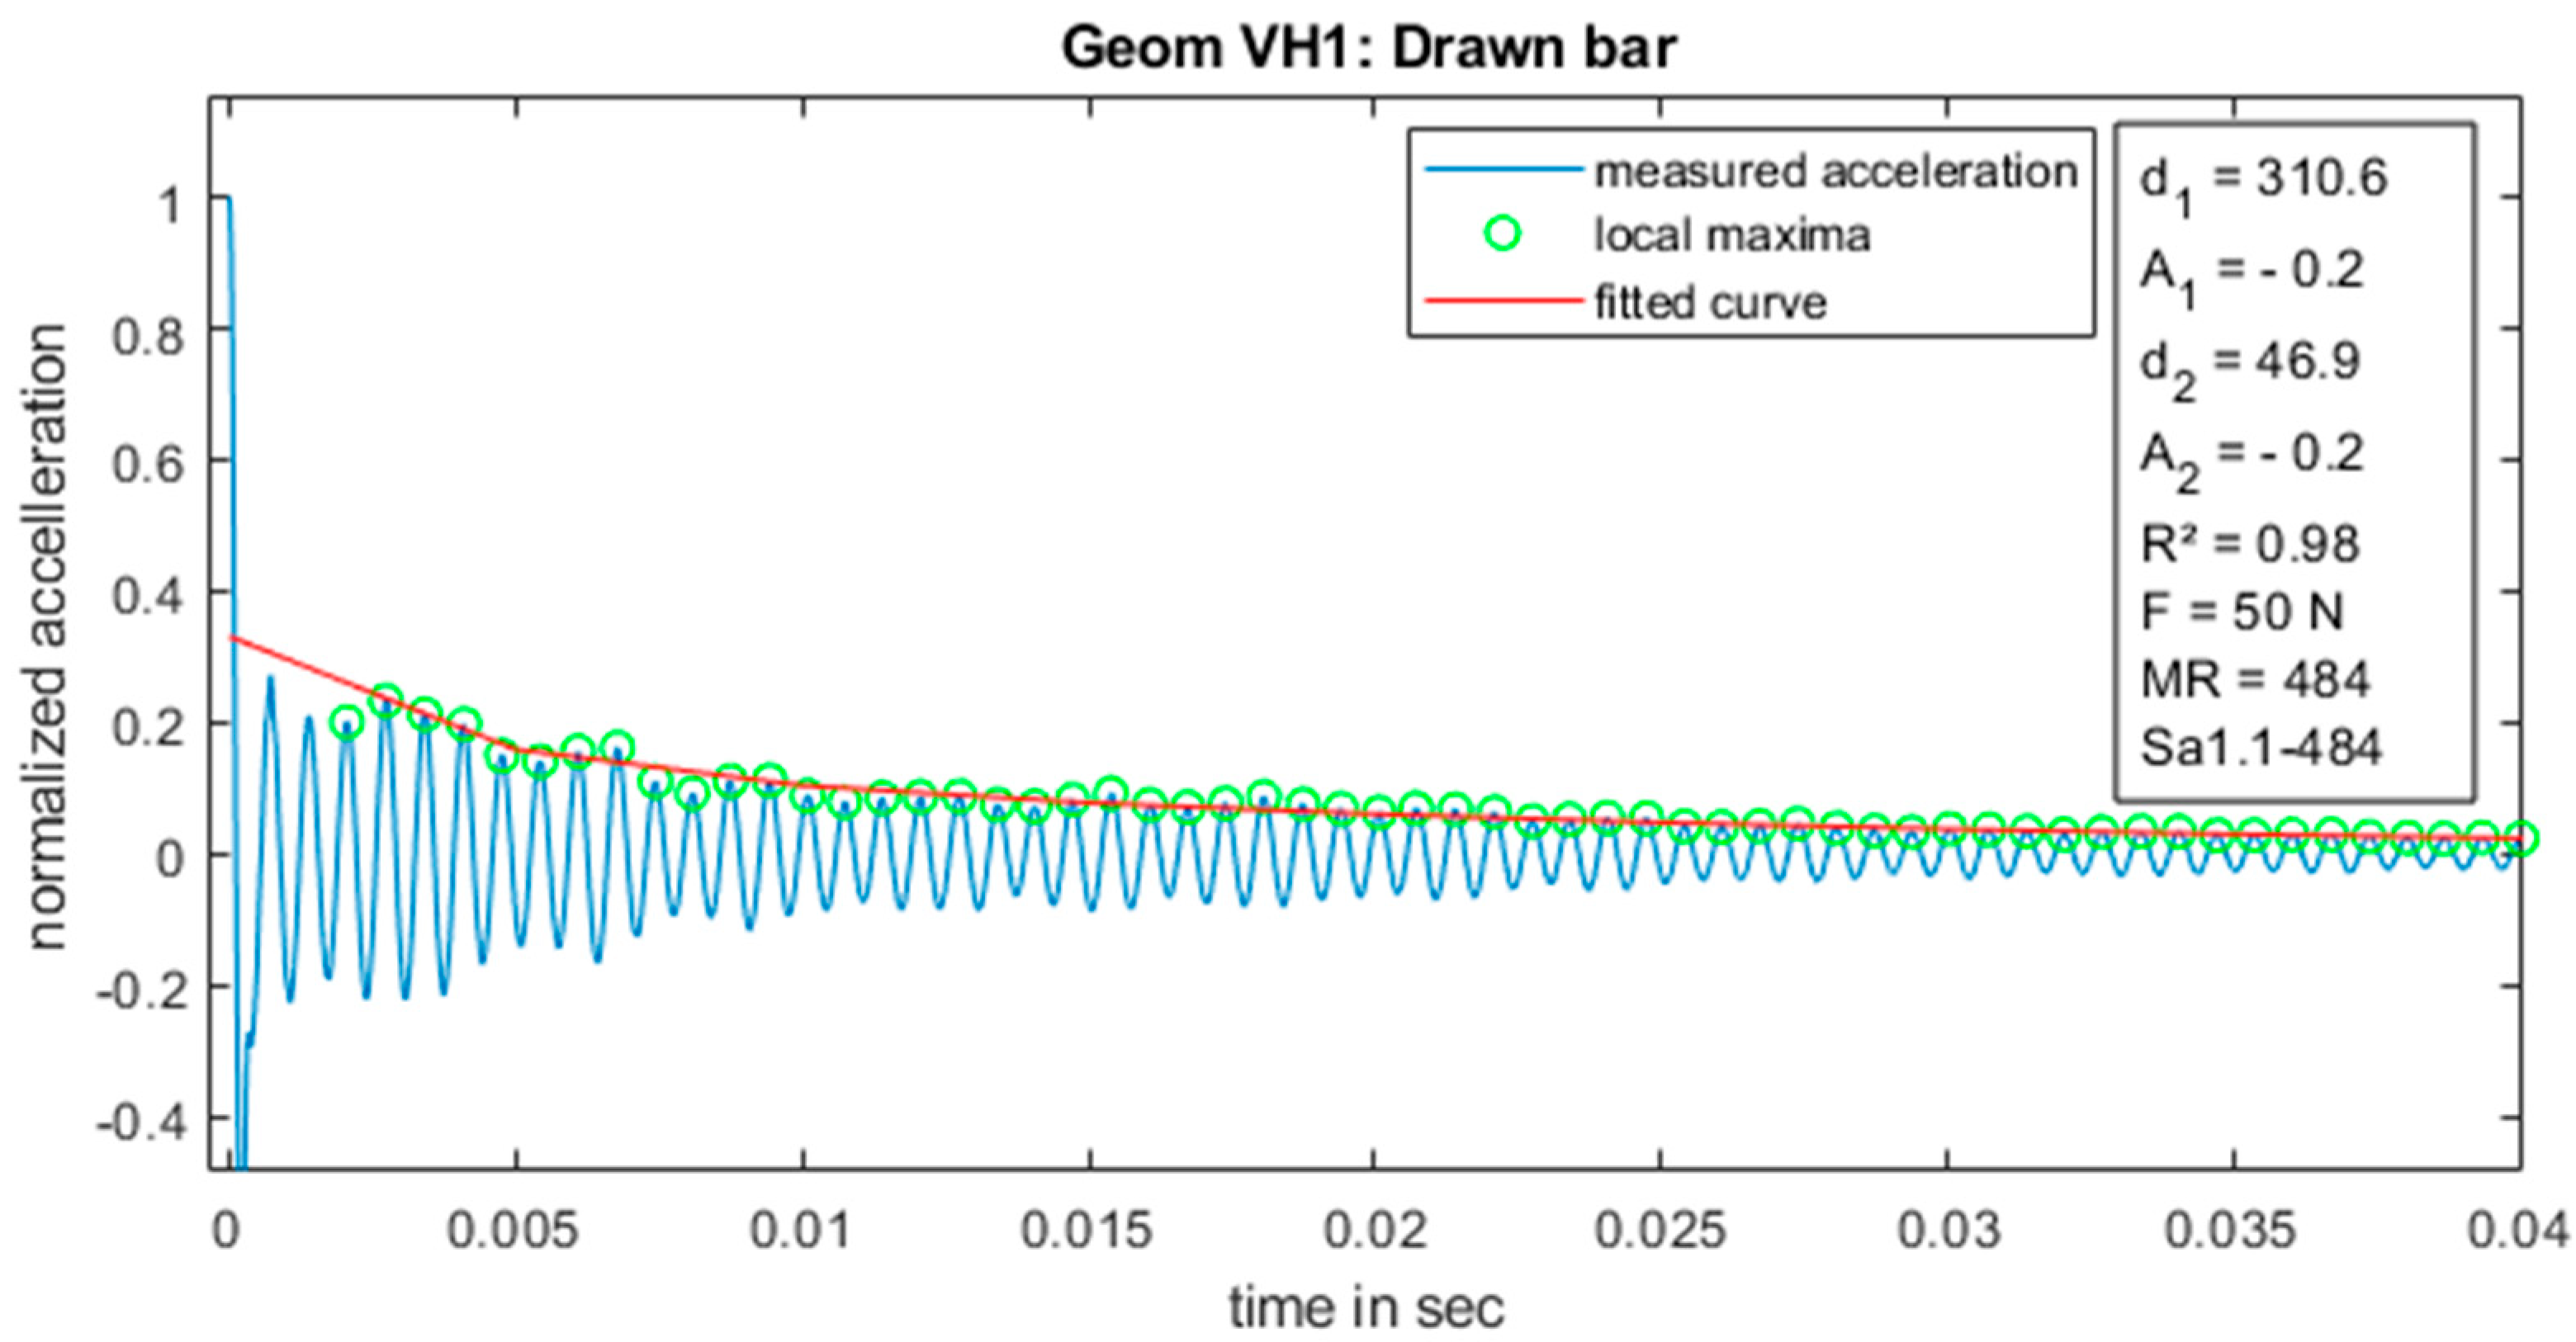
When the three diagrams are compared, the samples have similar natural frequencies with a small offset. For the drawn bar, the frequency of the visible high-frequency oscillation is 914 Hz. For the printed bar it is 931 Hz, and for the printed with inner geometry it is 940 Hz. Through a modal analysis in COMSOL Multiphysics a similar natural frequency of 976 Hz was determined.
Even though a lower natural frequency can be seen in
Figure 8, the coefficient of determination is high, which can be interpreted as a small amplitude of the lower natural frequency. Following a comparison of the samples of drawn material directly with printed materials, it is apparent that the production method has an influence on the damping of the samples. This influence can also be derived from a comparison between the measurement series “Geom VH1: Drawn bar” and “Geom VH2: 3D-printed bar”, which can be seen in
Table 1. For these two series, the four parameters seem to stay in the same dimension, although they still indicate a clear impact of the production method. The comparison of parameters of the following
Figure 8,
Figure 9 and
Figure 10 are represented in a more descriptive way in
Figure 11.
Further comparison concluded that the energy decay is highly related to the shape of the inner geometry.
Figure 10 and
Figure 11 indicate that the spherical shape leads to a significantly higher energy decay, thereby shortening the decay time. The natural frequency of the oscillation is almost constant for both series “Geom VH6” and “Geom VH4”.
For every measurement, the parameters A
1, A
2, d
1 and, d
2 were determined. For each geometry variant and each parameter, the distribution and median were calculated. The results of this calculation are shown in
Table 1. It can be seen that the influence on energy decay is highly related to the shape of the inner geometry and the orientation of the shapes in relation to excitation.
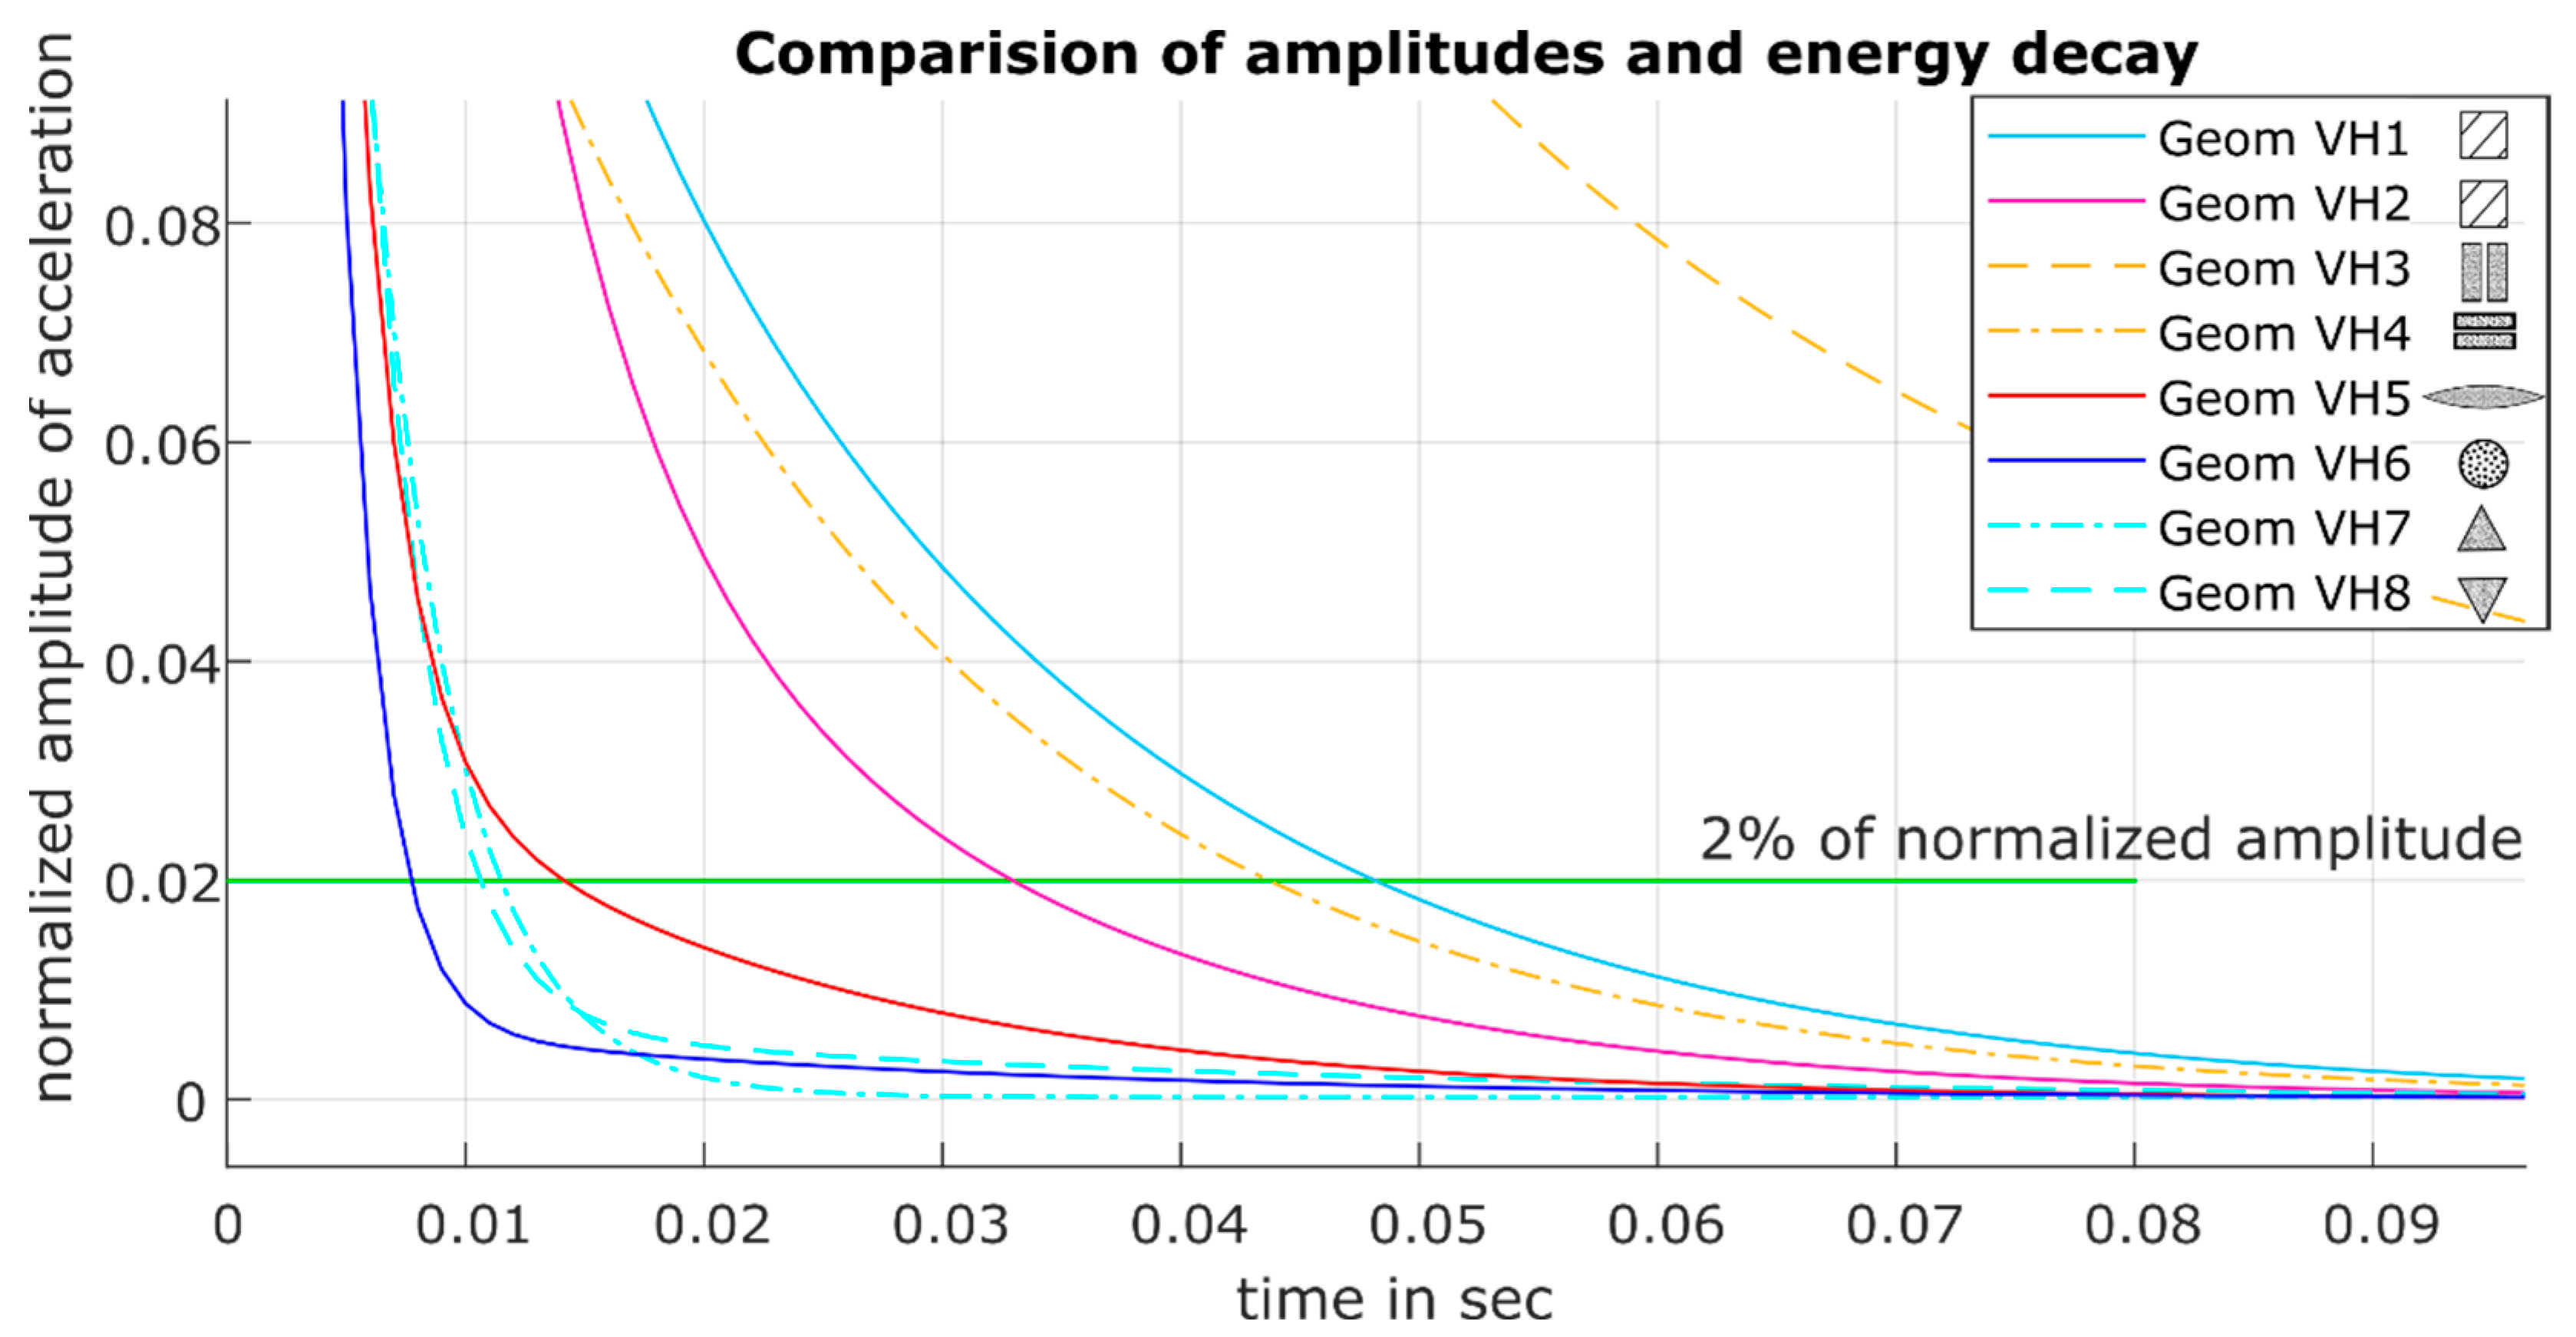
Figure 11 shows the possible influence of geometries, whereby the colour arrangement is chosen in such a way that the affiliation of the samples becomes apparent. The measurement series “Geom VH7” and “Geom VH8” are the same set of samples, but rotated by 180°. The two graphs show that the orientation of the geometry is not relevant, although the shape of the geometry is decisive for the damping.
Furthermore, a significant improvement of the decay time can be observed if the measurement series “Geom VH2” is used as a reference. The red “Geom VH5” and blue “Geom VH6” graphs show the two variants described with radii. The sphere is the special case of the ellipsoid, which shows the best damping with the shortest decay time. This means that the desired mechanical behaviour can be taken into account when designing the component by choosing the right geometry.
When considering the curves shown in
Figure 11, it can be seen that the decrease in acceleration amplitude is closely related to the two geometric variables “surface area of the inner geometry” and “shape and number of cavities”. The shape of the geometry must also be interpreted here in terms of the number of geometric edges, which influence the damping of the system to a considerable extent. This dependency becomes clear when comparing the geometries “Geom VH4” and “Geom VH6”: the spherical geometry has no inner edges, and thus has a very good volume-to-surface-to-cavity ratio. The cuboid geometries in “Geom VH4” have numerous edges and an unfavourable volume-to-surface ratio. In direct comparison with the triangular geometries from “Geom VH7” and “Geom VH8”, it is clear that when the ratio is improved, the energy decrease is stronger, and the amplitude is faster in the band below 2% of the starting amplitude, cf. t
2% in
Table 2.
The reason for the strong dependency can be assumed in the proportions of the friction types since by adjusting the volume-to-surface ratio the proportion of friction shifts towards particle–particle friction, cf.
Figure 3. When comparing “Geom VH5” and “Geom VH6” it is clear that the proportion of friction types cannot be shifted arbitrarily: a further increase of the volume-to-surface ratio did not cause further decrease in the settling time.
5. Discussion
The results suggest that the damping of powder-based damper geometries is generally effective. By using different geometries, it is possible to change the parameter sets to adapt the damping behaviour to a specific application.
A further investigation of the relationship between geometry and natural frequency could be helpful in analysing and customising the built structures. For the purpose of validation, the measurement of covered distance measuring excitation should be compared with the acceleration.
The appearance of lower frequencies in the acceleration plots needs to be analysed. Therefore, a discussion of the amplitude as well as the appearance in other measurement data will be considered.
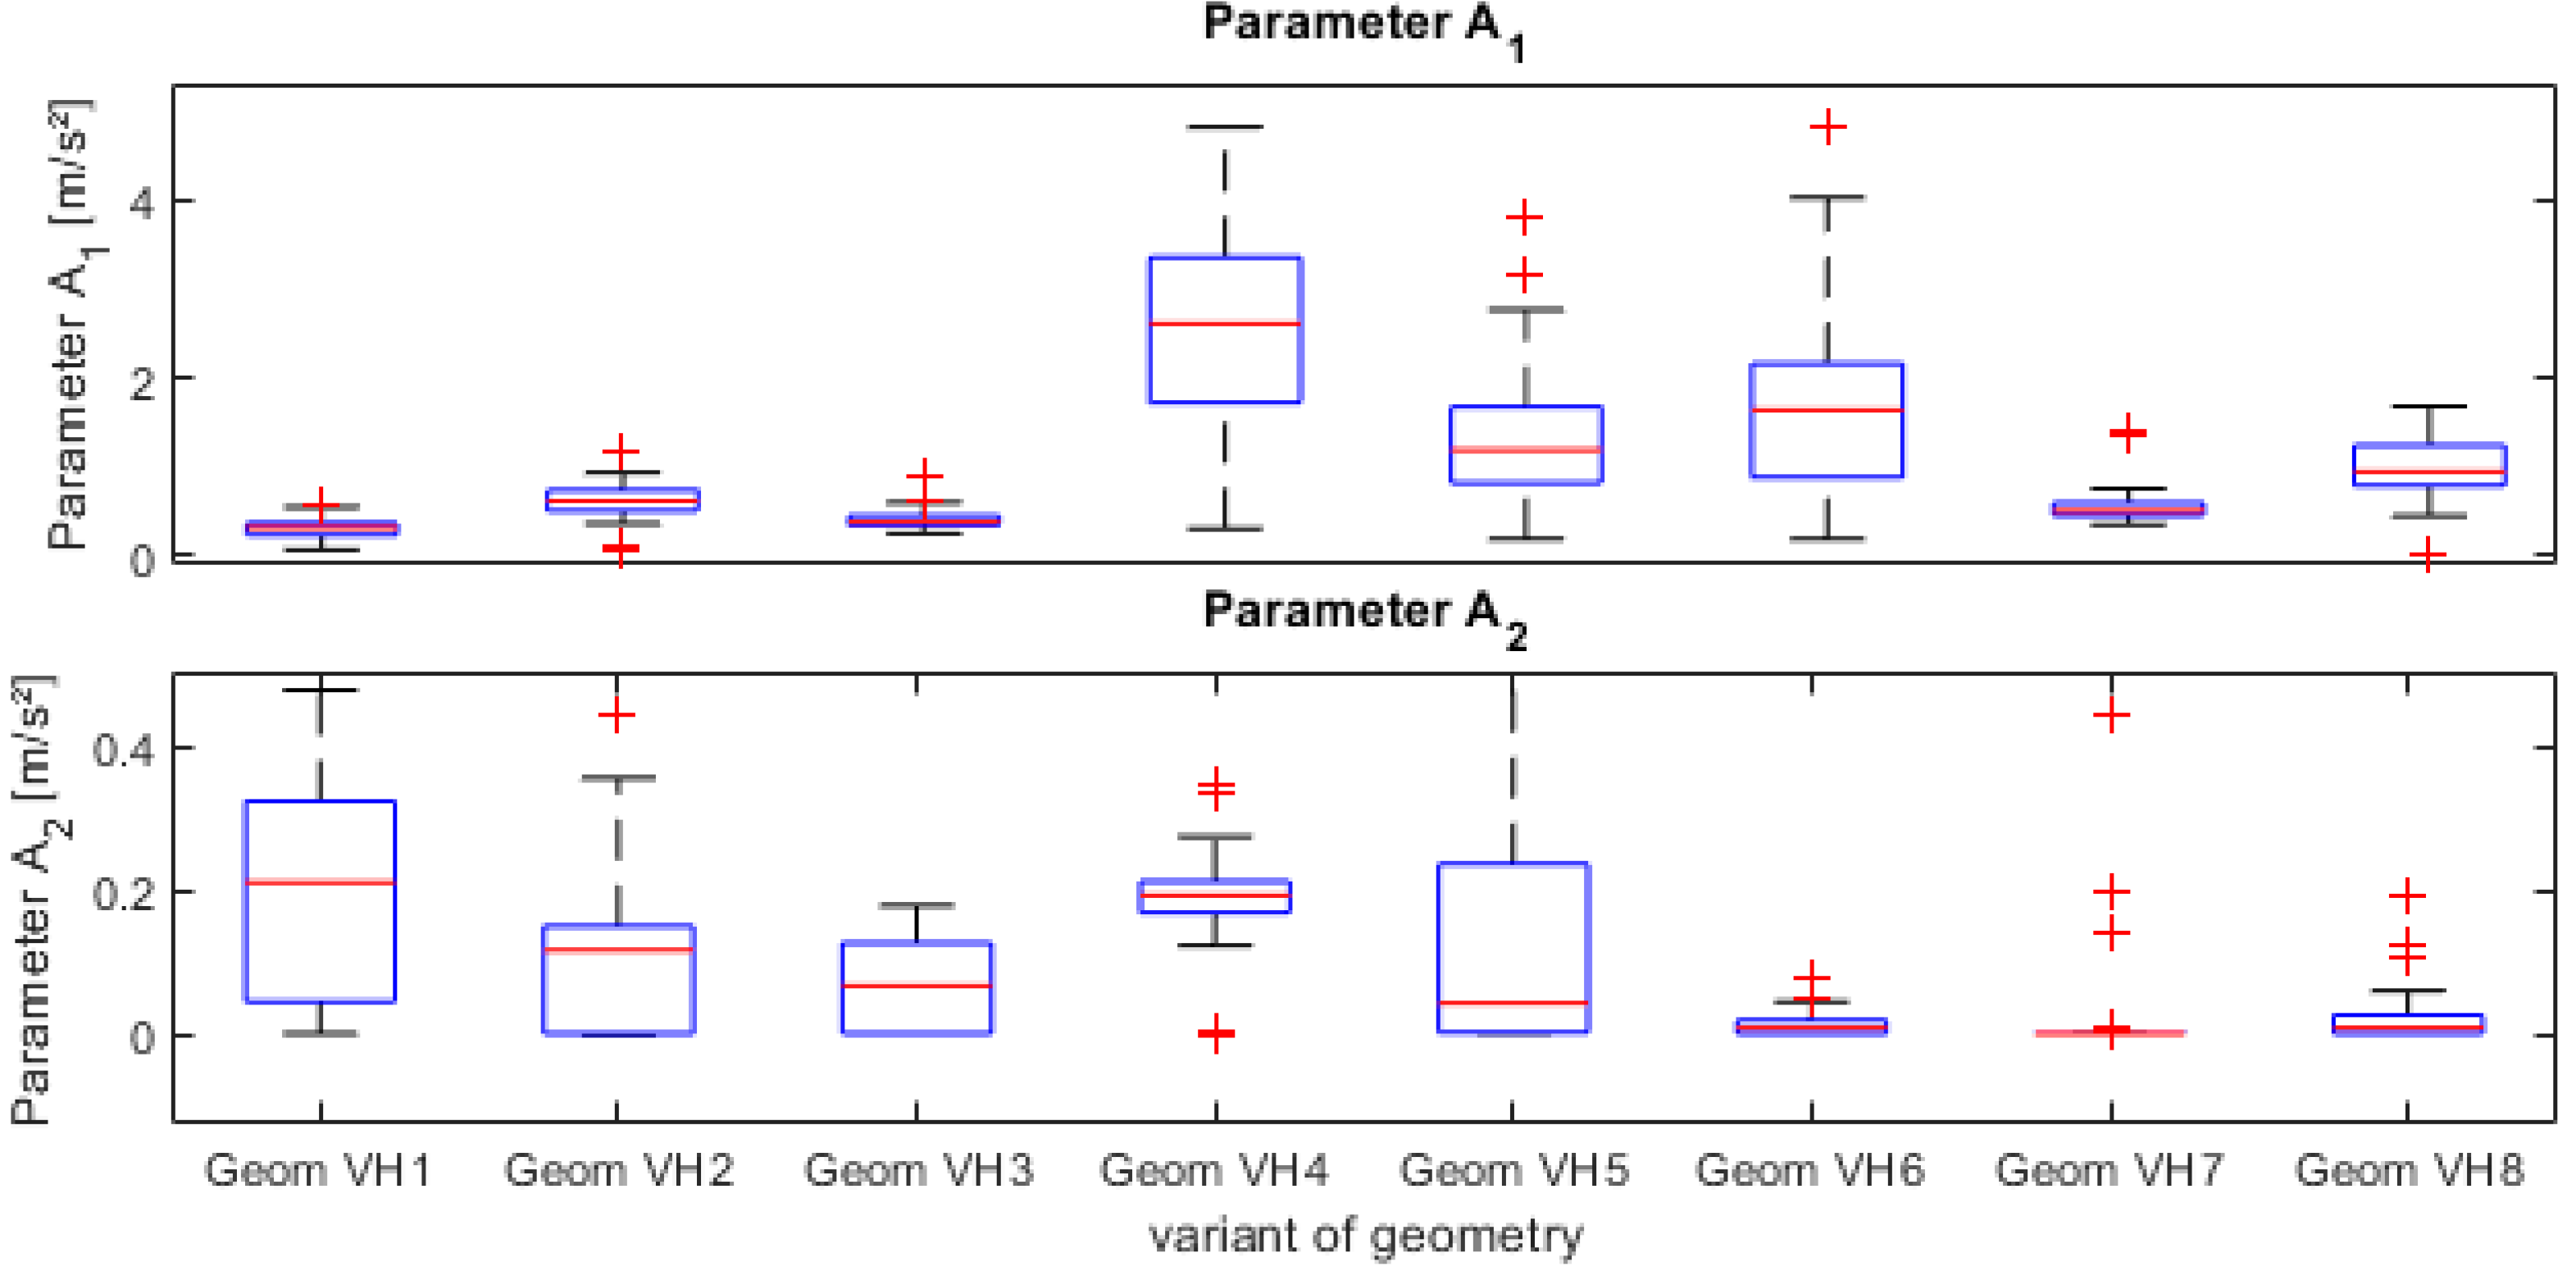
For the first statistical classification and evaluation, the derived parameters for all generated measurements were collected and analysed using the boxplot graphics shown in
Figure 12. From this graphic, it is possible to obtain a first overview of the scattering of parameters, and this helps in comparing the geometry variants. The plot shows that the scattering of parameters A
1 and A
2 is connected with the geometry variants and seems not to be bonded to a specific shape of inner geometry. A possible reason for this is an external dynamical interspersion in the measurement setup while measuring variants VH4 to VH6. The influence cannot be seen in the evaluation of parameter A
2, which has a lower influence on the decay curve than parameter A
1.
During the analysis of the distribution field of the derived parameters, it has to be considered that the calculated values are dependent on another variable which has not yet been evaluated. This assumption can be derived from the fact that the median of the parameters is not in the middle of the percentile. Based on this statement, the development either does not follow a normal distribution or is related to a nonlinear geometry parameter.
6. Conclusions
The shape of inner geometry is highly relevant to describe the energy decay in 3D-printed bars. The shown acceleration development of the investigated samples gives a brief overview of the derived parameters and the methods used. After analysing the shown describing parameters for energy decay in comparison with the distribution fields, it can be derived that those datasets that have high damping shortly after excitation have a comparatively higher parameter set for A and d1. With the aim of damping where a started oscillation is damped as quickly as possible, a high value of parameter d1 seems to be the first criterion for evaluating the damping capacity. Other studies found that the height of the excitation has an important influence on the damping capacity; this could not be proven in this study.
A very useful point for further investigations is the distinction between powder impact and the influence of shapes as impedance discontinuities. In order to gather this information, additional measurement series with powder openings are scheduled.
The gathered information about parameter sets and the correlation with geometries have to be investigated in further studies. It is necessary to evaluate how the size and volume of the geometry affect the parameter sets. Moreover, it is necessary to take a closer look at the scattering and possible reasons for it.


