Article

Environment- and Genotype-Dependent Irrigation Effect on Soybean Grain Yield and Grain Quality

by
Maja Matoša Kočar
1,
Marko Josipović
1,
Aleksandra Sudarić
1,2,
Hrvoje Plavšić
1,
Ivica Beraković
1,
Atilgan Atilgan
3 and
Monika Marković
4,*
1
Agricultural Institute Osijek, Južno predgrađe 17, 31 000 Osijek, Croatia
2
Center of Excellence for Biodiversity and Molecular Plant Breeding, Faculty of Agriculture, University of Zagreb, Svetošimunska cesta 25, 10 000 Zagreb, Croatia
3
Faculty of Engineering, Alanya Alaaddin Keykubat University, 07425 Alanya, Turkey
4
Faculty of Agrobiotechnical Sciences Osijek, Josip Juraj Strossmayer University of Osijek, Vladimira Preloga 1, 31 000 Osijek, Croatia
*
Author to whom correspondence should be addressed.
Appl. Sci. 2023, 13(1), 111; https://doi.org/10.3390/app13010111
Submission received: 16 November 2022 / Revised: 16 December 2022 / Accepted: 19 December 2022 / Published: 22 December 2022

Abstract

:
This four-year study with four elite soybean lines with different maturities was conducted to investigate the impact of deficit (a field water capacity, or FWC, of 60%) and full irrigation (an FWC of 80–100%) on soybean grain yield and grain quality (grain protein and oil contents and crude protein and oil yields), depending on the environmental conditions and genotype. Overall, the irrigation effect was positive for the grain yield and grain protein content but negative for the grain oil content. The differences between the full and deficit irrigation were only 2.9% for the grain yield, 2.8% for the crude protein yield and 1.7% for the crude oil yield. The results indicate that deficit irrigation could be the best option for optimizing soybean production in environments similar to the tested one. In such conditions, further rationalization of soybean production could be achieved by choosing the C2 genotype (0 maturity group), which, combined with deficit irrigation, had the highest grain, crude protein and crude oil yields.

1. Introduction

Soybean (Glycine max (L.) Merr.) is the most important oilseed crop in the world. It is an important source of proteins for food, feed and nutraceutical compounds for the pharmaceutical industry [1]. Although soybean areas have increased from 2,736,400 ha in 2010 to 5,294,214 ha in 2020 [2], the agro-climatic conditions in Europe are not ideal for the widespread cultivation of soybeans [3]. Since European agriculture is mainly rain-fed, with a share of irrigated area of only 6% [4], one way to ensure increased production and yield stability in unstable, extreme weather conditions with limited potential for cropland expansion is to grow cultivars with a shorter life cycle, sufficient drought resistance and high yield potential under European growing conditions [5]. Another suggestion for improving soybean production in Europe is irrigation [6]. Assumed future decreases in water availability in the mid-latitude spatial regions of the world [7], where most of Europe is situated, will require improving the efficiency of water use. Soybeans can withstand shorter-duration droughts in their early vegetative stages without considerable yield reductions [8]. Water needs increase in their reproductive stages, i.e., from the beginning of flowering (R1 stage of soybean development according to Fehr and Caviness [9]) to pod development (R3) and up until full seed development (R6). These reproductive stages occur during the summer, when high temperatures and water shortages are regular in many European soybean-growing regions. As water shortages during this period can have a significant negative impact on yield [10,11,12], maintaining production at its present level or increasing it will require precise irrigation scheduling to increase the yield per unit of irrigation water applied. The literature shows that not only the irrigation scheduling has an impact on the soybean yield [13,14,15,16,17] but different irrigation strategies as well. For example, Marković et al. [18] noted a significant increase in the soybean yield in average climatic years within deficit irrigation (60–80% of the field water capacity, FWC), while full irrigation (80–100% of the FWC) significantly increased the grain yield compared to deficit irrigation only during the extremely warm and very dry growing conditions. In the same agro-ecological conditions, Galić Subašić et al. [15] achieved the highest soybean yield under full irrigation, regardless of the weather conditions. A large number of studies have also examined the impact of irrigation on soybean grain quality. The results were inconsistent. Some of the studies reported no impact of irrigation on the oil content [14,19], some reported an increased oil content [13], and some reported a reduced oil content due to irrigation [11,20,21]. Nevertheless, the increase in grain yield as a result of irrigation should compensate for the oil content decrease, increasing the final oil yield. As for the soybean protein content, some authors have reported an increase in the protein content [14], while others [22] have reported a lower protein content in irrigated conditions. All of the mentioned inconsistencies add to the necessity for further studies.
Considering the given background, the main hypotheses of this study were as follows: (i) the effects of applied irrigation treatments (deficit irrigation maintaining the soil water content (SWC) at 60% of the field water capacity (FWC) and full irrigation maintaining the SWC at 80–100% of the FWC) on soybean grain yield, grain protein content, crude protein yield, grain oil content and crude oil yield will largely depend on the specific environmental conditions and genotypes; (ii) among the tested genotypes and irrigation treatments, we will be able to select the optimal combination that is most productive in the tested environmental conditions. Therefore, the aims of this study were to determine the variability in the irrigation effect on soybean grain yield and grain quality depending on the genotype selection and environmental conditions.

2. Materials and Methods

The field study was conducted at an experimental station of the Agricultural Institute Osijek (45°32′ N and 18°44′ E, 90 m above sea level), Republic of Croatia, during a four-year period (A1 = 2010; A2 = 2011; A3 = 2011; A4 = 2012). The location has a temperate continental climate (Cfwbx climate class) with an annual precipitation of 650 mm and an average annual air temperature of 12 °C [23]. The first growing season (A1) was extremely wet and warm, with rainfall that was 308.6 mm (83.69%) higher than the rainfall long-term average (RLTA, 368 mm) and an average air temperature that was 1.8 °C higher than the temperature long-term average (TLTA, 17.5 °C; Figure 1). The second growing season (A2) was extremely dry and very warm, as it had 123.1 mm (33.45%) less rainfall than the RLTA and an average air temperature that was 1.2 °C higher than the TLTA. The third growing season (A3) was dry and very warm, with 76.8 mm (20.87%) less rainfall and an average air temperature that was 1.8 °C higher than the TLTA. The fourth growing season (A4) was wet and warm, with 52.3 mm (14.21%) more rainfall and an average air temperature that was 1 °C higher than the LTA (Figure 1).
According to the WRB soil classification [24], the soil at the study site is classified as anthropogenic eutric cambisol with a silty clay loamy texture. The physical and chemical properties of the soil are given in Table 1.
The soil was analyzed in the first year of the study before sowing according to ISO 11464 in a drying oven. A pH analysis was performed according to ISO 10390, i.e., in a 1:5 (v/v) suspension of soil in water and a 1M potassium chloride (KCl) solution. The SOM was analyzed by a method prescribed in ISO 14235 using organic carbon (C) by sulfochromic oxidation. The plant-available phosphorus (P2O5) and potassium (K2O) were extracted using an AL solution (ammonium lactate–acetate) and detected by spectrophotometry and flame photometry, respectively. According to the soil analysis results, the soil reaction (pH) at up to 30 cm depth is neutral, with low organic matter and high levels of P and K.
The field study was carried out in a split-plot design with three factors (environmental conditions/growing season, irrigation and soybean genotype) in three replications. The factors included the following: four environmental conditions/growing seasons (A1–A4), three irrigation levels (B1 = rain-fed conditions (control); B2 = deficit irrigation maintaining the soil water content (SWC) at 60% of the field water capacity (FWC); B3 = full irrigation maintaining the SWC at 80–100% of the FWC), and four genotypes (C1–C4), resulting in 12 treatment combinations and 36 experimental plots in total. The basic plot area for each soybean genotype (C) was 3 rows (0.5 m inter-row space) = 1.5 m × 20 m row length = 30 m2. Prior to the sowing and during vegetation, all conventional agricultural management practices were applied.
The plant material consisted of four elite soybean lines originating from the Agricultural Institute Osijek. Genotype C1 belonged to the 00 maturity group (MG), and it had the shortest growing cycle (100–105 days from sowing to maturity); C2 belonged to the 0 MG with a 115–125-day life cycle; C3 and C4 belonged to the I MG with 130–135-day life cycles. The sowing was performed at the end of April at the recommended plant densities, which varied depending on the MG (70, 65 and 60 plants m−2 for the 00, 0 and I MGs, respectively). The environmental/growing season effect (A) was observed as the impact of meteorological conditions, i.e., the amount and distribution of precipitation (mm) and air temperatures (°C) on soybean grain yield and grain quality. Plot harvesting was performed with a small plot combine harvester at full maturity, usually in the first half of September.
The weather data (rainfall (mm), air temperature (°C), humidity (%), wind speed (m s−1) and sunshine (h)) were obtained from a weather station located 1.5 km from the study location. The climatological characteristics classification for each study year was performed according to the distribution analysis of the climatic elements, probability percentiles and estimation of the extremes performed by the Croatian Meteorological and Hydrological Service (2022). Weather data for the growing seasons A1 to A4 were compared with long-term (1961–1990) average data (Figure 1). The Penman–Monteith methodology [25] was applied to calculate the reference evapotranspiration (ETo).
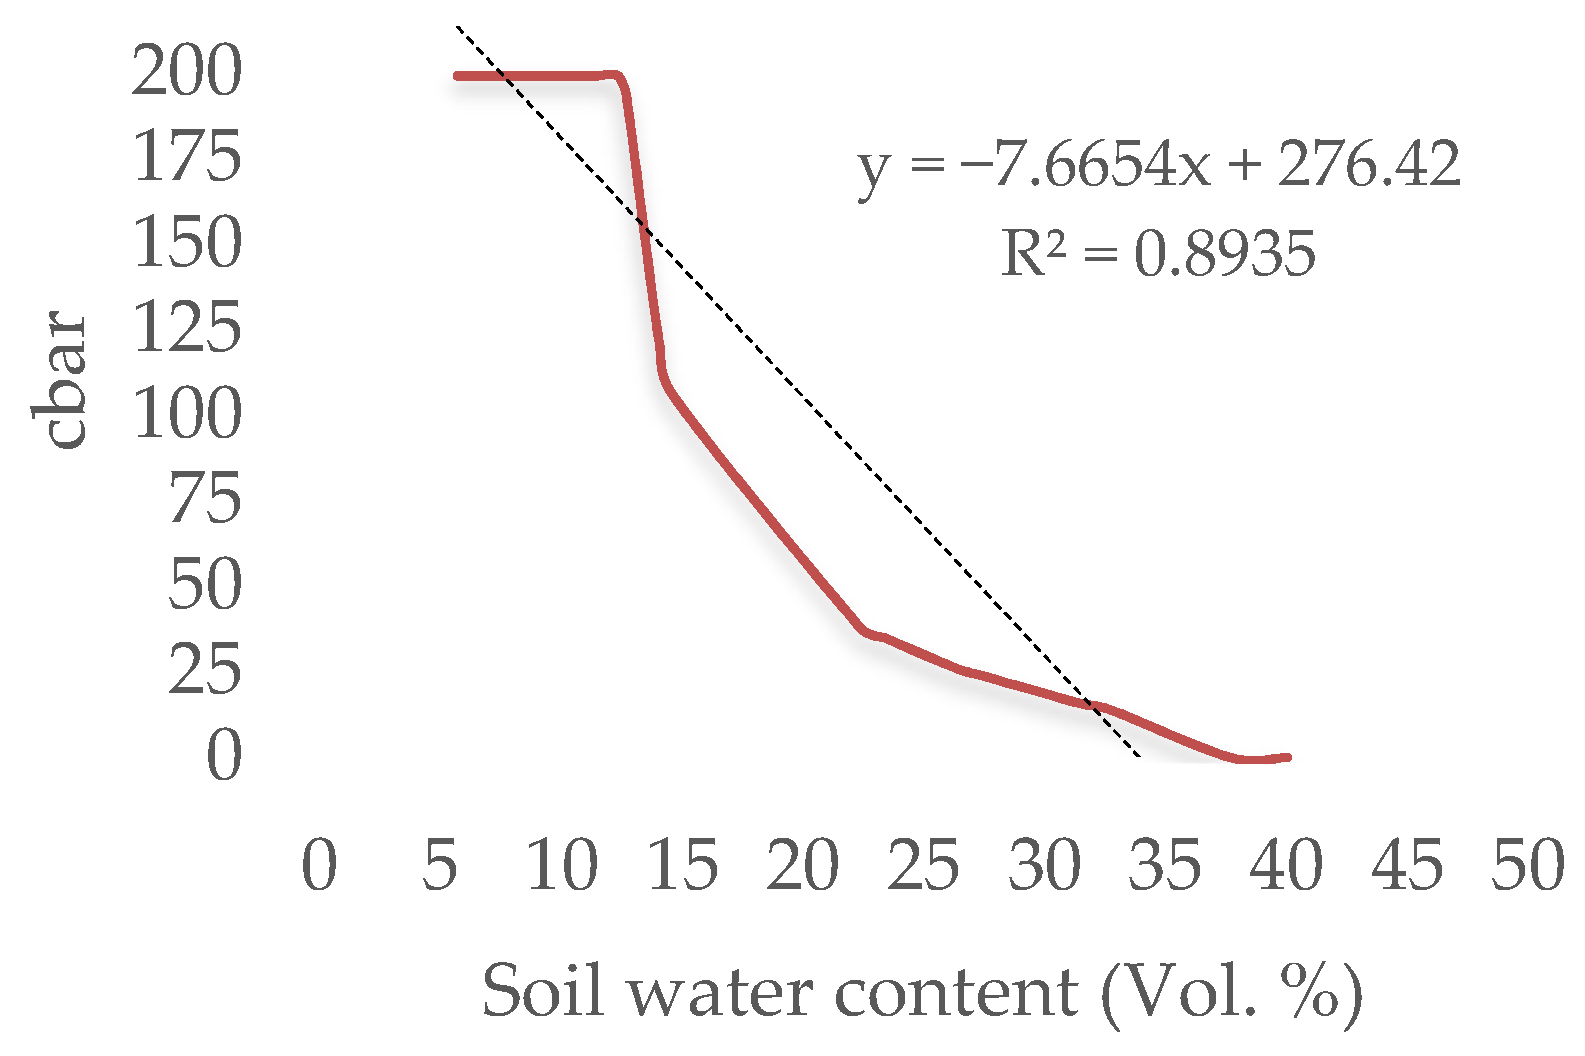
The soybean crops were irrigated with a traveling sprinkler system, and the irrigation time was determined by measuring the soil water content (SWC) with granular matrix sensors (GMSs) that were placed in the soil at two depths (20 and 30 cm), while the irrigation time was determined according to the SWC at the average depth (25 cm). Before use, the GMS sensors were calibrated for the soil at the study site. The calibration curve is presented in Figure 2, in which the red line represents the relationship between the SWC and the sensor readings.
According to the calibration results, the 40 cbar represents the irrigation time for the B3 irrigation treatment, i.e., 80% of the FWC, while the 60–80 cbar represents the irrigation time for the B2 irrigation treatment, i.e., 60% of the FWC. The SWC was measured after an irrigation event or after considerable rainfall (>5 mm). The irrigation rate (35 mm) was the same during the growing period, i.e., the study period, and was determined according to the following equation [25]:
IR = 100 × vt × h × (FWC − SWC)
where IR stands for the irrigation rate, vt stands for the soil bulk density (g cm−3), h stands for the irrigation depth (m), FWC stands for the field water capacity (%) and SWC stands for the soil water content (%). The irrigation rate was adjusted to the management allowable depletion (MAD) for field crops, i.e., 70% of the FWC. The irrigation depth was determined for shallow rooting crops (30 cm), that is, for shallow rooting crops grown on clayey soil [26]. The monthly water balance (ΔW) was calculated as the difference between the rainfall amount (mm) and the ETa rate (mm).
The soybean grain yield was measured for each plot after the harvest, converted to 13% grain moisture and expressed in kg ha−1. The soybean grain protein and oil contents were determined from grain samples collected after the harvest each year on the grain analyzer InfratecTM 1241 (Foss, Hillerød, Denmark) based on near-infrared transmittance technology and expressed as % of grain dry matter (DM). The crude protein and crude oil yields in kg ha−1 were calculated by multiplying the grain yield converted to 13% moisture by the grain protein and oil contents, respectively.
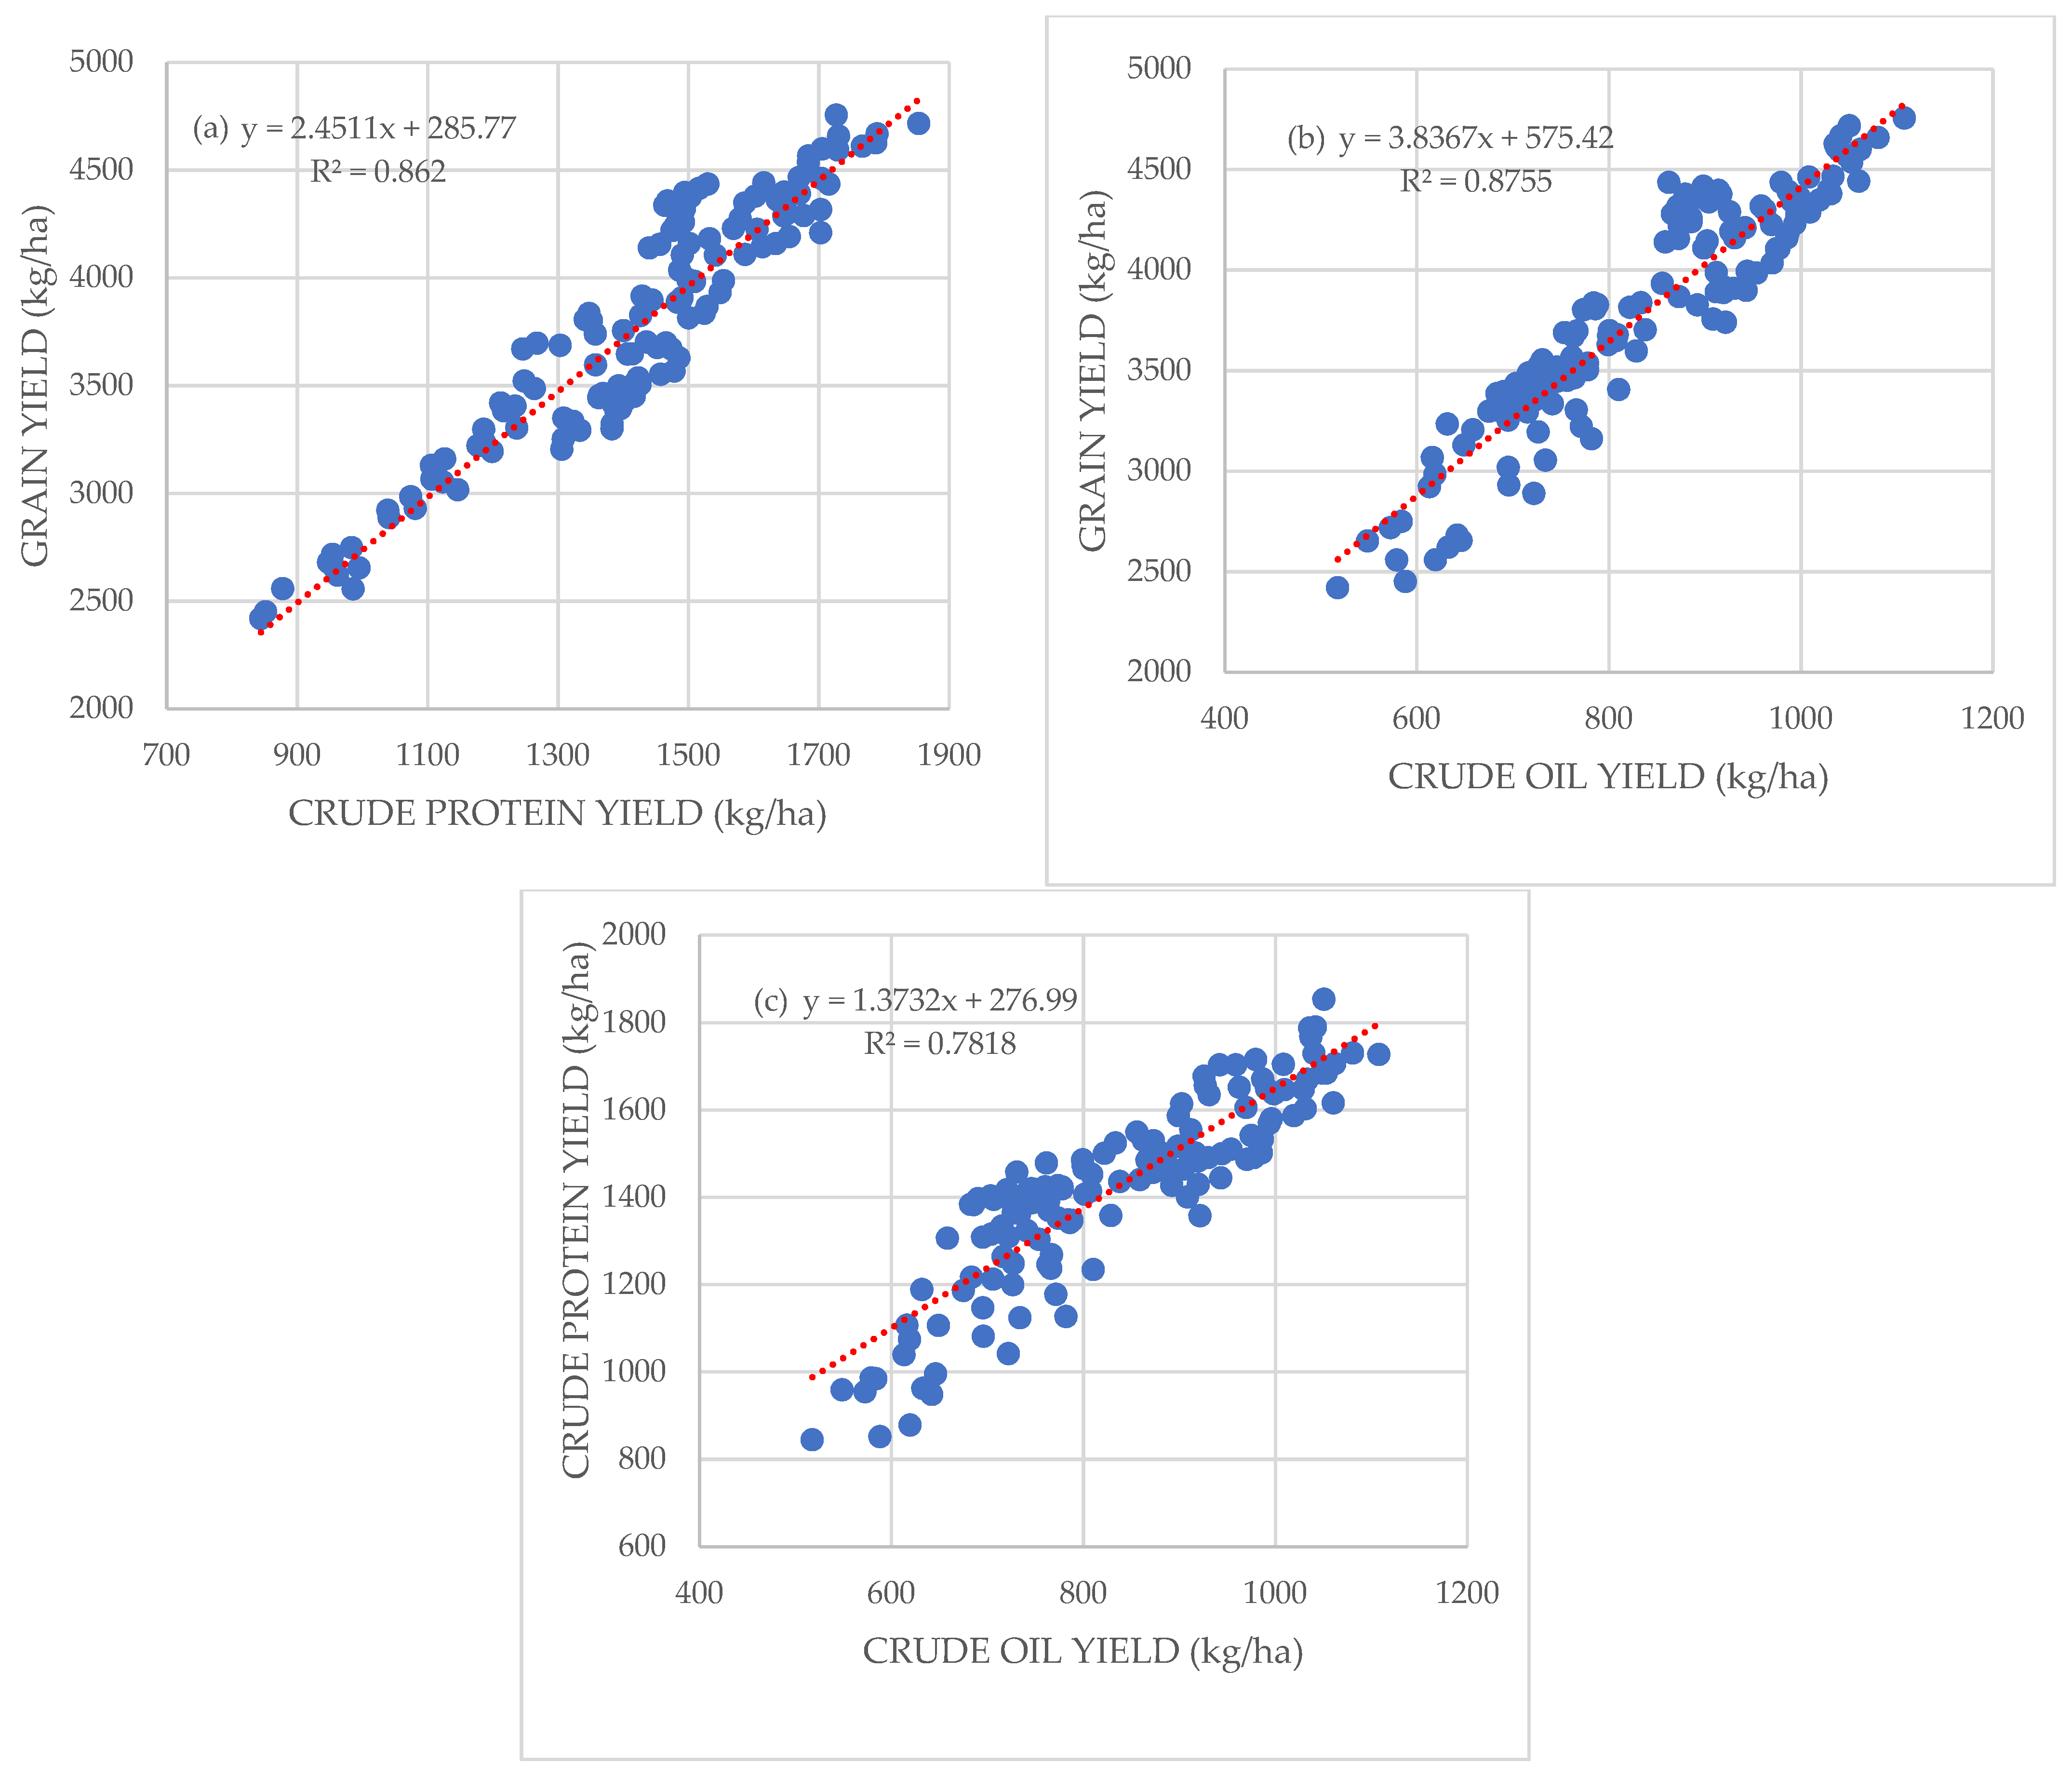
An analysis of variance (ANOVA) was conducted using the general linear model (GLM) procedure in the SPSS software (SPSS Inc., Chicago, IL, USA) for determining the main effects of year, irrigation treatment and soybean genotypes on the grain yield, protein and oil contents and crude protein and oil yields. The mean values were compared using the least significant difference (LSD) test at p < 0.05 and p < 0.01 probability levels. All parameter data were subjected to correlation analysis (SPSS Inc., Chicago, IL, USA). Based on Pearson’s correlation coefficients (r), a linear regression (SPSS Inc., Chicago, IL, USA) was performed for the crude protein yield as the dependent variable and the grain yield as the independent variable, as well as for the crude oil, grain, and crude protein yields as the independent variables.

3. Results

3.1. Meteorological Conditions and Crop Water Requirements

The meteorological conditions during the study period varied considerably, primarily in the amount of rainfall (Figure 1). The study area was characterized by a trend of decreasing precipitation (mm), increasing annual air temperatures (°C) and potential evapotranspiration (mm). The irrigation rate was 35 mm, regardless of the growing season. The net irrigation rate during the extremely wet A1 (Figure 1) was 35 mm (B2) and 70 mm (B3, Figure 3). The net irrigation rate during the extremely dry A2 was 105 mm in B2 and 175 mm in B3. The net irrigation rate during the dry A3 was 140 mm in B2 and 245 mm in B3. The net irrigation rate during the wet A4 was 140 mm in B2 and 175 mm in B3 (Figure 3).

3.2. Grain Yield

All of the interactions (AB, AC, BC and ABC) were highly significant (p < 0.01) sources of variation for soybean grain yield (Table 2). The irrigation effects varied significantly across the growing seasons (AB). In the A1 growing season, all three treatments resulted in similar grain yields. In the A2 growing season, A2B2 resulted in a 4.5% mean grain yield increase, but A2B3 resulted in a 2.1% decrease compared to A2B1. In the A3 and A4 growing seasons, the irrigation effect was higher than in the other two growing seasons. In A3B2, a 27.9% mean grain yield increase compared to A3B1 was determined, while the increase in A3B3 was 44.4% compared to B1. In A4B2 and A4B3, the mean grain yields increased by 35% and 41.2%, respectively, compared to A4B1.
The soybean genotype (C) was a significant source of variation for the grain yield. C2, C3 and C4 all had maximal grain yields in the A2 growing season and minimal grain yields in the A1 growing season. In contrast, C1 had a maximal grain yield in A4 and a minimal grain yield in the A2 growing season. The irrigation effect also varied among the genotypes (BC). The biggest mean grain yield increase due to irrigation was observed in C1. B2C1 resulted in a 25.15% mean grain yield increase and C1B3 resulted in a 35.59% increase compared to B1C1. C2 had a 21.27% mean grain yield increase in B2 and an 18.87% increase in B3 compared to B1. However, C3 and C4 had considerably smaller mean grain yield increases in irrigation than C1 and C2.

3.3. Grain Protein Content and Crude Protein Yield

All of the interactions (AB, AC, BC and ABC) were highly significant (p < 0.01) sources of variation for soybean grain protein content (Table 3) and crude protein yield (Table 4). The irrigation had a positive effect on the grain protein content and crude protein yield, but it varied across the growing seasons and genotypes. In the A1 growing season, A1B2 resulted in a 1.8% protein content increase, while A1B3 resulted in a 0.97% increase compared to A1B1 (Table 3). On the other hand, there were no significant differences in the crude protein yields between the different irrigation treatments (B) in A1 (Table 4). In the A2 growing season, A2B2 resulted in a 5% grain protein content increase, while A2B3 resulted in a 7% increase compared to A2B1. The crude protein content was 9.3% higher in A2B2 and 5.3% higher in A2B3 compared to A2B1 (Table 4). In the A3 growing season, the irrigation had a negative effect. A3B3 resulted in an almost 2% grain protein content decrease compared to A3B1, while A3B3 resulted in a 3.7% decrease (Table 3). Nevertheless, the crude protein yield increased by 25.22% in A3B2 and by 38.98% in A3B3 compared to A3B1 (Table 4). The grain protein contents in A4B1 and A4B2 were almost the same, but A4B3 had a 1.4% increase compared to A4B1 (Table 3); however, the crude protein yield was 34.97% higher in A4B2 and 43.17% higher in A4B3 compared to A4B1 (Table 4). B3 was significantly higher compared to B2 for crude protein content in the A2, A3 and A4 growing seasons (Table 4).
The variability between the genotypes was smaller for the mean protein content than for the mean grain yield. The environmental conditions in the A1 growing season resulted in the highest grain protein content for all of the genotypes (C1–C4), followed by A2, A4 and, finally, A3 (Table 3). The irrigation effect also varied among the genotypes. The most noticeable irrigation effect on the grain protein content was determined for C1, but the irrigation effect was almost non-existent for C3 and C4 (Table 3). On the other hand, the crude protein yield significantly varied depending on the irrigation treatment (B) for all of the genotypes (Table 4). Genotype C1 had the highest increase, with a 27.83% higher crude protein yield in B2 and a 39.68% higher crude protein yield in B3 compared to B1. C2 had a 23.21% higher crude protein yield in B2 and a 20.42% higher crude protein yield in B3 compared to B1. The crude protein yield was 7.35% higher in B2C3 and 10.09% higher in B3C3 compared to B1C3. Similarly, the crude protein yield was 8.44% higher in B2C4 and 10.88% higher in B3C4 compared to B1C4. B3 was significantly higher compared to B2 for crude oil content only for the C1 genotype (Table 4).

3.4. Grain Oil Content and Crude Oil Yield

The irrigation effect on the grain oil content was significant (p < 0.01), but it was not affected by the growing season (A), genotype (C) or growing season x genotype (Table 5). On average, the irrigation negatively affected oil accumulation, but the differences between the grain oil contents in the different treatments per year (AB) were not significant (Table 5). On the other hand, the crude oil yield significantly decreased in A1B2 compared with A1B1 (4%) and in A2B3 compared with A2B1 (6.5%), but it significantly increased in A3B2 (28.2%) and A3B3 (43%) compared to A3B1 and in A4B2 (31.3%) and A3B3 (38.8%) compared to A4B1. B3 was significantly higher compared to B2 for the crude oil content in the A2, A3 and A4 growing seasons (Table 6).
The irrigation effect on the grain oil yield varied among the genotypes, but the differences were not considered significant. Nevertheless, the crude oil yield was significantly higher in B2 and B3 compared with B1 for all of the genotypes, and significant differences were found between B2 and B3 for all of the genotypes except for C4 (Table 6). The highest crude oil yield increase was determined for C1, 22.8% for C1B2 and 32% for C1B3 compared with C1B1. C2 had a 19.5% higher crude oil yield in C2B2 and a 14.6% higher crude oil yield in C2B3 compared to C2B1. The crude oil yield increase was less for C3 and C4 (Table 6).

3.5. Correlation and Regression Analyses

All correlations determined between the tested parameters were considered very weak or weak, except for the correlations between the crude protein and grain yields (r = 0.93), the crude oil and grain yields (r = 0.94) and the crude protein and crude oil yields (r = 0.88), which were very strong. The very strong and significant correlations between the mentioned parameters were the basis for linear regression analyses, the results of which are displayed in Figure 4.

4. Discussion

The current study period was characterized by a variability in meteorological conditions as a result of climate change, resulting in very demanding conditions for crop production in terms of available water for the plants. As expected and previously reported by many authors [13,14,15,16,17,21,27,28], the overall irrigation effect on soybean grain yield was positive but largely depended on the environmental conditions (Table 2). For example, the lack of a significant irrigation effect on the soybean grain yield in the extremely humid A1 growing season was expected because sufficient precipitation makes the irrigation redundant [11]. The positive effects of irrigation on the grain yield in the dry A3 growing season with significant differences between the deficit irrigation (A3B2) and the full irrigation treatments (A3B3) (Table 2) were also expected, and similar grain yield responses to irrigation treatments in dry growing conditions were earlier noted by many authors [11,15,16,19]. However, in this research, the irrigation effect on the soybean grain yield was unexpectedly absent in the extremely dry A2 growing season. This could have been caused by the extremely dry and hot weather in August, during which no irrigation was applied (Figure 1 and Figure 3). In other words, all three treatments endured the same negative weather effects in the grain-filling stage (R5–R7), in which water availability is known to significantly influence yield formation [10,29]. According to Bošnjak [11], drought during seed filling has a significantly larger negative effect on the yield due to pod shedding and less dry matter accumulation than if water shortage had occurred earlier in the growing season. Similarly, the unexpectedly high positive effect of irrigation in the humid A4 growing season could be due to a specific rainfall distribution. The plants in the rain-fed treatment (A4B1) received excess rainfall in the early soybean development period (April and May), followed by a water shortage in the reproductive periods (R3–R8, pod and grain formation and grain filling) occurring during June, July and August (Figure 3). Excessive precipitation in early soybean development can increase the plant’s vegetative mass and reduce the final grain yield because of lodging and shadowing [11]. Water shortage in the reproductive periods is known to have a negative effect on the grain yield [11,30]. In comparison, plants in the deficit irrigation (A4B2) and full irrigation treatments (A4B3) had more available water, as irrigation was scheduled during the reproductive periods.
Similarly to the results for grain yield, the effect of irrigation was on average positive for the grain protein content and, consequently, for the crude protein yield, with significant influence from the environmental conditions in each growing season (Table 3 and Table 4). Furthermore, the grain yield was a more important factor for estimating the crude protein yield than the grain protein content (Figure 4a). The positive effect of irrigation on the grain protein accumulation determined in the present study (Table 3) was previously reported by many authors [11,14,19,20,21,31]. However, in this research, the protein content and crude protein yield increases were not always in a linear relationship with the amount of available water. For example, in the extremely wet A1 growing season, the positive effect of deficit irrigation (A1B2) on the grain protein content was bigger compared to the full irrigation effect (A1B3; Table 3), but both irrigation treatments resulted in statistically equal crude protein yields (Table 4). Such results are in accordance with the reports from Kresović et al. [14], Foroud et al. [32] and Bouniols et al. [33], who explained that maintaining a high level of available soil water during soybean growing periods could hinder protein accumulation. In the extremely dry A2, the protein content increased as the available water increased (Figure 3, Table 3), confirming the higher positive impact of irrigation on protein accumulation in dry conditions compared to well-watered conditions [19]. However, due to the unexpectedly absent irrigation effects on the grain yield in the extremely dry A2 growing season, the crude protein yield was lower in A2B3 than in A2B2 (Table 4). In the dry A3 growing season (Figure 1 and Figure 2), the irrigation had an unexpectedly negative effect on the grain protein content (Table 3), but the crude protein yields increased with the increase in water availability (Table 4). According to Candoğan and Yazgan [13] and Morsy et al. [22], protein content can decrease with irrigation, indicating that water use efficiency for protein accumulation is better in conditions with less available water.
Unlike grain yield and grain protein content, the grain oil content was on average negatively affected by irrigation, but the differences between the treatments per growing season (AB) were not significant (Table 5). Lower oil contents as a result of irrigation were previously reported by Bošnjak [11] and Aydinsakir et al. [20,21], while no irrigation effect was reported by Kresović et al. [14]. On the other hand, Candoğan and Yazgan [13] concluded that soybean grain oil content increased with increasing the irrigation treatments in sub-humid climates and was highest when the water requirements were fully met by irrigation. The lower mean oil contents in the irrigation treatments in the present study could have been a result of the protein content increase in the deficit irrigation (B2) and full irrigation (B3) treatments and a commonly known negative relationship between protein and oil contents [34], where every 2% of protein content increase usually decreases the oil content by 1% [35]. Although the oil content was negatively affected by irrigation, as a result of the positive effect of irrigation on the grain yield, the crude oil yield increased in all of the growing seasons except for the extremely wet A1 growing season (Table 6). This was expected, as the grain and crude protein yields were the more important factors for estimating the crude oil yields according to the correlation and regression analyses (Figure 4b,c).
The irrigation effects on the soybean grain yield, grain protein and oil content and crude protein and oil yields varied not only depending on the environmental conditions but on the genotype as well (Table 2, Table 3, Table 4, Table 5 and Table 6). This was expected because the soybean MG choice affects the irrigation water use efficiency, and the profit-maximizing MG selection varies for irrigated compared to non-irrigated conditions [36]. The biggest mean grain yield increase due to irrigation was observed in the short season C1 (MG 00), indicating that it had a better irrigation response than C2 (MG 0), C3 and C4 (MG I) (Table 2). While researching the effect of irrigation on different soybean MGs, Wegerer et al. [36] noted that earlier-maturing (short-season) varieties had a greater irrigation water use efficiency (IWUE) than later-maturing varieties due to shorter seed-filling periods. As a result of the better irrigation effect in short-season genotypes with lower genetic yield potential, the differences between the genotypes in this study decreased with the increase in water availability (Table 2). Furthermore, the highest overall grain yield was achieved by C2 in the deficit irrigation treatment (B2C2); thus, C2 production could be the most profitable in the tested growing area if irrigation is available, not only because it produces more grain yield with less available water but also because it has a shorter growing season than the other two highest-yielding genotypes (C3 and C4), which reduces the input costs. Although the highest individual protein content was achieved by the C1 genotype in the full irrigation treatment (C1B3, 38.23%), the highest overall crude protein content was achieved by the C2 genotype in the deficit irrigation treatment (C2B2; Table 4) because of the highest grain yield productivity (Table 2). The same genotype also had the highest crude oil yield, indicating that it could be very productive in environments similar to the tested one.
The predominant effects of environmental conditions on economically important parameters complicate decision-making, as weather is becoming less and less predictable due to climate change. Consequently, more effort should be invested in researching and carefully choosing the optimal agricultural measures and genotypes for each specific environment.

5. Conclusions

The results of the study indicate that deficit irrigation (a SWC maintained at 60% of the FWC) could be the best option for optimizing soybean production, i.e., achieving high grain yields and, consequently, high crude protein and oil yields, because the differences between the full (a SWC maintained at 80–100% of the FWC) and deficit irrigation treatments were only 2.9% for grain yield, 2.8% for crude protein yield and 1.7% for crude oil yield. In the tested environmental conditions, the combination of the C2 genotype (MG 0) with deficit irrigation resulted in the highest overall grain, crude protein and oil yields. Therefore, C2 production could be the most profitable in the tested growing area if irrigation is available, not only because it produces more grain yield with less available water but also because it has a shorter growing season than the other two highest-yielding genotypes (C3 and C4). However, the irrigation effect on the grain yield and grain quality parameters significantly depended on the specific environmental conditions of each growing season, which indicates that long-term studies must be conducted to determine the most efficient irrigation practice.

Author Contributions

Conceptualization, M.M.K., M.J. and M.M.; data curation, M.M.K. and I.B.; formal analysis, M.M.K., M.J. and M.M.; investigation, M.M.K. and M.J.; methodology, M.J. and M.M.; supervision, A.S.; validation, A.S., H.P. and A.A.; writing—original draft, M.M.K. and M.M.; writing—review and editing, M.J., A.S., H.P., I.B. and A.A. All authors have read and agreed to the published version of the manuscript.

Funding

This research received no external funding.

Institutional Review Board Statement

Not applicable.

Informed Consent Statement

Not applicable.

Data Availability Statement

Not applicable.

Conflicts of Interest

The authors declare no conflict of interest.

References

  1. Cober, E.R.; Cianzio, S.R.; Pantalone, V.R.; Rajcan, I.S. Oil Crops. In Handbook of Plant Breeding; Vollmann, J., Rajcan, I., Eds.; Springer: New York, NY, USA, 2009; Volume 4, pp. 57–90. [Google Scholar]
  2. Food and Agricultural Organization of United Nations (FAO). Crops and Livestock Products. 2022. Available online: https://www.fao.org/faostat/en/#data/QCL (accessed on 18 June 2022).
  3. Kim, S.W.; Less, J.F.; Wang, L.; Yan, T.; Kiron, V.; Kaushik, S.J.; Lei, X.G. Meeting global feed protein demand: Challenge, opportunity, and strategy. Annu. Rev. Anim. Biosci. 2019, 7, 221–243. [Google Scholar] [CrossRef] [PubMed]
  4. Rossi, R.; Irrigation in EU Agriculture. European Parliamentary Research Service. 2019. Available online: https://www.europarl.europa.eu/regdata/etudes/BRIE/2019/644216/EPRS_BRI(2019)644216_EN.pdf (accessed on 9 June 2022).
  5. Saleem, A.; Aper, J.; Muylle, H.; Borra-Serrano, I.; Quataert, P.; Lootens, P.; De Swaef, T.; Roldán-Ruiz, I. Response of a diverse European soybean collection to “short duration” and “long duration” drought stress. Front. Plant Sci. 2022, 13, 818766. [Google Scholar] [CrossRef] [PubMed]
  6. Rosa, L.; Chiarelly, D.D.; Rulli, M.C.; Angelo, J.; Odorico, P. Global agricultural economic water scarcity. Sci. Adv. 2020, 6, eaaz6031. [Google Scholar] [CrossRef] [PubMed]
  7. IPCC. Climate Change 2014: Synthesis Report. Contribution of Working Groups I, II and III to the Fifth Assessment Report of the Intergovernmental Panel on Climate Change; Pachauri, R.K., Meyer, L.A., Eds.; IPCC: Geneva, Switzerland, 2014; p. 151. Available online: https://www.ipcc.ch/report/ar5/syr/ (accessed on 4 July 2022).
  8. Maleki, A.; Naderi, A.; Naseri, R.; Fathi, A.; Bahamin, S.; Maleki, R. Physiological Performance of Soybean Cultivars under Drought Stress. Bull. Environ. Pharmacol. Life Sci. 2017, 2, 38–44. [Google Scholar]
  9. Fehr, W.R.; Caviness, C.E. Stages of Soybean Development; Special Report No. 87; Iowa State University: Ames, IA, USA, 1977; Available online: https://lib.dr.iastate.edu/specialreports/87 (accessed on 27 September 2022).
  10. Board, J.E.; Kahlon, C.S. Soybean yield formation: What controls it and how it can be improved. In Soybean Physiology and Biochemistry; El-Shemy, H.A., Ed.; Intech: London, UK, 2011; pp. 1–36. [Google Scholar]
  11. Bošnjak, Đ. Soybean irrigation in single crop, second crop and stubble crop planting. In Soybean; Miladinović, J., Hrustić, M., Vidić, M., Eds.; Institute of Field and Vegetable Crops Novi Sad: Sojaprotein Bečej, Serbia, 2011; pp. 315–342. [Google Scholar]
  12. He, J.; Jin, Y.; Du, Y.-L.; Wang, T.; Turner, N.C.; Yang, R.P.; Yi, J.; Xi, Y.; Zhanga, C.; Cui, T.; et al. Conserved water use improves the yield performance of soybean (Glycine max (L.) Merr.) under drought. Agric. Water Manag. 2016, 179, 236–245. [Google Scholar] [CrossRef]
  13. Candoğan, B.N.; Yazgan, S. Yield and quality response of soybean to full and deficit irrigation at different growth stages under sub-humid climatic conditions. Tarim Bilimleri Dergisi J. Agric. Sci. 2016, 22, 129–144. [Google Scholar] [CrossRef]
  14. Kresović, B.; Gajić, B.A.; Tapanarova, A.; Dugalić, G. Yield and chemical composition of soybean seed under different irrigation regimes in the Vojvodina region. Plant Soil Environ. 2017, 63, 34–39. [Google Scholar]
  15. Galić Subašić, D.; Jurišić, M.; Jug, I.; Josipović, M.; Kiš, D.; Rapčan, I. The effect of irrigation and nitrogen fertilization on the soybean seed yield, with a correlation to the protein and oil concentration. Poljoprivreda 2020, 26, 50–57. [Google Scholar] [CrossRef]
  16. He, J.; Jin, Y.; Turner, N.C.; Li, F.M. Irrigation during flowering improves subsoil water uptake and grain yield in rainfed soybean. Agronomy 2020, 10, 120. [Google Scholar] [CrossRef] [Green Version]
  17. Pinnamaneni, S.R.; Anapalli, S.S.; Fisher, D.K.; Reddy, K.N. Water use efficiencies of different maturity group soybean cultivars in the humid Mississippi Delta. Water 2021, 13, 1496. [Google Scholar] [CrossRef]
  18. Marković, M.; Josipović, M.; Ravlić, M.; Josipović, A.; Zebec, V. Deficit irrigation of soybean (Glycine max (L.) Merr.) Based on monitoring of soil moisture, in sub-humid area of eastern Croatia. Rom. Agric. Res. 2016, 33, 1–8. [Google Scholar]
  19. Anda, A.; Soós, G.; Menyhárt, L.; Kucserka, T.; Simon, B. Yield features of two soybean varieties under different water supplies and field conditions. Field Crops Res. 2020, 245, 107673. [Google Scholar] [CrossRef]
  20. Aydinsakir, K. Yield and quality characteristics of drip-ırrigated soybean under different irrigation levels. Agron. J. 2018, 110, 1473–1481. [Google Scholar] [CrossRef]
  21. Aydinsakir, K.; Dinc, N.; Buyuktas, D.; Kocaturk, M.; Ozkan, C.F.; Karaca, C. Water productivity of soybeans under regulated surface and subsurface drip irrigation conditions. Irrig. Sci. 2021, 39, 773–787. [Google Scholar] [CrossRef]
  22. Morsy, A.R.; Mohamed, A.M.; Abo-Marzoka, E.A.; Megahed, M.A.H. Effect of water deficit on growth, yield and quality of soybean seed. J. Plant Prod. 2018, 9, 709–716. [Google Scholar] [CrossRef]
  23. Zaninović, K.; Gajić Čapka, M.; Tadić, M.P.; Vučetić, M.; Milković, J.; Bajić, A.; Cindrić, K.; Cvitan, L.; Katušin, Z.; Kaučić, D. Climate Atlas of Croatia; Meteorological and Hydrological Service of Croatia: Zagreb, Croatia, 2008. [Google Scholar]
  24. FAO. World Reference Base for Soil Resources 2014, International Soil Classification System for Naming Soils and Creating Legends for Soil Maps. 2015. Available online: http://www.fao.org/3/i3794en/I3794en.pdf (accessed on 15 May 2020).
  25. Allen, R.G.; Pereira, L.S.; Raes, D.; Smith, M. Crop Evapotranspiration Guidelines for Computing Crop Water Requirements; FAO Irrigation and Drainage Paper 56; FAO: Rome, Italy, 1988; Available online: https://www.fao.org/3/X0490E/x0490e00.htm (accessed on 5 May 2022).
  26. Brouwer, C.; Prins, K.; Heibloem, M. Irrigation Water Management: Irrigation Scheduling. FAO Land and Water Development Division; FAO: Rome, Italy, 1989. [Google Scholar]
  27. Basal, O.; Szabó, A. Physiology, yield and quality of soybean as affected by drought stress. Asian J. Agric. Biol. 2020, 8, 247–252. [Google Scholar] [CrossRef]
  28. Pinnamaneni, S.R.; Anapalli, S.S.; Reddy, K.N.; Fisher, D.K.; Quintana-Ashwell, N.E. Assessing irrigation water use efficiency and economy of twin-row soybean in the Mississippi Delta. Agron. J. 2020, 112, 4219–4231. [Google Scholar] [CrossRef]
  29. Cui, Y.; Jiang, S.; Jin, J.; Feng, P.; Ning, S. Decision-making of irrigation scheme for soybeans in the Huaibei Plain based on grey entropy weight and grey relation-projection pursuit. Entropy 2019, 21, 877. [Google Scholar] [CrossRef] [Green Version]
  30. Board, J.E. A regression model to predict soybean cultivar yield performance at late planting dates. Agron. J. 2002, 94, 483–492. [Google Scholar] [CrossRef]
  31. Ali, O.A.M.; Abdel-Aal, M.S.M. Importance of some soil amendments on improving growth, productivity and quality of soybean grown under different irrigation intervals. Egypt. J. Agron. 2021, 43, 13–27. [Google Scholar] [CrossRef]
  32. Foroud, N.; Muèndel, H.H.; Saindon, G.; Entz, T. Effect of level and timing of moisture stress on soybean yield, protein, and oil responses. Field Crops Res. 1993, 31, 195–209. [Google Scholar] [CrossRef]
  33. Bouniols, A.; Texier, V.; Mondies, M.; Piva, G. Soybean seed quality among genotypes and crop management: Field experiment and simulation. Eurosoya 1997, 11, 87–99. [Google Scholar]
  34. Pannecoucque, J.; Goormachtigh, S.; Heungens, K.; Vleugels, T.; Ceusters, J.; Van Waes, C.; Van Waes, J. Screening for soybean varieties suited to Belgian growing conditions based on maturity, yield components and resistance to Sclerotinia sclerotiorum and Rhizoctonia solani anastomosis group 2–2IIIB. J. Agric. Sci. 2018, 156, 342–349. [Google Scholar] [CrossRef]
  35. Clemente, T.E.; Cahoon, E.B. Soybean oil: Genetic approaches for modification of functionality and total content. Plant Physiol. 2009, 151, 1030–1040. [Google Scholar] [CrossRef]
  36. Wegerer, R.; Popp, M.; Hu, X.; Purcell, L. Soybean maturity group selection: Irrigation and nitrogen fixation effects on returns. Field Crops Res. 2015, 180, 1–9. [Google Scholar] [CrossRef]
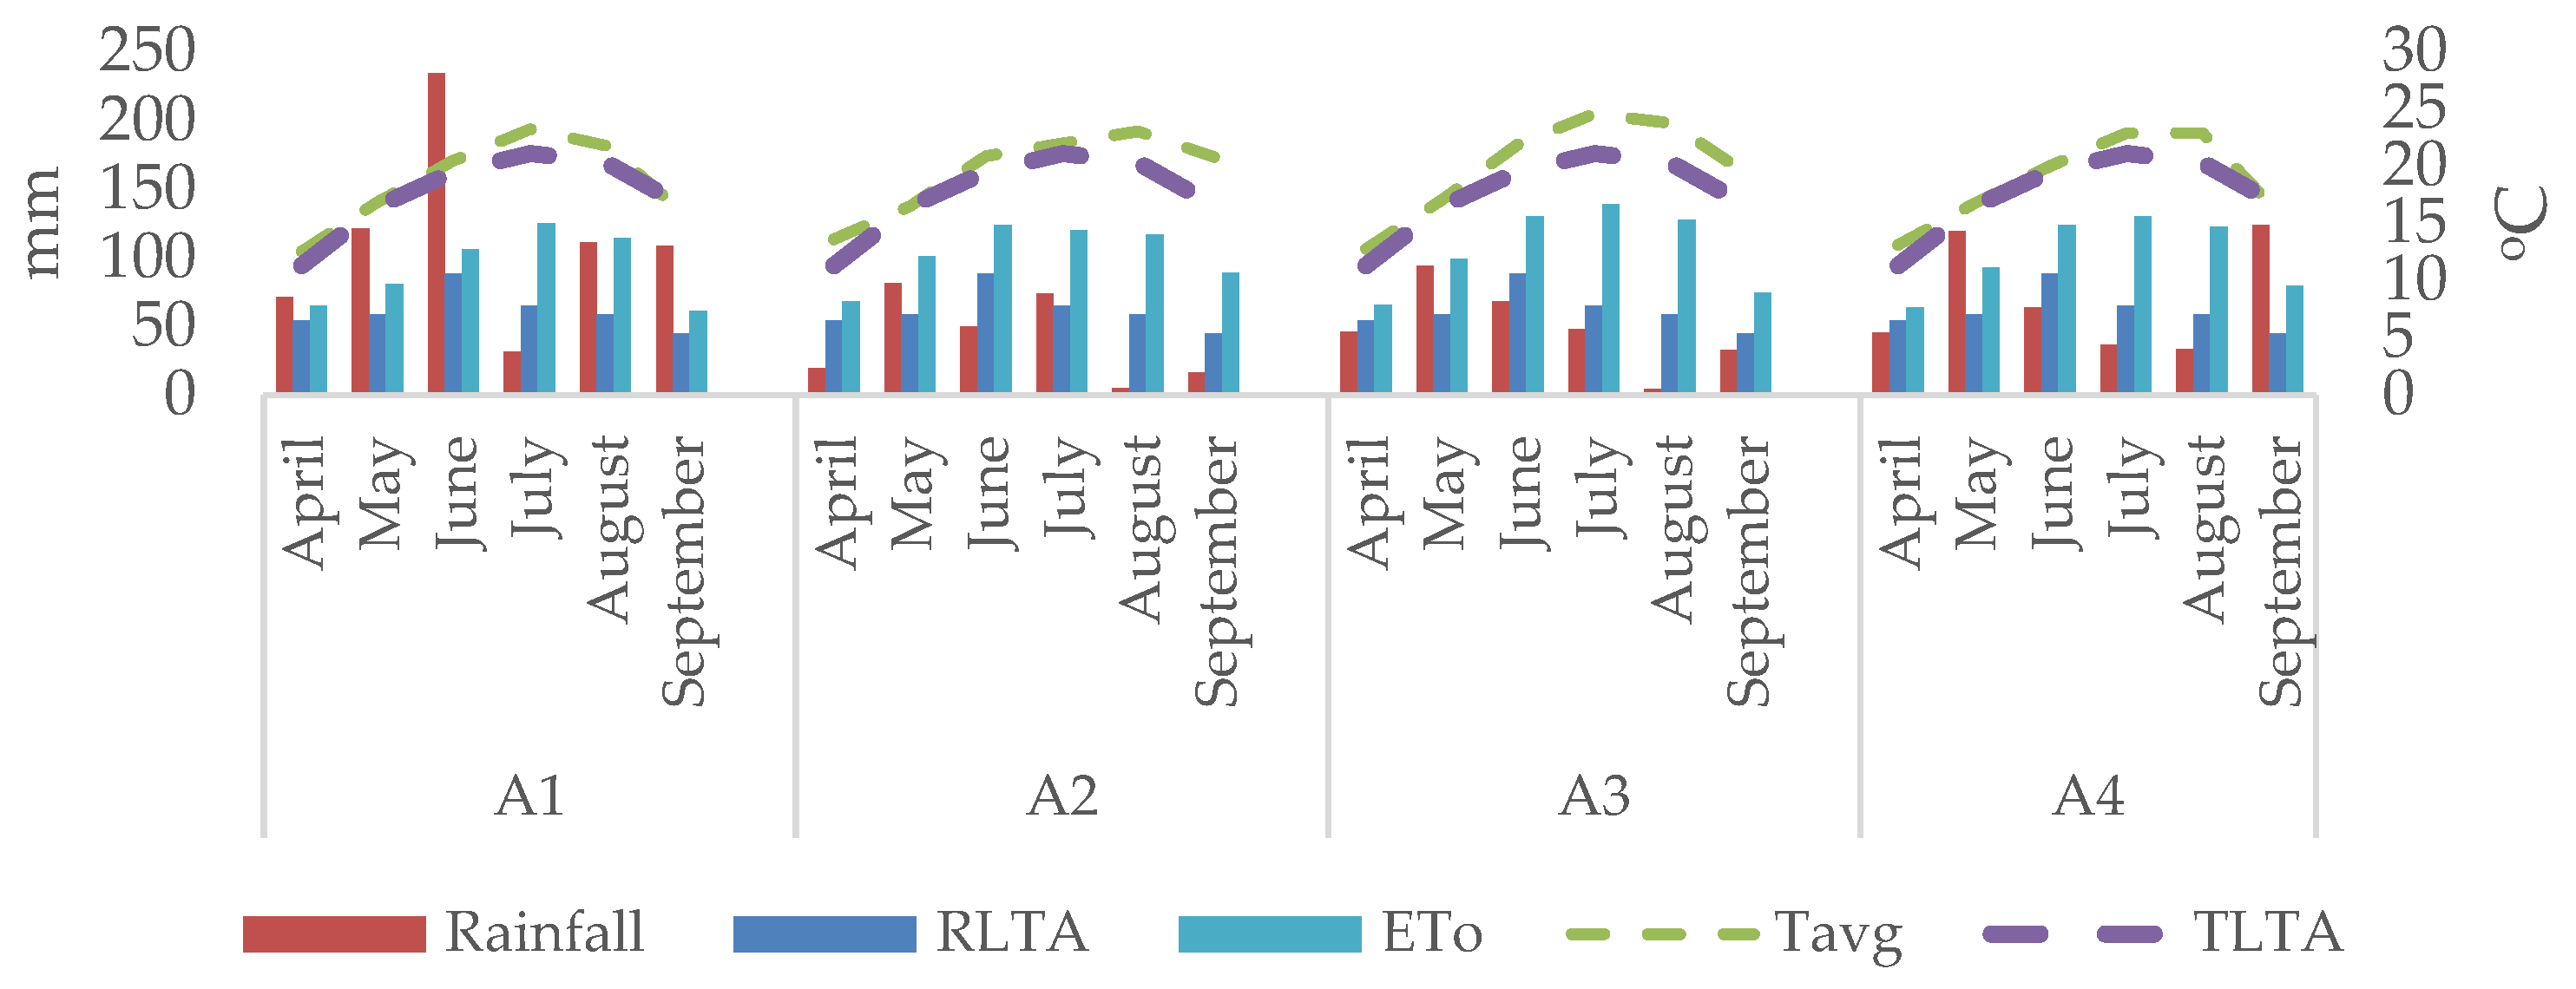
Figure 1. Amount of rainfall (mm), ETo (mm/month) and air temperatures (°C, Tavg) during the four growing seasons (A1–A4), rainfall long-term averages (RLTAs) and temperature long-term averages (TLTAs).
Applsci 13 00111 g001
Figure 2. Calibration curve for the soil at the study site.
Applsci 13 00111 g002
Figure 3. Water balance and irrigation rates (mm/month) in the B2 and B3 irrigation treatments during the four growing seasons (A1–A4).
Applsci 13 00111 g003
Figure 4. Linear regressions between (a) the crude protein and grain yields, (b) the crude oil and grain yields and (c) the crude oil and crude protein yields.
Applsci 13 00111 g004
Table 1. Physical and chemical properties of the soil at the study site (P = porosity; RC = retention capacity; AC = air capacity; PWP = permanent wilting point (vol.%); PD = particle density; SOM = soil organic matter).
Physical Properties
DepthSiltClaySandPRCACPWPPD
(cm)%%%%%%%g cm3
0–3064.732.52.844.839.65.223.72.75
Chemical Properties
DepthpHAl-P2O5Al-K2OSOMCaCO3
(cm)H2OKClmg/100 g%%
0–305.596.6026.4029.702.551.25
Table 2. Impacts of the environmental conditions in the four growing seasons (A1–A4), three treatments (B1, rain-fed conditions; B2, 60% of the field water capacity, or FWC; B3, 80–100% of the FWC), four genotypes (C1–C4) and their interactions (AB, AC, BC and ABC) on soybean grain yield (kg ha−1).
Growing Season (A)Grain Yield (kg ha−1)
Irrigation (B)Mean ASoybean Genotype (C)
B1B2B3C1C2C3C4
A134603420344834433518341034753367
A240344217395340683431435742424243
A329973834432837203480381837883791
A430004050423537623587358139423936
Mean B337338803991Mean C3504379138623834
B12914333836473592
B23647406838923913
B33951396840463998
LSDABCABACBCABC
5%72505775132111155
1%956675111155190323
Table 3. Impacts of the environmental conditions in the four growing seasons (A1–A4), three treatments (B1, rain-fed conditions; B2, 60% of the field water capacity, or FWC; B3, 80–100% of the FWC), four genotypes (C1–C4) and their interactions (AB, AC, BC and ABC) on soybean grain protein contents (% dry matter, or DM). n.s. = not significant.
Growing Season (A)Grain Protein Content (% DM)
Irrigation (B)Mean ASoybean Genotype (C)
B1B2B3C1C2C3C4
A140.0940.8240.4840.4740.5840.6240.3340.33
A236.7038.5839.2838.1937.4738.3938.6838.21
A335.7635.0534.4535.0935.3434.9734.9335.11
A437.0036.9737.5137.1637.0337.7336.9136.93
Mean B37.3837.8537.93Mean C37.6137.9337.7137.66
B136.7337.5237.6137.68
B237.8538.0937.9637.53
B338.2338.1737.5737.75
LSDABCABACBCABC
5%0.330.370.210.810.480.401.16
1%0.44n.s.n.s.1.100.680.562.13
Table 4. Impacts of the environmental conditions in the four growing seasons (A1–A4), three treatments (B1, rain-fed conditions; B2, 60% of the field water capacity, or FWC; B3, 80–100% of the FWC), four genotypes (C1–C4) and their interactions (AB, AC, BC and ABC) on soybean crude protein yield (kg ha−1).
Growing Season (A)Crude Protein Yield (kg ha−1)
Irrigation (B)Mean ASoybean Genotype (C)
B1B2B3C1C2C3C4
A11386.81396.21395.91392.91427.61384.91401.51357.9
A21489.41627.71553.11556.81298.21671.21639.11618.5
A31072.51343.01490.61302.11228.71332.31319.51327.7
A41109.11497.21587.91398.11330.71351.91455.61454.0
Mean B1264.51466.01506.9Mean C1321.31435.11453.91439.5
B11078.61252.91374.01352.4
B21378.81543.71475.01466.6
B31506.61508.71512.71499.6
LSDABCABACBCABC
5%24.9721.6324.9743.2649.9543.2686.51
1%33.0628.6333.0657.2666.1157.26114.51
Table 5. Impacts of the environmental conditions in the four growing seasons (A1–A4), three treatments (B1, rain-fed conditions; B2, 60% of the field water capacity, or FWC; B3, 80–100% of the FWC), four genotypes (C1–C4) and their interactions (AB, AC, BC and ABC) on soybean grain oil contents (% dry matter, or DM). n.s. = not significant.
Growing Season (A)Grain Oil Content (% DM)
Irrigation (B)Mean ASoybean Genotype (C)
B1B2B3C1C2C3C4
A121.7021.1221.2721.3621.8821.4921.1620.93
A223.2622.4222.1022.5923.2322.6422.0822.44
A320.6620.6620.4320.5820.8320.7320.5120.28
A423.7923.8123.4123.6724.2023.6323.4723.37
Mean B22.3522.0021.80Mean C22.5322.1221.8021.75
B122.9022.5122.0521.95
B222.4022.1021.7521.77
B322.3021.7521.6221.54
LSDABCABACBCABC
5%0.200.260.12n.s.0.28n.s.n.s.
1%0.260.340.16n.s.0.40n.s.n.s.
Table 6. Impacts of the environmental conditions in the four growing seasons (A1–A4), three treatments (B1, rain-fed conditions; B2, 60% of the field water capacity, or FWC; B3, 80–100% of the FWC), four genotypes (C1–C4) and their interactions (AB, AC, BC and ABC) on crude oil yield (kg ha−1).
Growing Season (A)Crude Oil Yield (kg ha−1)
Irrigation (B)Mean ASoybean Genotype (C)
B1B2B3C1C2C3C4
A1750. 8722.3733.8735.6769.7732.8735.4704.7
A2934. 5944.9873.7917.7792.9986.9937.4953.4
A3618.2792.4884.1764.9723.8790.1776.7768.9
A4713.6963.7990.6889.3867.1845.8925.1919.3
Mean B754.2855.8870.5Mean C788.4838.9843.6836.6
B1666.5753.2805.8791.5
B2818.3900.3849.2855.5
B3880.4863.2875.9862.7
LSDABCABACBCABC
5%14.7312.7614.7325.5229.4625.5251.03
1%19.4916.8919.4933.7838.9933.7867.55
Disclaimer/Publisher’s Note: The statements, opinions and data contained in all publications are solely those of the individual author(s) and contributor(s) and not of MDPI and/or the editor(s). MDPI and/or the editor(s) disclaim responsibility for any injury to people or property resulting from any ideas, methods, instructions or products referred to in the content.