1. Introduction
Breast cancer is a result of random mutations that allow breast cells to grow and proliferate without the tight restrictions imposed on them during the cell cycle [
1]. These mutations affect several of the cells’ homeostatic parameters, including their cellular metabolism, proliferation rate, and the defenses they establish to circumvent cell cycle arrest or controlled death [
1]. Given this, breast cancers can be categorized into four groups based on genetic information: luminal A, luminal B, HER2-positive, and triple-negative. These four types, as seen in
Table 1, are classified based on whether or not the cancer cells possess (1) the human epidermal growth factor receptor 2 (HER2) protein, a type of transmembrane receptor tyrosine kinase and (2) hormone receptors, including estrogen receptors (ER) and/or progesterone receptors (PR), within the cell membrane [
1]. Luminal A breast cancers, such as the MCF-7 cell line, are HER2-negative and hormone receptor-positive [
2]. These cancers tend to grow slowly due to low levels of Ki-67, a tumor proliferative marker that helps control the pace of the cell growth by preventing the aggregation of mitotic chromosomes [
2,
3]. Luminal B breast cancers, such as the BT-474 cell line, are hormone receptor-positive, and either HER2-negative or -positive, with high levels of Ki-67 [
2]. HER2-positive breast cancer, as the name suggests, is HER2-positive and hormone receptor-negative [
4]. SK-BR-3 falls under HER-2 classification. Triple-negative breast cancers, such as MDA-MB-231, do not express any of the three main receptors, making it more aggressive and difficult to treat than the other breast cancers [
5].
Receptor status determines the initial prognosis and the ensuing treatment of the cancer since certain subtypes do not respond to targeted hormone therapies. Many standard systemic and localized cancer treatments are unable to precisely kill microscopic disease around the tumor site and often affect healthy adjacent tissue [
6,
7]. In the case of chemotherapy and endocrine therapy, these treatments also worsen the quality of life to a greater extent and for a longer period of time [
8]. However, some modern treatments not only work to actively kill cancer cells but also mitigate the chance of recurrence after tumor resection without worsening the patient’s quality of life [
9,
10]. One such treatment is through the use of cold atmospheric plasma (CAP).
CAP is a room temperature ionized gas, generating a composite of charged particles, photons, and an electric field [
11]. CAP also gives rise to a cellular environment rich in reactive oxygen species (ROS) and reactive nitrogen species (RNS). Major CAP-generated ROS include ozone (O
3), singlet oxygen (
1O
2), superoxide anion (O
2˙−), and hydroxyl radical (˙OH). The major RNS generated include nitric oxide (˙NO) and nitric dioxide (˙NO
2) [
12]. These reactive species yield peroxynitrite (ONOO-), hydroxide (H
2O
2), and nitrite (NO
2−) when in contact with bodily fluid or a cell culture medium [
13]. Excess cellular levels of these species can lead to the activation of apoptosis due to the damage they cause to mRNA [
14], vital proteins, nucleic acids, lipids, membranes, and organelles [
15]. During apoptosis signaling, caspase precursors undergo rapid proteolytic processing and activation [
16]. Activated caspases function to hydrolyze key enzymes and degrade cellular proteins necessary for the survival and growth of the cell, resulting in cell death [
16]. Additionally, a decrease in mitotic cell division and a reduction of Ki-67 expression in tumor cells could indicate CAP-induced cell death post treatment. Ki-67 is a nuclear protein that is expressed in actively proliferating cells during all phases of the cell cycle [
17]. CAP prompts a decrease in Ki-67 as it is known to selectively induce apoptosis and cell cycle interruption [
18]. Cell cycle interruption caused by CAP oxidizes histone mRNA and activates cell cycle checkpoints that halt the cells from undergoing further development [
14]. The G1 phase in the cell cycle is the time in which cells physically grow and their organelles develop [
19]. When this growth process is interrupted by CAP, cancer cells can no longer proliferate at an uncontrollable rate.
While studies show strong temporal correlations among CAP treatment, a decrease in cell proliferation, and an increase in cell death, several different theories of the CAP’s mechanism of action exist due to the complex microprocesses involved in its ability to trigger cell cycle arrest and apoptosis. Our approach aims to bridge the gap in knowledge regarding these CAP-induced outcomes. Although the literature has implied correlations among cell signaling intermediates, cell proliferation, and cell death, the three have not been combined in a comprehensive causal model thus far. A causal model is one that examines the relationships between potential causes and potential effects.
Granger causality is a way to investigate causality between two variables in a time series, a sequence of data points that occurs in successive order over a period of time [
20]. Granger causality tests whether a variable, the potential “cause”, is helpful for forecasting, or predicting, the behavior of another variable, the potential “effect”. By using empirical data sets to find patterns of correlation, the formulated vector autoregressive (VAR) model assumes the data-generating processes in any time series are independent variables. In a VAR model, each variable is regressed on all variables, including itself, at previous time points. Regression is a statistical method that attempts to determine the strength and character of the relationship between variables, revealing the temporal dynamics of a system of related parameters across time. A VAR model itself is made up of a system of equations that represents the relationships between the variables. The data sets are analyzed to see if they are correlated, verifying the usefulness of one variable to forecast another [
20]. Therefore, according to Granger causality, if X “Granger-causes” Y, then past values of X should contain information that helps predict Y above and beyond the information contained in past values of Y alone [
21].
In this study, Granger modeling was used to compare the individual effects of intracellular ROS, caspase activity (CA), Ki-67 expression, and G1 phase activity on cell proliferation and cell death after treatment with Canady Helios Cold Plasma
TM (CHCP). CHCP was developed at the Jerome Canady Research Institute for Advanced Biological and Technological Sciences (JCRI-ABTS) (U.S. Patent No. 9,999,462 B2 June 2018 [
22]), and previous studies have demonstrated its anticancer effect on a variety of solid tumor cell lines including breast cancers [
23,
24]. The primary objective of this study is to identify causal versus correlational links of intracellular oxidative stress, CA, Ki-67 expression, and cell cycle to the death of breast cancer cells. The rationale for developing a computational causal model is that it can help answer questions on what variables need to be prioritized for future in vivo mammalian studies.
3. Results
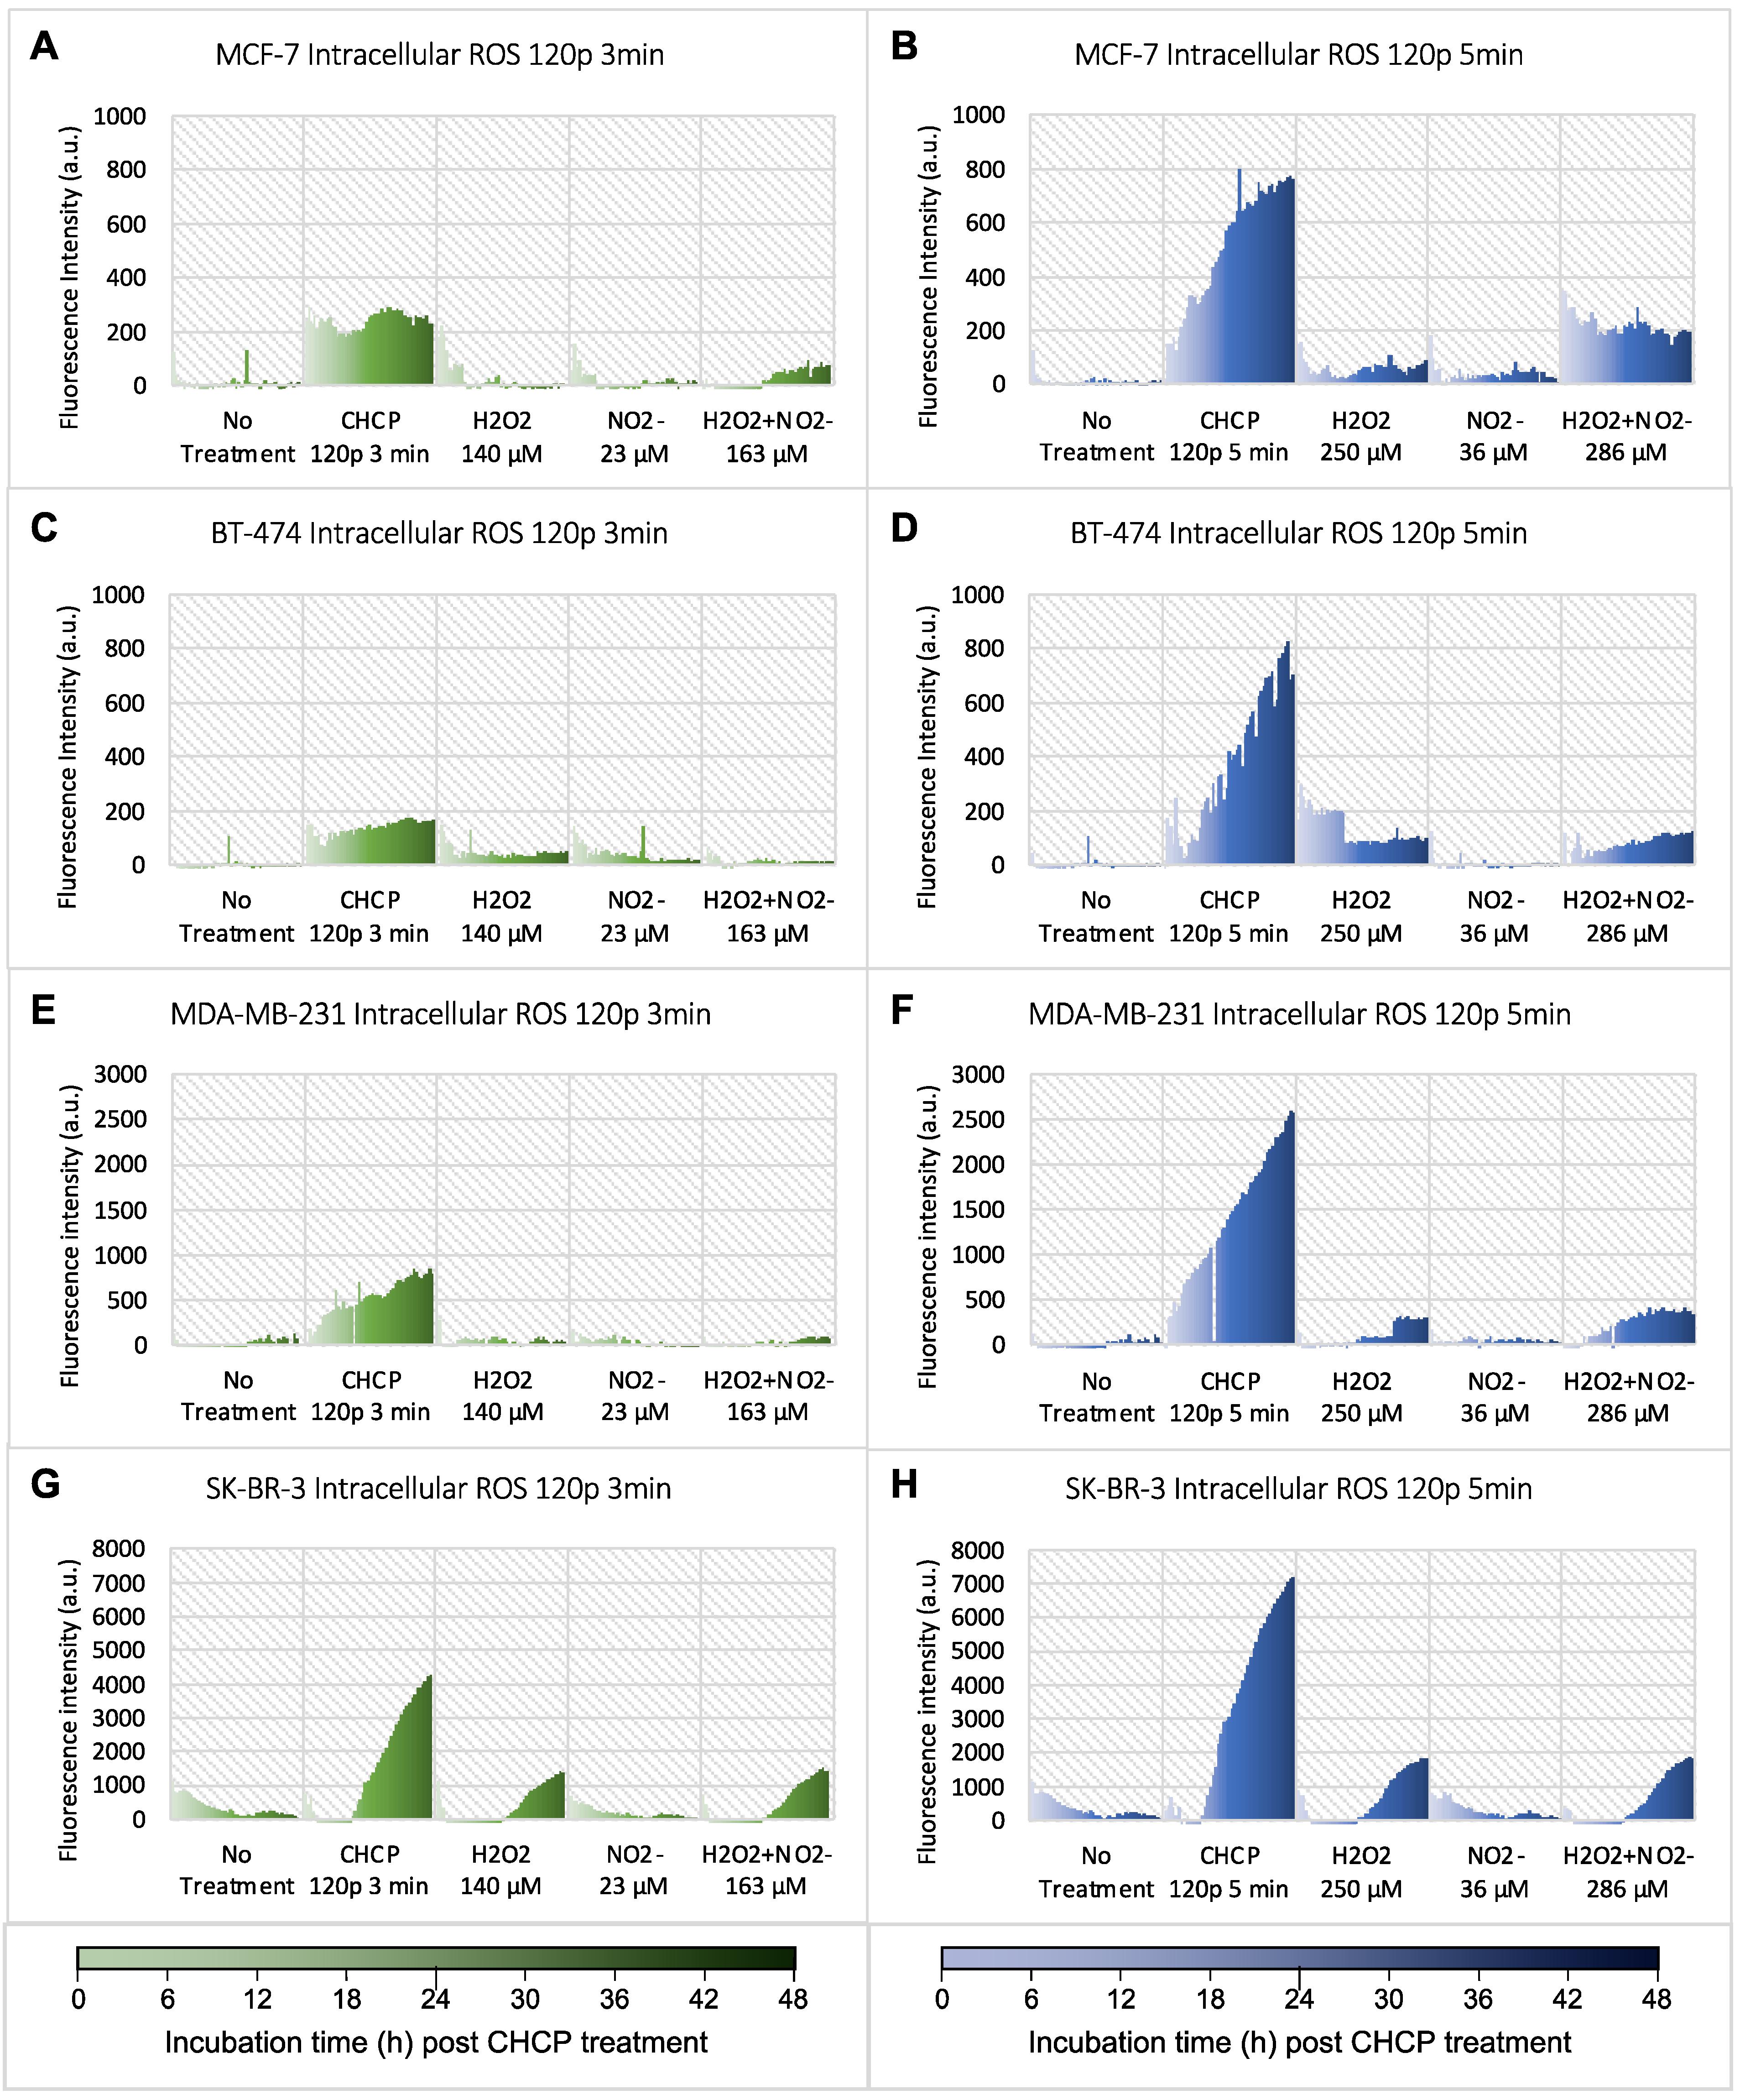
Breast cancer cell lines of four different subtypes were treated by CHCP for 3 or 5 min. Following the treatment, a set of data including intracellular ROS, CA, Ki-67
+ count, G1 activity, and confluence was obtained every hour for 48 h. Intracellular ROS as an oxidative stress maker was monitored, and the data are shown in
Figure 1. All data plotted were subtracted by breast cancer cells stained with the fluorescent probe (CM-H2DCFDA) but without CHCP treatment. CHCP-generated H
2O
2 and NO
2− concentrations were measured in PBS by colorimetric, and corresponding concentrations of H
2O
2 and NO
2− were added to the cells for intracellular ROS measurement as positive controls. Compared to no treatment, treatment with CHCP 120 p at both 3 and 5 min caused a significant increase in ROS levels in all breast cancer subtypes. Fluorescent intensity (Y-axis) was brought to the same scale for each cell line treated by CHCP for 3 and 5 min for easy comparison. Treatment with chemicals alone (H
2O
2 or NO
2− or in combination) also induced increased ROS levels in all four subtypes, especially at higher concentrations, but the increased intensity was much lower compared to CHCP-induced ROS.
The VAR() function in R was used in conjunction with the causality() function to generate several models using the inputted data. Cell proliferation data, represented by confluence data, were defined as one “effect” variable, and cell death, represented by CA data, was the secondary “effect” variable.
Table 2 and
Table 3 display the
p-values and coefficients of the cell proliferation models for the 3 and 5 min CHCP treatment times, respectively, and
Table 4 and
Table 5 display the outputs of the 3 and 5 min cell death models, respectively. Significant models yielded
p-values under 0.05, the chosen critical value, after being treated with CHCP for a set amount of time. The absolute values of the coefficients of regression were also outputted from the VAR() function. These coefficients indicate the weight of causality. Only the coefficients of significant models can be accurately compared.
For the 3 min CHCP treatment models with cell proliferation set as the effect variable, different variables displayed causality depending on the cell line studied. The significant causal variables and their associated coefficients can be seen in
Table 2. The models that had significant Granger causal relationships were denoted as * (
p < 0.05). The Ki-67 model for SK-BR-3 was formulated based on data acquired after 80 p CAP treatment as opposed to 120 p because CHCP at 120 p eliminated all SK-BR-3 cells, making it technically impossible for confocal microscopy to image any cells. This condition is present within all of SK-BR-3’s Ki-67 models. The absolute value of the coefficients of regression represents the weight of causality. CA was the only variable that lacked causality for the BT-474 cell line, whereas it was the only one which demonstrated causality for the MDA-MB-231 cell line. The intracellular ROS level did not display causality for cell proliferation in neither the MCF-7 nor the MDA-MB-231 cell lines but was significant in BT-474 and SK-BR-3. Based on the weighted coefficients, CA showed the greatest causality for the MCF-7 and MDA-MB-231 cell lines, while Ki-67 showed the greatest causality for the BT-474 and SK-BR-3 cell lines. Cell cycle activity data could not be collected for the SK-BR-3 cell line using the IncuCyte, and hence no models could be formed to test causality.
The same data analysis was conducted for cells treated with CHCP for 5 min. For the 5 min treatment, all variables showed causality (see
Table 3) when proliferation was set as the effect variable. Ki-67 showed the greatest causality for all cell lines, except MCF-7, after 5 min of CAP treatment. ROS models had the lowest absolute valued coefficients on average.
Models were also created with cell death, represented by the CA variable, as the effect. These models are displayed in
Table 4, for 3 min CHCP treatment. Cell proliferation was omitted as a causal variable because a lack of cell proliferation does not have any definite causal linkage to cell death. All inputted variables were causal for the MCF-7 and SK-BR-3, while none were causal for MDA-MB-231. Only Ki-67 and G1 activity showed causality for the BT-474 models. Ki-67 had the greatest causal relationship to CA across all cell lines.
Shown in
Table 5, the same causality testing was then done for cell death using data from cells that underwent CHCP treatment for 5 min. When comparing the 3 min and 5 min cell death models, it was seen that the G1 variable for BT-474 and the ROS and Ki-67 variables for MCF-7 did not have significant causal link after 5 min CHCP treatment. However, the same variables were considered significantly causal for the 3 min models. This was inconsistent with the cell proliferation models, where all 5 min models were statistically significant, including those that had
p-values > 0.05 in the 3 min models.
The standard errors for the ROS, CA, Ki-67, and G1 models are presented in
Table 6. The error of the models varied greatly among cell types. The standard of error for each model was computed from the causality() function in R, alongside the estimated
p-values. The SK-BR-3 ROS models had the smallest error on average, while the MCF-7 caspase models had the largest.
3.1. Model Validation
To validate the models, the vars, tseries, and forecast packages in R were utilized in order to conduct diagnostic statistical testing on time-series models that had demonstrated Granger causality (
p-value < 0.05). Autocorrelation was utilized to determine if there was a similarity present between observations as a function of the time lag between them [
21]. Autocorrection existed across all cell lines, suggesting that previous observations of the time series have an influence on the current state, whether that be of ROS, CA, and Ki-67 expression or G1 activity.
Another metric to consider is heteroscedasticity or the volatility of the changing variance in data [
27]. Heteroscedasticity is present if the dependent variable changes significantly from the beginning to the end of the time series [
21]. Heteroscedastic behavior was demonstrated across all variables for each significant model. This indicates that there were large ranges between the largest and smallest observed values of the data sets.
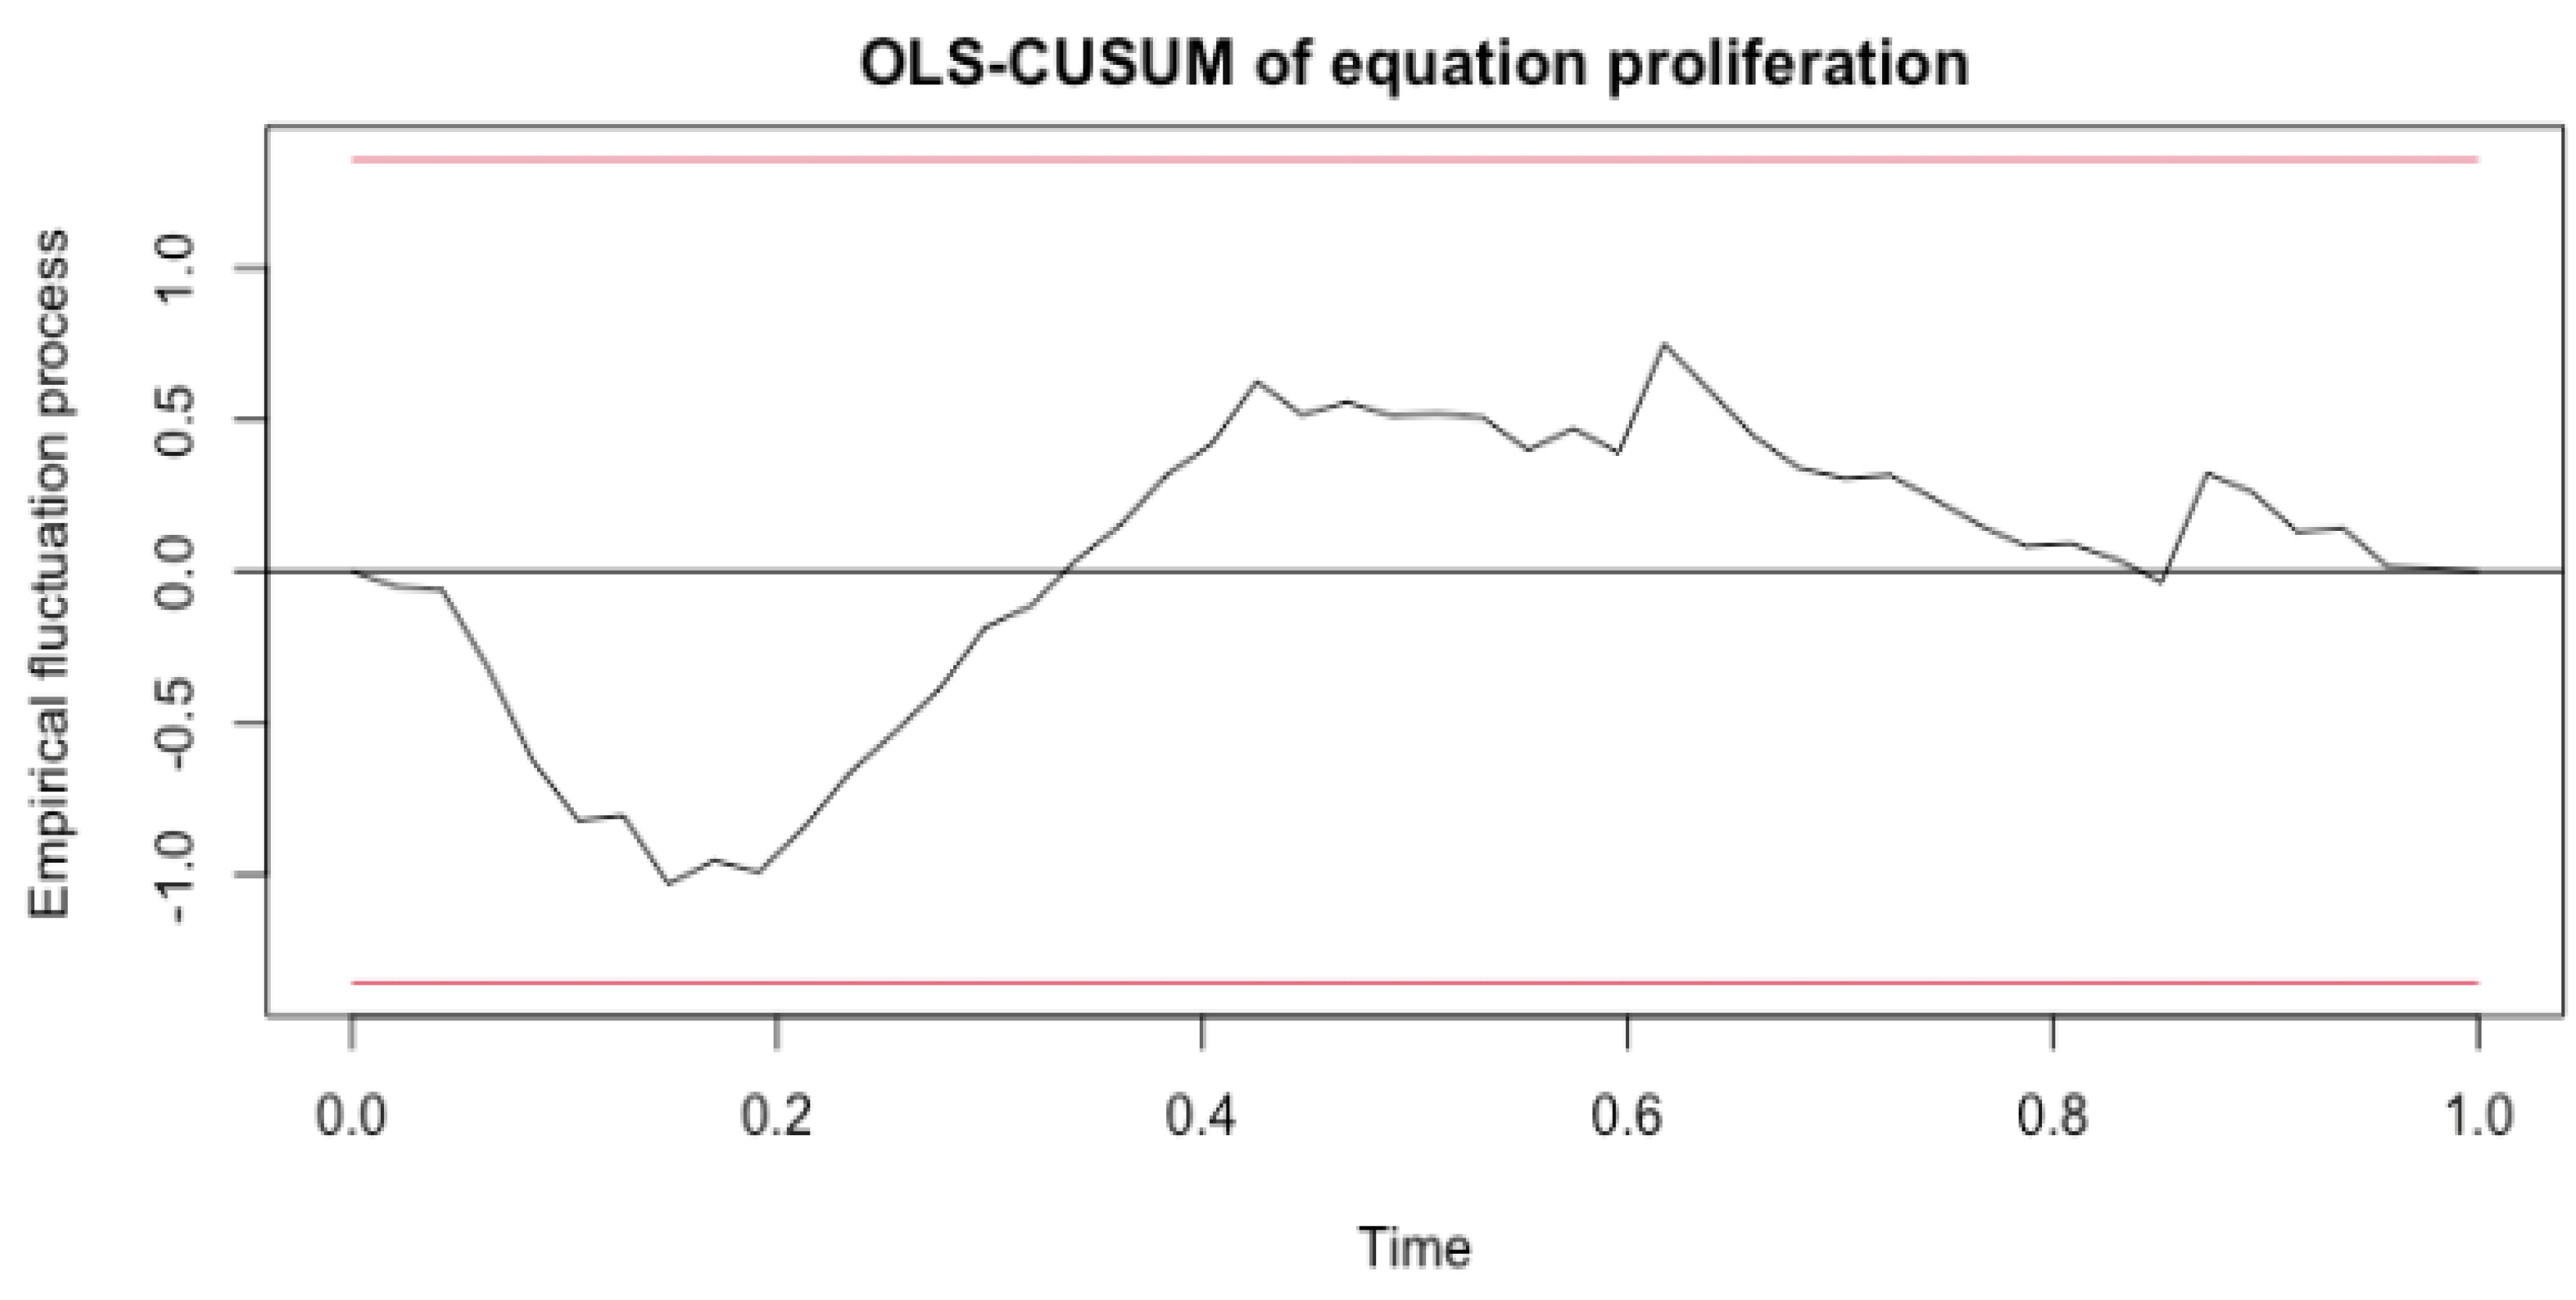
The last metric, stability, tests for the presence of structural breaks, which is important because model accuracy declines when structural breaks go undetected [
28]. CUSUM processes, which contained cumulative sums of standardized ordinary least squares (OLS) residuals, were computed, providing evidence as to whether or not a structural change occurred. In a time-series analysis, structural changes represent shocks impacting the evolution with time of the data generating process [
28]. In order to fail the stability tests, the data would need to fall outside of the red boundaries in the generated plots, which were determined from the stability() function in R. An example plot of the stability test for the 3 min treatment MDA-MB-231 Ki-67 model is shown in
Figure 2. The data exhibit no structural breaks as no point exceeds the red boundaries. After calculating and plotting the empirical fluctuation process for all significant models, each variable was seen to pass this metric.
3.2. Model Verification
Another large portion of validation for this project was the software validation portion. We wanted to test R’s ability in picking up on Granger causal relationships if data that we knew had causal relationships were inputted. In order to input pseudo data that had distinct causal links, four variables were generated in MATLAB [Version R2022a]—Y, Z, N, and P. In order to generate these variables, Y was first defined as the first 48 values of a sin() function. An upward trend was added by increasing each Y data point by a random value between 0.01 and 1.5. Then, a random component was added by adding a random number within −1.5 and 1.5 to each Y value. Next, the variables Z, N, and P were made with respect to Y. The variables Z, N, and P are as follows: Z = 2Y3 − Y2 + 5Y, N = 33Y, and P = 3Y + 2. Once the test data set was completed, it was subsequently run through the Granger causality code. All combinations of Y, Z, N, and P models were tried, and all models resulted in a p-value of 2.2 × 10⁻¹⁶, which is how R outputs p-values less than 0.0001. In addition to running the test data set through the Granger causal code, the same statistical VAR tests done for ROS, CA, Ki-67, and G1 data were also completed. All tests were passed.
4. Discussion
The intracellular levels of ROS, CA, Ki-67
+ count, and cell cycle activity can independently help indicate whether cell proliferation or cell death is occurring for cells treated with CHCP. This study thus aimed to pinpoint which variables affect cell proliferation and cell death in a Granger causal manner. The Granger causal model is a prediction-based statistical concept of causality in which empirical data is used to find patterns of correlation. Granger causality is also known as a “bottom-up” procedure because it assumes two time-series variables are independent of one another. The variables are then subsequently analyzed for correlation. This is different from “top-down” procedures which initially assume a link between the time series variables [
21].
Prior to model generation, it was hypothesized that ROS would act as the main proxy of causality due to the widespread effects of oxidation on the cell cycle. Intracellular ROS measurements indicated that after CHCP treatment, all breast cancer cell lines underwent oxidative stress, which gradually increased with post-treatment incubation time. For both cell proliferation and cell death, while not all ROS models indicated Granger causality, as seen by
p-values > 0.05, this does not mean that ROS did not heavily influence upstream actions. The effects of oxidative species may have affected other cellular processes in a more direct manner. For the 3 min CHCP treatment cell proliferation models, it was seen that only BT-474 and SK-BR-3 displayed ROS Granger causality. Both of these cell lines are HER2
+, with ER/PR receptors present in BT-474 cancer cells and no ER/PR receptors present in SK-BR-3. The cell lines that did not display ROS causality, MCF-7 and MDA-MB-231, are both HER2
−. Ligand-mediated stimulation of HER2 receptors causes auto-phosphorylation of key tyrosine residues that serve as docking sites for downstream signaling cascades that regulate normal cell function by promoting growth and survival. However, when disrupted, HER2 can spur on the growth of cancer [
4]. Given this, HER2
+ cell lines are more likely to respond to treatment that directly targets the HER2 protein itself. The results of this study may suggest that CHCP does directly affect the HER2 transmembrane protein in a way that would signal Granger causality.
It was also seen that the coefficient of regression for the SK-BR-3 3 min ROS model was significantly smaller than that of the BT-474 ROS model. This may be due to the fact that SK-BR-3 has no hormone receptor, while BT-474 is both ER+ and PR+ [
1]. Based on the results, CAP-induced ROS may have a greater impact on cells with a greater number of different receptors. A lack of hormone receptors may cause cells to have a certain degree of tolerance to different oncological therapies, including CAP.
CA showed consistent causality for all of the 3 min cell proliferation models, except that of the BT-474 cell line. This is because BT-474 treated by CHCP at 120 p for 3 min did not induce activation of caspase (data shown in [
14]). When treated for 5 min, CA of all four cell lines showed causality towards proliferation, but BT-474’s coefficient being the smallest also confirmed lower CHCP-induced caspase activation in this cell line.
It was also found that the Ki-67 variable had a clear causal relationship to cancer cell proliferation for all cell lines except MDA-MB-231. The Ki-67 count increased as cells prepared to divide, and with the generalized uncontrolled growth exhibited by cancer cells, a large Ki-67 count indicates significant cancer growth [
17]. Thus, tumor suppression goes hand-in-hand with a decrease in Ki-67 due to its vital role in the continuance of the cell cycle itself [
17,
29]. The reason MDA-MB-231 did not display Ki-67 causality with cell proliferation may be due to the cell line’s inherent level of resistance to CAP and its low levels of Ki-67 already present within the cells [
2,
5]. MDA-MB-231’s receptor status may also account for why the majority of its variables, including cell cycle activity in the G1 phase, showed no significant causality [
5].
When analyzing the general outputs of the causality function, it was seen that all variables displayed a Granger causal relationship with cell proliferation only after CAP treatment for 5 min. This may suggest that CHCP directly initiates and executes apoptotic cell death and reduces cell proliferation in a more pronounced way the longer the cells are treated with the cold plasma. With longer treatment times, oxidative responses and caspase-dependent events may increasingly influence the cleavage of specific substrates to propagate the proapoptotic signal, directly influencing cancer cell proliferation [
16]. Out of the significant cell proliferation models, it can be seen that most of the coefficients of regression for each cell line were greater for the 5 min treatment time than the coefficient for the 3 min treatment time. This increase suggests that CAP effectively increases its influence on cell proliferation inhibition as the cells are treated for longer periods of time. However, CA demonstrated a decrease in its causal effect for each cell line as treatment time increased. While causality is still observed, other variables must be considered. A longer treatment time may enact other factors to play a larger role in reducing cell proliferation.
For the cell death models, it was seen that the 3 min MDA-MB-231 model detected no causality for any variable. This, again, may be due to the highly aggressive nature of the cell line as it lacks functional ER, PR, and HER2 expression. However, after being treated with CAP for 5 min, ROS and Ki-67 showed causality. G1 remained insignificant. G1 activity is a typical indicator of cell growth that is required for DNA synthesis and mitosis, and therefore low G1 activity may elicit apoptosis and cell cycle arrest if regulatory checks are not met within the cell cycle [
18]. Yet, both the cell proliferation model for the 3 min treatment and the cell death model for both the 3 and 5 min treatments showed no G1 phase causality for the MDA-MB-231 cell line. This may suggest that this specific cancer type bypasses the regulatory checkpoints that are responsible to cease abnormal cell proliferation, spurring on uncontrolled cancer cell growth.
It is important to note that although Granger causality was not detected for certain relationships, this does not insinuate that one variable has absolutely no influence on another. While the Granger causality formulation may not have picked up on any causal links, there are many other variables and cellular intermediaries sparked by CAP that play a role, no matter how indirect, in controlling cancer cell growth and cell death.
While the four cell lines examined in this study, BT-474, MCF-7, MDA-MB-231, and SK-BR-3, are all invasive ductal/breast carcinoma cells, they have several phenotypic and genotypic differences that make them metabolically unique [
1]. The clinical heterogeneity of the cell lines thus stems from their differences in sensitivity and responsiveness to different treatments. Different treatment modalities may be implemented into these models for future studies.
Limitations
Many limitations stemmed from the lack of data availability. Had daily raw data been available for different cancer cell types, the models would have more successfully captured the complexities of CAP treatment for varying cancer stages, morphologies, and chemical intricacies. Increased cell-type diversity would have provided a more comprehensive view of the subtleties each cancer type has in terms of cell cycle arrest and programmed cell death. In addition, a consistently maintained data set on an hourly time-scale for each variable would prevent the need for any interpolation and data estimating.
Even though statistical p-values were used to detect causality, the definition of significance is subjective based on our critical value of 0.05. There is also a chance of type-1 error in which the statistical test concludes causality when in actuality there is not any, and therefore further research should be conducted to verify our findings. It may also be beneficial to incorporate high-pass/low-pass filtering of the data, which would remove any outliers present in the data.
As for model validation, heteroscedasticity tends to produce p-values that are smaller than they should be. This effect occurs because heteroscedasticity increases the variance of the coefficient estimates, but the OLS procedure does not detect this increase. Consequently, OLS calculates the t-values and F-values using an underestimated amount of variance. These values are statistical measures, which determine if there is a significant difference between the two groups of data. This problem can lead one to conclude that a model term is statistically significant when it is actually not significant.
In addition, error may in part be due to the fact that the raw data were originally collected from different cell passages, meaning one experiment was conducted prior to passaging or splitting the cells, while another may have been conducted after. The test results may also be impacted by the data cleaning processes and interpolation that were conducted prior to input into the model functions.
5. Conclusions
Our results demonstrate that Granger causality was present among all independent causal variables (ROS, caspase, Ki-67, and G1 activity) and cell proliferation after 5 min CHCP treatment. However, not all variables were causal for the 3 min models. This same pattern did not exist for cell death models, which tested all potentially causal variables (ROS, Ki-67, and G1 activity) vs. caspase activity. The receptor status for each cell line studied greatly impacted the causal influence each variable had on cell proliferation and cell death.
While the literature-based correlations among CAP, cell cycle arrest and cell death have been hypothesized, little computational modeling has been used to test such theories. Computational modeling aids in understanding the systematic series of microcellular operations that occur with cancer treatment without the need for clinical randomized controlled trials or costly research methods. The models thus serve to incentivize more research in terms of what clinical adaptations should be taken to reduce the extent of cancer’s burden on human health.
CHCP has demonstrated its ability to induce cellular oxidative stress, and the media containing CHCP-generated species are more than the mere combination of hydrogen peroxide and nitrite chemical solutions. Quantifying CHCP’s relationship to intracellular reactive oxygen species, caspase, Ki-67 expression, and cell cycle activity in the G1 phase elucidates the impact cold plasma has on disturbing different malignant cellular processes. By harnessing CAP’s innate ability to elicit certain chemical reactions in order to cease uncontrolled tumor formation, CAP has great potential as a fourth arm for cancer treatment in addition to surgery, chemotherapy, and radiation therapy.


 ,
, 

