1. Introduction
Automatic Train Operation (ATO) will enable more efficient train traffic by increasing track capacity, reducing travel time, and lowering energy consumption [
1]. All these benefits will become crucial due to a steady increase in global passenger mobility and freight transportation demand and the resulting necessity of infrastructural development [
2].
The development of theoretical and technical principles to automate railway operations is already well advanced. Similar trends can be found in other traffic and transportation sectors that aim to take advantage of vehicle and operational automation to realize more efficient and safer transportation. Certain systems automating the operation of trains are already qualified for series production and are used in some special fields of the sector like metro systems. However general automation of mainline operation is still not achieved [
3].
The impact of the introduction of such a system on the railway operations is going to be huge. To ensure efficient implementation of ATO, careful testing and analysis of the technical components and software used is required and achieved by demonstrating functionality and performance. Virtual validation and testing are vital prior to verification on tracks and under real-world conditions.
Proving the functionality of a system is the responsibility of the manufacturer. Customers (infrastructure managers and train operators) must decide which system complies with their requirements and can be purchased. To make this decision, testing the performance of available systems is an essential step. Virtual testing can solve this issue efficiently by utilizing a simulation environment.
The general scope of the approach is envisaged to allow a flexible performance analysis of ATO algorithms. The tests are specifically focused on determining whether an algorithm fulfils operational requirements. Runtime analysis and software specific questions are not addressed by the proposed approach since these requirements should be met in general.
In Europe, ATO in combination with the European train control system (ETCS) is the preferred way. This is referred to as
ATO over ETCS. An ATO system shall enable the train to regulate traction and braking automatically. The
ASTRail Consortium, part of the European
Shift2Rail project, was aimed at the identification of general functionalities of an ATO system. Within the project scope, [
4] describes the tasks of an ATO system as follows:
retrieving necessary data for automatic operation,
calculation of optimal speed profile,
journey planning while including restrictions as well as provided trackside data and defining the resulting trajectory.
Furthermore, based on the systems Grade of Automation (GoA) the following tasks need to be carried out by the ATO software components:
giving control to the human driver regularly or in case of an emergency or failure,
opening and closing vehicle doors,
establishing communication with trackside infrastructure, e.g., platform screen doors (PSD), passenger information systems, and send out commands.
The use of ATO in different settings leads to the need to incorporate multiple train characteristics while simultaneously taking different track layouts into account. Challenging track sections can include gradient changes, varying speed limits, or complex routing. In combination with changing technical trackside equipment even within a country and differences in environmental conditions, all these characteristics contribute to a complex set of external factors [
1,
5]
The performance of ATO is connected to the combination of algorithms for the two main tasks of ATO, namely calculating the optimal speed profile and controlling the movement of the train. Different algorithms of each category exist with individual advantages regarding computational time or accuracy of calculations, or meeting other criteria like driving comfort and energy consumption in the case of vehicle control, respectively. One major condition must be met by all algorithms taking into account the real-world application. The computational time needs to be sufficiently short. In [
6], one to two seconds is considered acceptable.
It is to be expected that the performance of ATO systems varies due to the use of different algorithms. Especially under demanding restrictions, differences can be noticeable. Therefore, the performance evaluation could provide useful information, e.g., for the question of which system satisfies the requirements of the customer.
By focusing on the core software elements of ATO, this paper develops a structured approach to enable the virtual performance evaluation of ATO algorithms. The evaluation is focusing on algorithms for optimizing the speed profile. Commonly used key performance indicators for railway operations are extended by introducing sub-indicators that serve as main performance criteria. A structured scenario definition framework is described to test algorithms with these KPIs. The framework consists of a layer-model for the railway sector and types of test scenarios adapted from approaches developed in the context of the automotive sector. Additionally, a list of factors possibly influencing the performance of ATO algorithms is presented. A simple case study is conducted to demonstrate the use of the approach. It is not intended to evaluate one specific algorithm in-depth within this paper.
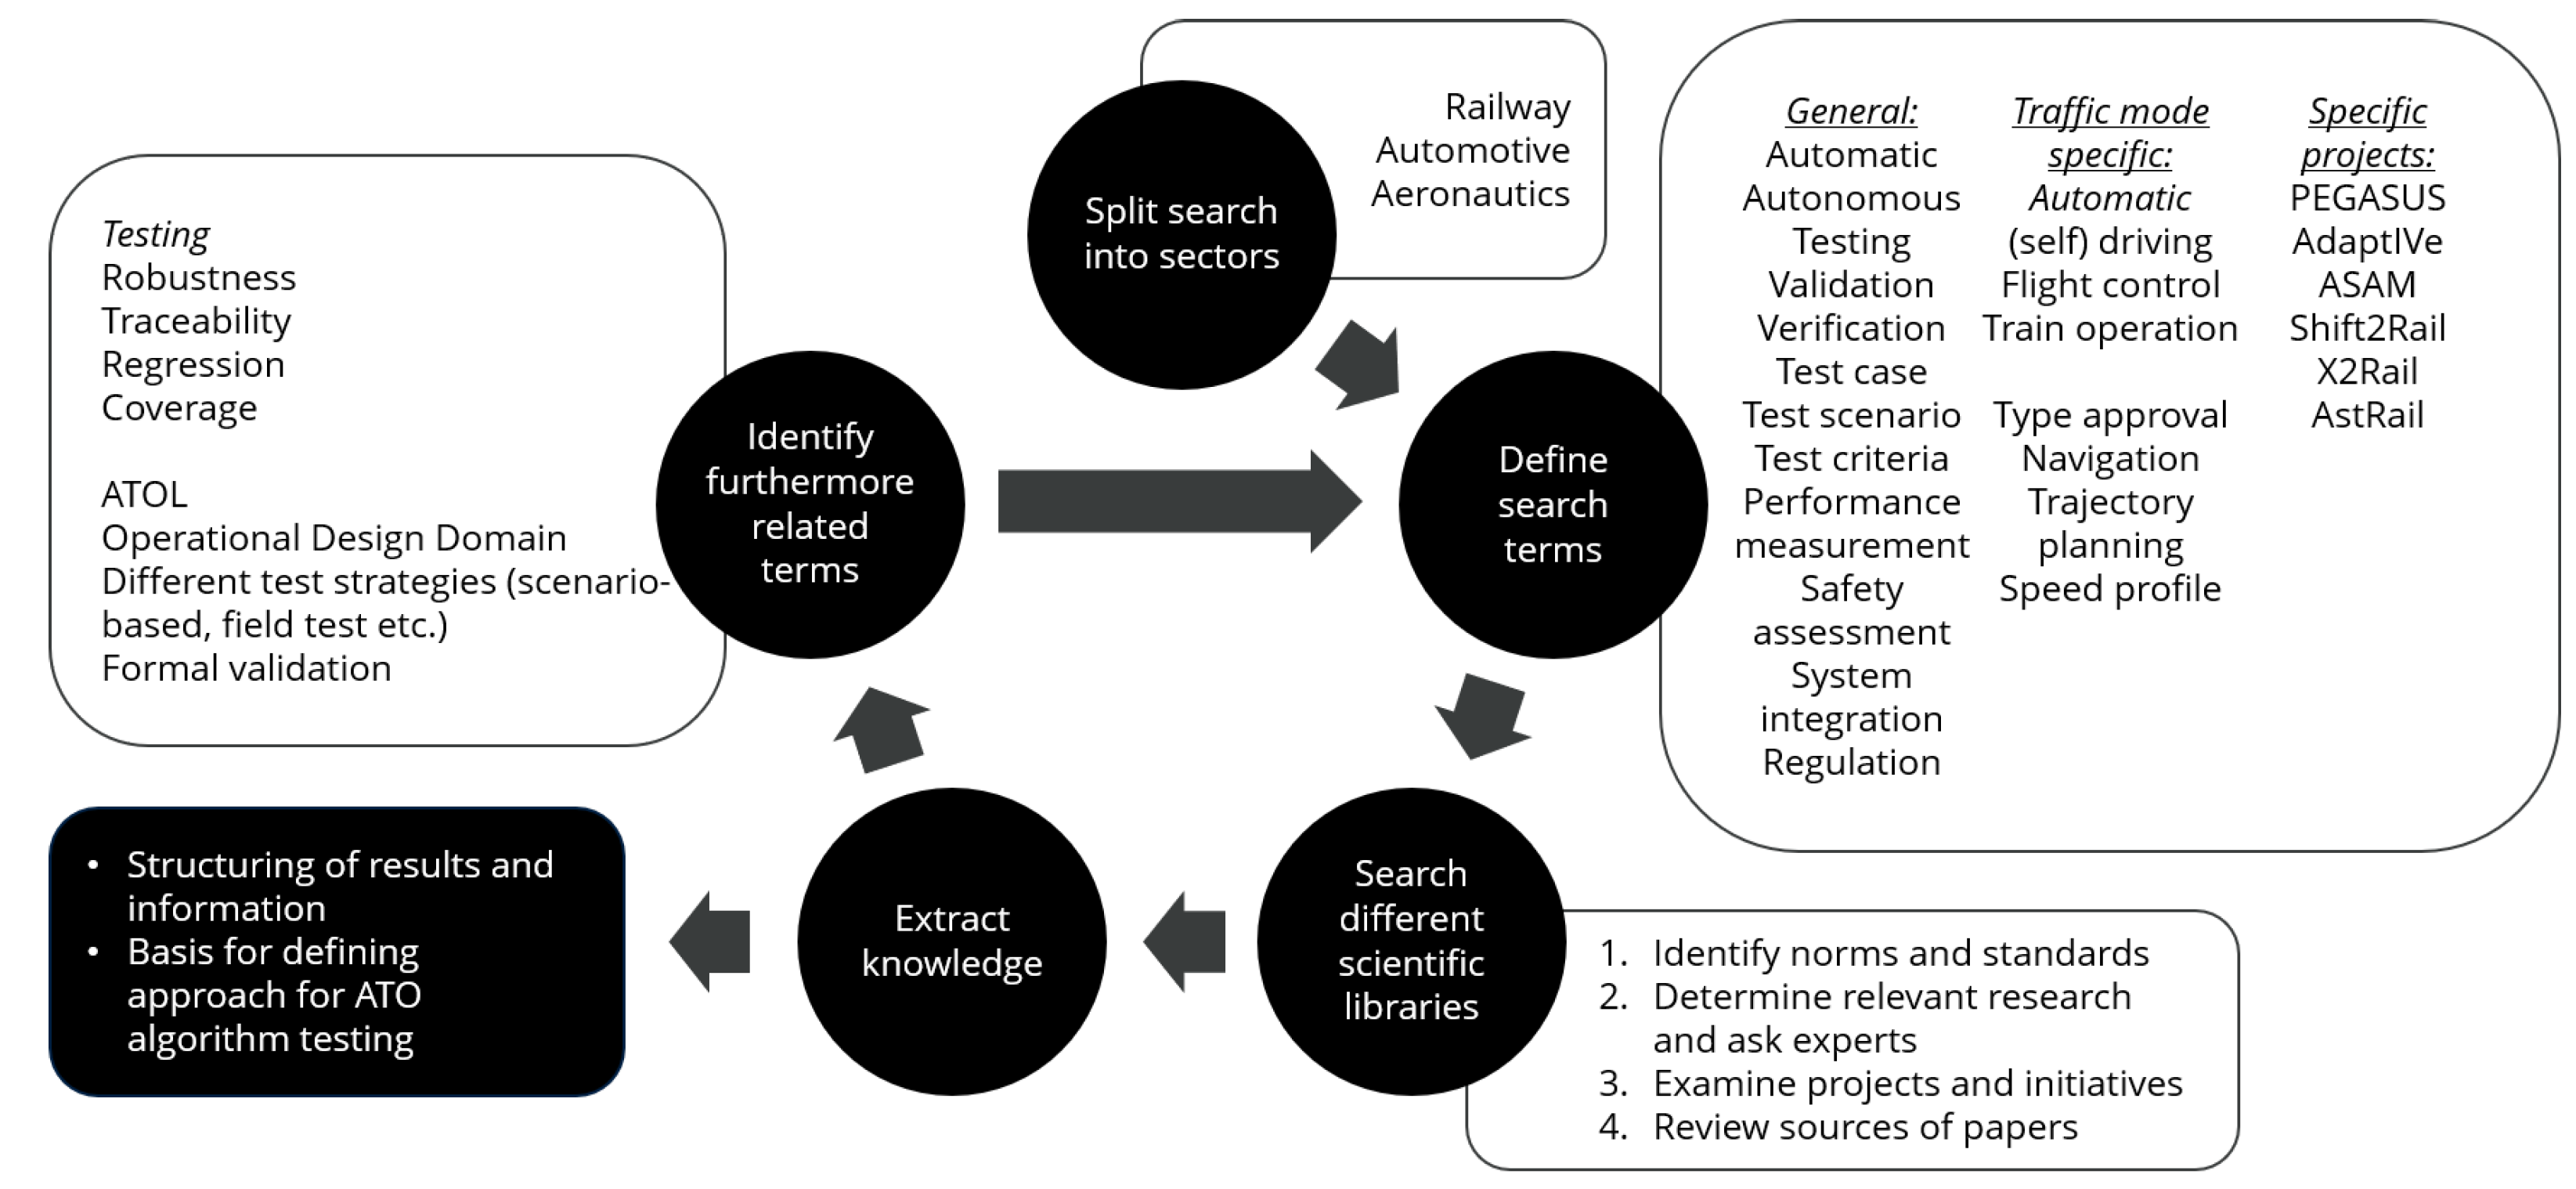
The remainder of the paper, following this introductory section, is separated into four parts. After a comprehensive literature review of methods and standards for virtual testing of systems enabling automatic operation in other traffic sectors conclusions for the railway sector are drawn. On this basis, an approach is designed which provides concepts for measuring the performance of ATO algorithms, a structured design of test scenario specifications, and the extraction of relevant and challenging test scenarios. Finally, this approach is used in a specific performance-relevant test case, using a simulator provided by ProRail.
3. Approach for ATO Testing
A survey [
34] as part of the
X2Rail 1 (
Shift2Rail) project showed that 75 % of the responding companies in the railway sector are in favour of harmonizing test strategies. This includes suppliers as well as customers, namely infrastructure management companies, and regulative authorities.
Defining a structured and general way of evaluating the performance of ATO algorithms is just one part of the overall necessity of harmonizing test strategies. In [
35],
Hoffmann, gives a detailed overview of the process of software testing, and based on that different test properties are outlined.
The envisaged test level of the approach is the system level. The approach can also be used for acceptance tests since one or multiple algorithms could be tested against certain data and criteria, e.g., provided or set by the customer, respectively.
Test criteria are defining the scope of the test, in other words, what is the aspect getting tested. This can either be a functional, operational, or temporal aspect [
35]. The envisaged performance tests are part of operational and temporal testing. They are intended to give an impression of how well the system under test can handle certain test scenarios with increasing complexity.
Hoffmann is listing black-box, white-box, and grey-box testing as different test methods. For the performance evaluations of ATO algorithms, black-box testing is the appropriate test method because normally the customer does neither have insight into the specifics of the algorithm nor its implementation. Thus, defining test cases based on the algorithm itself is not feasible.
These principles are the basis for defining a general test strategy. By incorporating the knowledge extracted during the literature review phase following major steps were identified:
Defining indicators for performance measurement,
Finding a strategy to enable structured scenario definition,
Identifying ATO performance relevant scenarios.
For further discussion, a clear definition of the term scenario in the context of simulating railway operation is beneficial. Therefore, the literature-based definitions for a scene and scenario in [
36] can be transferred to the railway sector.
- Scene:
A scene captures the current state of the environment and all dynamic elements as well as relationships between them for one specific point in time. This includes static objects (rail network, signs, stations, etc.) and dynamic elements (trains, passengers, environmental conditions, etc.). Interactions and relations between all elements are static within a scene.
- Scenario:
A scenario represents the temporal development of a sequence of scenes. The timespan of a scenario can vary. How the scenes and their elements change over time is influenced dynamically by external constraints.
3.1. Key Performance Indicators
Key performance indicators (KPI) are intended to provide a better understanding of whether an algorithm can fulfil the performance requirements under certain conditions in specific operating situations. They represent a universal and flexible metric, also allowing the comparison of multiple algorithms.
To gain a concise representation we suppose a multilevel structure, i.e., a top-level KPI is characterized by several indicators that can be measured or calculated and thus represent a quantitative value that allows further interpretation and comparison. These given KPIs are punctuality, energy and safety and are commonly used in the railway sector when evaluating train operation. The same applies to the sub-level indicators of these KPIs. Within the literature of other projects in the context of testing ATO systems like [
8], similar KPIs are used. Furthermore, accuracy, comfort and capacity were mentioned as relevant measures and are included in the presented approach.
Table 1 is showing the complete list of the selected KPIs.
The calculation of the KPIs is performed for each track section, defined by a departure and arrival station (or point). This shall provide an additional grade of detail for the subsequent analysis of the measures. A more condensed evaluation is possible by determining each KPI for the complete journey of the train under test.
The KPI ”Punctuality” seeks a detailed evaluation at multiple locations during a train journey. The comprehensive analysis of punctuality is of particular importance due to its significant operational impact. Besides the obvious evaluation points departure and arrival, passing points are part of the scenario definition. These are characterized by the fact that the train does not stop at such locations. For each point, a passing time is defined which allows an evaluation of the punctuality at this specific point of the journey. Emerging delays can be identified and possibly traced back to their origin. Moreover, it is possible to assess whether and how well the ATO algorithm can reduce given delays.
Passing points can also be critical timing points (CTP). CTPs are vital points within a timetable equipped with a time window that is characterized by the earliest and latest passing time. These time windows define a frame in which a train must pass the CTP in order to not negatively influence the timetable. Both delays and early arrivals are to be avoided. As a consequence, they can have a great influence on punctuality as well as on capacity as explained later.
The accuracy or precision of an ATO system is mainly defined by the accuracy of the stopping process and the resulting deviation of the specified and actual stopping position. A stop is not only necessary at stations but also in front of red signals. Thus, two indicators are introduced.
If using PSD in higher GoA, the acceptable range of deviation of the stopping position is significantly lower. In [
4], “the need to the ATO function of achieving a centimetre-level accuracy for specific operations” is outlined. For stopping at stations with PSD a precision of less than 10 cm is seen as a prerequisite.
As ATO systems shall contribute to a more efficient drive, characterized by reduced energy demand, measuring the total energy consumption is essential. The total consumption can be separated into different components such as traction and subsystem energy consumption as well as regenerative braking energy. The most important component of the overall energy use is the consumption of traction energy which is influenced by multiple parameters. Those influences can be traction resistance, air resistance, efficiency rates of system components and others.
In this paper, the energy consumption is calculated based on the data available within the simulation log files of the simulator. Therefore, the energy consumption is calculated per time step and summed up for each track section. In general, the following equations apply:
where
is traction force in N,
is the coasting resistance [m/s
] determined by the simulator based on an empirical Equation (
Davis equation),
a is the actual resulting acceleration [m/s
] and
m is the train mass in kg. In Equation (
2),
E is the total energy consumption in [kWh],
v is the actual speed in [m/s] and
is the duration of the time step and
n is the number of time steps.
Although ATO does not include the execution of safety-critical tasks, the performance of the connected algorithms can be evaluated by measuring safety-related indicators. These measures are well-accepted values and are commonly in use when examining rail operations.
Yellow Signal Approaches: number of times driving up to a yellow signal,
Yellow Signal Passages: number of times passing yellow signals,
Red Signal Approaches: number of times driving up to a red signal,
Red Signal Stops: number of times stopping at red signals,
Minimal Differences to ETCS braking curves: minimal differences between the actual speed and the speed defined by the indication, permitted, warning, service brake indication and emergency brake indication speed curves of the ETCS on-board unit.
These values can be compared with a reference run on the evaluated route under standardized (optimal) conditions, allowing a statement to be made about the quality of the calculated speed profile. Furthermore, they can also serve as indicators for capacity analyses, whereby further interpretation is necessary.
The indicators describe the number of approaches toward yellow and red signals as well as counting the passages of yellow signals and stops at red signals. They provide information on how unhindered a train can pass a track section. In addition, approaching a yellow or particularly a red signal is always a situation that involves a higher risk than passing a signal that indicates to proceed.
By calculating the minimal differences between the actual speed and the ETCS braking curves, information is obtained about how close the algorithm comes to forced braking or to what extent speed restrictions are observed. With a continuous evaluation of these values (for each time step), more in-depth analyses would be possible.
In addition to the aforementioned KPIs, customer satisfaction is also influenced by other factors related to comfort. One possibility to determine (parts of) this subjective feeling is to calculate the physical values of acceleration and jerk. Thereby it is possible to get a statement about how comfortable or uncomfortable a drive is.
Based on relevant literature [
37,
38,
39], ranges for the acceleration for the defined comfort levels are introduced (
Table 2). The absolute value of jerk should not exceed
. Braking and acceleration values shall remain equal to or below
to be considered comfortable. The proposed classification can serve as an indication of how to interpret the measured values. All defined values must be seen in the context of the concrete application. Note that comfort is only evaluated in terms of longitudinal motion.
Mainly of importance to infrastructure managers is the capacity. To measure such a complex train operation performance indicator, it is necessary to define what capacity means in the context of the conducted investigations. In [
40], capacity effects related to the introduction of ETCS are linked to a reduction of the train following times. This reduction increases the number of trains that can travel on one route within a given period, e.g., one hour.
Because this approach is testing an ATO algorithm within a defined scenario and not by simulating a comprehensive railway network, simpler capacity indicators are chosen. The first indicator checks the compliance with given CTPs. When a train passes a CTP within its time window, the full (or intended) capacity is reached under the condition that the time window can be respected with a time-optimal drive.
By comparing the actual and permitted speed (ETCS permitted speed curve), a potential to increase the speed driven on this section and thus to increase capacity can be identified. This way of identifying capacity potential was mentioned in [
8] (Tests of ATO over ETCS by SBB), but not fully evaluated.
As a second capacity indicator, the difference between both speed curves can be examined by calculating the area enclosed by them. Therefore, Equation (
3) can be utilized to stepwise approximate this area. This value is then comparable to a reference value, e.g., from a drive under optimal conditions.
3.2. Layer Model
The identified key principle
Structured Scenario Definition will be implemented in this approach by transferring the
6-layer model (6LM) by
Scholtes et al. from the automotive domain to the railway sector. To find comprehensive documentation of the original 6LM, the transferred model is based on, the reader is referred to [
32].
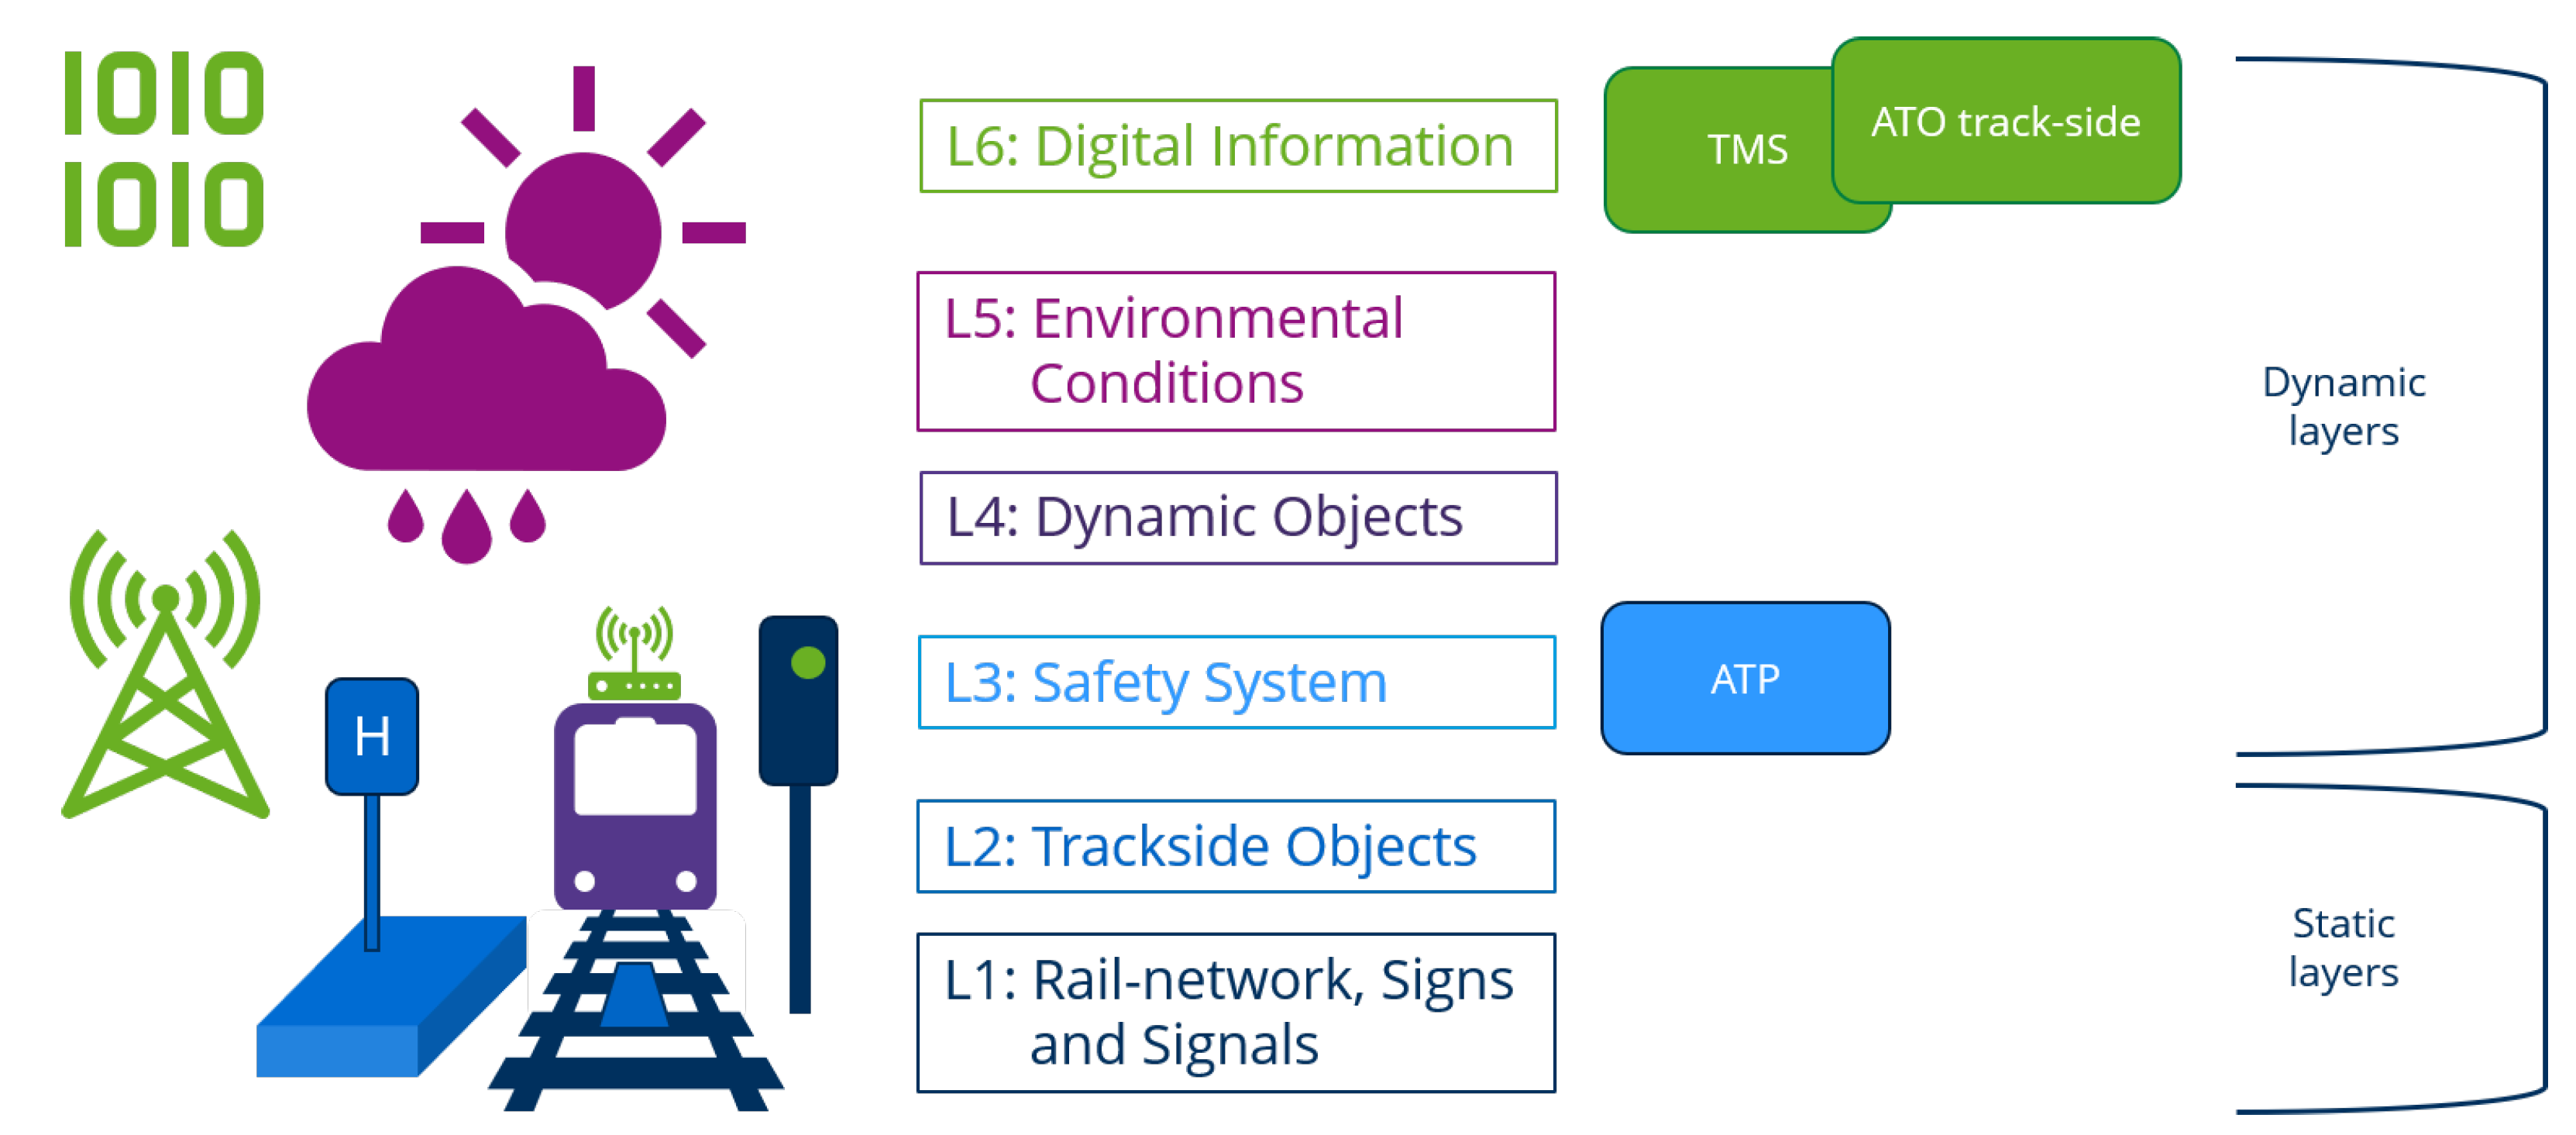
A visualization of the proposed layer model for the railway sector in the context of the evaluation of ATO algorithms is presented in
Figure 2.
All layers do contain entities, which are furthermore characterized by their properties. One entity can have a variety of properties. Apart from that, entities could include a definition of relationships to another or multiple entities as defined in the 6LM ([
32]).
To improve readability, the following more detailed description refers to the layers of the 6LM using numerical phrases (one, two, etc.) and layers of the transferred model are addressed using cyphers (1,2, etc.).
Layers one, two and three in the 6LM are describing the static elements of a test case, thereby including spatial information of all important structures and elements which describe the static scenario components. Analogous to these layers, layers 1 and 2 of the transferred model were defined, whereby track elements, signs and signals (without the information, if it is not static) are subject to layer 1 and trackside structures like platforms, tunnels, bridges, PSD and balises are elements of layer 2.
Layer three in the 6LM describes temporal changes of layers one and two if they are consistently existing during the whole scenario. This is reasonable for road traffic because changes to the road marking, lane guidance and connected traffic rule changes (e.g., signs and traffic lights) can occur frequently. However, changes to the track position of rail lines during construction are very rare and, if present, are known in advance. The installation of fences and warning lights can serve as an example of temporal modifications on layer 2. Such changes will be subject to layer 2 for simplicity reasons, due to their limited occurrences and often long-term installation.
From layer three upwards dynamic elements of a scenario are implemented which do or can contain temporal information. Their state does not necessarily need to change during the scenario but changes can occur, e.g., the sun is shining from the beginning of a scenario till the end, or clouds are slowly covering the sun and it starts to rain.
Automatic train protection (ATP) is a vital function in train operation because it influences all operational phases. Layer 3, which was originally containing temporal changes to layers one and two in the 6LM, is now reserved for the ATP system, e.g., ETCS, its components and possible interactions. When testing ATO functionalities, influences by the ATP need to be evaluated. These influences can range from providing new movement authorities (MA) to intervening when the actual speed is exceeding the ETCS emergency brake indication speed curve or maximum track speed. As a result, the train might have to brake to a full stop before continuing its drive.
Layer 4 is similar to layer four in the 6LM. Scholtes et al. are referring to it as the “traffic layer” because it includes “movable objects whose movement could evolve over time”. Dynamic objects in the railway sector are passengers (on a platform), other trains, cars driving on level crossings, or other vehicles and objects connected to railway operation like cranes for loading and unloading freight trains. They might not exist in such a great amount as in road traffic. Nevertheless, they can play a significant role within a scenario.
Layer 5 copies the equivalent layer of the 6LM. All environment conditions are included in this layer. In [
10], proposing an ODD for ATO systems of Chinese highspeed trains the following environmental parameters are conducted: humidity, wind speed and temperature. Furthermore, the amount of precipitation, as well as the range of vision due to fog or rainfall, can also be added to the list of environmental parameters.
On Layer 6 all digital information is incorporated, like in the original 6LM. Besides the signal state, all information received from the ATO trackside component is subject to this layer. Examples of such information are journey profile updates with timetable changes, temporary speed restrictions, disruptions, rerouting, and more. Generally, all transferred information is modelled by this layer including connections of onboard systems.
Within the railway sector, several simulation environments are available either including a proprietary scenario description language and format or making use of standardized formats in the sector. The latter can also be highly relevant when aiming for a universal scenario description. Potentially, the layer model can provide a basic structure for a new scenario description format.
3.3. Extraction of Challenging Scenarios for Performance Evaluation
The third step to evaluate the performance of an ATO algorithm is the extraction of challenging scenarios. This would mean generating a set of situations that could reveal the limits of the algorithm under test or confirm the satisfaction of the given requirements.
Other transportation sectors use scenarios with small time scope in the context of safety assessment. Scenarios for the performance evaluation of ATO algorithms need to be much longer than just a critical situation to allow the identification of performance changes. The envisaged scenario-based performance test approach evaluates comprehensive driving situations, e.g., a train route between two or more stations.
Two ways to generate or define scenarios exist: data-driven and knowledge-based. The data-driven approach requires the existence of a sufficiently large database consisting of recorded traffic situations and drives under a wide range of conditions. Since such comprehensive datasets are not available in the rail sector to the author’s knowledge, the data-driven scenario definition is not explored further, but maybe an interesting research direction.
The proposed approach is therefore employing the knowledge-based concept. Several scenario types were developed by
Bagschik et al. and described in [
27]. They are utilized within this approach as well and consist of the following steps:
Identification of functional scenarios,
Extracting corresponding logical scenarios,
Further development of logical scenarios into concrete scenarios with little effort.
3.3.1. Functional Scenarios
According to the definition in [
27], functional scenarios are describing a test case linguistically in a general way. The following text passage can be seen as an exemplary definition of a functional scenario for a train journey.
The track (layer 1) includes three stations: A, B, C. Train X is starting its journey at station A, passing station B and arriving at station C. The journey is not interrupted by any halt signal. Train X does not stop in station B. (layer 6) Different weather conditions prevail (layer 5) and the movement authority is not provided in time (layer 6).
Furthermore for the concrete application in the railway sector, functional scenarios can include many more information and entities. These entities may include general speed limits, the presence of static and dynamic objects and a general description of the environmental conditions, like the season and the presence of precipitation. To specify all those information, the layer model for the railway sector can be used. In the example, the layer to which the information refers is indicated in parentheses.
3.3.2. Base Scenario
Before logical scenarios are defined allowing the variation of parameter values, a minimal scenario definition is a crucial requirement for the lengthy scenarios necessary for testing the performance of ATO algorithms. This minimal definition is introduced in this paper and will be referred to as the base scenario. It can be provided either by designing a track from the scratch or by making use of already existing reference tracks.
A base scenario consists of a minimal set of scenario components to allow a logical scenario to function in principle. These minimal defined scenario components are:
correctly designed track layout including track characteristics,
presence of critical infrastructure elements,
accurate use and positioning of safety system components,
definition of a (standard) timetable,
comprehensive train model and characteristics.
Bringing back the layer model for the railways, elements of the static layers one and two as well as parts of layers three and six need to be defined as a base scenario before logical scenarios can be set up. According to the simulator used and which default values need to be defined, these minimal requirements can be more comprehensive.
3.3.3. Logical Scenarios
Functional scenarios introduce entities. If the description of those entities is appended with parameter ranges in the physical state space, one speaks of logical scenarios. They also can describe relationships between multiple entities [
27]. By using the layer model for the railway sector a structured definition of logical scenarios is possible.
Following the example from above, by applying parameter ranges for the entities defined in the functional scenario, a corresponding logical scenario can be characterized as listed in
Table 3.
Logical scenarios can introduce additional entities with parameter ranges for their properties. They could represent challenging factors whose influence on the performance behaviour of the ATO algorithm is to be investigated. The exemplary logical scenario can thus be titled: “Influence of a movement authority delay under certain weather conditions”.
3.3.4. Concrete Scenarios
Finally concrete scenarios need to be extracted. A concrete scenario is characterized by assigning a fixed value from the parameter range previously defined in the logical scenario to each parameter. Besides a fixed value, the change of a value over time is also an option, if the time and rate of change are fixed.
Following the example from the other sections, two possible concrete scenarios with the following specifications would be:
MA delay: 60 s, Temperature: 10 C, Precipitation: 5 L/m,
MA delay: 90 s, Temperature: 10 C, Precipitation: 5 L/m.
3.3.5. Identification of Potential Performance Influencing Factors
The structured identification of factors possibly influencing the performance of an ATO-system is based on the specific system characteristics of railways as presented in [
41,
42]. An extensive overview of the resulting influencing factors is presented in
Appendix A. Please refer to the corresponding section at the end of the paper to learn how to retrieve this information.
For the general functional scenario train journey the subdivisions Start, Drive and End were introduced. The factors are therefore linked to the operational phase in which they might be relevant and sorted by the corresponding layers of the layer model. They are characterized by varying degrees of detail, due to the complexity of the topic they address. For example, an intervention of the safety system (e.g., because overshooting the emergency braking indication curve) is considered an influence on the ATO system in the same way as the general timetable is treated as an influencing factor. Important to note, that it has not been proven that these factors do have a significant influence on the performance of an ATO algorithm. With this list, an overview of potential factors is created. To determine the effects and impact they provoke, a separate investigation is necessary.
It can also be useful to choose a finer structure of the individual factors. For example, the aforementioned influences of the timetable could be separated. The current grade of detail for each factor was selected to give a first overview of possible influencing factors and to provide a structure by applying the layer model. Certainly, an extension of this list is possible, especially with country- and system-specific additions. Moreover, it is also relevant which train control system is used, which can lead to a multitude of further influencing factors or a reduction of the aforementioned.
3.4. Scenario Evaluation and Comparison
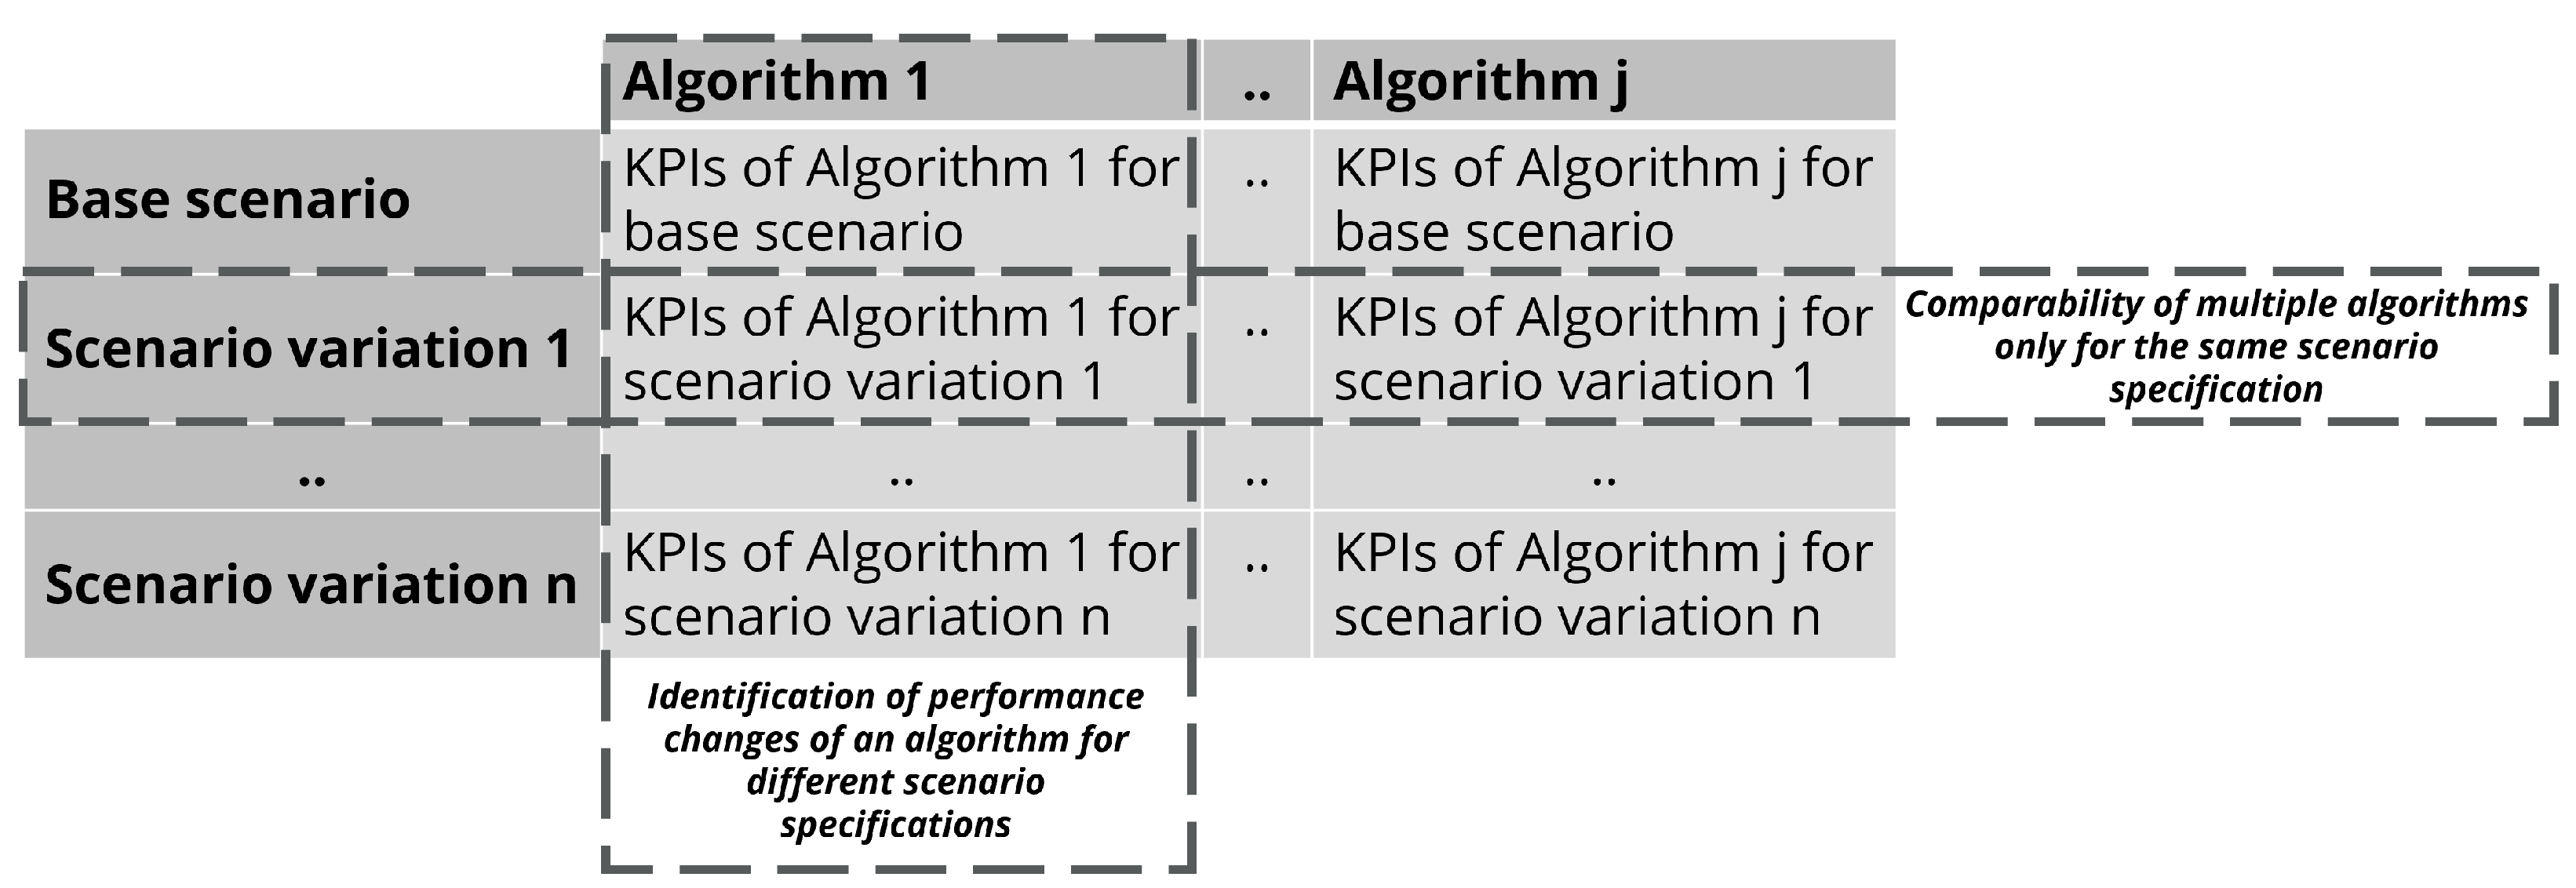
It is either possible to determine performance changes between multiple scenario variations or analyze the performance of multiple ATO algorithms.
Figure 3 visualizes these two objectives.
If the performance of one algorithm is tested for several (challenging) situations, then the evaluation of scenario variations is necessary. Scenario variations are achieved by extracting a set of concrete scenarios from one logical scenario as described. In other words, the concrete values of one or several properties are varied. All other values stay as defined in the base scenario. By comparing the KPIs for those scenario variations it shall be possible to diagnose how extensive the influence of one (or multiple) changing parameters is on the performance of an ATO algorithm.
If the performance analysis is supposed to compare different ATO algorithms, then consequentially it is not useful to conduct such a comparison across different scenarios. To investigate the differences in the performance of two or more algorithms, the same scenario must be taken to ensure a level playing field. When testing the algorithms against the same scenario, it is possible to discover deviations in the handling of challenging situations. For this purpose, either the performance for the base scenario or the performance for the same scenario variation is comparable as illustrated in
Figure 3.
4. Demonstration of Approach
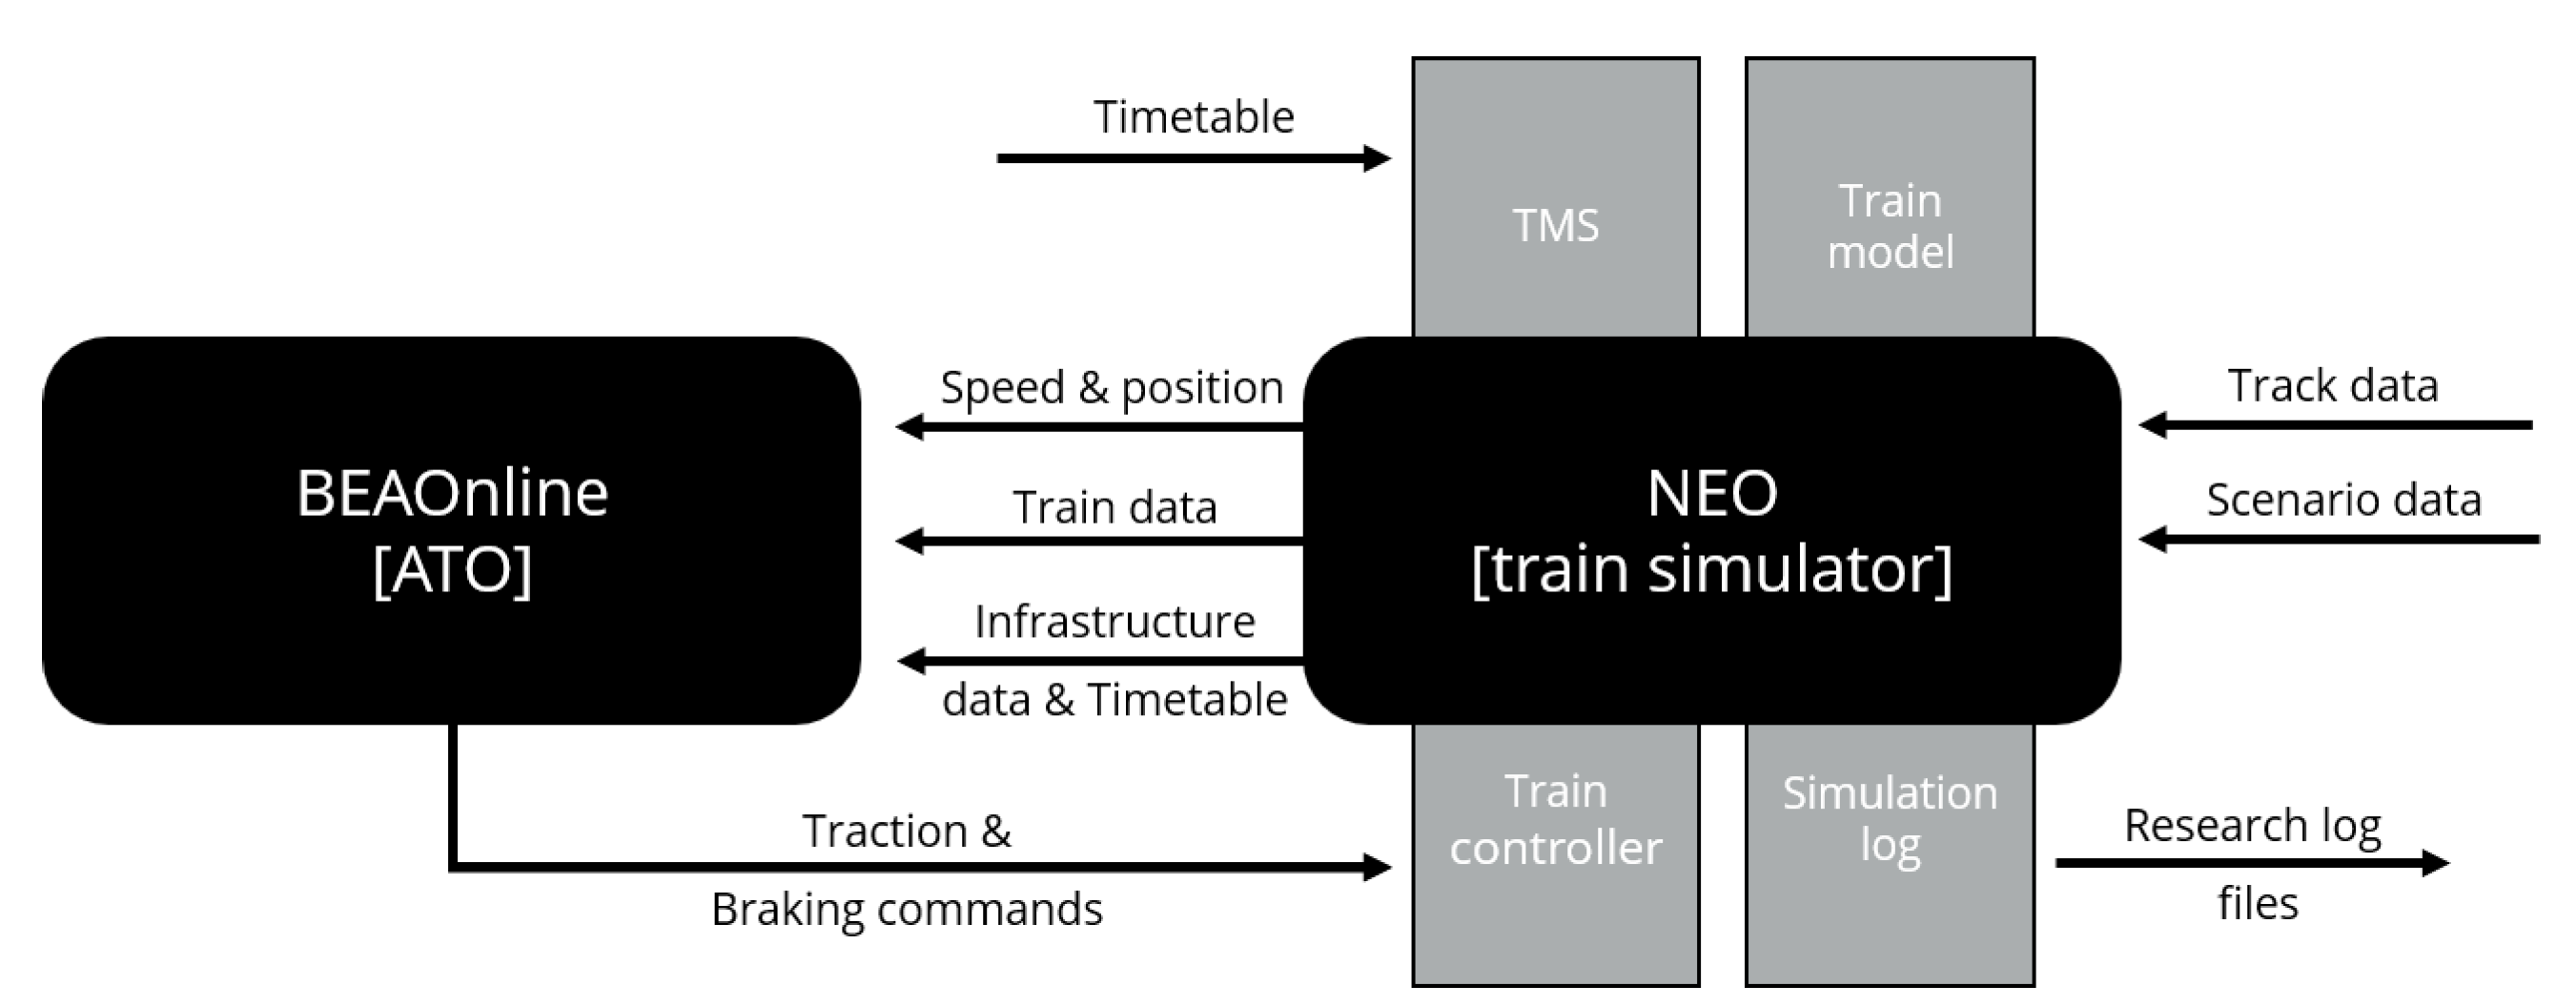
This section describes a brief demonstration of the outlined approach. The simulation framework that has been used for an exemplary ATO algorithm evaluation consists of two components depicted in
Figure 4:
Driver Advisory System (DAS) named BEAOnline by TU Dresden (used as ATO algorithm),
Train simulator named NEO by ProRail.
BEAOnline was originally developed as a driver advice system and based on the offline functionality of BEA (Basic Energy Analysis), which can be used for energy consumption estimation [
43]. The main functionality of ATO and DAS algorithms, namely the calculation of the optimal speed curve, coincides. With BEAOnline, a DAS algorithm was refined for application as part of an ATO software.
The NEO simulator by ProRail allows the microscopic simulation of one (or multiple) train drives. Thereby, train models and detailed virtual track images are necessary. The system is based on the original version named
MATRICS following the concept of gaming simulation. It was used for several projects within ProRail either for demonstration or research purposes. [
44] Furthermore, NEO is capable of generating comprehensive logging data, which is necessary to calculate the KPIs and thus evaluate the performance of the algorithm under test. By reading and analyzing all simulation log files, the KPIs for ATO algorithms are calculated and can be compared with other tests.
The case study provides a brief evaluation of the impact of different timetable definitions including CTP variations to demonstrate the approach. For a complete evaluation of the given ATO algorithm more profound analyses are necessary.
4.1. Test Scenario Definition
To demonstrate the use of the approach a functional scenario has been defined. The following influencing factor for ATO systems is the central element of the scenario:
Different timetables (Layer 6) yield a challenging set of available running times including additional restrictions by CTPs
The resulting functional scenario can be described as follows:
- Different timetables
The train equipped with the system under test (BEAOnline ATO algorithm) is driving from a station on a reference line to a target destination and needs to stop at one additional station along the line. For this journey, different timetables are provided, which are characterized by the available running time. The timetable can include time windows for critical timing points. All other necessary definitions are given by the base scenario.
The case study is based on an existing reference route available for the NEO simulator. This route represents the railway line from Schiphol to Zwolle in the Netherlands. Train operation is organized and constrained by timetables. Their change causes the algorithm to adapt the calculations and thus also the optimal speed profile to the newly arising constraints. Depending on whether the new limitations are tighter or less strict, the performance of the ATO algorithm may change. It is intended to investigate to what extent the algorithm can cope with varying running times set by the timetable.
The main goal of this demonstration is to show how the developed approach can be applied and whether the defined KPIs allow concluding about the performance of the algorithm in practice.
Based on the functional scenario two examples of logical scenarios are defined. In
Table 4 and
Table 5 a description of these logical scenarios is given. For both logical scenarios, one part of the reference line functions as the corresponding base scenario, while the baseline scenarios include all the specific characteristics of the section, the two logical scenarios differ in terms of the concepts used to vary the timetables. As the section from Zwolle to Almere Centrum includes two CTPs before the stop at Lelystad Centrum, logical scenario 2 incorporates these as additional constraints. In contrast to that, no CTPs are defined for the section of the reference line between Schiphol Airport and Almere assigned to logical scenario 1.
Regarding the defined parameter ranges of the timetable properties, concrete timetables were defined. They are changing the original reference timetable of the base scenario in such a way, that the different property parameter values within the defined ranges are achieved. For example, for a concrete scenario derived from logical scenario one, this could result in a two-minute reduction in available running time and for a second concrete scenario, a four-minute reduction. A reasonable gradation of the parameters needs to be selected according to the evaluation objectives.
Overall, in comparison with a reference drive under base scenario conditions with the standard timetable, performance changes shall be identifiable if existing.
4.2. Simulation Results
For demonstration purposes and to evaluate the use of the introduced approach, nine simulation runs as part of two logical scenarios have been performed. Their results have been analyzed accordingly.
As intended, the KPIs were calculated based on the logging data of the simulation environment. In addition to the effects that could be expected from the introduction of restrictive boundary conditions in the timetable, important insights were gained about the simulation environment and the ATO algorithm itself.
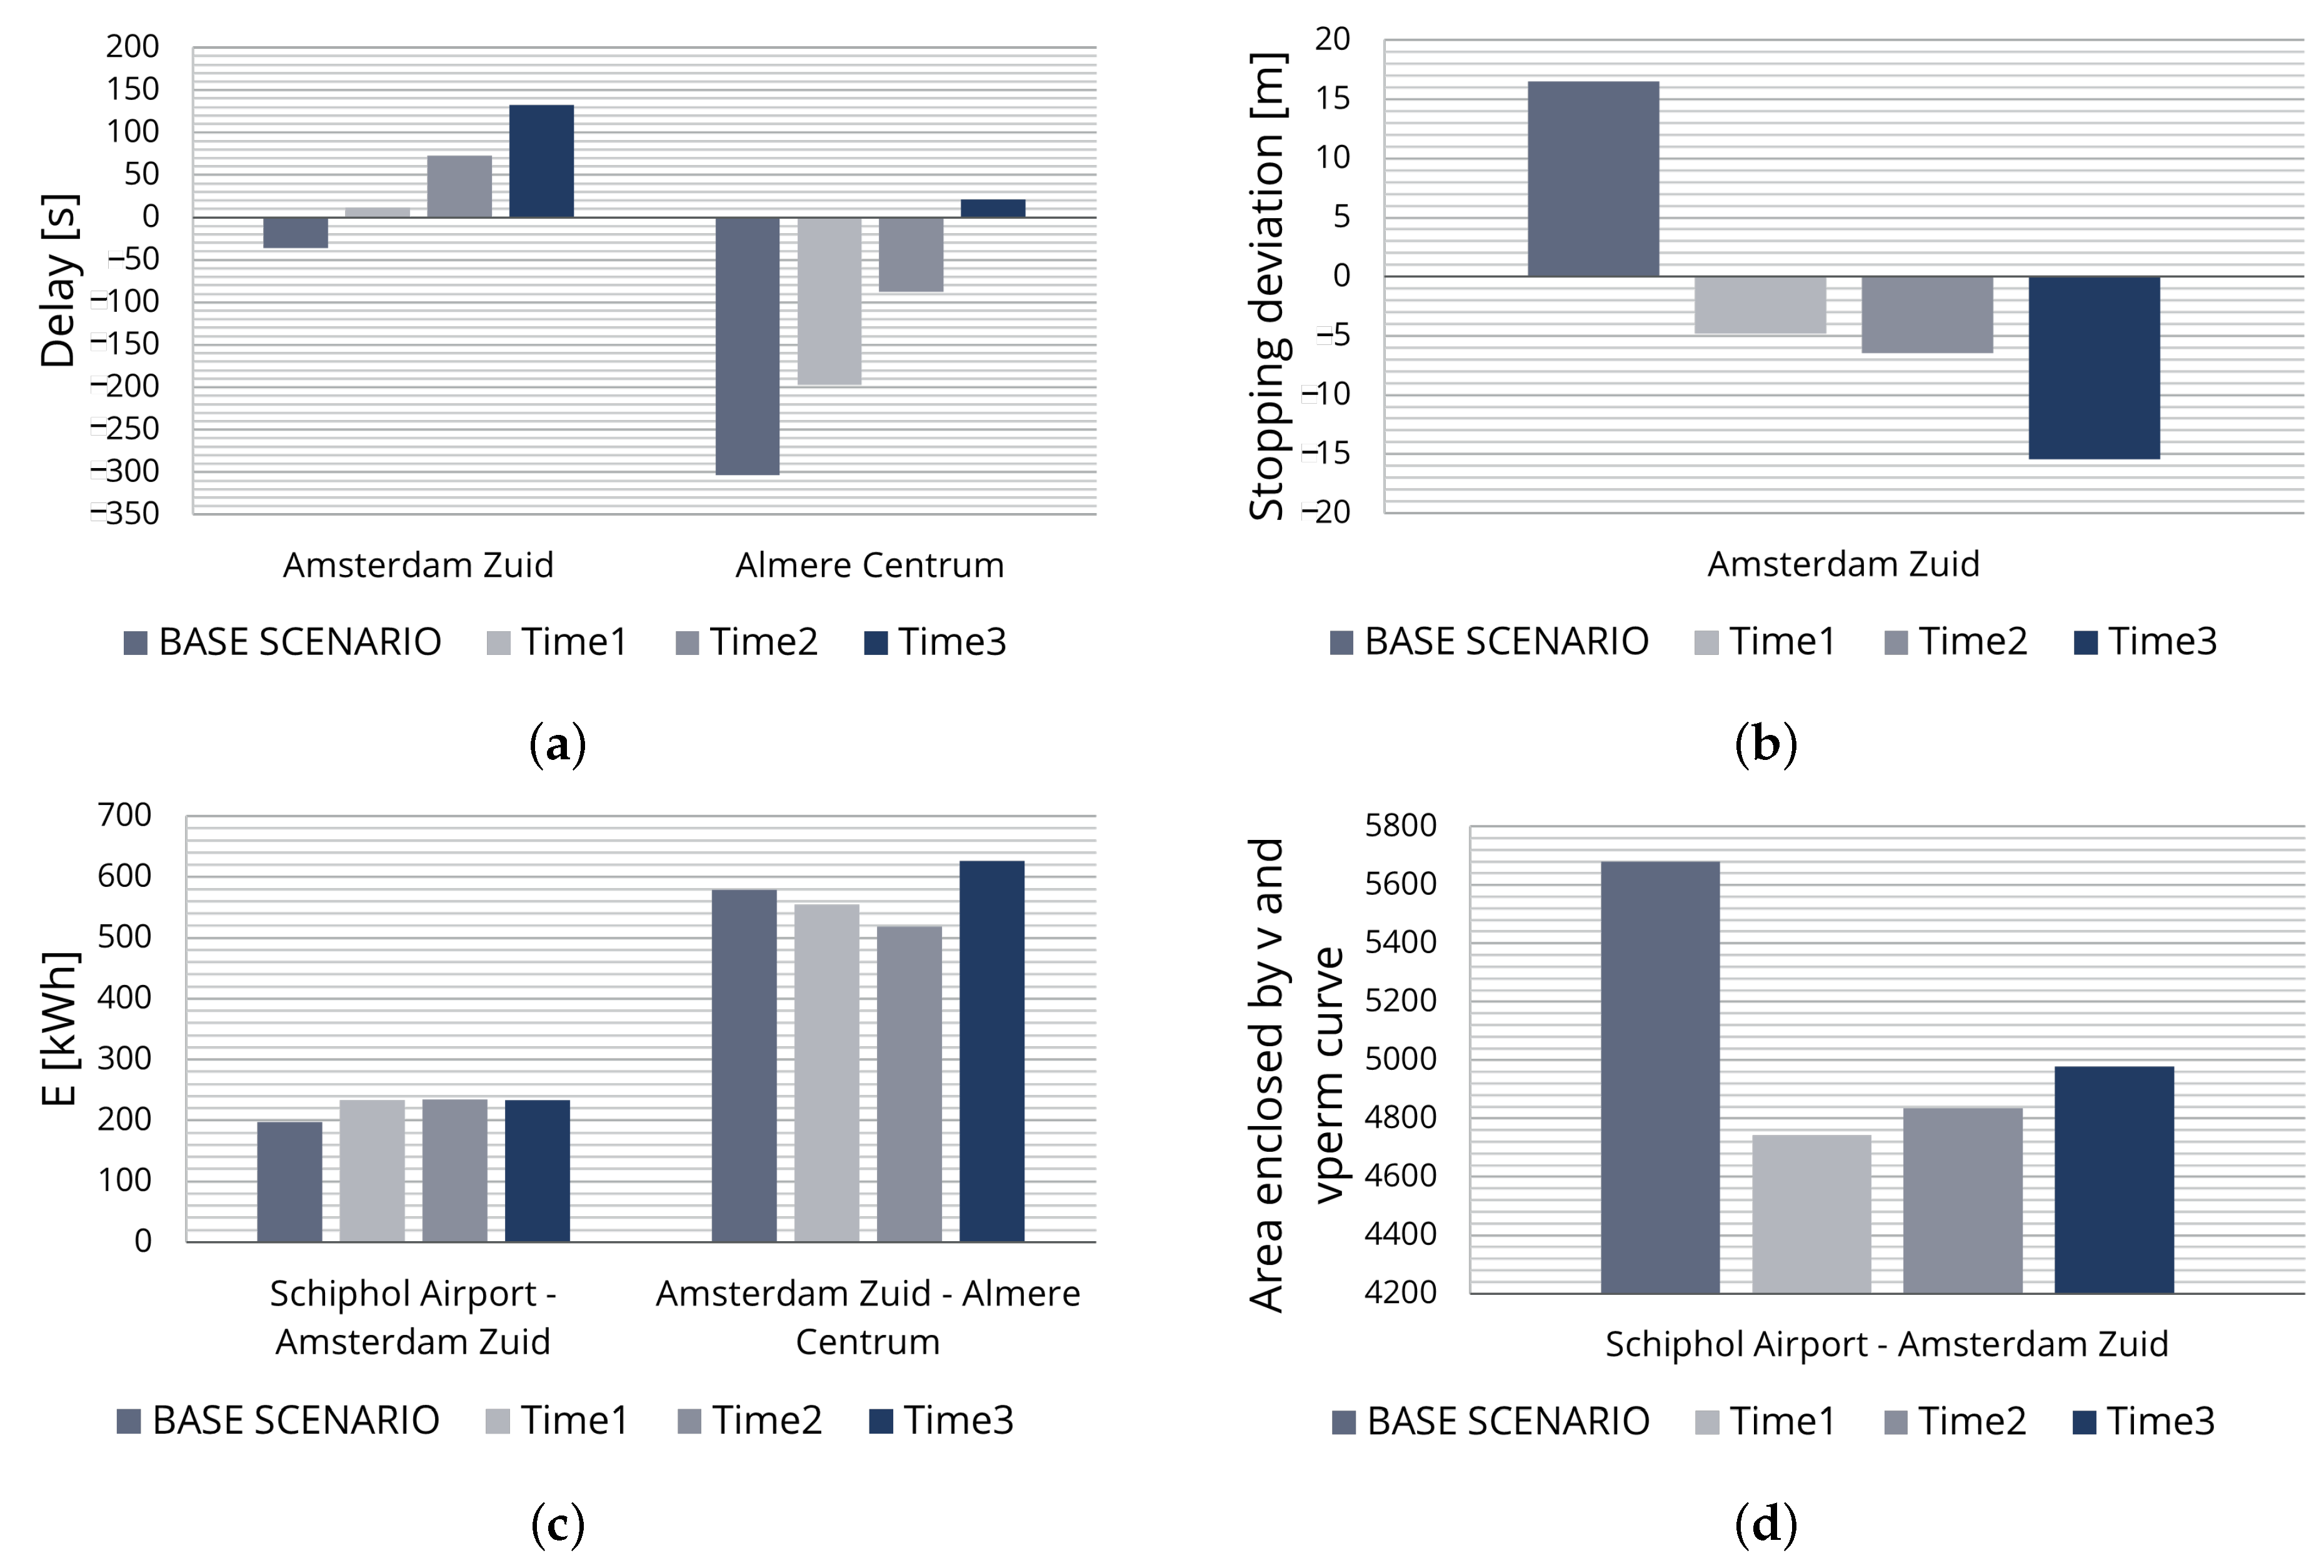
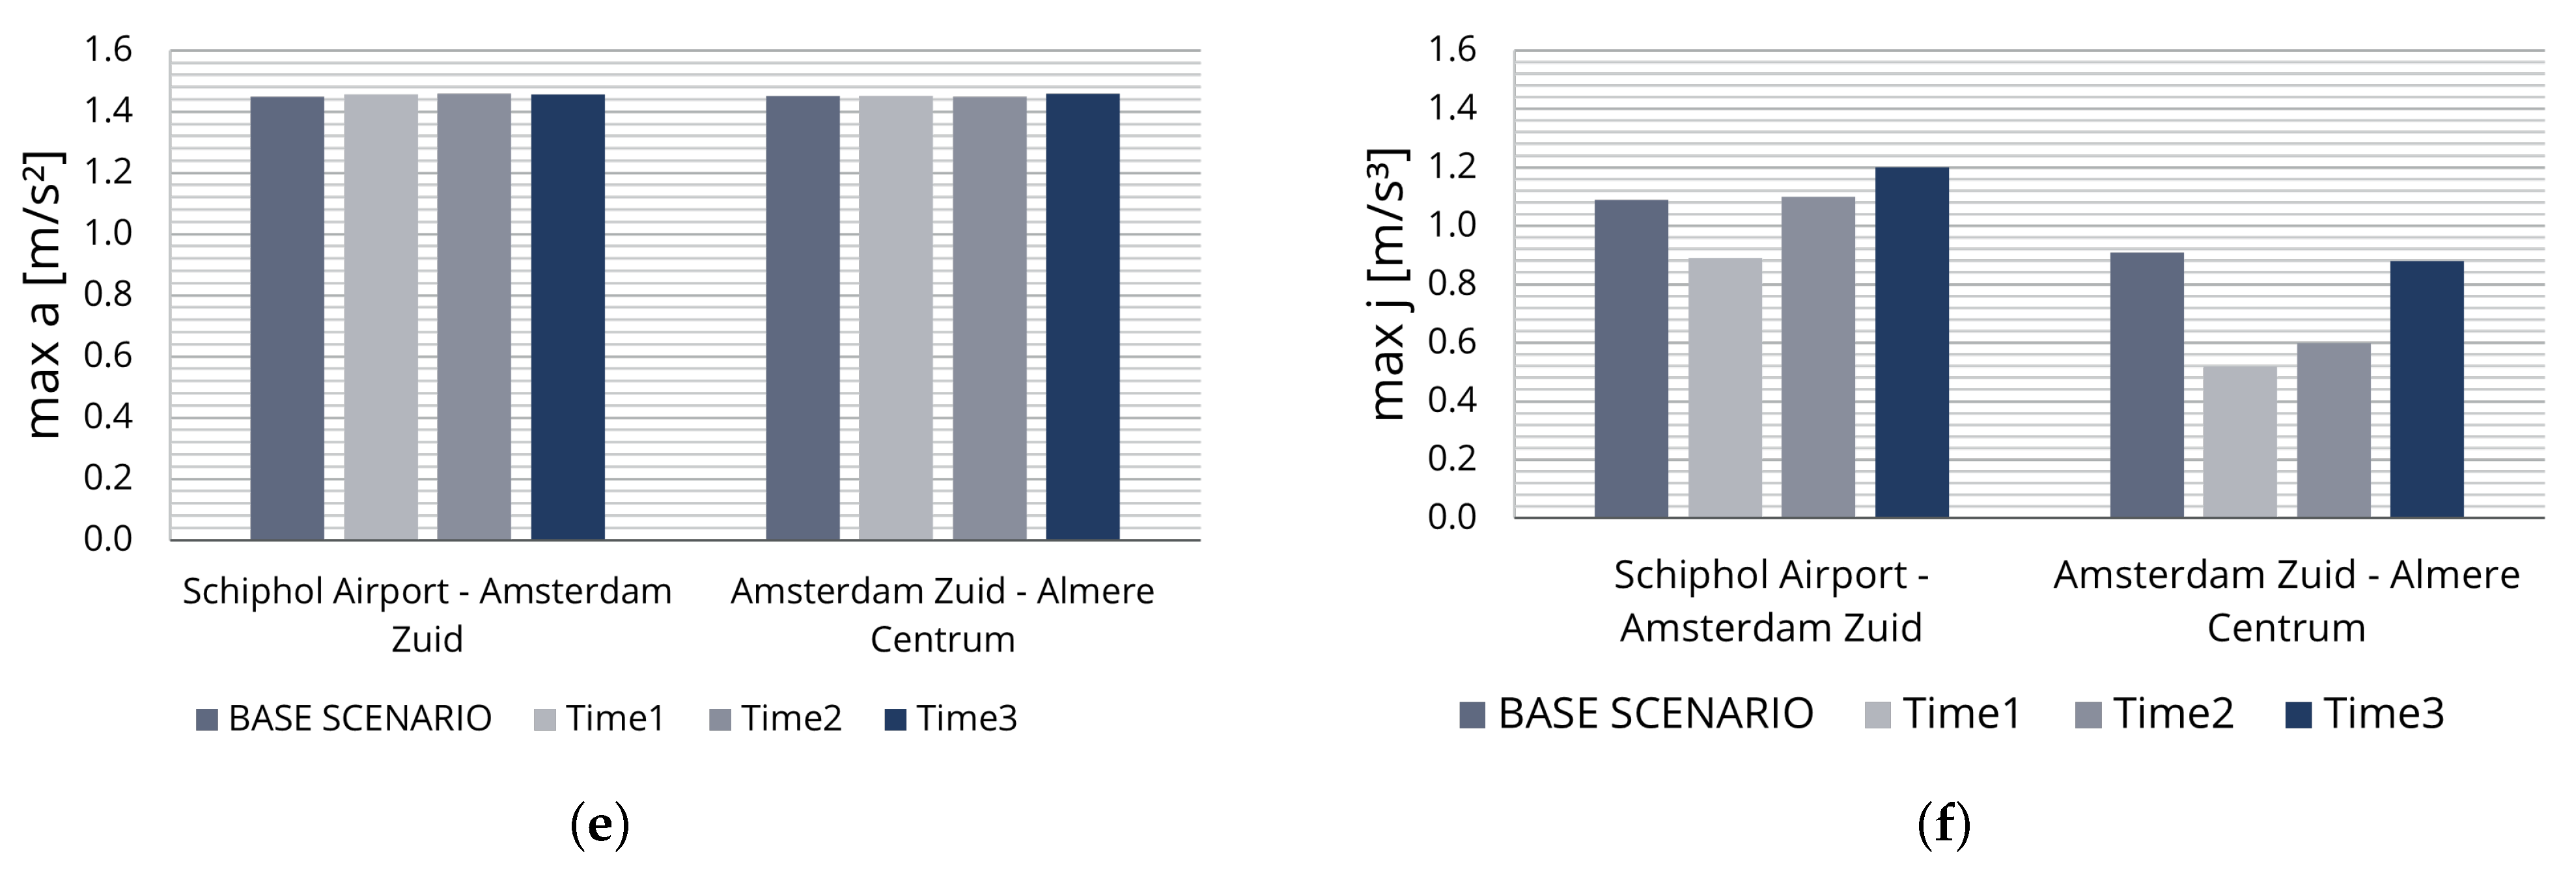
Within
Figure 5 the KPI values for different concrete scenarios of logical scenario one are shown exemplarily. Logical and expected results, e.g., punctuality, can be identified. Other KPIs need to be evaluated in a greater context. For example, the values of the accuracy KPI vary greatly from one concrete scenario to the other. This variation can be attributed to inaccuracies in the simulation environment, which resulted in a non-optimal stopping process. Regarding maximum acceleration and jerk levels, measured values for the available scenarios are within the defined limits. Energy consumption falls within the expected ranges as well.
In the case of the capacity evaluation, a measurement area from the beginning of the track up to a speed restriction area before the station of Amsterdam Zuid was selected. This measurement allows determining how the algorithm tries to reduce the travel time to a minimum by following the allowed maximum speed as closely as possible. Within the base scenario, enough running time is available. Thus, it is not necessary to drive at full speed leading to a greater area enclosed by the permitted and actual speed curve. When the algorithm tries to achieve a time-optimal drive, the area enclosed by the two curves should be minimal, since it tries to maintain the maximum permissible speed as closely as possible.
How the capacity KPI is evaluated in this approach might not provide all information important for capacity determination. Because the scope of the simulator is limited to a microscopic assessment, the capacity evaluation is adapted to this characteristic. If analysis on a network scale was possible, more general statements potentially of greater relevance and significance may be drawn.
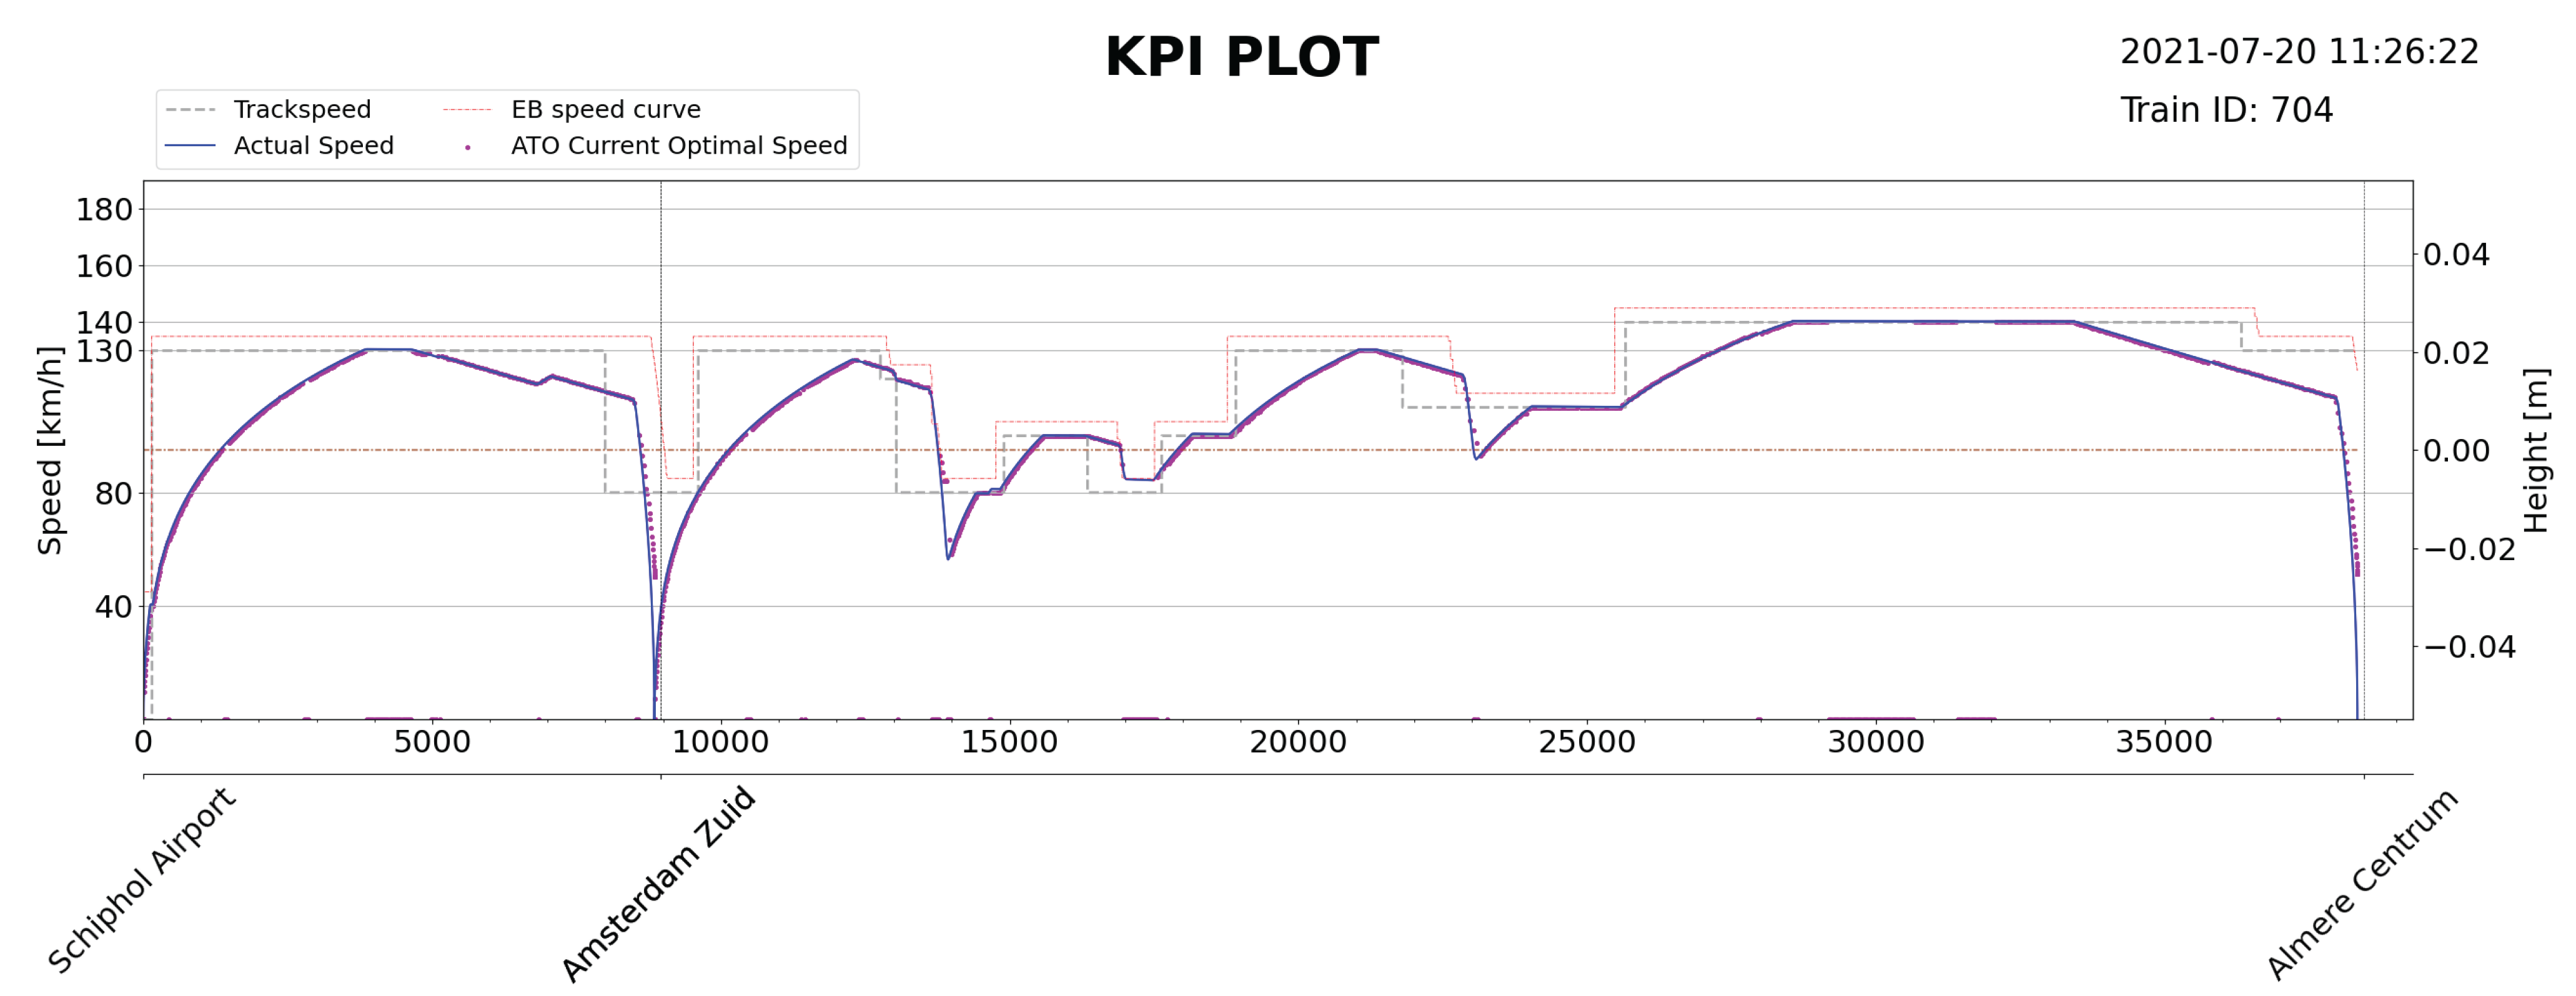
In
Figure 6 visualization of the speed profile including relevant restrictions like the maximum allowed track speed and ETCS emergency braking curve is displayed. Additionally, track data like station locations and height are given. With this, a more convenient and easier evaluation of the KPIs is possible by providing context to the plain numbers.
The scenarios are illustrating how the algorithm is reacting to a set of challenging timetables. This is observable by the change in the KPI values. Additionally, the speed plots provide viable information to further interpret the KPIs for example for a more in-depth analysis of weaknesses of the algorithm under test or to understand better the reason for certain specific behaviours.
5. Conclusions
With the approach presented in this paper, two set goals are achieved, namely identifying a way to efficiently test ATO algorithms in a virtual environment and enabling the comparison of multiple algorithms based on logical measures. Its application may allow train operators and infrastructure managers to select the best suiting ATO systems according to their requirements.
The approach consists of universal KPIs taken from the literature and supplemented with sub-level indicators to measure the performance of ATO algorithms, a framework for the structured definition of test scenarios taking advantage of the layer model for the railway sector as well as different scenario types, and the identification of performance relevant factors.
The KPIs introduced for this approach can provide valuable information about the performance of an ATO algorithm in specific situations and scenarios. It proved difficult to strike a balance between the need for further interpretation of the values and providing quantified metrics that are comparable when scenario definitions change. Calculating the KPIs for each departure and arrival pair results in a more or less extensive list of values, depending on the length of the scenario. If the KPIs were determined only for the entire run, a simpler but less detailed overview of the performance for a given scenario would be possible. Furthermore, it is necessary to provide a range or overview of reference values for some indicators to be able to classify the measured quantitative values. This proved to be particularly difficult for the comfort indicator since the classification of these values is not commonly realized.
Within the approach, different scenario types are introduced. These are helpful to infer from general test cases to exactly defined, complete, and thus also simulatable scenarios in a structured manner. However, the proposed approach only abstractly defines those scenario types. This decision was made due to the specific demands of each simulation software concerning the scenario definition. If more standardization for the design and exchange of scenarios is achieved, an improved and standardized concept for delineating the different types of scenarios will also be beneficial and easier to establish. With the layer model, a foundation is laid, based on the definition of entities and their properties.
Another critical aspect of the approach is the identification of factors potentially having an impact on the ATO performance. Their extraction from the literature leads to an unequal grade of detail. What is meant by this is that one factor can have a variety of impacts on the performance of ATO systems due to the different effects it induces. Influences of several causative constituents of railway operation were partially combined, or the causing entity itself was included as a factor. This was done to achieve the conciseness of the overview but resulted in redundancies. The list can certainly be extended and umbrella terms might be divided into more specific impacts on ATO.
During the identification of the factors having a potential impact on the ATO algorithm performance it was ascertained, that the layer model is applicable for defining the simulation scenario, the entities within those scenarios, and also including the definition of potential influencing factors of these entities. In contrast to that, it does not provide a possibility to allocate factors directly related to the train under test, the so-called
ego train. More precisely, taking the impact of a reduced traction or braking power of the train probably not known to the ATO algorithm as an example can lead to unexpected behaviour and provoke an unsafe situation. This factor needs to be evaluated as well and therefore is appending the list of influencing factors (
Table A1) by a new row. This row is not assigned to a layer of the layer model and thus resembles an additional category called
Ego Train.
The approach focused on providing universal measures for evaluating and comparing ATO algorithms. However, it showed to be interesting to analyze the information about the calculations of the algorithm which are directly provided by the algorithm itself within a log file.
More importantly, the proposed algorithm evaluation strategy is useful to test the performance of ATO algorithms, especially due to the structured scenario design framework, allowing an organized investigation of the potential performance influencing factors. Furthermore, the KPIs seemed to be selected appropriately for the small case study conducted. To fully determine if this is the case when aiming for the comprehensive evaluation of an ATO algorithm and the comparison of multiple algorithms, additional explorations are crucial.
6. Future Research Perspectives
In this work, an approach was presented which emphasizes the importance of testing ATO algorithms for their performance behaviour in different challenging situations, while having shown the applicability of the approach, an improvement of the approach, as well as the other components of the framework based on the shortcomings described in the previous section, is desirable. This also includes the detailed testing of the different influencing factors to evaluate their actual impact on the performance.
The more specific definition of standards can be seen as a further opportunity for improvement. Here, the definition of a uniform scenario format, for example, based on the layer model, or the consideration of already existing formats is possible.
In general, the question remains open which level of performance can and needs to be expected under varying operating conditions. In this context, the KPIs can provide an important indication of the values to be achieved, but the definition of these criteria for performance only seems to make sense with simultaneous consideration of the real routes existing in the network and their characteristics.
For the indicators of comfort, stopping accuracy, and possibly punctuality, generally applicable values can be defined and have been already partially provided in the scope of this approach. The evaluation of the energy demand, capacity and the individual indicators of the safety KPI is route-dependent and will have to be substantiated by empirical values and feasible targets.
Lastly, if the specifications for ATO over ETCS are finally realized a further analysis of the interfaces defined within those specifications can be worthwhile. These interfaces have to certainly include messages, status updates and variables which need to be sent out by the ATO onboard or trackside unit. Because of the therefore necessary standardization, useful data might be available generally. This data could allow more extensive ATO performance analyses but is limited to systems under the ATO over ETCS concept.


