Abstract
Transcranial magnetic stimulation (TMS) is a well-established technique for the diagnosis and treatment of neuropsychiatric diseases. The numerical calculation of the induced electric field (EF) distribution in the brain increases the efficacy of stimulation and improves clinical outcomes. However, unique anatomical features, which distinguish each subject, suggest that personalized models should be preferentially used. The objective of the present study was to assess how anatomy affects the EF distribution and to determine to what extent personalized models are useful for clinical studies. The head models of nineteen healthy volunteers were automatically segmented. Two versions of each head model, a homogeneous and a five-tissue anatomical, were stimulated by the model of a Hesed coil (H-coil), employing magnetic quasi-static simulations. The H-coil was placed at two standard stimulating positions per model, over the frontal and central areas. The results show small, but indisputable, variations in the EFs for the homogeneous and anatomical models. The interquartile ranges in the anatomical versions were higher compared to the homogeneous ones, indicating that individual anatomical features may affect the prediction of stimulation volumes. It is concluded that personalized models provide complementary information and should be preferably employed in the context of diagnostic and therapeutic TMS studies.
1. Introduction
1.1. TMS Principles, Parameters and Applications
Transcranial magnetic stimulation (TMS) is a non-invasive brain stimulation (NIBS) technique that is widely used as a research, diagnostic, and therapeutic tool in health and disease [1]. As first demonstrated by Barker and Jalinous [2], almost 40 years ago, TMS stimulates the human brain by inducing intracranial eddy currents, based on the phenomenon of electromagnetic induction [3]. Since then, the technique has evolved to a valuable brain mapping tool [4,5] as well as a useful therapeutic option in a wide range of neurological and psychiatric disorders [6], including depression [7], obsessive compulsive disorder (OCD) [8], addictions [9], dementia [10], epilepsy [11], Alzheimer’s and Parkinson’s diseases, and brain impairment caused by stroke or tumors [12].
TMS is painless and relatively easy to use in the clinical environment. In short, an electromagnetic coil, placed over the scalp and connected to a magnetic stimulator, generates a rapidly altering magnetic field, thereby inducing an electric field (EF) in brain tissue. The technique is applied either as a single pulse or as a train of multiple pulses (rTMS—repetitive transcranial magnetic stimulation) that, depending on the exact paradigm, can either stimulate or inhibit cortical neurons and modulate accordingly their excitability [12]. The brain’s response to TMS can be detected in various ways but principally through electromyographic (TMS-EMG) or electroencephalographic (TMS-EEG) recordings [13].
The efficacy of TMS interventions is based on multiple parameters that fall into three main categories, i.e., they are related to the coil, the stimulus, and the brain. The physical properties of the electromagnetic coil, i.e., its shape and dimensions [14], define the depth of stimulation and the volume of the stimulated area [3]. Generally, larger coils are used in order to cover more extensive targets [15], while smaller ones achieve higher focality [16]. The coil’s exact position over the scalp is particularly relevant for the outcome of stimulation [17], as the orientation of the coil relative to the underlying sulcus affects the induced EF distribution [18], with the vertical relative position being the optimal one, as it is reported that typical targets, such as the motor cortex, are most sensitive to vertically oriented electric fields. The stimulus characteristics, i.e., its magnitude, density, and duration, as well as the waveform of the magnetic pulse, also constitute critical parameters for the method’s efficiency [19], which is additionally affected by the geometry and electrical properties of the brain tissue [20]. However, due to the complexity of neurobiological phenomena and the diversity in human brain anatomy, the exact details of how TMS works remain vague [18]. One complementary approach that may provide valuable information about the mechanisms underlying TMS effects on the human brain is computational EF modeling [21,22]. Thus, it is increasingly used to enhance the method’s diagnostic potential and increase its therapeutic efficiency [23].
1.2. EF Modeling
The induced EF is computed by applying numerical approaches, such as the finite element method (FEM) or the boundary element method (BEM) [24,25] on either tetrahedral meshes or voxel grids [26], depending on the specifics of each study. As far as the head model anatomical complexity is concerned, the EF can be computed in anything in the range from homogenous spheres [27,28] to high-resolution, anatomically realistic head models [29]. Personalized models with a few tissues [30], typically consisting of white matter, grey matter, cerebrospinal fluid (CSF), skull, scalp, and occasionally eyes, have become a popular choice as they balance anatomical accuracy to computational cost.
1.3. Study Background and Objective
The variability of electric fields among subjects because of their unique anatomical features has been a matter of interest for researchers working with the modeling of NIBS. Laakso et al. [31] studied the impact of inter-subject variation in transcranial direct current stimulation (tDCS) of the motor cortex, showing that CSF thickness and age are significant factors influencing an individual’s EF distribution. Von Conta et al. [32] investigated the variability of electric fields induced by transcranial temporal interference stimulation (tTIS) in the hippocampus, motor area, and thalamus, and emphasized the need for individualized stimulation montages. Moreover, Lee et al. [33] showed how brain–scalp distance and CSF thickness influence the focality of a figure-of-eight coil and affect the intensity and spread of stimulation.
Acknowledging the need for EF modeling in TMS applications, the idea behind the present study is to further investigate the impact of individual anatomy in the induced EF distribution in the brain, using a Hesed coil designed for deep TMS (dTMS), a version of TMS that allows the stimulation of deeper and larger brain structures, and to evaluate the implementation of personalized treatment planning in a real life TMS study.
The anatomy of a patient may affect the EF distribution in two distinguishable ways, i.e., through anthropomorphic features of the head (e.g., its size and shape) and due to the tissue distribution inside the head. The contribution of these factors can be disentangled only for coils that are not intended for focused stimulation, but rather have an impact on larger volumes of tissues, hence the choice of the Hesed coil in this study.
2. Materials and Methods
2.1. Head Models
To explore how brain anatomy affects the induced EF distribution during TMS, nineteen healthy volunteers provided informed consent for the procedure, which was approved by an institutional review board and performed in accordance with the ethical standards set in the 1964 Declaration of Helsinki, and offered their anonymized medical data in order to be segmented as anatomical and homogeneous head models. The sample included twelve female (median age: 28, mean age: 29.8) and seven male adults (median age: 31, mean age: 33.3), with their ages ranging from 20 to 48 years (total median age: 30, total mean age: 31.1). Their T1-weighted (TR: 7.4, TE:3.4) magnetic resonance images (MRI) were automatically segmented [34] into three-dimensional anatomical head models by the headreco tool of the SimNIBS software package (SimNIBS Developers. SimNIBS 3.2.4). After the segmentation, all models, which consisted of scalp, bone, CSF, grey matter, white matter, and ventricles, were visually inspected and manually modified through the iSeg toolkit (ZMT Zurich MedTech & IT’IS foundation. iSeg, Zürich, Switzerland), when needed.
2.2. Coil Model and Positioning
To achieve deeper stimulation and avoid possible focality issues that might arise from orientation differences, the H7 electromagnetic coil, designed by BrainsWay (BrainsWay Ltd., Jerusalem, Israel) for dTMS applications, was selected for the present study. The H7 coil, which was recently cleared by the FDA for the treatment of obsessive-compulsive disorder following a large DBPC multicenter trial [8], consists of two symmetric sets of spirals and belongs to the family of Hesed coils (H-coils) [35]. These coils are specifically designed for dTMS [15], hence they induce electric fields capable of reaching targets located significantly below the brain surface [36]. The coil was placed at two standard stimulation positions on each head model, (i) above the prefrontal (PFC) cortex, and (ii) over the central sulcus, while the wing angle was manually adjusted to be conformal to the head (Figure 1).
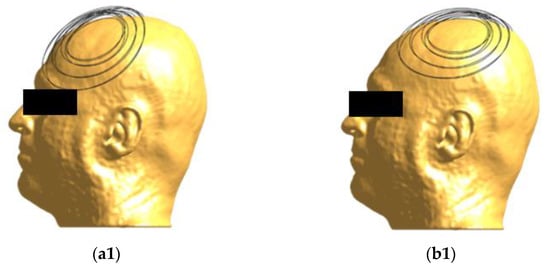
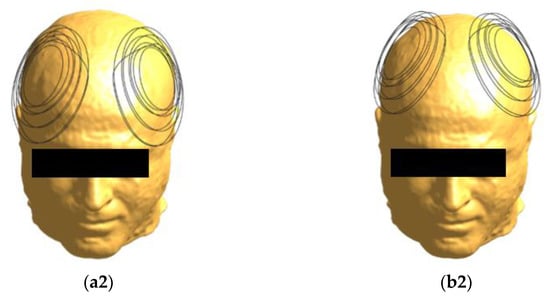
Figure 1.
Coil positioning on the head model. The H7 coil, seen from different angles, is placed at frontal (a1,a2) and central (b1,b2) positions.
2.3. Simulation Specifics
Two versions of each head model, a homogeneous and a standard five-tissue anatomical, were stimulated by the model of H7 coil, in the Sim4Life (S4L) environment (ZMT Zurich MedTech. Sim4Life), employing the platform’s magnetic quasi-static solver. For the anatomical version, the tissues were assigned standard electrical conductivity values, commonly used for TMS simulations, i.e., 0.126 S/m for white matter, 0.275 S/m for grey matter, 1.654 S/m for CSF and ventricles, 0.01 S/m for bone and 0.465 S/m for scalp [19]. For the homogeneous version, all compartments were assigned to the electrical conductivity of saline, which was assumed to be 1 S/m [37]. The current flowing in the coil was assumed to have an amplitude of 3.18 kA, corresponding to 54% of a maximal stimulator output (MSO), assuming a BrainsWay stimulator with maximal output of 1.7 kV (BrainsWay, Israel), and a frequency of 3.5 kHz, which belongs in the typical range of fundamental frequencies for pulses employed in TMS applications [16,25,38].
2.4. Post Processing
To investigate the differences of induced EFs due to anatomical variations, the simulation results were analyzed through custom scripts in MATLAB (The MathWorks, Inc., Natick, MA, USA, MATLAB R2019a), at a two-step post-process. As a first step, the brain distributions were visually inspected and the anatomical and homogeneous versions of the models were compared, in terms of averaged metrics. Then, the individual distributions were quantitively defined across models, in terms of stimulation intensity and spread, while their potential correlation with anatomical characteristics was also evaluated.
3. Results
3.1. Stimulation Metrics
Multiple metrics were calculated to compare the stimulation across the participants, the maximal (Emax) and median (Emedian) value of the EF and the distribution’s interquartile range (IQR). The 99.9th percentile of each brain distribution, including grey and white matter, was considered as Emax to avoid numerical artefacts, while all EF values higher than Emax were considered equal to the maximum.
Additionally, the total volume of voxels, where the EF was higher than 100 V/m, which is considered as the neuron excitation threshold [39], was defined as stimulated volume (Vst). The volume for which the EF had an amplitude higher than half of Emax was defined as the half-value volume (V1/2) and was calculated separately for white and grey matter, to better describe the spatial distribution of the EF in the brain.
3.2. Visualization
A simple visualization of the computed EF on the brain suffices to show the interindividual differences of the induced distributions, resulting from anatomical variations (Figure 2). Natural space coordinates were selected to highlight the morphology diversity that clinicians encounter during a TMS session. The distinctive characteristics of participants, such as the shape and size of their head, or even the head pose during the TMS session, have the potential to change the coil fitting and alter the stimulation’s outcome, influencing both the stimulated area and the magnitude of stimulation. This study focuses on parameters that can be measured and attempts to associate the stimulation characteristics with four of them, including age and total volumes of head, CSF (excluding the ventricles) and brain. Furthermore, homogeneous models are not affected by the electrical conductivity distribution, which is present only in anatomical models, carrying the information of tissue distribution. Therefore, the variation of the EF in homogeneous models reflects mainly the effects of head shape and size, whereas the variation of the EF in anatomical models incorporates the effect of individual tissue anatomy.
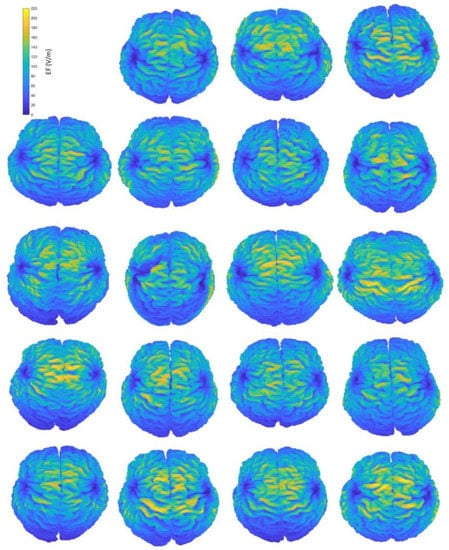
Figure 2.
Interindividual variability of the induced EF distributions visualized in subject brains, containing both grey and white matter, when the H-coil is placed at the central position. Head and brain anatomy affect the area and magnitude of stimulation. Brain coordinates are plotted on their natural space.
Figure 2 provides an indicative visual description of the variations in TMS-induced EFs for anatomical models and central coil positioning. Corresponding figures for homogeneous models and frontal coil positioning can be found in Appendix A. Complementary to EF visualization, Figure 3 and Figure 4 show the EF distributions in individual brains as violin plots and IQRs, providing a comparison across models and between their anatomical and homogeneous versions, for the two coil positions.
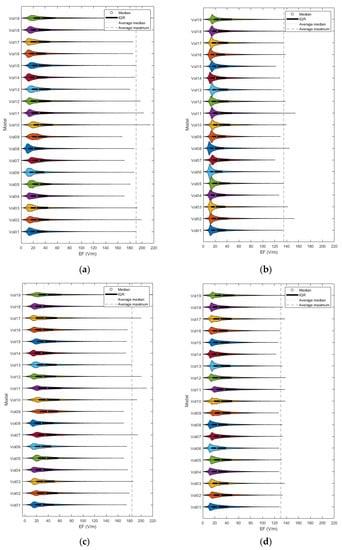
Figure 3.
Violin plots and IQRs of the EF distributions for frontal coil positioning on anatomical (a) and homogeneous (b) models, and central positioning on anatomical (c) and homogeneous (d) models.
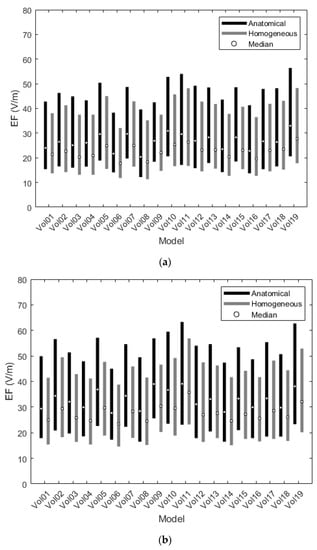
Figure 4.
Interquartile ranges of the EF distributions for the frontal (a) and central (b) coil positions.
As graphically expressed in Figure 3, the inter-subject distributions vary distinctly for both coil positions, regardless of the model’s composition. Even for the homogeneous versions, the individual morphology is enough to create differences in the induced EFs among subjects, a fact that verifies the necessity of implementing personalized head models in TMS applications.
Figure 4 depicts the differences of EF between anatomical and homogeneous models, focusing on the interquartile ranges of the corresponding EF distributions. Although IQRs seem to follow the same pattern for both versions, suggesting the contribution of unique physical characteristics, the quartiles are consistently higher for the anatomical models than for the homogeneous ones, indicating that anatomy, in terms of distinctive electrical conductivity tissues, may affect the prediction of stimulation volume. Comparison of the EF distributions between anatomical and homogeneous models, using the Wilcoxon matched-pairs test (selected after failure of the Kolmogorov–Smirnov normality test) for IQRs and quartiles, found statistically significant differences (p-value < 0.05) between the two groups for both coil positions.
3.3. Numeric Values of Metrics
Besides the qualitative analysis, results were also compared quantitively. Table 1 summarizes the Emax, Emedian, Vst and V1/2 metrics per model for the four simulated scenarios, as well as their mean and standard deviation (std) over the sample. As foreseen, after the visual comparison of the EF distributions, all three metrics showed higher values for the anatomical version of models than their corresponding homogeneous ones. Specifically, the EFs of anatomical models, which were stimulated by H7 on the frontal position, have maximal intensities with a mean of 190.5 ± 12.3 V/m, compared to 134.9 ± 8.9 V/m of their homogeneous equivalents, median values with a mean of 26.7 ± 3.2 V/m compared to 22.6 ± 2.7 V/m, and stimulated volumes of 48.1 + 10.7 cm3 compared to 24.8 ± 7.9 cm3. Similarly, the distributions of anatomical models, stimulated by H7 placed on the central position, show maximal and median with mean values of 183.9 ± 14.3 V/m and 32.9 ± 3.7 V/m, respectively, compared to 130.6 ± 5.5 V/m and 27.7 ± 3.1 V/m of the homogeneous ones, while the stimulated volumes correspond to 53.4 ± 11.6 cm3 for the former and 20.8 ± 6.6 cm3 for the latter. Contrarily to the stimulated volumes, the half-value volumes, in both cerebral tissues, were higher in the homogeneous models.

Table 1.
Statistics of stimulation metrics per investigated scenario. (F/A: frontal coil position on anatomical models, F/H: frontal coil position on homogeneous models, C/A: central coil position on anatomical models, C/H: central coil position on homogeneous models).
3.4. Correlation Tests
The selected metrics of stimulation were then tested for correlation with three anatomical parameters, i.e., the total volume of brain, CSF, and head, and the age of models. Most findings were not statistically significant for all scenarios (p-value > 0.05). However, the median and other quartile values of EF distribution presented high negative correlation to the brain and head volumes, while the stimulated volumes presented moderate negative correlation to age (Figure 5, Figure 6 and Figure 7).
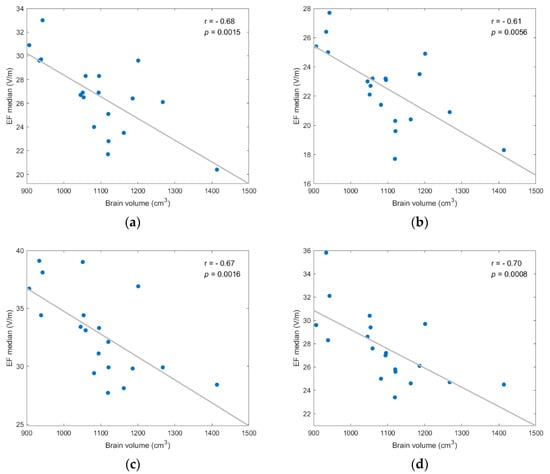
Figure 5.
EF median showed statistically significant negative correlation to brain volume for each investigated scenario; (a) frontal coil position on anatomical models; (b) frontal coil position on homogeneous models; (c) central coil position on anatomical models; (d) central coil position on homogeneous models.
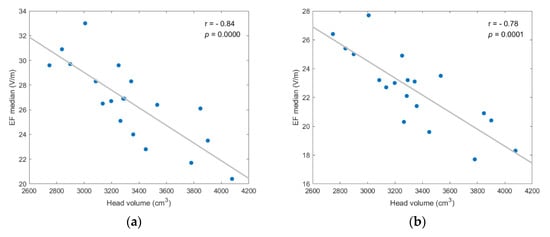
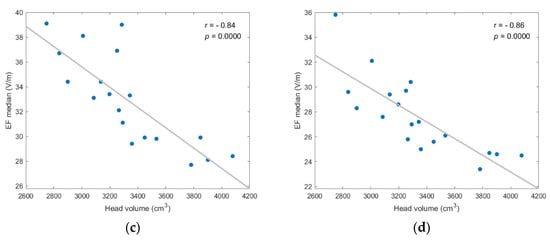
Figure 6.
EF median showed strong, and statistically significant negative, correlation to head volume for each investigated scenario; (a) frontal coil position on anatomical models; (b) frontal coil position on homogeneous models; (c) central coil position on anatomical models; (d) central coil position on homogeneous models.
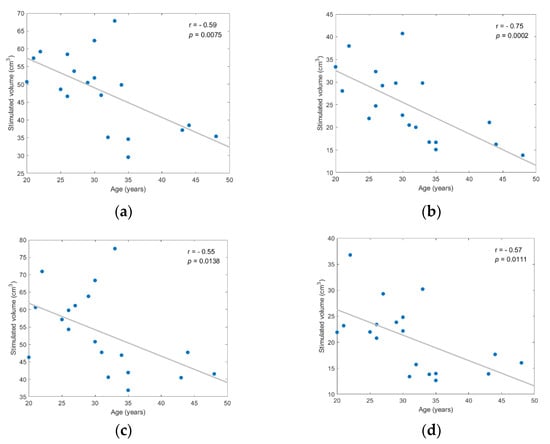
Figure 7.
Stimulated volume showed statistically significant negative correlation to age for each investigated scenario; (a) frontal coil position on anatomical models; (b) frontal coil position on homogeneous models; (c) central coil position on anatomical models; (d) central coil position on homogeneous models.
Figure 5 displays the negative correlation between the EF median and brain volume, suggesting that stronger EFs are induced in smaller brains. The correlation was statistically significant (p-value < 0.05) for anatomical and homogeneous model samples in both coil positions and the Spearman correlation coefficient (r) varied from −0.61 to −0.70 (degrees of freedom: 17).
As shown in Figure 6, the negative correlation between median value and head volume was even stronger, with r ≤ −0.78 and p-value ≤ 0.0001 for every scenario. Additionally, similar results for the EF quartiles (Q1, Q3) support the assumption that head and brain sizes are critical anatomical parameters for the efficacy of TMS, since higher field intensities are induced in smaller volumes. (Figures regarding the quartiles’ correlation analysis are included in Appendix A).
Figure 7 provides evidence that stimulated volume might be associated with age, with Spearman correlation coefficient values ranging from −0.55 to −0.75 and corresponding p-values < 0.02 (df = 17). However, despite that the correlation with age was statistically significant between the actual size of stimulated volume (in cm3), the normalized stimulated volume test with age resulted in lower correlation coefficients, ranging from −0.38 to −0.62, and less significant p-values ranging from 0.04 to 0.11. Normalized stimulated volumes were calculated as the ratio of stimulated volume over the total brain or head volume.
4. Discussion
4.1. Summary and Objective
Along with other NIBS techniques, TMS is an established and popular clinical tool for the diagnosis and treatment of various neuropsychiatric conditions [12,15]. However, the exact mechanism underlying magnetic stimulation of the human brain is still unknown [20,23]. The distribution of the EF induced by TMS is a parameter critically affecting the efficacy of the method [40]. Accordingly, EF modeling through numerical calculations is being increasingly used as a method complementary to the clinical application, primarily for the validation of clinical studies or the performance of in silico studies. The objective of the present study was to assess how brain anatomy affects the EF distribution in the brain and to determine to what extent personalized models may improve the outcomes of clinical TMS.
4.2. Method Description
Computational anatomical head models of nineteen adults and their homogeneous twins were created. The elimination of diverse tissue electrical conductivities can show how individual morphological characteristics, such as head shape and size, may affect the induced EF distribution. The models were stimulated by an H7 dTMS coil [8], which has an extensive stimulation volume. Thus, small orientation modifications of this coil are not expected to affect the stimulation outcome, as in the case of a figure-of-eight coil [18,33].
4.3. Results Synopsis and Interpretation
Due to the unique morphology of the human brain, the interindividual comparison of distributions is a challenging task. To overcome this challenge, the induced EFs were analyzed at multiple levels. At first, they were visualized over the individual brains, to identify the qualitative range of anatomical variability. Then the distributions were compared across subjects, in terms of stimulation metrics (Emax, Emedian, Vst, V1/2), and between groups (anatomical and homogeneous versions for the same coil position), in terms of IQRs and averaged metrics. It was found that, at a level of p < 0.05, the IQRs for the anatomical models are larger than the ones of the corresponding homogeneous models, indicating that the anatomical distribution of electrical conductivity (resulting from tissue distribution) enhances inter-subject variation of the induced EFs.
Colella et al. [41] used two anatomical models in their calculations and claimed a difference of 11% between the 99th percentiles of EF distributions, which they attributed to individual anatomy. In the current study, using the same approach for the 99.9th percentile, the variation ranges between 14% and 23%, depending on the location of the coil and the head model type. In another study [20], the inter-subject variation was estimated at 38% based on the maximum EF. Therefore, it is preferable for the impact of individual anatomy on the EF distribution to be determined by the statistical comparison of IQRs, which express the variability of the EF distribution in subjects, instead of a comparison of single points from the EF statistical distribution.
Finally, the stimulation metrics were tested for linear correlation with distinctive anatomical parameters, including brain, head and CSF volumes, and age. It should be noted that a parameter was considered as a predictor variable only in the case a statistically significant correlation (p < 0.05) was found with a simulation metric (response variable) for all investigated scenarios (two coil positions × two head models). The correlation analysis indicated a significant negative correlation between the distribution’s characteristics (median and quartiles) and brain/head volumes, suggesting that higher EFs are induced in smaller brains and heads. In addition, our results showed a moderate negative correlation between stimulated volume and age. However, the correlation of these two variables seems irrelevant to brain volume, since there was no equivalent correlation between normalized stimulated volume and age, implying a more complex mechanism for their association. Interestingly, no correlation was found for the maximal EF metric or the CSF volume parameter, raising the issue of whether the former should be defined as a different percentile of the distribution or whether the latter should be replaced by a CSF thickness parameter [33,42]. Both issues remain to be addressed in potential future studies.
4.4. Possible Clinical Applications
The conducted analysis indicates that the unique physical characteristics and the individual anatomy of a model undeniably differentiates the induced EF distribution among subjects. To highlight those differences, two high-resolution models of the well-established virtual population (ViP) family [29,43], were used for comparison: Duke, a 35-year-old male, and Ella, a 26-year-old female. When placed at the frontal position, the H7 coil stimulated 12.0% of Duke’s frontal lobe, compared to 9.4% of a male subject with similar age and weight (Vol06), and 15.9% of a younger male subject (Vol18). At the same stimulation position for female models, the volume, where EF had an amplitude higher than 100 V/m, was 7.2% of Ella’s frontal lobe, compared to 14.7% for subject Vol05, a model of similar age and weight, and 20.3% for an older model (Vol19). A detailed analysis of regional stimulation volume parameters on the frontal lobe of anatomical and homogeneous models can be found in Appendix B. It is clear from the above that specific anatomical geometries, even widely used in the literature computational models, can only provide rough information about a clinical TMS application. It is preferable to engage personalized computational models, in order to correctly interpret biological responses and clinical outcomes.
5. Conclusions
Electric field distributions induced by TMS applications show small, but indisputable, variations across individual brains. FEM simulations on nineteen anatomical head models and their homogeneous duplicated ones, suggest a negative correlation among the distributions’ quartiles and the sizes of the brain and head, as well as between the stimulated volume and age. In addition, the comparison of EF distributions for the homogeneous and anatomical versions of the head models reveals that the maximum distributions of the latter were higher than for the former, indicating that anatomy may affect the prediction of stimulation volumes.
Author Contributions
Conceptualization, M.T., T.S., and V.K.K.; methodology, M.T., T.S., and V.K.K.; software, M.T.; validation, M.T. and T.S.; formal analysis, M.T. and T.S.; investigation, M.T.; resources, E.C., K.K., N.F., V.K.K.; data curation, M.T. and T.S.; writing—original draft preparation, M.T.; writing—review and editing, T.S. and V.K.K.; visualization, M.T.; supervision, T.S. and V.K.K.; project administration, T.S. and V.K.K.; funding acquisition, V.K.K. All authors have read and agreed to the published version of the manuscript.
Funding
This research was co-financed by Greece and the European Union (European Social Fund-ESF) through the Operational Programme ‘Human Resources Development, Education and Lifelong Learning 2014–2020′ in the context of the project ‘Mapping of the human primary motor cortex (M1) with navigated Transcranial Magnetic Stimulation (navigated TMS, n TMS): method optimization with advanced neurophysiological and computational techniques’ (MIS 5047847).
Institutional Review Board Statement
The study was conducted in accordance with the Declaration of Helsinki, and approved by the National Ethics Committee of the Ministry of Health, Hellenic Republic (protocol code: CIV-19-10-029964 and date of approval: 14 October 2019 (118371)).
Informed Consent Statement
Informed consent was obtained from all subjects involved in the study.
Data Availability Statement
No publicly archived datasets are available.
Conflicts of Interest
The authors declare no conflict of interest.
Appendix A
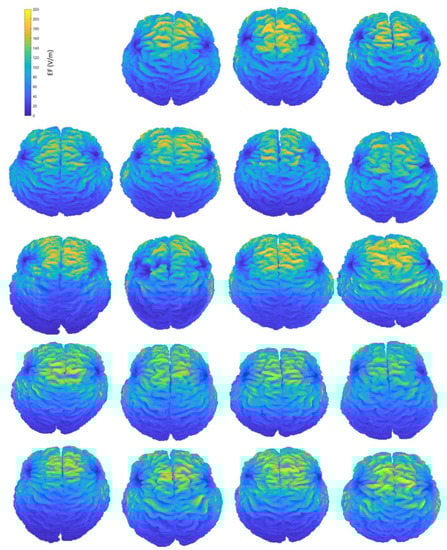
Figure A1.
Interindividual variability of the induced EF distributions visualized on subjects’ anatomical brains, containing both grey and white matter, when the coil is placed at frontal position.
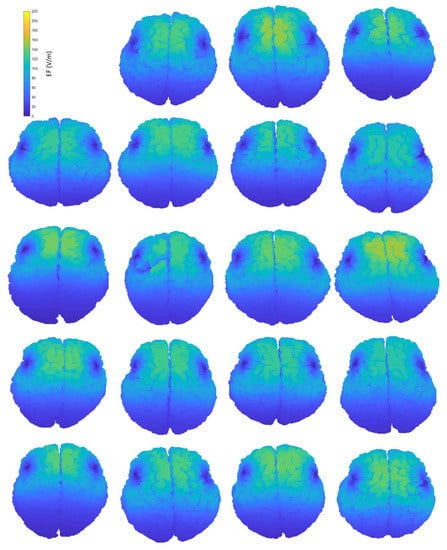
Figure A2.
Interindividual variability of the induced EF distributions visualized on subjects’ homogeneous brains, containing both grey and white matter, when the coil is placed at frontal position.
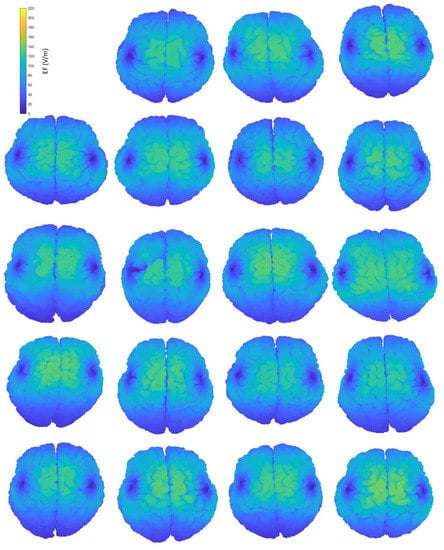
Figure A3.
Interindividual variability of the induced EF distributions visualized on subjects’ homogeneous brains, containing both grey and white matter, when the coil is placed at central position.
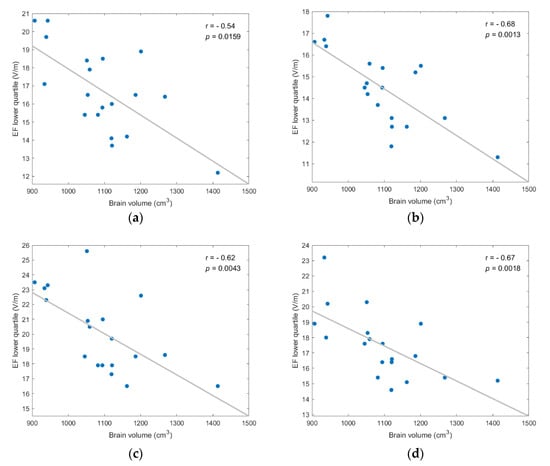
Figure A4.
EF lower quartile showed strong, and statistically significant negative, correlation to brain volume for every coil position/model version scenario; (a) frontal coil position on anatomical models; (b) frontal coil position on homogeneous models; (c) central coil position on anatomical models; (d) central coil position on homogeneous models.
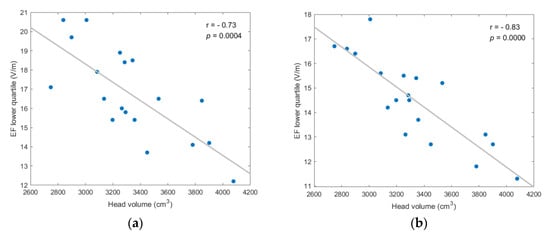
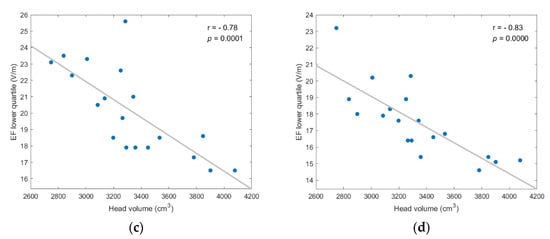
Figure A5.
EF lower quartile showed strong, and statistically significant negative, correlation to head volume for every coil position/model version scenario; (a) frontal coil position on anatomical models; (b) frontal coil position on homogeneous models; (c) central coil position on anatomical models; (d) central coil position on homogeneous models.
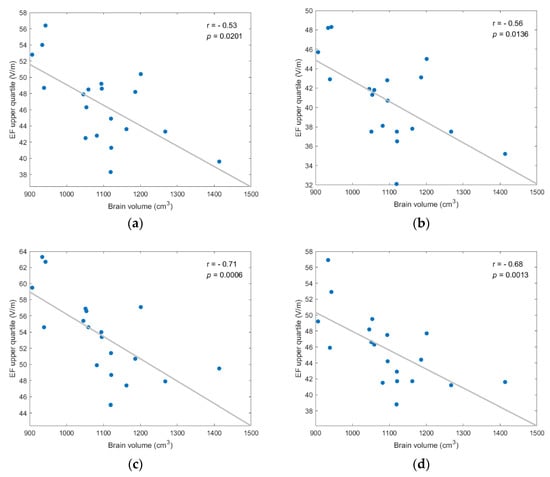
Figure A6.
EF upper quartile showed strong, and statistically significant negative, correlation to brain volume for every coil position/model version scenario; (a) frontal coil position on anatomical models; (b) frontal coil position on homogeneous models; (c) central coil position on anatomical models; (d) central coil position on homogeneous models.
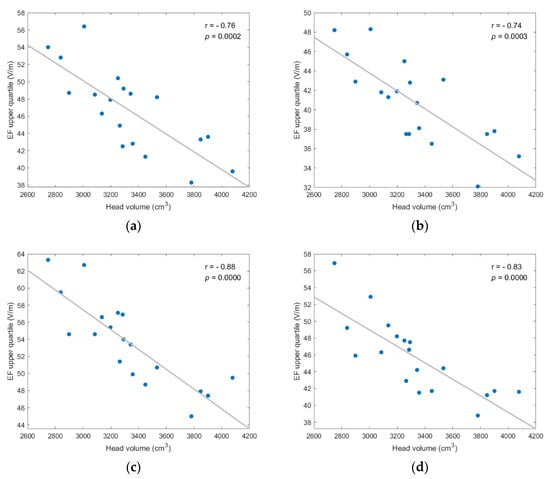
Figure A7.
EF upper quartile showed strong, and statistically significant negative, correlation to head volume for every coil position/model version scenario; (a) frontal coil position on anatomical models; (b) frontal coil position on homogeneous models; (c) central coil position on anatomical models; (d) central coil position on homogeneous models.
Appendix B
Table A1.
Stimulation metrics (Emax, Emedian, and Vst) on the frontal lobe and model parameters (frontal lobe volume, age, mass) of the anatomical male models and the Duke ViP model.
Table A1.
Stimulation metrics (Emax, Emedian, and Vst) on the frontal lobe and model parameters (frontal lobe volume, age, mass) of the anatomical male models and the Duke ViP model.
| Model | Emax (V/m) | Emedian (V/m) | Vst (cm3) | Vfrontal (cm3) | Age (years) | Mass (kg) |
|---|---|---|---|---|---|---|
| Vol01 | 191.5 | 52.1 | 35.2 | 287.7 | 43 | 80 |
| Vol04 | 171.1 | 44.1 | 32.2 | 345.9 | 44 | 85 |
| Vol06 | 181.3 | 43.9 | 27.7 | 294.6 | 35 | 78 |
| Vol08 | 187.2 | 47.3 | 47.6 | 423.1 | 20 | 88 |
| Vol14 | 192.1 | 46.0 | 37.2 | 333.6 | 31 | 100 |
| Vol17 | 193.2 | 47.8 | 40.4 | 293.2 | 30 | 70 |
| Vol18 | 194.9 | 53.3 | 55.6 | 350.7 | 30 | 65 |
| Duke | 169.3 | 52.1 | 38.3 | 319.6 | 35 | 70.2 |
Table A2.
Stimulation metrics (Emax, Emedian, and Vst) on the frontal lobe and model parameters (frontal lobe volume, age, mass) of the anatomical female models and the Ella ViP model.
Table A2.
Stimulation metrics (Emax, Emedian, and Vst) on the frontal lobe and model parameters (frontal lobe volume, age, mass) of the anatomical female models and the Ella ViP model.
| Model | Emax (V/m) | Emedian (V/m) | Vst (cm3) | Vfrontal (cm3) | Age (years) | Mass (kg) |
|---|---|---|---|---|---|---|
| Vol02 | 200.9 | 50.3 | 46.5 | 306.4 | 29 | 53 |
| Vol03 | 192.5 | 46.4 | 43.9 | 339.8 | 25 | 70 |
| Vol05 | 187.0 | 56.1 | 49.8 | 339.6 | 26 | 60 |
| Vol07 | 171.0 | 50.0 | 29.6 | 269.3 | 48 | 75 |
| Vol09 | 168.4 | 49.9 | 31.9 | 294.0 | 35 | 90 |
| Vol10 | 211.6 | 59.4 | 45.0 | 244.6 | 21 | 55 |
| Vol11 | 202.0 | 56.3 | 45.9 | 270.7 | 22 | 55 |
| Vol12 | 199.9 | 50.3 | 46.5 | 318.9 | 27 | 60 |
| Vol13 | 189.1 | 50.4 | 40.8 | 296.7 | 26 | 50 |
| Vol15 | 192.2 | 49.2 | 36.6 | 283.3 | 34 | 55 |
| Vol16 | 181.4 | 46.6 | 32.7 | 335.1 | 32 | 65 |
| Vol19 | 212.0 | 58.6 | 48.6 | 239.5 | 33 | 50 |
| Ella | 175.4 | 46.9 | 23.7 | 330.9 | 26 | 57.3 |
Table A3.
Stimulation metrics (Emax, Emedian, and Vst) on the frontal lobe and model parameters (frontal lobe volume, age, mass) of the homogeneous male models and the homogeneous version of the Duke ViP model.
Table A3.
Stimulation metrics (Emax, Emedian, and Vst) on the frontal lobe and model parameters (frontal lobe volume, age, mass) of the homogeneous male models and the homogeneous version of the Duke ViP model.
| Model | Emax (V/m) | Emedian (V/m) | Vst (cm3) | Vfrontal (cm3) | Age (years) | Mass (kg) |
|---|---|---|---|---|---|---|
| Vol01 | 132.5 | 46.3 | 21.1 | 287.7 | 43 | 80 |
| Vol04 | 125.6 | 41.9 | 16.2 | 345.9 | 44 | 85 |
| Vol06 | 126.0 | 42.9 | 15.1 | 294.6 | 35 | 78 |
| Vol08 | 143.6 | 46.0 | 33.4 | 423.1 | 20 | 88 |
| Vol14 | 128.7 | 42.9 | 20.4 | 333.6 | 31 | 100 |
| Vol17 | 134.9 | 45.7 | 22.7 | 293.2 | 30 | 70 |
| Vol18 | 140.8 | 50.8 | 40.7 | 350.7 | 30 | 65 |
| Duke | 122.6 | 49.8 | 22.5 | 319.6 | 35 | 70.2 |
Table A4.
Stimulation metrics (Emax, Emedian, and Vst) on the frontal lobe and model parameters (frontal lobe volume, age, mass) of the homogeneous female models and the homogeneous version of the Ella ViP model.
Table A4.
Stimulation metrics (Emax, Emedian, and Vst) on the frontal lobe and model parameters (frontal lobe volume, age, mass) of the homogeneous female models and the homogeneous version of the Ella ViP model.
| Model | Emax (V/m) | Emedian (V/m) | Vst (cm3) | Vfrontal (cm3) | Age (years) | Mass (kg) |
|---|---|---|---|---|---|---|
| Vol02 | 150.6 | 47.0 | 29.7 | 306.4 | 29 | 53 |
| Vol03 | 138.0 | 45.3 | 22.0 | 339.8 | 25 | 70 |
| Vol05 | 134.8 | 55.3 | 32.3 | 339.6 | 26 | 60 |
| Vol07 | 118.6 | 46.9 | 13.8 | 269.3 | 48 | 75 |
| Vol09 | 130.0 | 43.8 | 16.7 | 294.0 | 35 | 90 |
| Vol10 | 140.5 | 52.8 | 28.0 | 244.6 | 21 | 55 |
| Vol11 | 152.6 | 55.5 | 37.4 | 270.7 | 22 | 55 |
| Vol12 | 136.8 | 47.6 | 29.2 | 318.9 | 27 | 60 |
| Vol13 | 133.3 | 48.9 | 24.7 | 296.7 | 26 | 50 |
| Vol15 | 120.8 | 48.1 | 16.7 | 283.3 | 34 | 55 |
| Vol16 | 135.7 | 45.6 | 20.0 | 335.1 | 32 | 65 |
| Vol19 | 139.1 | 57.5 | 28.0 | 239.5 | 33 | 50 |
| Ella | 142.5 | 50.9 | 31.0 | 330.9 | 26 | 57.3 |
References
- Miniussi, C.; Ruzzoli, M. Chapter 56—Transcranial stimulation and cognition. In Handbook of Clinical Neurology; Lozano, A.M., Hallett, M., Eds.; Elsevier: Amsterdam, The Netherlands, 2013; Volume 116, pp. 739–750. [Google Scholar] [CrossRef]
- Barker, A.T.; Jalinous, R.; Freeston, I.L. Non-Invasive Magnetic Stimulation of Human Motor Cortex. Lancet 1985, 325, 1106–1107. [Google Scholar] [CrossRef]
- Jalinous, R. Technical and practical aspects of magnetic nerve stimulation. J. Clin. Neurophysiol. Publ. Am. Electroencephalogr. Soc. 1991, 8, 10–25. [Google Scholar] [CrossRef]
- Hallett, M. Transcranial Magnetic Stimulation: A Primer. Neuron 2007, 55, 187–199. [Google Scholar] [CrossRef] [Green Version]
- Sollmann, N.; Krieg, S.; Säisänen, L.; Julkunen, P. Mapping of Motor Function with Neuronavigated Transcranial Magnetic Stimulation: A Review on Clinical Application in Brain Tumors and Methods for Ensuring Feasible Accuracy. Brain Sci. 2021, 11, 897. [Google Scholar] [CrossRef]
- Lefaucheur, J.-P.; Aleman, A.; Baeken, C.; Benninger, D.H.; Brunelin, J.; Di Lazzaro, V.; Filipović, S.R.; Grefkes, C.; Hasan, A.; Hummel, F.C.; et al. Evidence-based guidelines on the therapeutic use of repetitive transcranial magnetic stimulation (rTMS): An update (2014–2018). Clin. Neurophysiol. 2020, 131, 474–528. [Google Scholar] [CrossRef]
- Chen, R.; Classen, J.; Gerloff, C.; Celnik, P.; Wassermann, E.M.; Hallett, M.; Cohen, L.G. Depression of motor cortex excitability by low-frequency transcranial magnetic stimulation. Neurology 1997, 48, 1398. [Google Scholar] [CrossRef]
- Carmi, L.; Tendler, A.; Bystritsky, A.; Hollander, E.; Blumberger, D.M.; Daskalakis, J.; Ward, H.; Lapidus, K.; Goodman, W.; Casuto, L.; et al. Efficacy and Safety of Deep Transcranial Magnetic Stimulation for Obsessive-Compulsive Disorder: A Prospective Multicenter Randomized Double-Blind Placebo-Controlled Trial. Am. J. Psychiatry 2019, 176, 931–938. [Google Scholar] [CrossRef]
- Fiocchi, S.; Chiaramello, E.; Luzi, L.; Ferrulli, A.; Bonato, M.; Roth, Y.; Zangen, A.; Ravazzani, P.; Parazzini, M. Deep Transcranial Magnetic Stimulation for the Addiction Treatment: Electric Field Distribution Modeling. IEEE J. Electromagn. RF Microw. Med. Biol. 2018, 2, 242–248. [Google Scholar] [CrossRef]
- Ahmed, M.A.; Darwish, E.S.; Khedr, E.M.; Elserogy, Y.M.; Ali, A.M. Effects of low versus high frequencies of repetitive transcranial magnetic stimulation on cognitive function and cortical excitability in Alzheimer’s dementia. J. Neurol. 2012, 259, 83–92. [Google Scholar] [CrossRef]
- Kimiskidis, V.K.; Valentin, A.; Kälviäinen, R. Transcranial Magnetic Stimulation for the Diagnosis and Treatment of Epilepsy. Curr. Opin. Neurol. 2014, 27, 236–241. Available online: https://journals.lww.com/co-neurology/Fulltext/2014/04000/Transcranial_magnetic_stimulation_for_the.15.aspx (accessed on 1 February 2022). [CrossRef]
- Rossi, S.; Hallett, M.; Rossini, P.M.; Pascual-Leone, A. Safety, ethical considerations, and application guidelines for the use of transcranial magnetic stimulation in clinical practice and research. Clin. Neurophysiol. 2009, 120, 2008–2039. [Google Scholar] [CrossRef] [Green Version]
- Ruohonen, J.; Karhu, J. Navigated transcranial magnetic stimulation. Neurophysiol. Clin./Clin. Neurophysiol. 2010, 40, 7–17. [Google Scholar] [CrossRef]
- Deng, Z.-D.; Lisanby, S.H.; Peterchev, A.V. Coil design considerations for deep transcranial magnetic stimulation. Clin. Neurophysiol. 2014, 125, 1202–1212. [Google Scholar] [CrossRef] [Green Version]
- Tendler, A.; Ygael, N.B.; Roth, Y.; Zangen, A. Deep transcranial magnetic stimulation (dTMS)—Beyond depression. Expert Rev. Med. Devices 2016, 13, 987–1000. [Google Scholar] [CrossRef]
- Guadagnin, V.; Parazzini, M.; Fiocchi, S.; Liorni, I.; Ravazzani, P. Deep Transcranial Magnetic Stimulation: Modeling of Different Coil Configurations. IEEE Trans. Biomed. Eng. 2016, 63, 1543–1550. [Google Scholar] [CrossRef]
- Thielscher, A.; Opitz, A.; Windhoff, M. Impact of the gyral geometry on the electric field induced by transcranial magnetic stimulation. NeuroImage 2011, 54, 234–243. [Google Scholar] [CrossRef]
- Laakso, I.; Hirata, A.; Ugawa, Y. Effects of coil orientation on the electric field induced by TMS over the hand motor area. Phys. Med. Biol. 2013, 59, 203–218. [Google Scholar] [CrossRef]
- Wagner, T.A.; Zahn, M.; Grodzinsky, A.J.; Pascual-Leone, A. Three-dimensional head model Simulation of transcranial magnetic stimulation. IEEE Trans. Biomed. Eng. 2004, 51, 1586–1598. [Google Scholar] [CrossRef]
- Laakso, I.; Murakami, T.; Hirata, A.; Ugawa, Y. Where and what TMS activates: Experiments and modeling. Brain Stimul. 2018, 11, 166–174. [Google Scholar] [CrossRef]
- Thielscher, A.; Antunes, A.; Saturnino, G.B. Field modeling for transcranial magnetic stimulation: A useful tool to understand the physiological effects of TMS? In Proceedings of the 2015 37th Annual International Conference of the IEEE Engineering in Medicine and Biology Society (EMBC), Milan, Italy, 25–29 August 2015; pp. 222–225. [Google Scholar] [CrossRef]
- Soldati, M.; Mikkonen, M.; Laakso, I.; Murakami, T.; Ugawa, Y.; Hirata, A. A multi-scale computational approach based on TMS experiments for the assessment of electro-stimulation thresholds of the brain at intermediate frequencies. Phys. Med. Biol. 2018, 63, 225006. [Google Scholar] [CrossRef]
- Bungert, A.; Antunes, A.; Espenhahn, S.; Thielscher, A. Where does TMS Stimulate the Motor Cortex? Combining Electrophysiological Measurements and Realistic Field Estimates to Reveal the Affected Cortex Position. Cereb. Cortex 2017, 27, 5083–5094. [Google Scholar] [CrossRef] [PubMed] [Green Version]
- Gomez, L.J.; Dannhauer, M.; Koponen, L.M.; Peterchev, A.V. Conditions for numerically accurate TMS electric field simulation. Brain Stimul. Basic Transl. Clin. Res. Neuromodulation 2020, 13, 157–166. [Google Scholar] [CrossRef] [PubMed] [Green Version]
- Nummenmaa, A.; Stenroos, M.; Ilmoniemi, R.J.; Okada, Y.C.; Hämäläinen, M.S.; Raij, T. Comparison of spherical and realistically shaped boundary element head models for transcranial magnetic stimulation navigation. Clin. Neurophysiol. 2013, 124, 1995–2007. [Google Scholar] [CrossRef] [PubMed] [Green Version]
- Soldati, M.; Laakso, I. Computational errors of the induced electric field in voxelized and tetrahedral anatomical head models exposed to spatially uniform and localized magnetic fields. Phys. Med. Biol. 2020, 65, 015001. [Google Scholar] [CrossRef] [PubMed]
- Deng, Z.-D.; Lisanby, S.H.; Peterchev, A.V. Electric field depth–focality tradeoff in transcranial magnetic stimulation: Simulation comparison of 50 coil designs. Brain Stimul. 2013, 6, 1–13. [Google Scholar] [CrossRef] [PubMed] [Green Version]
- Thielscher, A.; Kammer, T. Linking Physics with Physiology in TMS: A Sphere Field Model to Determine the Cortical Stimulation Site in TMS. NeuroImage 2002, 17, 1117–1130. [Google Scholar] [CrossRef] [PubMed] [Green Version]
- Gosselin, M.-C.; Neufeld, E.; Moser, H.; Huber, E.; Farcito, S.; Gerber, L.; Jedensjö, M.; Hilber, I.; Di Gennaro, F.; Lloyd, B.; et al. Development of a new generation of high-resolution anatomical models for medical device evaluation: The Virtual Population 3.0. Phys. Med. Biol. 2014, 59, 5287–5303. [Google Scholar] [CrossRef]
- Windhoff, M.; Opitz, A.; Thielscher, A. Electric field calculations in brain stimulation based on finite elements: An optimized processing pipeline for the generation and usage of accurate individual head models. Hum. Brain Mapp. 2013, 34, 923–935. [Google Scholar] [CrossRef]
- Laakso, I.; Tanaka, S.; Koyama, S.; de Santis, V.; Hirata, A. Inter-subject Variability in Electric Fields of Motor Cortical tDCS. Brain Stimul. 2015, 8, 906–913. [Google Scholar] [CrossRef]
- von Conta, J.; Kasten, F.H.; Ćurčić-Blake, B.; Aleman, A.; Thielscher, A.; Herrmann, C.S. Interindividual variability of electric fields during transcranial temporal interference stimulation (tTIS). Sci. Rep. 2021, 11, 20357. [Google Scholar] [CrossRef]
- Lee, E.G.; Rastogi, P.; Hadimani, R.L.; Jiles, D.C.; Camprodon, J.A. Impact of non-brain anatomy and coil orientation on inter- and intra-subject variability in TMS at midline. Clin. Neurophysiol. 2018, 129, 1873–1883. [Google Scholar] [CrossRef] [PubMed]
- Nielsen, J.D.; Madsen, K.H.; Puonti, O.; Siebner, H.R.; Bauer, C.; Madsen, C.G.; Saturnino, G.B.; Thielscher, A. Automatic skull segmentation from MR images for realistic volume conductor models of the head: Assessment of the state-of-the-art. NeuroImage 2018, 174, 587–598. [Google Scholar] [CrossRef] [PubMed] [Green Version]
- Roth, Y.; Pell, G.S.; Chistyakov, A.V.; Sinai, A.; Zangen, A.; Zaaroor, M. Motor cortex activation by H-coil and figure-8 coil at different depths. Combined motor threshold and electric field distribution study. Clin. Neurophysiol. 2014, 125, 336–343. [Google Scholar] [CrossRef] [PubMed]
- Zangen, A.; Roth, Y.; Voller, B.; Hallett, M. Transcranial magnetic stimulation of deep brain regions: Evidence for efficacy of the H-Coil. Clin. Neurophysiol. 2005, 116, 775–779. [Google Scholar] [CrossRef] [PubMed]
- Saturnino, G.B.; Antunes, A.; Thielscher, A. On the importance of electrode parameters for shaping electric field patterns generated by tDCS. NeuroImage 2015, 120, 25–35. [Google Scholar] [CrossRef] [PubMed]
- Fiocchi, S.; Longhi, M.; Ravazzani, P.; Roth, Y.; Zangen, A.; Parazzini, M. Modelling of the Electric Field Distribution in Deep Transcranial Magnetic Stimulation in the Adolescence, in the Adulthood, and in the Old Age. Comput. Math. Methods Med. 2016, 2016, 9039613. [Google Scholar] [CrossRef] [Green Version]
- Lu, M.; Ueno, S. Comparison of the induced fields using different coil configurations during deep transcranial magnetic stimulation. PLoS ONE 2017, 12, 0178422. [Google Scholar] [CrossRef]
- Opitz, A.; Zafar, N.; Bockermann, V.; Rohde, V.; Paulus, W. Validating computationally predicted TMS stimulation areas using direct electrical stimulation in patients with brain tumors near precentral regions. NeuroImage Clin. 2014, 4, 500–507. [Google Scholar] [CrossRef] [Green Version]
- Colella, M.; Paffi, A.; de Santis, V.; Apollonio, F.; Liberti, M. Effect of skin conductivity on the electric field induced by transcranial stimulation techniques in different head models. Phys. Med. Biol. 2021, 66, 035010. [Google Scholar] [CrossRef]
- Mosayebi-Samani, M.; Jamil, A.; Salvador, R.; Ruffini, G.; Haueisen, J.; Nitsche, M.A. The impact of individual electrical fields and anatomical factors on the neurophysiological outcomes of tDCS: A TMS-MEP and MRI study. Brain Stimul. 2021, 14, 316–326. [Google Scholar] [CrossRef]
- Christ, A.; Kainz, W.; Hahn, E.G.; Honegger, K.; Zefferer, M.; Neufeld, E.; Rascher, W.; Janka, R.; Bautz, W.; Chen, J.; et al. The Virtual Family—Development of surface-based anatomical models of two adults and two children for dosimetric simulations. Phys. Med. Biol. 2009, 55, N23–N38. [Google Scholar] [CrossRef] [PubMed]
Publisher’s Note: MDPI stays neutral with regard to jurisdictional claims in published maps and institutional affiliations. |
© 2022 by the authors. Licensee MDPI, Basel, Switzerland. This article is an open access article distributed under the terms and conditions of the Creative Commons Attribution (CC BY) license (https://creativecommons.org/licenses/by/4.0/).