Abstract
Though microplastic (MP/MiP) pollution of the environment is a popular research topic, a relatively limited number of studies are investigating its geomorphological context. However, site-specific hydrological and morphological parameters fundamentally affect the MP transport, deposition and mobilization. Therefore, we aimed to evaluate the geomorphological influencing factors on MP deposition in the fluvial sediments of the Tisza River (Central Europe). Between the two surveys (in 2019 and 2020), small flood waves rearranged the MP pollution, as in the sediments of the Tisza it decreased by 30% and in the tributaries by 48%. The previously highly polluted upstream and downstream sections became moderately polluted, but the contamination increased in the Middle Tisza, and the hot-spots were rearranged. The increasing longitudinal trend in the MP content exists if the minimum values of the hydrologically uniform sections are considered. The tributaries are important MP sources, as 80% of them had a higher (by 20%) MP content in their sediments than the Tisza had near the confluence, and they increased the MP content of the Tisza by 52% on average. The point-bars were the most polluted in-channel forms, while the side-bars and sediment sheets had less MP content, by 18 and 23%, respectively. The spatial trend of the MP content of these forms was not the same. Therefore, during the planning of sampling campaigns, it is very important to consider the geomorphological setting of a sampling site: we suggest sampling side-bars. No clear connection between the particle size of the sediments and their MP content was found.
1. Introduction
Simultaneously with the increasing amount of plastic used all over the world, more and more plastic waste is being released into the natural environment [1]. While larger plastics (e.g., macroplastics) spectacularly pollute the environment and degrade the aesthetic appearance of seas and riverbanks [2], microplastics (≤5 mm) are virtually invisible contaminants of the environment [3,4]. The rivers are important transport routes and sinks of the MP pollution, as Borrelle et al. [5] estimated that by 2016 approximately 19–23 million tonnes of plastic waste were released into the aquatic ecosystem worldwide.
Microplastics (MPs/MiPs) entering rivers can originate from two main sources: from inadequately or not-at-all-treated wastewater and from landfills, from where pollution (including plastics) is transported into rivers by the wind or surface run-off [6,7]. Further sources of the MPs could be agricultural areas, especially if they were treated by biosolids and dehydrated sewage sludge [8,9], industrial areas [10], roads (e.g., weathering of tires and road paints) [11,12], construction sites or tourism [4].
Most of the MPs that enter the rivers are secondary, so they were formed by the fragmentation of larger plastics [13], but some primary MPs that are consciously manufactured to this size, e.g., pellets in detergents [1], can also be released into rivers. In the vicinity of cultivated areas, the presence of fragments is common as the result of the weathering of green-house foils [14,15], while in the vicinity of settlements, mostly fibers pollute the rivers [16,17]. The reason for the appearance of fibers is that the current wastewater treatment technologies cannot completely filter out MPs [12,15,18]; therefore, river sediment samples collected at sewage outlets usually contain a high amount of MP particles [17,19]. In treated wastewater, the most common MP form is fiber that has originated from the washing of synthetic clothes, but MP pellets are also released from cleaning agents [6,15,18], and in river sediments, they might be abundant [13,20].
Various environmental factors can influence the transport of MP particles entering rivers. We hypothesized that MP particles are transported similarly to natural grains. Thus, MPs could be transported by the river in the water column as a suspended load or on the bottom of the channel as a bed load [17,21]. Therefore, their transport is probably affected by similar factors as the natural grains. The concentration of natural suspended sediment is regulated by the amount of the fine-grained sediment eroded from the catchment [22]. Usually, the high suspended-sediment discharge is connected to high water discharge or floods, though plots of concentration against discharge often show a very wide scatter of points [22,23]. There are ambiguous results on the connection between water discharge and suspended MPs. A negative correlation between the transported MPs and discharge was found by Barrows et al. [24] and Nel et al. [25]. They concluded that stormwater-generated increased run-off is not a source of MP pollution, but it diluted the MP pollution from other sources. A positive correlation between the MP pollution, water discharge and catchment size was found by He et al. [26] and Mani et al. [27], though they could not reveal a clear temporal pattern in the MP transport between seasons. Chen et al. [13] had similar results, as during low discharges, the MP concentration was just one-tenth of the concentration during high stages. There are uncertain statements on the spatial pattern of the MP transport as well. According to Rodrigues et al. [23], the MP concentration in the water decreased toward downstream; however, Barrows et al. [24] did not find a longitudinal downstream trend in the MP pollution in the water samples. On the contrary, Chen et al. [13] reported that in the upper section of the studied river, where the slope and flow velocity were higher, the MP concentration in the water was lower than in the downstream sections with lower flow velocity, so the MP concentration in the water increased proportionally downstream.
The deposition of the MP particles and its influencing factors are also not yet fully understood. The deposition of naturally transported suspended or bottom sediments is determined by flow velocity [17,22]. It is probably also applicable for MP particles because, in general, the higher the flow rate, the more particles are transported and the less that are accumulated [17,19]. However, the effect of the water discharge on the MP deposition is not clear, as Rodrigues et al. [23] found that within one year, during high stages, only slightly more MPs (100–629 item/dry kg) were deposited in the sediment than at low stages (118–514 item/dry kg). Hurley et al. [20] investigated the rearrangement of MPs in a fluvial system by a flood. While the MP content (300–4800 item/dry kg) of the sediments of even small streams was high before the studied flood, the flood rearranged the MP pollution. Therefore, the MP concentration decreased by one order of magnitude after the flood in almost half of the study sites. They estimated that 70% (approx. 43 ± 14 billion) of the previously accumulated MP particles were mobilized and transported into the sea. Hurley et al. [20] highlighted that a flood wave could significantly rearrange the hot-spots of the MP pollutions; in addition, during the rearrangement, the MP concentration in the water can vary.
The mobilization and deposition of natural sediments are influenced by the particle size, morphological properties of the grains and their density [22]. Microplastic particles tend to form aggregates with organic and inorganic particles, which increase their particle size, density and sedimentation rate, so the concentration of the MP particles in sediments may be higher than in the water [14]. In addition, the MP particles tend to accumulate in the sediment due to their hydrophobic properties [14,28]. Lower-density MPs have greater mobility, allowing them to travel greater distances [16], while higher-density plastic particles can only travel shorter distances [28].
Along longer sections, the flow velocity changes, which can also influence the amount of deposited MPs. In general, the MP pollution in sediments is distance-dominated and caused by flow velocity changes [13,26]. However, if the flow conditions change, for example, the temporal impoundment terminates, the deposited MP and the aggraded sediment could be mobilized. Thus, the MP concentration in the sediment might decrease, terminating the previous downstream trend in the MP pollution [13]. Dams and reservoirs can also slow down the transport of the MPs as they support the accumulation of the sediment and MP particles [15,29].
The effect of the geomorphological setting on the MP deposition was studied just at confluences and not in other geomorphological forms. In confluences, the flow conditions can be fundamentally influenced by the impoundment of the two joining rivers; thus, simultaneously with a dropping flow velocity, the amount of deposited MPs increases [29,30]. However, within a river system, various sedimentary bodies occur (e.g., various bars), formed under different flow conditions and built of various grain sizes. As the sediment samples for the MP analysis are collected from these very different forms, it is necessary to understand their geomorphological differences, as the comparison of the MP data from various forms without considering their sedimentary conditions might be misleading.
The fluvial system of the Tisza River (Central Europe) is highly polluted by MPs based on our previous results [29], as in 2019, the amount of the MPs in the freshly deposited sediment varied between 515 and 8067 item/dry kg. Our previous study highlighted the importance of local, geomorphological factors on MP aggradation; however, we did not have enough specimens to reveal the role of the grain size of the sampled material and the geomorphology of the sampled form on the MP deposition and its downstream variations. In addition, the 2019 data provided just a snapshot of the MP pollution, which could change spatially and temporally due to remobilization or extreme MP release. Therefore, we aimed to repeat the survey (in 2020) on the entire length of the river from Ukraine to Serbia and answer the newly raised research questions. Thus, our present aims are to evaluate the geomorphological influencing factors on the MP deposition by (1) determining the longitudinal changes in the MP pollution of freshly deposited sediments; (2) comparing the MP pollution of various in-channel forms; (3) analyzing the connection between the grain size of the sediment and its MP content; and (4) revealing the spatio-temporal changes in the MP deposition along the Tisza and its main tributaries between 2019 and 2020.
2. Materials and Methods
2.1. Study Area
The research was carried out along the Tisza River and its tributaries, from its source in Ukraine to the Danubian confluence in Serbia (length: 946 km; catchment area: 157 thousand km2 [31]). The river drains water from the eastern part of the Carpathian Basin, from Ukraine, Romania, Slovakia, Hungary and Serbia. The Tisza was divided into three reaches and five sections (S1–5 based on their hydrological and morphological characteristics) (Figure 1).
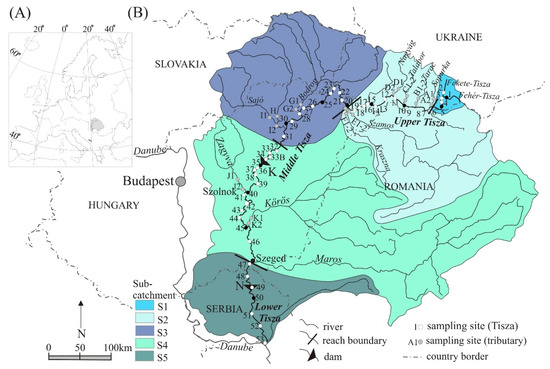
Figure 1.
The microplastic pollution of the Tisza River in Central Europe was studied (A). The Tisza and its catchment was divided into three sections and sub-catchments (B). Numbers indicate the sampling points in the Tisza, and capital letters indicate the sampling sites in tributaries. The Kisköre Dam (K) and Novi Becej Dam (N), which influence the flow conditions, are also indicated.
The Upper Tisza (946–688 r km) originates from two springs merging at Rahiv (Ukraine), and it eroded a steep-sided deep valley with a high slope (20–50 m/km). The rock-bedded valley gradually widens, and the slope of the channel decreases (5 m/km). In the slightly sinuous channel, side-bars were formed of blocks and gravel (d50 = 10–20 cm [31]). The Upper Tisza was divided into two sections. The sub-catchment of the upstream section of the Upper Tisza (S1.; sampling points No. 1–6) is located in Ukraine (Figure 1). It has the smallest area and population (Table 1). Although the sub-catchment represents only a small part (1.3%) of the entire catchment, it contributes significantly to the plastic pollution of the entire Tisza River [29].

Table 1.
Main characteristics of the sub-catchments of the Tisza River. Country codes: HU: Hungary, RO: Romania, SLO: Slovakia, SRB: Serbia, UA: Ukraine; (data source: [31]).
The downstream section of the Upper Tisza (S2.; No. 7–19) formed a wide valley with a gradually decreasing channel slope (from 110 to 13 cm/km). As the channel-bed material is loose gravel, the bank erosion is fast, and in the braided–anastomosing channel, islands and bars have formed of sand gravel [32]. As the slope and flow velocity decrease, the medium grain size (d50) of the bed load also decreases (from 50–100 to 2.5 mm [33]). The braided–anastomosing channel becomes meandering, as the suspended-sediment transport is 918 thousand t/y [31]. Along the downstream section of the Upper Tisza, several tributaries join the Tisza. The sampled tributaries (A: Shopurka, B: Tarac, C: Talabor and D: Nagyág rivers) represent the Ukrainian sub-catchment (Table 1).
In the entire sub-catchment of the Upper Tisza, the low rate of waste and wastewater management is a critical environmental issue, especially in the mountainous and hilly sub-catchments. Here, waste management and wastewater treatment practically do not exist, as it is not profitable for companies to collect communal waste from the small settlements [34]. Therefore, the communal waste is deposited in rivers or on their floodplains, and the wastewater is mainly drained directly to the river system. In the lowland Ukrainian sub-catchments, wastewater drainage systems are built in 68% of the large towns, in 58% of the small towns and only in 1.5% in rural areas [34]. If the wastewater treatment is considered, the situation is worse, as most treatment plants need reconstruction and further capacity building [34]. In the downstream section of the Upper Tisza (Hungary), the large-scale cross-border transport of macroplastic pollution has been a problem since the beginning of the 21st century. The amount of drifting debris is 20–60 tons during a month with a flood wave, and it is collected by the local hydrological institute (FETIVIZIG) at Vásárosnamény, Hungary [35]. Most of it is organic material (e.g., woody debris), but up to 300–500 bottles/minute could be drifted during floods [36]. The plastics drifting in the river and trapped along the shores are collected by a civil organization (PET Cup), so in 10 years, 600,000 plastic bottles and 56 tons of garbage were collected on the Tisza [37].
The Middle Tisza (688–177 r km) was also divided into two sections. In the upstream section of the Middle Tisza (S3; No. 20–31), the slope of the river drops to 3 cm/km. Thus, the bed-load transport drastically decreases (to 3.9 thousand m3/y, d50 = 0.3 mm) compared to the previous section [33], but the amount of suspended-sediment discharge (5 million m3/y) is five-fold [31]). In this section, several tributaries join the Tisza (E: Szamos, F: Kraszna, G: Bodrog, H: Hernád and I: Sajó rivers). Their sub-catchments are shared by Ukraine, Slovakia, Hungary and Romania. The sewage systems are well-developed in the large towns here, as ca. 70% of the households are connected to wastewater treatment plants; however, the sub-urban or rural areas have worse connections. In the Romanian sub-catchments, wastewater management is provided for only 50% of the total population [38].
In the downstream section of the Middle Tisza (S4; No. 32–46), the slope of the river decreases further to 1–3 cm/km. Thus, the transported bed load is already fine-grained sand (d50 = 0.12 mm [33]). The suspended sediment dominates (3.3 million m3/y [31]). The Kisköre Dam is located in this section, which acts as a barrier for the floating debris. Here, 1000–4000 m3 of solid litter is removed and selected annually, of which ca. 12% is communal waste [39]. Two large tributaries (J: Zagyva and K: Körös) join the Tisza along this section.
The total area of these sub-catchments of the Middle Tisza is the largest, shared by Romania and Hungary. Only 40% of its settlements have adequate sewerage systems [40]; though, in some counties (Sibiu and Csongrád-Csanád counties), it exceeds 90% [41]. The floating plastic waste on the Bodrog and Maros rivers is a serious problem, but without any solution (yet).
The Lower Tisza (177- 0 r km; S5; No. 47–53) has a very low slope (0–3 cm/km); however, it can drop to almost 0 cm/km during flood peaks when the Danube impounds the Tisza, or during low stages when the Novi Becej Dam impounds it. Therefore, the water velocity reaches 1.0 m/s only during the rising or falling limbs of floods. The bed-load transport is 9–11 thousand t/y [33], and its grain size is small (d50 = 0.13 mm). The section’s suspended sediment yield (12.9 million m3/y) is the highest of all sections. The catchment area of the Lower Tisza River is relatively small (Table 1), as no considerable tributary joins. In the Serbian part of the sub-catchment, only 25–30% of the population is connected to the sewage system [42].
The differences in hydrological characteristics of the three reaches are well-illustrated by their annual stage data (Figure 2). The Tisza is characterized by early spring and summer floods and long-lasting low-stage periods (from early summer to late winter). The floods in the Upper Tisza are usually 2–3 weeks ahead of the flood peak in the Middle Tisza, as the higher slope supports their fast propagation. However, the flood peaks in the Middle and Lower Tisza may coincide due to the slow slope of these sections and the impounding effect of the Danube. While the floods in the Upper Tisza last a few days, in the Middle and Lower Tisza reaches, they are prolonged and last for several weeks. In the Middle and Lower Tisza, the tributaries play a major role in the retention of the flood waves, as their floods often coincide with those of the Tisza, and they can impound each other. During low-stage periods, small flood waves can also occur. In the Lower Tisza, the low stages are elevated due to the impounding by the Novi Becej Dam in Serbia [31].
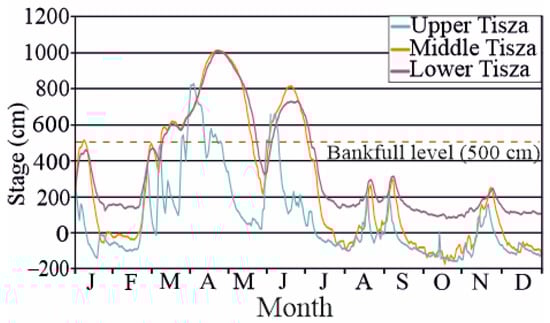
Figure 2.
Daily water stages measured in 2006 at the Upper, Middle and Lower Tisza.
2.2. Methods
2.2.1. Sample Collection
Sediment samples were taken at the end of August 2019 and 2020, respectively. Both sampling campaigns were performed during low-stage periods, preceded by summer floods reaching similar heights (Figure 3). Thus, the sampled sediments were deposited by the summer flood waves, and they represent just the pollution of a preceding flood wave.
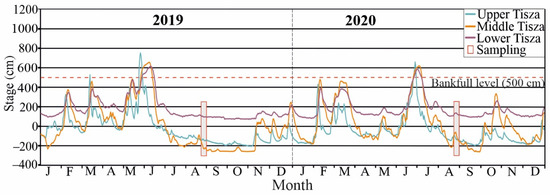
Figure 3.
The sampling campaigns were performed in August 2019 and 2020. The sampled sediments were deposited by an early summer flood wave.
Sediment samples were collected from in-channel sedimentary bodies of the Tisza and its main tributaries. We aimed to sample the Tisza evenly, at approx. every 30 km, and to have sampling above and below confluences so that the impact of a tributary could be assessed. During the 2019 sampling campaign, samples were collected at 59 sites on the Tisza and its tributaries [29]; however, in 2020, we condensed the sampling points (70 sites) along the Tisza and extended the measurements to the territory of Serbia. Unfortunately, the sampling at five sites in the Upper Tisza became impossible due to the Ukrainian–Romanian border’s increased control. Altogether 11 tributaries were sampled near their confluence and ca. 20 km upstream.
The most commonly sampled in-channel fluvial form was side-bar (Tisza: n = 27, tributaries: n = 14), which developed along sinuous sections. Point-bars along the convex banks of meanders are disappearing due to the human-induced incision of the river [43]. Therefore, they were sampled only at 10 sites along the Tisza and at 3 places in tributaries. Sediment sheets were sampled along the almost straight sections (Tisza: n = 12, tributary: n = 4).
During the first sampling in 2019, mainly coarse-grained samples were collected; however, at the 2020 sampling, both coarse- and fine-grained samples were collected. Based on our former field experiences, it was expected that during falling or low water stages only a thin sediment-layer is deposited. As we aimed to sample the freshly deposited sediments, only the upper (0–1 cm) layer was sampled. At a given site, sediments were collected at several points using an iron spatula, and the collected ca. 1 kg material was homogenized.
2.2.2. Laboratory Work
The samples were dried (65 °C) and sieved; thus, only the grain-size fraction smaller than 2 mm was processed during the separation. The separation procedure was performed on 50 g samples. If during the sieving, larger MPs (2–5 mm) or mesoplastics (≥5 mm) were found, they were counted and noted. Based on our previous experience, the silt and clay content of the samples makes it difficult to separate the MPs during the zinc chloride treatment; therefore, the fine-grained particles were removed by wet sieving (90 μm). Then, the inorganic sediment fraction was separated using 50 mL zinc chloride solution (1.8 g/cm3) following Atwood et al. [44] and Kiss et al. [29]. In the next step, the organic material was decomposed in 30 mL hydrogen peroxide (30%) for 24 h. The MP samples were finally washed into Petri dishes.
The identification and counting of MP particles were performed with an Ash Inspex II digital microscope at 60× magnification [45] following Hurley et al. [20]. An item was identified as MP if (1) it did not have a characteristic structure of organic matter; (2) it melted or shrank on contact with a hot needle [46]; and (3) if it retained its rigid shape when moved. In addition, clear microscopic characteristics related to anthropogenic origin were considered as well [20,45], such as special color (e.g., red, blue) and shape (i.e., sphere, irregular fragmented). Though Parker et al. [47] claimed that the hot needle test does not provide precise data in the case of some plastic types, no other method was available to check the accuracy of the identification. However, the identification of the MP was performed by a microscope expert (palynologist) to minimize the misidentification. During the identification, fibers (colored and colorless), fragments and spheres were separated. The MP content of the dry sediment was expressed in item/dry kg. As the study aimed to evaluate the sedimentary environment of MPs rather than to evaluate the accumulation of various plastic types, no FTIR and Raman spectroscopy was applied.
To compare the changes (%) between subsequent spatial and temporal data, the enrichment ratio (E) was calculated as
where the n1 is a preceding MP concentration data (e.g., of an upstream section, or 2019 data or of coarse-grained sediments), and n2 is subsequent MP data (e.g., of a downstream section, or 2020 data or of fine-grained sediments). The positive numbers refer to the enrichment of MP in the sediment, while negative values refer to declining MP content.
The grain size of the dried samples was determined by dry sieving and laser particle sizer FritschAnalysette 22 MicroTecPlus. The mean grain size (d50) was calculated for each sample.
2.2.3. Contamination Control
To avoid contamination, only metal and glass tools were used, and non-synthetic protective clothing was worn. The tools were rinsed three times with filtered water before use. The samples were covered during the separation to avoid contamination by settling airborne MP. Every 5th sample was a blind one to check the contamination during the laboratory work. Only microfibers were present in the blank samples, on average, 10 ± 4 item/sample. As the sediment samples contained 881 microfibers on average, the error is 1.1–1.5%. Therefore, the final results were not corrected by these values, following the suggestion of Miller et al. [48].
3. Results
3.1. Microplastic Content of the Fluvial Sediments in 2020
Over the entire length of the Tisza, in 2020, the MP content of the sediments ranged from 237 to 6707 item/dry kg (average: 1770 ± 1329 item/dry kg), while the sediments of the 11 sampled tributaries contained 6% more microplastic (range: 420–6383 item/dry kg; mean 1885 ± 1541 item/dry kg). Most of the MP particles (98%) were fibers, of which 66% were colored fibers, 32% were colorless and only 1–1.5% of the particles were fragments and spheres. No differences in particle types were found in the river system.
The amount of MP in the freshly deposited sediments of the Tisza showed a characteristic downstream trend from the source to the Danubian confluence (Figure 4 and Figure 5). In the upstream section of the Upper Tisza (S1), the freshly deposited alluvium contained 978 ± 817 item/dry kg on average. The lowest amount was measured at the confluence of the two source streams of the Tisza (No. 3: 260 item/dry kg), while the highest was detected further downstream (No. 4: 2620 item/dry kg; Figure 4 and Figure 5).
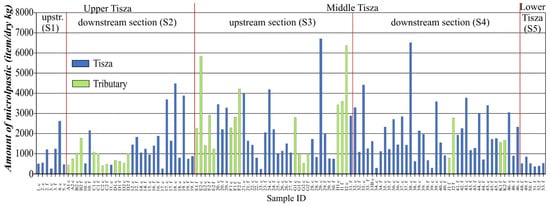
Figure 4.
Microplastic content (item/dry kg) of the sediments collected in 2020 along the various sections of the Tisza River (S1–S5) and its tributaries joining the given section. At each sampling site, fine-grained (f) and also coarse-grained (c) samples were collected.
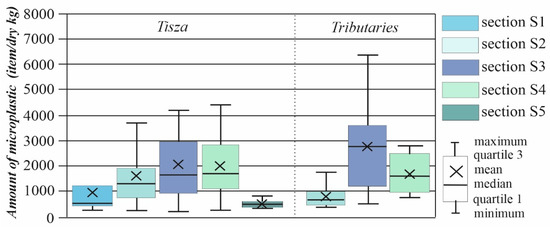
Figure 5.
Differences in microplastic content (item/dry kg) of the sediments collected along the various sections of the Tisza River (S1–S5) and its tributaries joining the given section.
In the downstream section of the Upper Tisza (S2), the average MP content of the sediments (1625 ± 1223 item/dry kg) increased by 66% (Figure 4 and Figure 5). While the lowest level of contamination (No. 17: 255 item/dry kg) in this section was similar to section S1, the maximum MP content (No. 18: 4477 item/dry kg) was 2.7 times higher than the maximum of the upstream section. The tributaries joining this section contained only half as much MP (821 ± 390 item/dry kg) on average as the Tisza itself, but their minimum value (C2: 420 item/dry kg) was 1.6 times higher. The most contaminated sediments were collected from the Tarac (B2: 1407 ± 519 item/dry kg) and Talabor rivers (C1–C2: 750 ± 348 item/dry kg), but even their contamination remained below the Tisza.
At the time of sampling, in 2020, the most polluted part of the entire fluvial system of the Tisza was the upstream section of the Middle Tisza (S3), where the mean MP content (2082 ± 1511 item/dry kg) increased further by 28% (Figure 4 and Figure 5). The lowest MP contamination of the sediments (No. 23: 237 item/dry kg) was similar to the previous section, though the maximum value (No. 29: 6707 item/dry kg) increased by 50% compared to section S2. The tributaries joining this section of the Tisza were also the most polluted ones in the entire catchment, as their mean MP content (2785 ± 1726 item/dry kg) was higher than the Tisza by 33%. The most polluted tributaries were the Kraszna (E1–E2: 3113 ± 993 item/dry kg) and Sajó rivers (I1–I2: 4991 ± 1968 item/dry kg). Although the maximum pollution (I2: 6383 item/dry kg) of the tributaries of this sub-catchment was slightly lower than the Tisza’s, their minimum value was twice greater (G2: 537 item/dry kg).
Toward the downstream section of the Middle Tisza (S4), the mean MP content of the sediments slightly decreased (2019 ± 1305 item/dry kg). Compared to section S3, it was only a 3% decline; however, here, 1.4 times more MP still accumulated in the sediments than in the Upper Tisza (Figure 4 and Figure 5). The minimum values of this section (No. 34: 299 item/dry kg) are similar in magnitude to that measured in the other upstream sections, but they were approx. 20–25% higher. The maximum amount of MP (No. 38: 6523 item/dry kg) was only 3% less than that measured in section S3. The sediment of the tributaries of this sub-catchment contained 15% less MP on average (1706 ± 820 item/dry kg) than that of the Tisza, but the minimum value (J1: 787 item/dry kg) was almost 2.6 times higher than the minimum value measured on the Tisza.
In 2020, the least polluted section of the Tisza was the Lower Tisza (S5), as the MP pollution of the sediments (mean: 530 ± 169 item/dry kg) decreased by 74% compared to the previous section S4 (Figure 4 and Figure 5). Still, the lowest contamination level (No. 51: 360 item/dry kg) continued to increase by 20%, but the maximum value (No. 49: 840 item/dry kg) fell far behind the S4 maximum, decreasing by 88%.
3.2. Microplastic Content in Various Geomorphological Situations
Sediment samples were collected from the different in-channel depositional forms of the Tisza (Figure 6). The point-bar sediments contained a slightly higher amount of MP (mean: 2049 ± 1218 item/dry kg) than the side-bars (mean: 1692 ± 1335 item/dry kg) or the sediment sheets (mean: 1584 ± 1464 item/dry kg). However, remarkably high MP content was not measured on a point-bar but a side-bar (No. 38: 6523 item/dry kg) and sediment sheet (No. 29: 6707 item/dry kg). The difference between the geomorphological forms of the tributaries was smaller, and here, slightly fewer MPs (1617 ± 2015 item/dry kg) accumulated on the point-bars, while the side-bars and sediment sheets were slightly more polluted (1965 ± 1496 and 1871 ± 1120 item/dry kg, respectively).
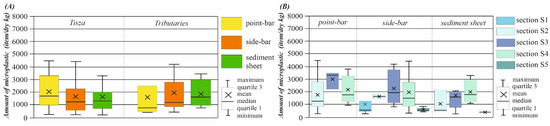
Figure 6.
Differences in microplastic content (item/dry kg) of the sediments of the Tisza River and its tributaries (A) and of various geomorphological forms sampled at the various sections of the Tisza River (B).
Point-bars developed along the meandering sections (S2–S4), but they are missing from the upstream section of the mountainous Upper Tisza (S1), and they disappeared from the Lower Tisza (S5) as the result of the incision initiated by channel regulation works. According to the results, the amount of the MP particles in the point-bar sediments showed a similar trend (Figure 6) as the river sections themselves; thus, the point-bars in the S3 section had the highest MP content (mean: 2985 ± 672 item/dry kg). In each section, more MPs were deposited in the point-bars than the section average; the largest difference (E: +43%) from the section average was measured in section S3, while in the other sections (S2 and S4), the difference was only 7–8%. It is also interesting to see how the pollution developed in the point-bars in successive sections. The point-bars show the strongest enrichment in section S3 containing 70% more MP than section S2 and 28% more than the section below.
Side-bars formed along the slightly sinuous sections, and they can be found along the entire length of the Tisza (Figure 6). The amount of the MP particles on the side-bars of the individual sections showed a similar trend as the sections and the point-bars; thus, the amount of MP was the highest in section S3 of the Middle Tisza (average: 2272 ± 1302 item/dry kg). However, in contrast to the point-bars, only slightly more MPs were deposited in the side-bars (E: +0–3%) than the mean of the actual section. The only exception was section S3, where the side-bars accumulated 9% more MP than the section average. As these forms occur along the entire Tisza, the spatial difference between the individual sections could be well-assessed. The enrichment rate was the highest between section S1 and S2, where the amount of the MP increased by 66% on the side-bars, but it decreased (ES3/S2: 39%). However, from this section, the side-bars contain less and less MP toward the downstream sections, as the mean values of the sections decreased by 14% (ES4/S3) and by a further 72% (ES5/S4). It must be noted that these changes were similar to the changes of the section averages.
The sediment sheets were deposited on the steep sides of the almost straight channel. Except for the uppermost section, such forms were sampled all along the Tisza. The spatial changes of the mean MP content of the sediment sheets did not follow the same trend as the sections, point-bars or side-bars (Figure 6), as they had the highest MP concentration (mean: 1983 ± 943 item/dry kg) in section S4. Considering the downstream changes of the MP content of the sediment sheets, it was interesting that from section S2 to S3 it increased by 63%, similarly to the point-bars. However, the MP content further increased toward section S4 by 16%, which showed a completely different spatial pattern than the other forms. The amount of the MP particles in the sediment sheets was lower than the average of a given section by 2–36%, which is in sharp contrast to the enrichment in the point-bars.
The confluences can be considered as special geomorphological locations, as the tributary might be impounded by the main river, increasing the possibility of MP aggradation. The tributary can also act as an MP source affecting the contamination of the main river downstream of the confluence. In 9 out of the 11 tributaries, at their near-confluence sampling sites, the MP content of the sediments was higher by 57% on average than in their upstream counterpart sampling points (Figure 4). The very steep Talabor and Nagyág rivers were exceptions, which had less polluted sediments near their confluences. The contribution of the tributaries to the MP pollution of the Tisza was also analyzed. The sediments of the tributaries contained more MP by 20% on average than the Tisza’s sediments upstream of the confluence; thus, most of them (except the Nagyág, Bodrog and Zagyva rivers) transported an extra MP load to the main river. Therefore, below the confluences, the sediments of the Tisza contained more MP by 52% on average than the samples upstream of the confluence.
3.3. Microplastic Content and Grain Size of the Sediment
During the 2020 sampling campaign, both fine-grained and coarse-grained sediment samples were collected at each sampling site to reveal the relationship between the MP content of the sediment and its grain size. Considering all samples, the MP content is not related to the sample’s particle composition (d50), as the R2 was below 0.1 (Figure 7).
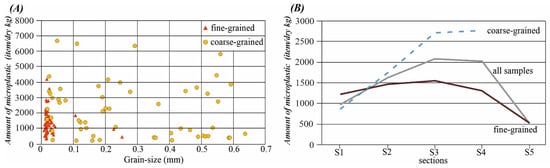
Figure 7.
(A) Relationship between the grain size (d50) of the samples and their microplastic content (item/dry kg). (B) Mean microplastic content (item/dry kg) of the fine-grained and coarse-grained sediments collected from the various sections of the Tisza in 2020.
Some weak correlations emerged when the samples were classified based on their locations along the Tisza and their geomorphological position. In section S1, the fine-grained samples contained 39% more MPs than the coarse-grained samples collected at the same site (Figure 7). However, the difference between the two sediment types was reversed and gradually increased with the flow direction, i.e., fine-grained samples contained less and less MPs than the coarse samples. Thus, in section S2, the fine-grained samples contained 17% less MP than in the coarse samples, then the difference increased to 43% (S3) and 51% (S4) further downstream.
It was also evaluated whether the MP content changes with flow direction in samples with different particle compositions to the same extent (Figure 7). The fine-grained samples contained more and more MPs toward section S3, but the enrichment of the MP decreased, as it was 19% between sections S1 and S2 and just 6% between section S2 and S3. Further downstream, instead of enrichment, the sediments contained less and less MP by 16% (S4/S3) and 60% (S5/S4). Contrary to fine-grained sediments, there was a steady increase in MP in the coarse sediments from section to section, though the enrichment was getting smaller: by 99% (S2/S1), then 54% (S3/S2) and finally only by 2% (S4/S3).
The MP content in coarse- and fine-grained samples from the same geomorphological forms was also evaluated. On the point-bars, the MP content of the coarse material was higher by 34–55% than at the same site in the fine-grained samples (Figure 8). The difference was particularly pronounced in the Middle Tisza (S3–S4) samples containing the most MP particles. In the case of the point-bars’ coarse material, there was only a weak correlation between the MP content and the coarseness of the grains. However, in the case of side-bars or sediment sheets, no correlation was found between the MP content of the coarse- or fine-grained samples. In the side-bars and sediment sheets of the Upper Tisza, the fine-grained material contained more MP (by 30%) than the coarse material, but in the Middle Tisza, the situation was the opposite, so the sandy samples contained more MP by 39–44%.
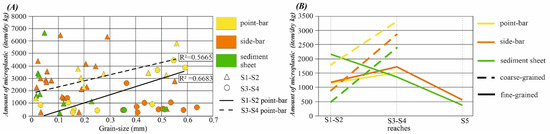
Figure 8.
(A) Relationship between the grain size (d50) of the samples and their microplastic content (item/dry kg) collected on various in-channel forms from the reaches of the Tisza. (B) Spatial changes in mean microplastic content (item/dry kg) of the various forms collected from the three reaches of the Tisza. Upper Tisza: S1–S2; Middle Tisza: S3–S4; Lower Tisza: S5.
3.4. Comparison of the Microplastic Content of Samples Collected in 2019 and 2020
Some of the sampling points were different during the 2019 and 2020 sampling campaigns, as we were able to collect samples in some places in 2019 but not in 2020 (e.g., along the Ukrainian–Romanian country border), and some new sampling points were selected in 2020 (e.g., Lower Tisza in Serbia). In addition, in 2019, only coarse sediments were collected [29]. Therefore, only coarse samples from the same location were selected for the comparison, and those sampling sites were excluded, which were sampled just once.
The samples collected in 2019 were much more polluted (Tisza: 3149 ± 2010 item/dry kg; tributaries: 3827 ± 1584 item/dry kg) than those collected in 2020 (Tisza: 2220 ± 1697 item/dry kg, tributaries: 2007 ± 1821 item/dry kg). Thus, the average microplastic pollution of the Tisza sediments decreased by 30% and that of the tributaries by 48% in 2020 (Table 2). The greatest decrease was detected in the sediments of the tributaries, which was observed in 90% of the samples. However, the extent of the decrease varied from section to section.
Table 2.
Microplastic content (item/dry kg) of coarse sediments collected along the Tisza and its tributaries in 2019 [29] and 2020.
In section S1, the average MP content of the sediments decreased significantly by 79% (Table 2). While in 2019, this section was the most contaminated, in 2020, it became the least polluted one. The location of the minimum MP contamination remained at the same site (No. 3 on Figure 9); however, its amount decreased by 90% (2019: 2657 item/dry kg; 2020: 260 item/dry kg). The most polluted sampling point in 2019 was one of the source branches of the Tisza (No. 1: 6738 item/dry kg), but in 2020, the most polluted sampling point was identified further downstream (No. 4: 2620 item/dry kg), though here the amount of MP in the sediment still decreased below the minimum value of the section in 2019.
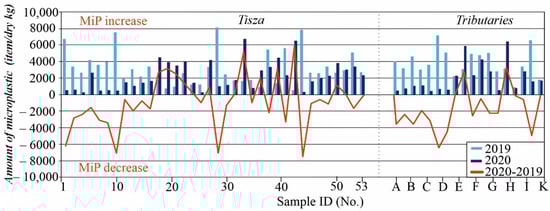
Figure 9.
Differences in microplastic content (item/dry kg) of sediments collected at the same locations from coarse sediments in 2019 and 2020. (The capital letters refers to the sample ID of the tributaries, see Figure 1).
In section S2, the difference between the two surveys decreased, as the average MP content of the samples collected in 2020 was just 40% lower (Table 2). In 2019, the average MP content of this section decreased by 25% compared to the upstream section S1; however, in 2020, the trend had changed, and the MP content doubled. This reflects an emptying MP pollution from the upstream section S1 (Figure 9). It is also reflected by the fact that the location of the most polluted sediment in 2019 (No. 11: 7533 item/dry kg) shifted downstream to the end of the section (No. 18: 4477 item/dry kg), and the originally polluted No. 11 site became the least polluted in 2020 (440 item/dry kg). In 2019, the four studied tributaries of section S2 were the most polluted of all tributaries, but in 2020, the average concentration of the MPs in their sediments decreased by 84% (Table 2). In 2019, the Nagyág was the most polluted tributary (D1: 7115 item/dry kg), but in 2020, the Talabor had the maximum MP contamination (C1: 1080 item/dry kg).
Section S3 is the only section where the mean MP content of the samples increased (by 7%) between 2019 and 2020 (Table 2); thus, the least polluted section in 2019 became the most polluted by 2020. On the other hand, the minimum and maximum MP contamination values decreased by 75 and 17%, respectively, and their sites were relocated (Figure 9). The most polluted sample (No. 25: 8067 item/dry kg) became slightly polluted one year later (986 item/dry kg), and highly polluted sediment appeared at the No. 24 site (4187 item/dry kg). Contrary to the Tisza samples, the MP content of the tributaries of this section decreased by 6%. In 2019, the most polluted tributary was the Bodrog (G1: 5017 item/dry kg), but one year later, the Sajó River became the most contaminated (I2: 6383 item/dry kg).
In section S4, the pollution of the 2020 samples was 17% lower than in 2019. While in 2019, this section was more polluted than section S2 and S3, in 2020, this section became the most polluted section along the entire Tisza (Table 2). The most polluted site (No. 39: 7809 item/dry kg) in 2019 became the least polluted (299 item/dry kg) in 2020 (Figure 9), as the amount of the MP decreased by 97%. Interestingly, the purest sample of this section during the 2019 measurement (No. 38: 528 item/dry kg) became the most polluted by 2020 (6523 item/dry kg). The amount of MP in the sediments of the tributaries joining this Tisza section decreased by 46% (Table 2). In both years, the least polluted tributary samples were the upstream samples of the Zagyva River (at J1 in 2019: 900 item/dry kg; 2020: 787 item/dry kg). However, in 2020, the most polluted tributary’s sediments were collected at the impounded, near-to-the-confluence section of the Zagyva (J2: 6533 item/dry kg), though in the previous year, the Körös River was the most contaminated (K1: 2780 item/dry kg).
The amount of MP on each geomorphological form was also compared to see whether they changed in a similar way between 2019 and 2020 (Figure 10). While the MP content of the sediments decreased in general, this was not typical for the point-bars, which have become more polluted by 10% in a year. At the same time, the amount of the MP decreased by 29% in the side-bars and by 51% in the sedimentary sheets.
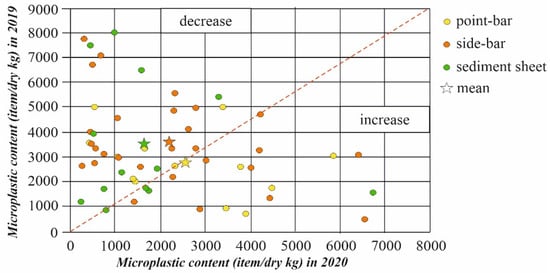
Figure 10.
Microplastic content (item/dry kg) of coarse sediments collected on various geomorphological forms in 2019 and 2020.
4. Discussion
4.1. Microplastic Pollution of the Sediments of the Tisza River in 2019 and 2020
The entire length of the Tisza (946 km) was sampled twice, in 2019 and 2020. Between the measurements, the MP pollution of the sediments considerably decreased, as in 2019, the average MP content of the sediments was 3149 ± 2010 item/dry kg, but by 2020, it had decreased by 30% to 2220 ± 1697 item/dry kg. The MP content in the tributaries decreased even more, by 48% (2019: 3827 ± 1584 item/dry kg; 2020: 2007 ± 1821 item/dry kg). These data reflect that a considerable amount of the MP has been transported away from the fluvial system of the Tisza River during the surveyed year.
The results suggest that the Tisza is a highly polluted river. Similarly, the high MP contamination was measured in the Rhine (228–3763 item/dry kg) and Main rivers (786–1368 item/dry kg) in Germany [49], in the sediments of the St. Lawrence River (65–7562 item/dry kg [50]), in the Solimões, Negro and Amazonas rivers (418–8178 item/dry kg [30]) and the Haihe River (4980 ± 2462 item/dry kg) in China [15]. Values similar to the less polluted sections of the Tisza were measured in the sediments of Chinese rivers (800–1100 item/dry kg [19,51,52]) or the Vistula River, Poland (190–580 item/dry kg [17]). However, there are also rivers, even with urbanized, densely populated catchments, where the average MP content of their sediments was even less than the least polluted sampling points of the Tisza, i.e., below 200 item/dry kg. Such slightly polluted rivers were reported from South Africa [25,50,53] or Scotland [54].
In the samples, 98% of the MP particles were fibers, two-thirds of which were colored fibers. This suggests that the MP in the river was derived from synthetic clothing materials [6,55], which entered the water system of the Tisza through the discharge of treated or untreated wastewater [29]. The dominance of fibers in sediments has been reported in several other studies [12,15,30,54,56,57]), especially near settlements [16,17], although the presence of spheres and fragments is more common in other rivers [13,20,51].
4.2. Annual Changes in Microplastic Content: Rearrangement of the Microplastic Pollution
The two sampling periods took place in August at low water levels, but several small or medium flood waves developed during the studied year (Figure 3). In November and December, there were three small flood waves (water level change: 0.5–2 m), followed by two larger ones in February and March (water level change: 2–4 m) and finally, in June-July, a six-week-long flood developed (water level change: 4–7 m), but it was far lower than the 2006 flood. This final flood wave reached the bankfull level, when the sediment transport capacity is the highest [22]. As a result of these flood waves, the MP content in the sediments of the Tisza and its tributaries was significantly rearranged.
During the rearrangement, the MP pollution on the previously heavily polluted S1 and S4 sections decreased so much that, in 2020, section S4 became the least polluted (E: −79%), while in the Middle Tisza (section S3), the pollution increased (E: +7%). The removal of the MP from the water system is reflected by (i) the spatial change of the enrichment ratios between the individual sections; (ii) the contamination of the previously less-polluted section (S3); (iii) the decrease in the amount of MP in the sediments of the tributaries; and (iv) the disappearance of the former MP hot-spots and the emergence of new ones at previously slightly contaminated sites. A similar rearrangement was observed by Hurley et al. [20] in the Mersey River system (UK) or by Sekudewicz et al. [17] in the water system of the Vistula (Poland), where a flood wave rearranged the pollution hot-spots and significantly removed the MP from a reach. On the other hand, flood waves may also import large amounts of MPs into the river systems [17]. However, high water velocities may also remobilize the MPs from the channel sediments [1]. Thus, the amount of MP can vary greatly between reaches and within a hydrological year; therefore, sampling should be condensed in space and time to understand the dynamics of the MPs in the sediments.
4.3. Parameters Affecting the Minimum and Maximum Microplastic Concentrations
We hypothesized that contamination around the minimum values indicates the basic pollution of a river base, while the extremely high values are related to local factors. The minimum values increase continuously downstream of the Tisza (from section S1: 260 item/dry kg to section S5: 360 item/dry kg), simultaneously with the gradual decrease in the slope and flow velocity; thus, the MP in sediments gradually accumulated. A similar trend characterizes the in-channel natural sediment aggradation of the Tisza [31]. The tributaries also support the connection between the minimum MP content and the slope, as their minimum MP contamination is increasing from the Upper Tisza’s sub-catchments to the lower sub-catchments; thus, the lowermost tributary has the highest minimum MP pollution. Therefore, we suggest analyzing the longitudinal MP concentrations considering only the minimum values of hydrologically uniform sections, as these values indicate the basic pollution. Probably, the lack of this approach had led to ambiguous results on longitudinal changes in MP concentrations, as some studies suggest that the MP pollution in sediments has increased downstream [7,13,26], others indicated a decrease [58] or no longitudinal downstream trend at all [24].
The development of extremely high MP concentrations can be attributed to the sudden deterioration of the MP transport conditions. This statement is supported by the fact that, in 2019, the MP concentration was on average 6305 ± 1434 item/dry kg at the most polluted points (≥4000 item/dry kg), while in 2020, at the same points, only 1732 ± 1317 item/dry kg of MP was in their sediments, so the pollution of these points decreased by 73%. At the same time, new contamination hot-spots have developed in areas where previously slightly or moderately contaminated sediments were found. Because the flow conditions at the same site on the same form at the same point hardly change in one year, the change in the MP content is explained by the river’s temporally changing transported sediment flux. As the MP content of the transported sediment is temporally various, MP-contaminated fluxes and less polluted fluxes exist. The question is where the given transported material will reach a transport threshold point, so when it will be deposited, i.e., where the flow velocity fell below the transport rate during a flood wave (flux). Thus, the development of extremely high values is probably related to the MP input into a given reach and the spatial and temporal changes in sediment transport capacity. However, the former researchers explained the development of MP hot-spots by increased MP input from megacities [51], agriculture and wastewater treatment plants [58] and industry [7]. The development of hot-spots was also explained by artificial or natural impoundment [1,15,19,29].
4.4. Parameters Affecting the Rearrangement of Deposited Microplastic Contamination
The data reflect that the rearrangement of the MPs is not a straightforward process, as the amount of the MP did not vary to the same extent between the section and the in-channel forms.
The slope of the river mainly influenced the reduction in MPs from the sediments. The most significant decrease was observed in the sections with the highest and lowest slopes. In the uppermost section (S1) and the tributaries, the six subsequent flood waves with gradually increasing heights effectively mobilized the polluted sediments and transported them to the middle section of the Tisza. Simultaneously, in the section (S4) with an extremely low slope where the impoundment propagated the aggradation of MPs, the flood waves effectively mobilized the bottom sediment. In this case, the flood waves were relatively low; thus, neither the Danube nor the tributaries impounded them so the MP-contaminated sediments could be mobilized, and the sections (S4 and S5) became less polluted. This also suggests that the mobilized MPs probably reached the Danube. A similar spatial pattern of mobilization was described from the Mersey, UK [20]. However, Rodrigues et al. [23] pointed out that this rearrangement pattern may vary between hydrological situations, and the removing of MPs from the water system is gradual.
The tributaries play a key role in the replenishment of the MP load of the main river, as they transport polluted water from the sub-catchment in varying degrees (depending on the population and wastewater management). According to our results, the tributaries mainly determine the mean pollution of a section, especially in the close vicinity of the confluence. This is supported by the fact that 9 of the 11 tributaries had a higher (+20%) MP content in their sediments than the Tisza had near the confluence, and they increased the MP content of the Tisza by 52% on average. In addition, as larger tributaries join the Tisza with more and more transported sediments with more MPs, they effectively increase the general pollution (minimum and mean values) of the main river. Several authors also indicated the importance of tributaries as sources of MPs for the main river [29,53,59,60]. The tributaries act as the conveyance belts in MP transport into the main river [19,61], especially if the wastewater treatment plants are located on the tributaries instead of the main river [7,49,58]. On the catchments of tributaries, the high population density or dynamic economic growth can also effectively increase the MP pollution of a tributary, which finally increases the main river’s contamination [23].
Three different geomorphological forms were sampled along the Tisza River to see whether the MP content of the sediments was affected by the morphology of the sampling site. The point-bars developing in the convex side of the meanders proved to be the most polluted (mean: 2049 ± 1218 item/dry kg), while the side-bars of the sinuous sections had less MP content by 18% (mean: 1692 ± 1335 item/dry kg), and sediment sheets that formed along straight sections contained less MP than the point-bars by 23% (mean: 1584 ± 1464 item/dry kg). Meanwhile, the point-bars had the most uniform MP distribution, without extremely high values. This can be explained by the fact that the material of the three forms was deposited under different hydrological conditions. While sedimentation on point-bars and side-bars is continuous and can take place at any stage, the deposition on sediment sheets can happen just during the falling limb of floods. In addition, the bars are built of mainly bed load, whereas the sediment sheets are built up by suspended sediments. Thus, it can be assumed that the different MP content of the forms is related to the fact that their sediments were deposited at different times when the MP flux was different. In addition, the MPs were transported in different ways onto these forms (as bed load or suspended load) and deposited in a different flow environment (flowing or standing water). This is supported by the results of previous researchers [7,13], who found that the MP is transported in suspension under a continuous flow and its sedimentation rate is very low. The sedimentation of suspended MP particles is supported by the low-energy environment created by a slope drop [15,19,30]. The accelerated deposition on the point-bars could also be connected to the fact that these forms are located at the greatest distance from the thalweg, where the MP transport is the most intensive [62]. Above the point-bars, due to the reduced flow rate, the MP particles easily form aggregates with natural colloids, promoting the appearance of contaminating communities on their surface, which enhances sedimentation [52].
The MP content of the point-bars and the side-bars changed with a similar spatial pattern as that of the uniform hydrological sections. Thus, they can be considered as representative indicators of the downstream changes in the MP concentration. However, in the most polluted section (S3), the MPs were more enriched in the point-bars compared to the section average (by 43%) or compared to the point-bars of the previous section (by 70%) than in the other form. Thus, the point-bars may show significant MP overload in some situations. Furthermore, the spatial distribution of the MP content of the sediment sheets showed a different spatial pattern than the sections or other forms, as their MP pollution reached its peak further downstream, in section S4. The amount of MP particles in the sediment sheets was lower than the average of a given section by 2–36%, which is in sharp contrast to the MP enrichment in the point-bars or side-bars in the S1–3 sections.
It is also interesting to compare whether the MP content of the different geomorphological forms changed similarly or not between the two surveys. While the MP content of the sediments decreased in a year, this was not typical for the point-bars, which have become more polluted by 10%. At the same time, the amount of the MP decreased by 29% in the side-bars and by 51% in the sedimentary sheets. Therefore, it does matter what forms are sampled, as they influence the changes and spatial patterns we conclude. The novel result of our research is that if the sediment samplings are performed on different channel forms, their results may show completely different longitudinal trends, and some forms over represent the MP pollution of the section (e.g., point-bar), others (e.g., sediment sheets) underrepresent it. We recommend selecting side-bars for sampling, as on the one hand, in alluvial rivers, these forms are more common than the point-bars. In addition, their MP values were the closest (+0–9%) to section averages, and they changed with a similar spatial and temporal trend.
Finally, we also evaluated the connection between the particle size of the sediments and their MP content, but no clear general relationship was found. However, other researchers [26,50,63] found a positive correlation between the clay fraction of the sediments and their microplastic content. On the contrary, in the lower sections of the Tisza (S2–4), the coarse-grained samples contained more MP, and as the slope of the sections decreased, the difference between the MP content of the two sample types increased: the coarse-grained samples contained more and more MP. The difference between the two sample types was the most evident in the sediments of point-bars, as on these forms, the MP content of the coarse material was higher by 34–55% than at the same site in the fine-grained samples. However, in the case of the side-bars or sediment sheets, no characteristic differences were found between the MP content of the coarse- or fine-grained samples. This may be related to the fact that the MP particles form aggregates with other sediment particles [14,64], or biofilm is formed on their surface [15,65]. Thus, forming aggregates, the MPs are deposited as the bed-load particles, i.e., from medium-velocity water and not from standing water as the suspended sediment does. The deposition of the bed-load particles is typical on the coarse-grained sediment body of the point-bars, which also explains the deposition of MPs with larger aggregates. On the contrary, the suspended material is deposited on sediment sheets, but their MP content is highly influenced by the actual MP influx of the water.
5. Conclusions
The transported MP pollution in rivers poses new challenges to the research community. While a very wide range of MP research is concerned with the chemical and physical properties of the MP particles, a relatively limited number of studies are investigating the geomorphological context of MP pollution. However, the hydrological and geomorphological aspects of the MP transport, deposition and mobilization would be very important, as these are complex processes, which fundamentally affect the MP concentration in sediment measured at a given point at a given time.
Therefore, we analyzed the spatial and temporal characteristics of the MP accumulation and rearrangement, conducting two consecutive sampling campaigns. In 2019, we collected 62 samples from 59 sites, but in 2020, 120 samples were already collected from 70 sites from the source of the Tisza in Ukraine to its Danubian confluence (Serbia). Our results show that smaller, below-bankfull flood waves can effectively rearrange the MP in the water system. Therefore, to understand the spatio-temporal changes in MP pollution, it is worthwhile to repeat the surveys on a river at the same points, sampling as many sites as possible. A series of data from several years is likely needed to understand the MP transport and deposition processes in a river system; thus, the role of various hydrological situations (from low stages to peak floods) could be understood.
While researchers are more or less familiar with the modes of natural sediment transport, the deposition and mobilization conditions of the MP particles are different from natural sediments due to their varied density, size and aggregate formation. The MP, which forms aggregates, can behave similarly to bed-load sediments, though suspended transport can also be significant. As sediments transported in different ways are deposited on different in-channel forms, it is important to compare the sampling sites in terms of geomorphology. Because different in-channel forms trap various sediments to different degrees, samplings should be performed from the same morphological forms, and during the evaluation of the MP contamination, the evolutionary characteristics of a given form should be considered. According to our results, the MP content of the point-bars is much larger than other in-channel forms, and they show greater downstream and temporal changes. We recommend collecting samples from side-bars, which are common forms in rivers, and they reflect the evolution of the MP content of river sections. The sediment-sheets are the least favorable forms for MP sampling, as their longitudinal variations are different than of the other forms or the section averages, though, if the sampling aims to evaluate the MP content (in suspended form) of a falling limb of a flood, the sediment sheets are a perfect choice.
Author Contributions
Conceptualization, T.K. and A.B.; methodology, A.B.; formal analysis, A.B.; investigation, S.G., T.N. and M.M.; resources, T.K. and A.B.; writing—original draft preparation, A.B.; writing—review and editing, T.K. and A.B.; visualization, S.G.; project administration, T.K., S.G. and M.M. All authors have read and agreed to the published version of the manuscript.
Funding
This research was funded by Hungarian Scientific Research (OTKA K:134306).
Institutional Review Board Statement
Not applicable.
Informed Consent Statement
Not applicable.
Data Availability Statement
Not applicable.
Conflicts of Interest
The authors declare no conflict of interest.
References
- van Emmerik, T.; Schwarz, A. Plastic debris in rivers. Wiley Interdiscip. Rev. Water 2020, 7, e1398. [Google Scholar] [CrossRef] [Green Version]
- Mendoza, L.M.R.; Balcer, M. Microplastics in freshwater environments: A review of quantification assessment. TrAC Trends Anal. Chem. 2019, 113, 402–408. [Google Scholar] [CrossRef]
- Hidalgo-Ruz, V.; Gutow, L.; Thompson, R.C.; Thiel, M. Microplastics in the marine environment: A review of the methods used for identification and quantification. Environ. Sci. Technol. 2012, 46, 3060–3075. [Google Scholar] [CrossRef] [PubMed]
- Bordós, G.; Reiber, J. Microplastics in the environment and the food chain. Élelmiszervizsgálati Közl. 2016, 62/2, 1020–1048. [Google Scholar]
- Borrelle, S.B.; Ringma, J.; Law, K.L.; Monnahan, C.C.; Lebreton, L.; McGivern, A.; Murphy, E.; Jambeck, J.; Leonard, G.H.; Hilleary, M.A. Predicted growth in plastic waste exceeds efforts to mitigate plastic pollution. Science 2020, 369, 1515–1518. [Google Scholar] [CrossRef]
- Gubek, I. A tengerek és óceánok műanyag szennyezésének komplex hatása 1. (Plastic pollution of seas and oceans 1). Természetvédelmi Közlemények 2016, 22, 33–61. (In Hungarian) [Google Scholar] [CrossRef]
- Scherer, C.; Weber, A.; Stock, F.; Vurusic, S.; Egerci, H.; Kochleus, C.; Arendt, N.; Foeldi, C.; Dierkes, G.; Wagner, M. Comparative assessment of microplastics in water and sediment of a large European river. Sci. Total Environ. 2020, 738, 139866. [Google Scholar] [CrossRef]
- He, D.; Luo, Y.; Lu, S.; Liu, M.; Song, Y.; Lei, L. Microplastics in soils: Analytical methods, pollution characteristics and ecological risks. TrAC Trends Anal. Chem. 2018, 109, 163–172. [Google Scholar] [CrossRef]
- Li, J.; Ouyang, Z.; Liu, P.; Zhao, X.; Wu, R.; Zhang, C.; Lin, C.; Li, Y.; Guo, X. Distribution and characteristics of microplastics in the basin of Chishui River in Renhuai, China. Sci. Total Environ. 2021, 773, 145591. [Google Scholar] [CrossRef]
- Andrady, A.L. Microplastics in the marine environment. Mar. Pollut. Bull. 2011, 62, 1596–1605. [Google Scholar] [CrossRef]
- Fischer, D.; Käppler, A.; Fischer, F.; Brandt, J.; Bittrich, L.; Eichhorn, K. Identification of Microplastics in Environmental Samples. Lab. J.—Bus. Web Users Sci. Ind. 2019. Available online: https://analyticalscience.wiley.com/do/10.1002/gitlab.18139 (accessed on 3 March 2022).
- Corami, F.; Rosso, B.; Bravo, B.; Gambaro, A.; Barbante, C. A novel method for purification, quantitative analysis and characterization of microplastic fibers using Micro-FTIR. Chemosphere 2020, 238, 124564. [Google Scholar] [CrossRef] [PubMed]
- Chen, H.L.; Gibbins, C.N.; Selvam, S.B.; Ting, K.N. Spatio-temporal variation of microplastic along a rural to urban transition in a tropical river. Environ. Pollut. 2021, 289, 117895. [Google Scholar] [CrossRef] [PubMed]
- Akdogan, Z.; Guven, B. Microplastics in the environment: A critical review of current understanding and identification of future research needs. Environ. Pollut. 2019, 254, 113011. [Google Scholar] [CrossRef] [PubMed]
- Liu, Y.; Zhang, J.; Tang, Y.; He, Y.; Li, Y.; You, J.; Breider, F.; Tao, S.; Liu, W. Effects of anthropogenic discharge and hydraulic deposition on the distribution and accumulation of microplastics in surface sediments of a typical seagoing river: The Haihe River. J. Hazard. Mater. 2021, 404, 124180. [Google Scholar] [CrossRef]
- He, B.; Smith, M.; Egodawatta, P.; Ayoko, G.A.; Rintoul, L.; Goonetilleke, A. Dispersal and transport of microplastics in river sediments. Environ. Pollut. 2021, 279, 116884. [Google Scholar] [CrossRef] [PubMed]
- Sekudewicz, I.; Dąbrowska, A.M.; Syczewski, M.D. Microplastic pollution in surface water and sediments in the urban section of the Vistula River (Poland). Sci. Total Environ. 2021, 762, 143111. [Google Scholar] [CrossRef]
- Sucharitakul, P.; Pitt, K.A.; Welsh, D.T. Assessment of microplastics in discharged treated wastewater and the utility of Chrysaora pentastoma medusae as bioindicators of microplastics. Sci. Total Environ. 2021, 790, 148076. [Google Scholar] [CrossRef]
- Yan, Z.; Chen, Y.; Bao, X.; Zhang, X.; Ling, X.; Lu, G.; Liu, J.; Nie, Y. Microplastic pollution in an urbanized river affected by water diversion: Combining with active biomonitoring. J. Hazard. Mater. 2021, 417, 126058. [Google Scholar] [CrossRef]
- Hurley, R.; Woodward, J.; Rothwell, J.J. Microplastic contamination of river beds significantly reduced by catchment-wide flooding. Nat. Geosci. 2018, 11, 251–257. [Google Scholar] [CrossRef]
- Cook, S.; Chan, H.-L.; Abolfathi, S.; Bending, G.D.; Schäfer, H.; Pearson, J.M. Longitudinal dispersion of microplastics in aquatic flows using fluorometric techniques. Water Res. 2020, 170, 115337. [Google Scholar] [CrossRef] [PubMed]
- Knighton, D. Fluvial Forms and Processes: A New Perspective, 2nd ed.; Routledge: London, UK, 1998; p. 400. [Google Scholar]
- Rodrigues, M.O.; Abrantes, N.; Gonçalves, F.J.M.; Nogueira, H.; Marques, J.C.; Gonçalves, A.M.M. Spatial and temporal distribution of microplastics in water and sediments of a freshwater system (Antuã River, Portugal). Sci. Total Environ. 2018, 633, 1549–1559. [Google Scholar] [CrossRef] [PubMed]
- Barrows, A.P.W.; Christiansen, K.S.; Bode, E.T.; Hoellein, T.J. A watershed-scale, citizen science approach to quantifying microplastic concentration in a mixed land-use river. Water Res. 2018, 147, 382–392. [Google Scholar] [CrossRef] [PubMed]
- Nel, H.A.; Dalu, T.; Wasserman, R.J. Sinks and sources: Assessing microplastic abundance in river sediment and deposit feeders in an Austral temperate urban river system. Sci. Total Environ. 2018, 612, 950–956. [Google Scholar] [CrossRef]
- He, B.; Goonetilleke, A.; Ayoko, G.A.; Rintoul, L. Abundance, distribution patterns, and identification of microplastics in Brisbane River sediments, Australia. Sci. Total Environ. 2020, 700, 134467. [Google Scholar] [CrossRef]
- Mani, T.; Burkhardt-Holm, P. Seasonal microplastics variation in nival and pluvial stretches of the Rhine River–From the Swiss catchment towards the North Sea. Sci. Total Environ. 2020, 707, 135579. [Google Scholar] [CrossRef]
- Li, C.; Busquets, R.; Campos, L.C. Assessment of microplastics in freshwater systems: A review. Sci. Total Environ. 2020, 707, 135578. [Google Scholar] [CrossRef]
- Kiss, T.; Fórián, S.; Szatmári, G.; Sipos, G. Spatial distribution of microplastics in the fluvial sediments of a transboundary river—A case study of the Tisza River in Central Europe. Sci. Total Environ. 2021, 785, 147306. [Google Scholar] [CrossRef]
- Gerolin, C.R.; Pupim, F.N.; Sawakuchi, A.O.; Grohmann, C.H.; Labuto, G.; Semensatto, D. Microplastics in sediments from Amazon rivers, Brazil. Sci. Total Environ. 2020, 749, 141604. [Google Scholar] [CrossRef]
- Lászlóffy, W. A Tisza; Akadémiai Kiadó: Budapest, Hungary, 1982; p. 610. (In Hungarian) [Google Scholar]
- Kiss, T.; Hernesz, P.; Sümeghy, B.; Györgyövics, K.; Sipos, G. The evolution of the Great Hungarian Plain fluvial system–Fluvial processes in a subsiding area from the beginning of the Weichselian. Quat. Int. 2015, 388, 142–155. [Google Scholar] [CrossRef] [Green Version]
- Bogárdi, J. Vízfolyások Hordalékszállítása; (Sediment Transport of Rivers); Akadémiai Kiadó: Budapest, Hungary, 1971; p. 837. (In Hungarian) [Google Scholar]
- Tarpai, J. A Természeti és Társadalmi Erőforrások Szerepe Kárpátalja Turizmusfejlesztésében és Hatása a Területfejlesztésre; (The Role of Natural and Social Resources in the Development of the Tourism of the Subcarpatian Region of Ukraine); University of Pécs: Pécs, Hungary, 2013. (In Hungarian) [Google Scholar]
- Vízügyi Főigazgatóság, Összehangolt Munkával több Mint 7 Tonna Tiszából Kigyűjtött Hulladék Hasznosul Újra. (Recycling of 7 Tonnes of Fluvial Debris Collected from the Tisza). Available online: www.vizugy.hu (accessed on 3 March 2022). (In Hungarian).
- Innotéka. Megtisztulnak a Felső-Tisza-Vidék Folyói. (Cleaning of the Rivers of the Upper Tisza). Available online: www.innoteka.hu (accessed on 3 March 2022). (In Hungarian).
- kupa, P. PET Palack Áradat. (A Flood of PET Bottles). Available online: www.petkupa.hu (accessed on 3 March 2022).
- Szabadság. Nagyszabású víz- és Szennyvízhálózat Fejlesztésbe Kezd a Megye. (Wastewater and Sewage System Development). Available online: www.szabadsag.ro (accessed on 3 March 2022). (In Hungarian).
- Katona, G. A Tisza folyó hulladékszennyezése. (Waste pollution of the Tisza). Műszaki Ktn. Közlöny 2019, 29, 65–80. (In Hungarian) [Google Scholar] [CrossRef] [Green Version]
- Zsuga, K. A Tisza vizének minősége. (Water quality of the Tisza). In A Tisza és Vízrendszere; Teplán, I., Ed.; MTA Társadalomkutató Központ: Budapest, Hungary, 2003; pp. 151–184. (In Hungarian) [Google Scholar]
- Index. EU: Romániában a Legritkább a Vízvezeték. (Wastewater Sewage System in Romania). Available online: www.index.hu (accessed on 3 March 2022). (In Hungarian).
- Sefcsich, G. Energiaszolgáltatás (áram, gáz, hő, víz, hulladék). (Energyand waste management of Vojvodina). In Kistérségek Életereje—Délvidéki Fejlesztési Lehetőségek; Gábrity Molnár, I., Ricz, A., Eds.; Regionális Tudományi Társaság: Szabadka, Serbia, 2006; pp. 191–192. (In Hungarian) [Google Scholar]
- Kiss, T.; Nagy, J.; Fehérvári, I.; Amissah, G.J.; Fiala, K.; Sipos, G. Increased flood height driven by local factors on a regulated river with a confined floodplain, Lower Tisza, Hungary. Geomorphology 2021, 389, 107858. [Google Scholar] [CrossRef]
- Atwood, E.C.; Falcieri, F.M.; Piehl, S.; Bochow, M.; Matthies, M.; Franke, J.; Carniel, S.; Sclavo, M.; Laforsch, C.; Siegert, F. Coastal accumulation of microplastic particles emitted from the Po River, Northern Italy: Comparing remote sensing and hydrodynamic modelling with in situ sample collections. Mar. Pollut. Bull. 2019, 138, 561–574. [Google Scholar] [CrossRef] [PubMed]
- MERI. Guide to Microplastic Identification; Marine and Environmental Research Institute: Blue Hill, ME, USA, 2017; p. 15. [Google Scholar]
- De Witte, B.; Devriese, L.; Bekaert, K.; Hoffman, S.; Vandermeersch, G.; Cooreman, K.; Robbens, J. Quality assessment of the blue mussel (Mytilus edulis): Comparison between commercial and wild types. Mar. Pollut. Bull. 2014, 85, 146–155. [Google Scholar] [CrossRef]
- Parker, B.W.; Beckingham, B.A.; Ingram, B.C.; Ballenger, J.C.; Weinstein, J.E.; Sancho, G. Microplastic and tire wear particle occurrence in fishes from an urban estuary: Influence of feeding characteristics on exposure risk. Mar. Pollut. Bull. 2020, 160, 111539. [Google Scholar] [CrossRef]
- Miller, E.; Sedlak, M.; Lin, D.; Box, C.; Holleman, C.; Rochman, C.M.; Sutton, R. Recommended best practices for collecting, analyzing, and reporting microplastics in environmental media: Lessons learned from comprehensive monitoring of San Francisco Bay. J. Hazard. Mater. 2021, 409, 124770. [Google Scholar] [CrossRef]
- Klein, S.; Worch, E.; Knepper, T.P. Occurrence and Spatial Distribution of Microplastics in River Shore Sediments of the Rhine-Main Area in Germany. Environ. Sci. Technol. 2015, 49, 6070–6076. [Google Scholar] [CrossRef]
- Crew, A.; Gregory-Eaves, I.; Ricciardi, A. Distribution, abundance, and diversity of microplastics in the upper St. Lawrence River. Environ. Pollut. 2020, 260, 113994. [Google Scholar] [CrossRef]
- Peng, G.; Xu, P.; Zhu, B.; Bai, M.; Li, D. Microplastics in freshwater river sediments in Shanghai, China: A case study of risk assessment in mega-cities. Environ. Pollut. 2018, 234, 448–456. [Google Scholar] [CrossRef]
- Zhou, Z.; Zhang, P.; Zhang, G.; Wang, S.; Cai, Y.; Wang, H. Vertical microplastic distribution in sediments of Fuhe River estuary to Baiyangdian Wetland in Northern China. Chemosphere 2021, 280, 130800. [Google Scholar] [CrossRef]
- Dahms, H.T.J.; van Rensburg, G.J.; Greenfield, R. The microplastic profile of an urban African stream. Sci. Total Environ. 2020, 731, 138893. [Google Scholar] [CrossRef]
- Blair, R.M.; Waldron, S.; Phoenix, V.R.; Gauchotte-Lindsay, C. Microscopy and elemental analysis characterisation of microplastics in sediment of a freshwater urban river in Scotland, UK. Environ. Sci. Pollut. Res. 2019, 26, 12491–12504. [Google Scholar] [CrossRef] [Green Version]
- Habib, D.; Locke, D.C.; Cannone, L.J. Synthetic fibers as indicators of municipal sewage sludge, sludge products, and sewage treatment plant effluents. Water Air Soil Pollut. 1998, 103, 1–8. [Google Scholar] [CrossRef]
- Watkins, L.; McGrattan, S.; Sullivan, P.J.; Walter, M.T. The effect of dams on river transport of microplastic pollution. Sci. Total Environ. 2019, 664, 834–840. [Google Scholar] [CrossRef]
- Huang, D.; Li, X.; Ouyang, Z.; Zhao, X.; Wu, R.; Zhang, C.; Lin, C.; Li, Y.; Guo, X. The occurrence and abundance of microplastics in surface water and sediment of the West River downstream, in the south of China. Sci. Total Environ. 2021, 756, 143857. [Google Scholar] [CrossRef]
- Kapp, K.J.; Yeatman, E. Microplastic hotspots in the Snake and Lower Columbia rivers: A journey from the Greater Yellowstone Ecosystem to the Pacific Ocean. Environ. Pollut. 2018, 241, 1082–1090. [Google Scholar] [CrossRef]
- Skalska, K.; Ockelford, A.; Ebdon, J.E.; Cundy, A.B. Riverine microplastics: Behaviour, spatio-temporal variability, and recommendations for standardised sampling and monitoring. J. Water Process Eng. 2020, 38, 101600. [Google Scholar] [CrossRef]
- Tsering, T.; Sillanpää, M.; Sillanpää, M.; Viitala, M.; Reinikainen, S.-P. Microplastics pollution in the Brahmaputra River and the Indus River of the Indian Himalaya. Sci. Total Environ. 2021, 789, 147968. [Google Scholar] [CrossRef]
- Niu, L.; Li, Y.; Li, Y.; Hu, Q.; Wang, C.; Hu, J.; Zhang, W.; Wang, L.; Zhang, C.; Zhang, H. New insights into the vertical distribution and microbial degradation of microplastics in urban river sediments. Water Res. 2021, 188, 116449. [Google Scholar] [CrossRef]
- Pan, Z.; Sun, Y.; Liu, Q.; Lin, C.; Sun, X.; He, Q.; Zhou, K.; Lin, H. Riverine microplastic pollution matters: A case study in the Zhangjiang River of Southeastern China. Mar. Pollut. Bull. 2020, 159, 111516. [Google Scholar] [CrossRef]
- Qian, J.; Tang, S.; Wang, P.; Lu, B.; Li, K.; Jin, W.; He, X. From source to sink: Review and prospects of microplastics in wetland ecosystems. Sci. Total Environ. 2021, 758, 143633. [Google Scholar] [CrossRef] [PubMed]
- Christensen, N.D.; Wisinger, C.E.; Maynard, L.A.; Chauhan, N.; Schubert, J.T.; Czuba, J.A.; Barone, J.R. Transport and characterization of microplastics in inland waterways. J. Water Process Eng. 2020, 38, 101640. [Google Scholar] [CrossRef]
- Hoellein, T.J.; Shogren, A.J.; Tank, J.L.; Risteca, P.; Kelly, J.J. Microplastic deposition velocity in streams follows patterns for naturally occurring allochthonous particles. Sci. Rep. 2019, 9, 3740. [Google Scholar] [CrossRef] [PubMed] [Green Version]
Publisher’s Note: MDPI stays neutral with regard to jurisdictional claims in published maps and institutional affiliations. |
© 2022 by the authors. Licensee MDPI, Basel, Switzerland. This article is an open access article distributed under the terms and conditions of the Creative Commons Attribution (CC BY) license (https://creativecommons.org/licenses/by/4.0/).