
Insights into Della Robbia’s Terracotta Monument to Cardinal Federighi: Raw Materials and Technologies


Abstract
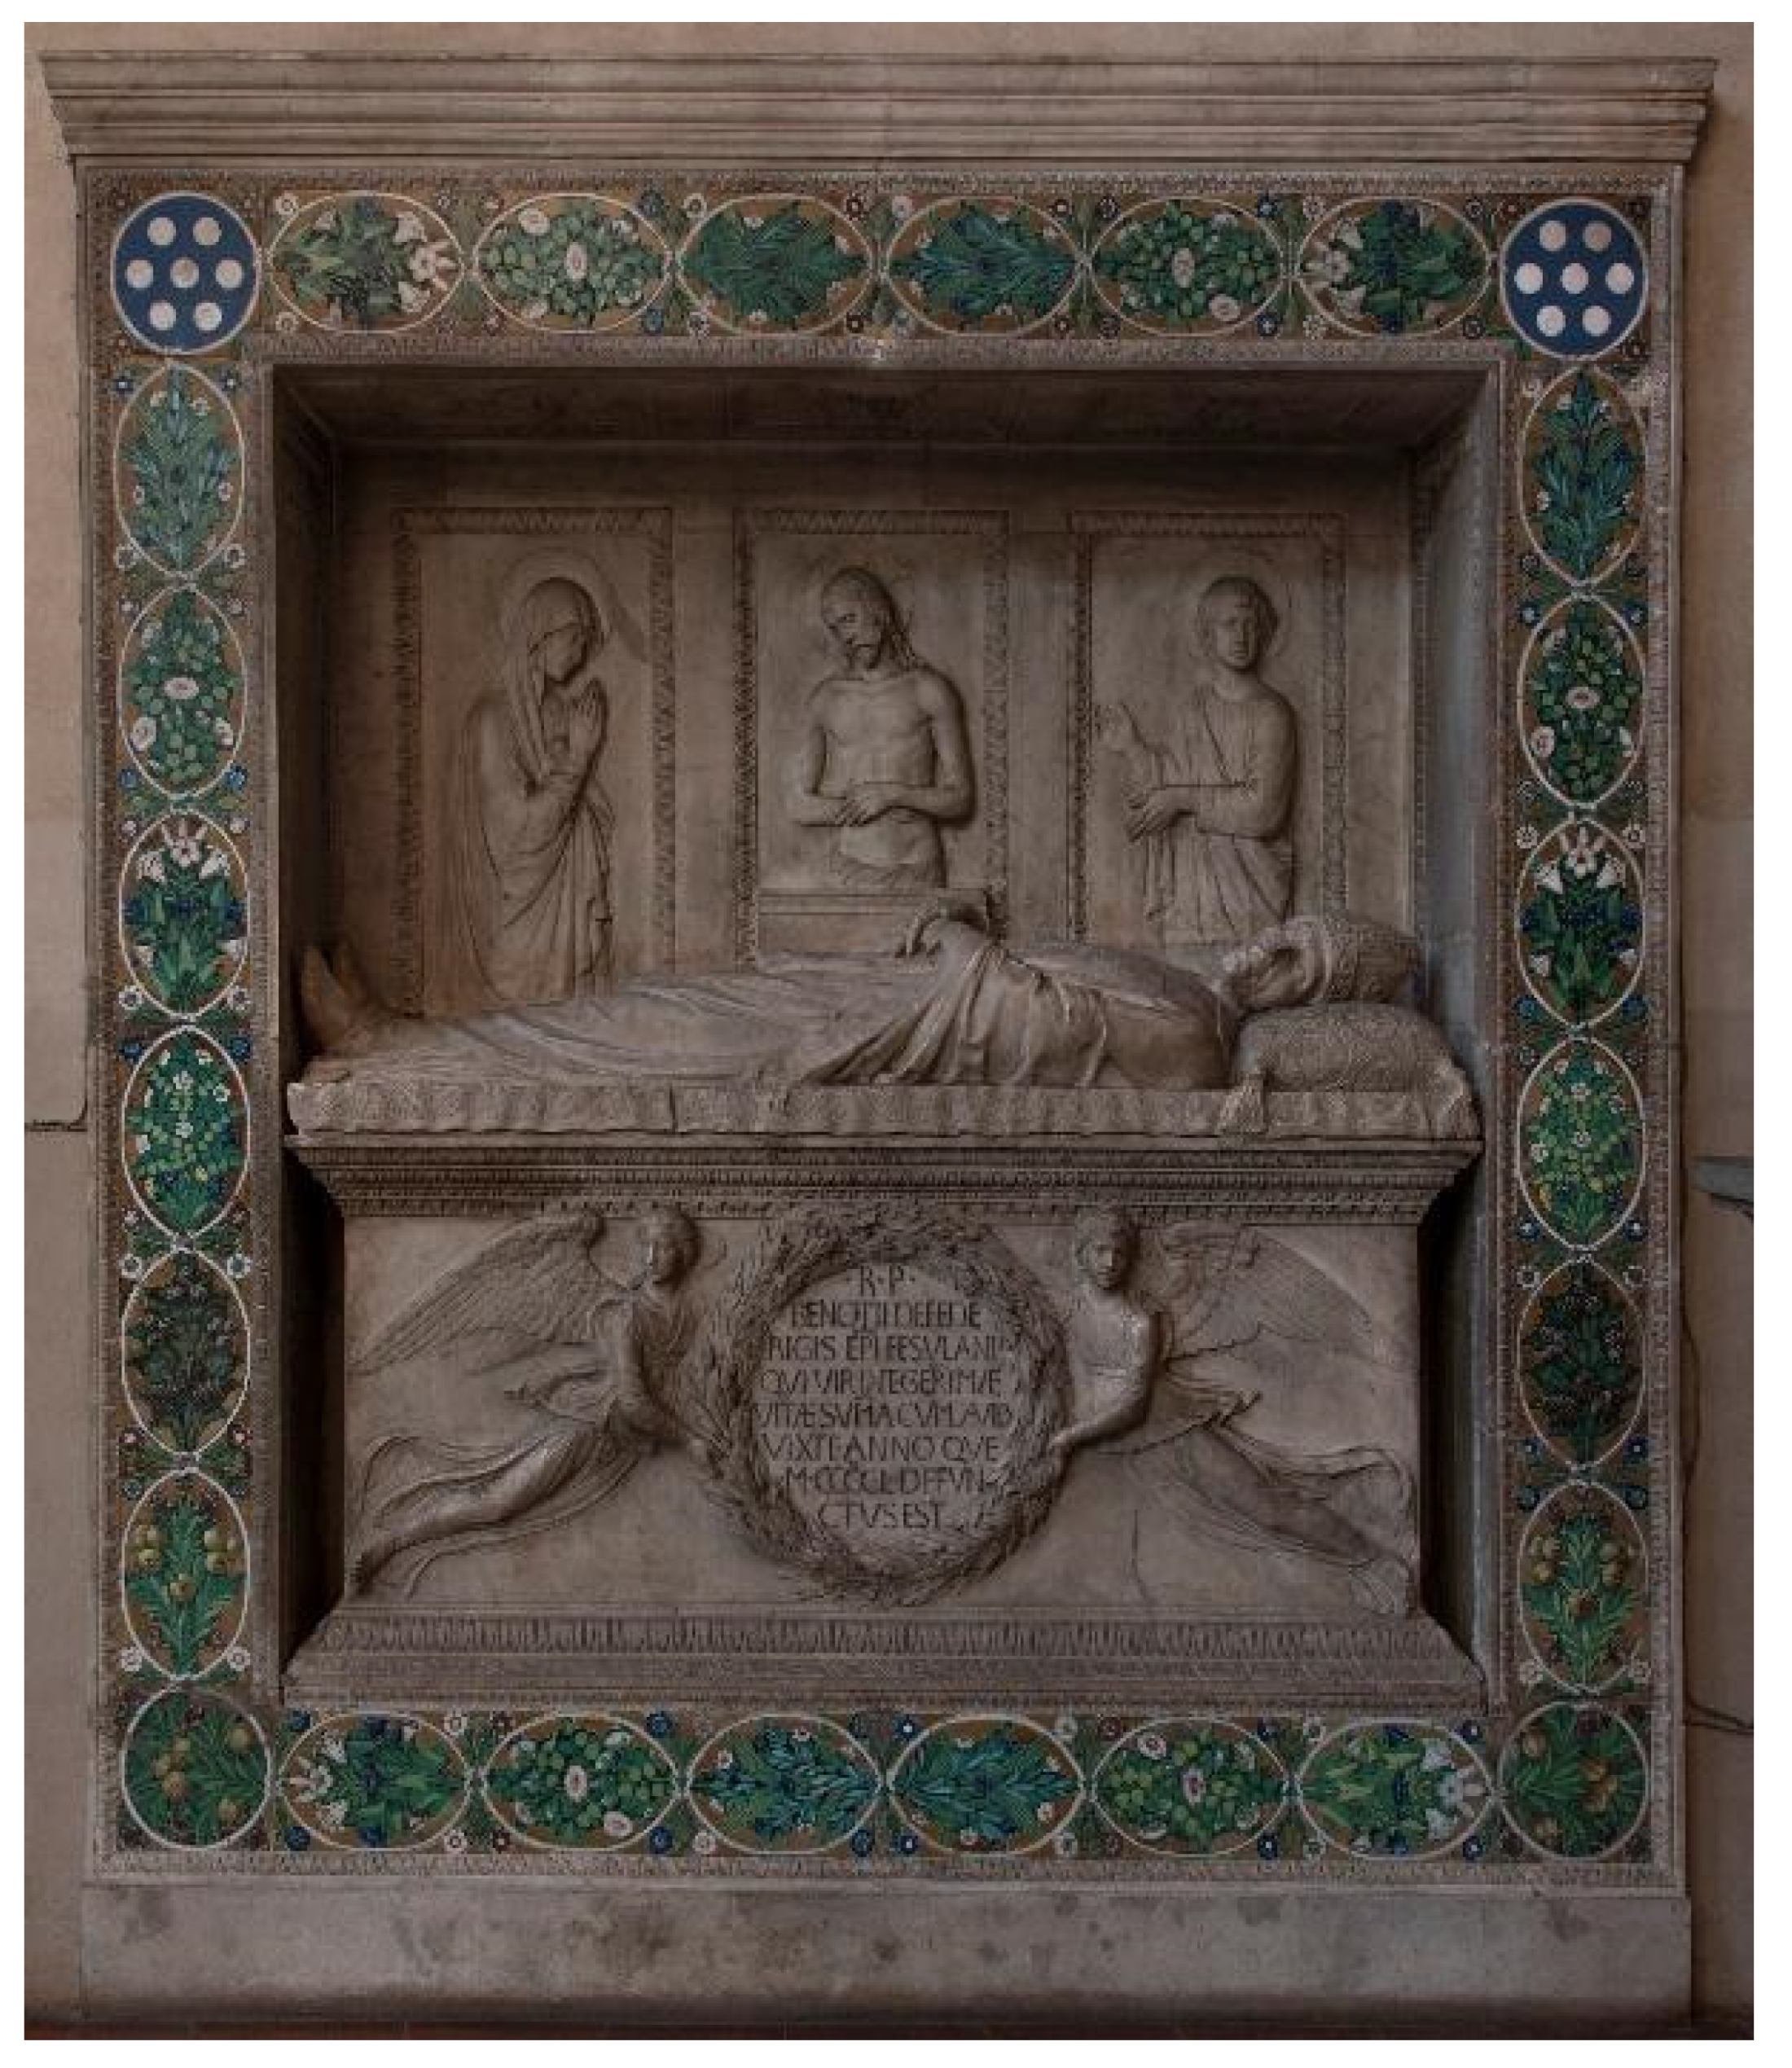
:1. Introduction
2. Materials and Methods
3. Results and Discussion
3.1. Coloured Glazes
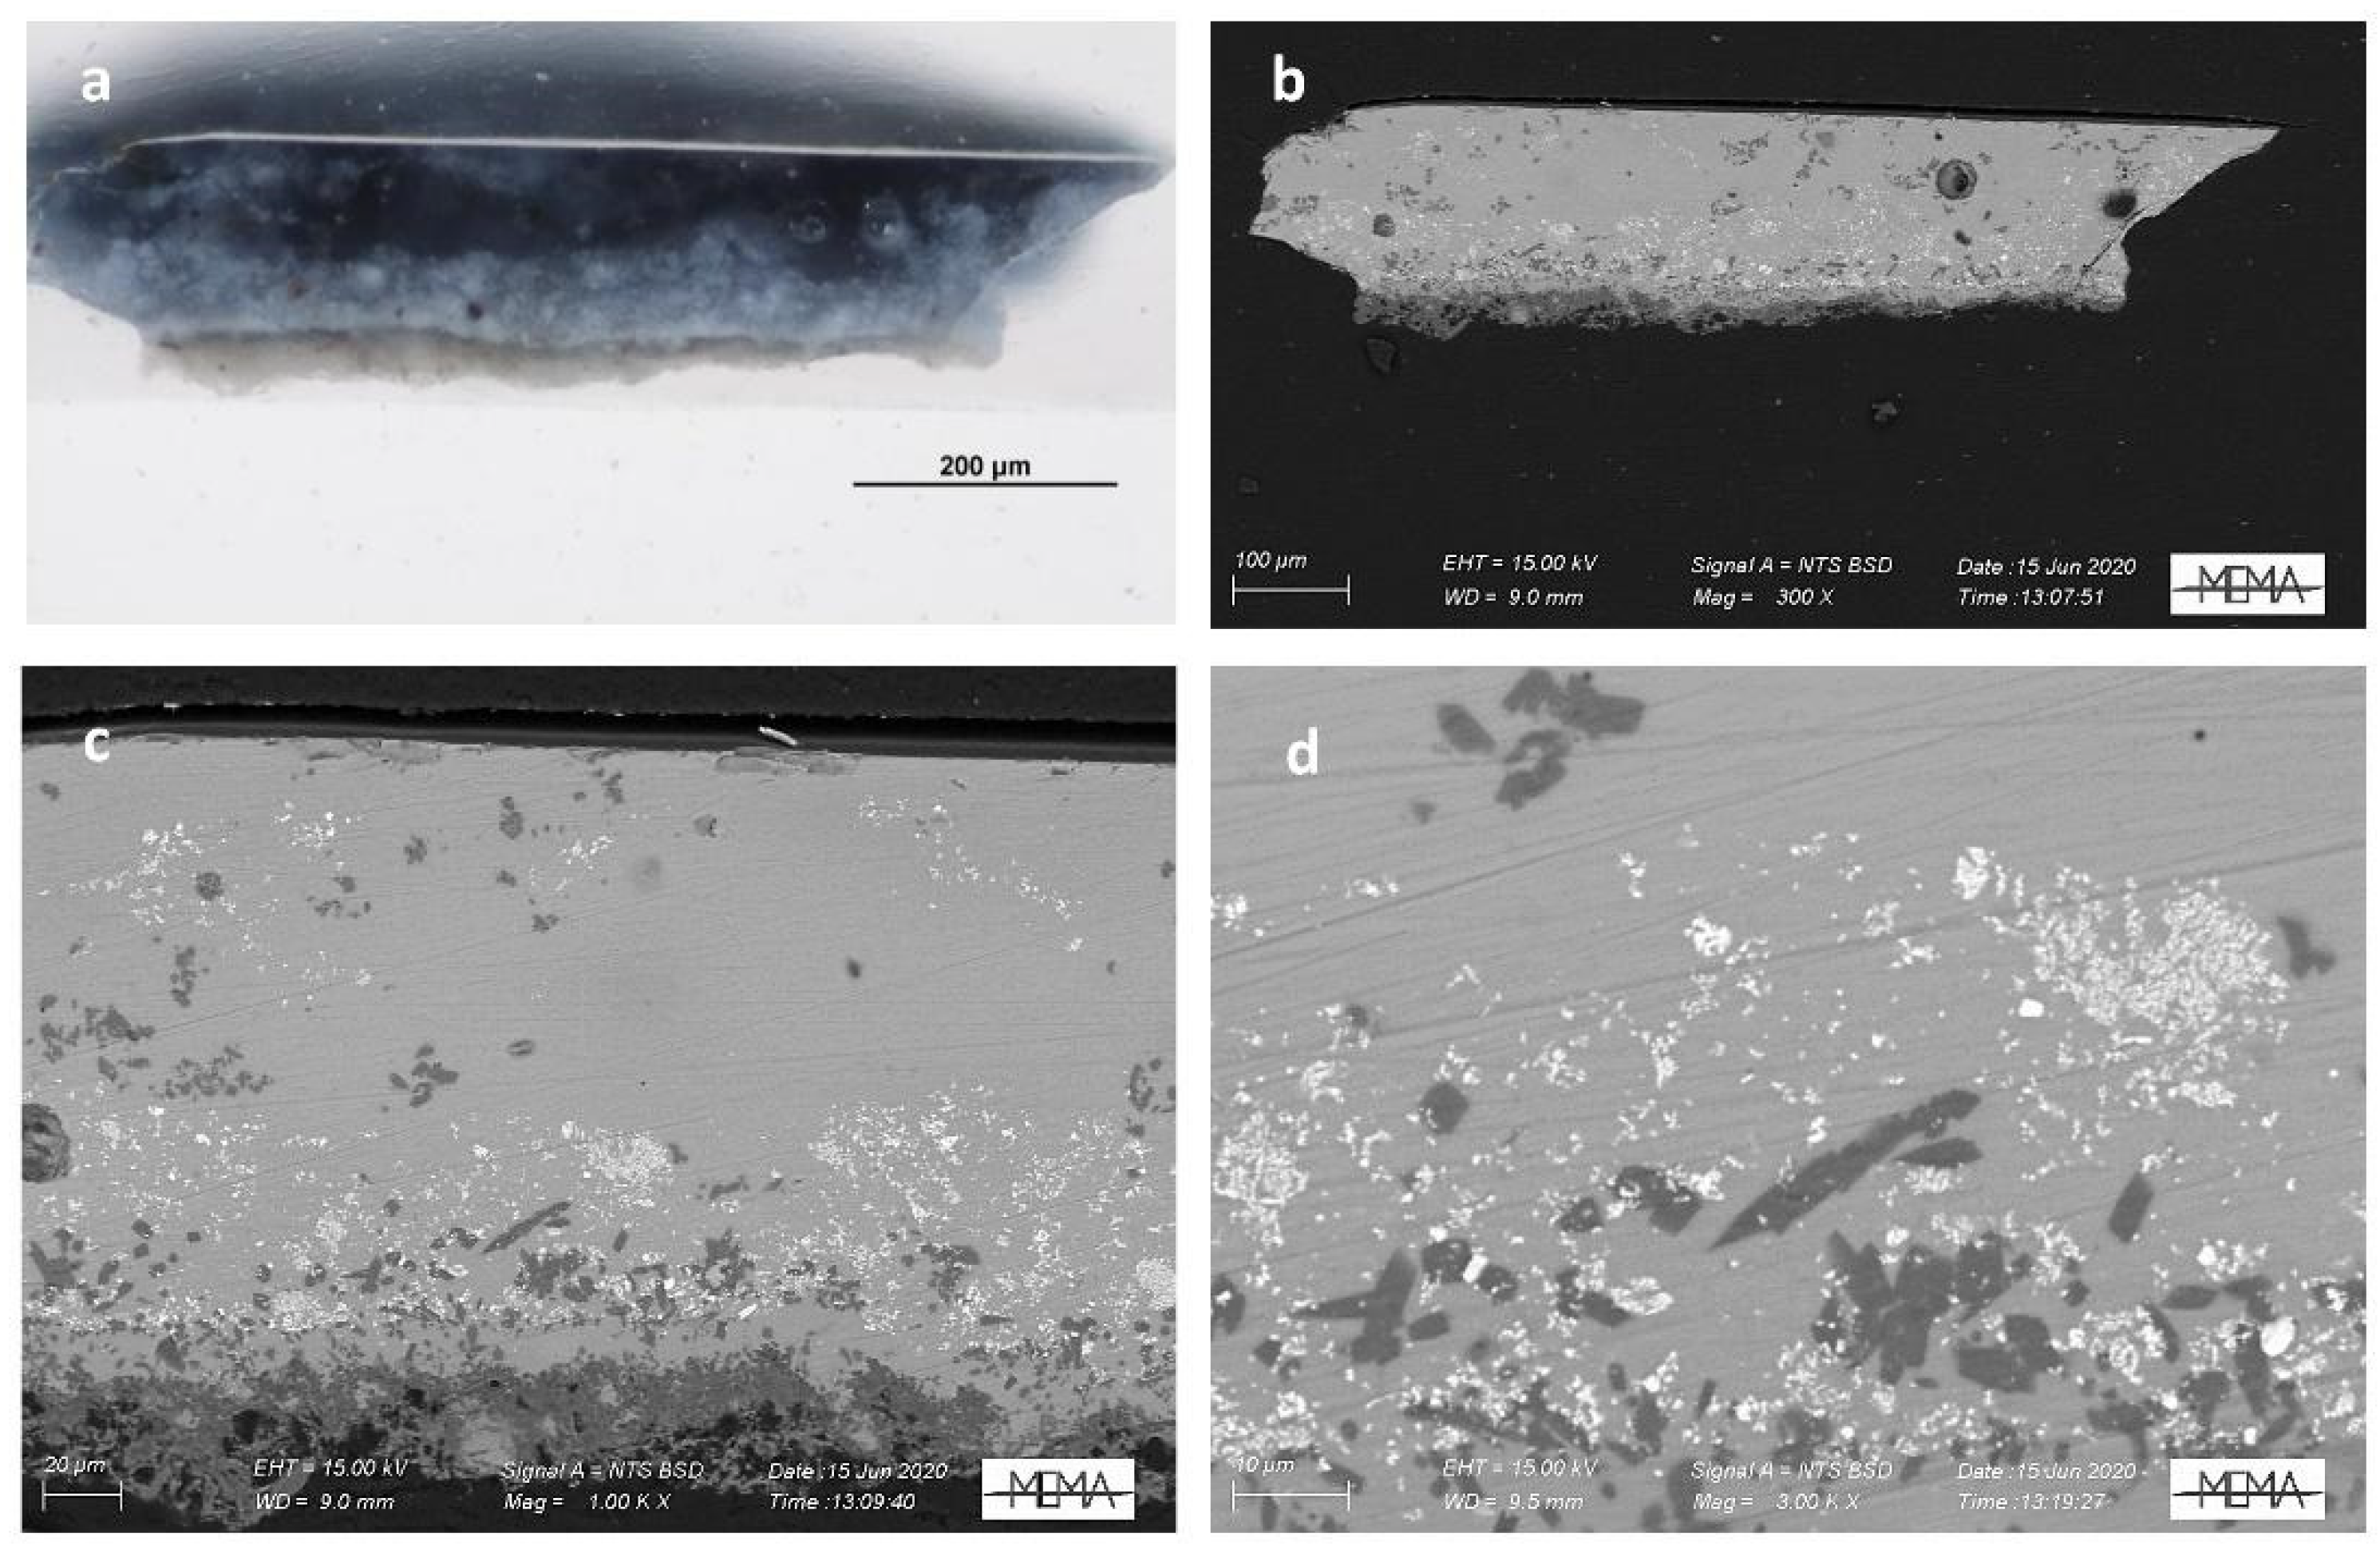
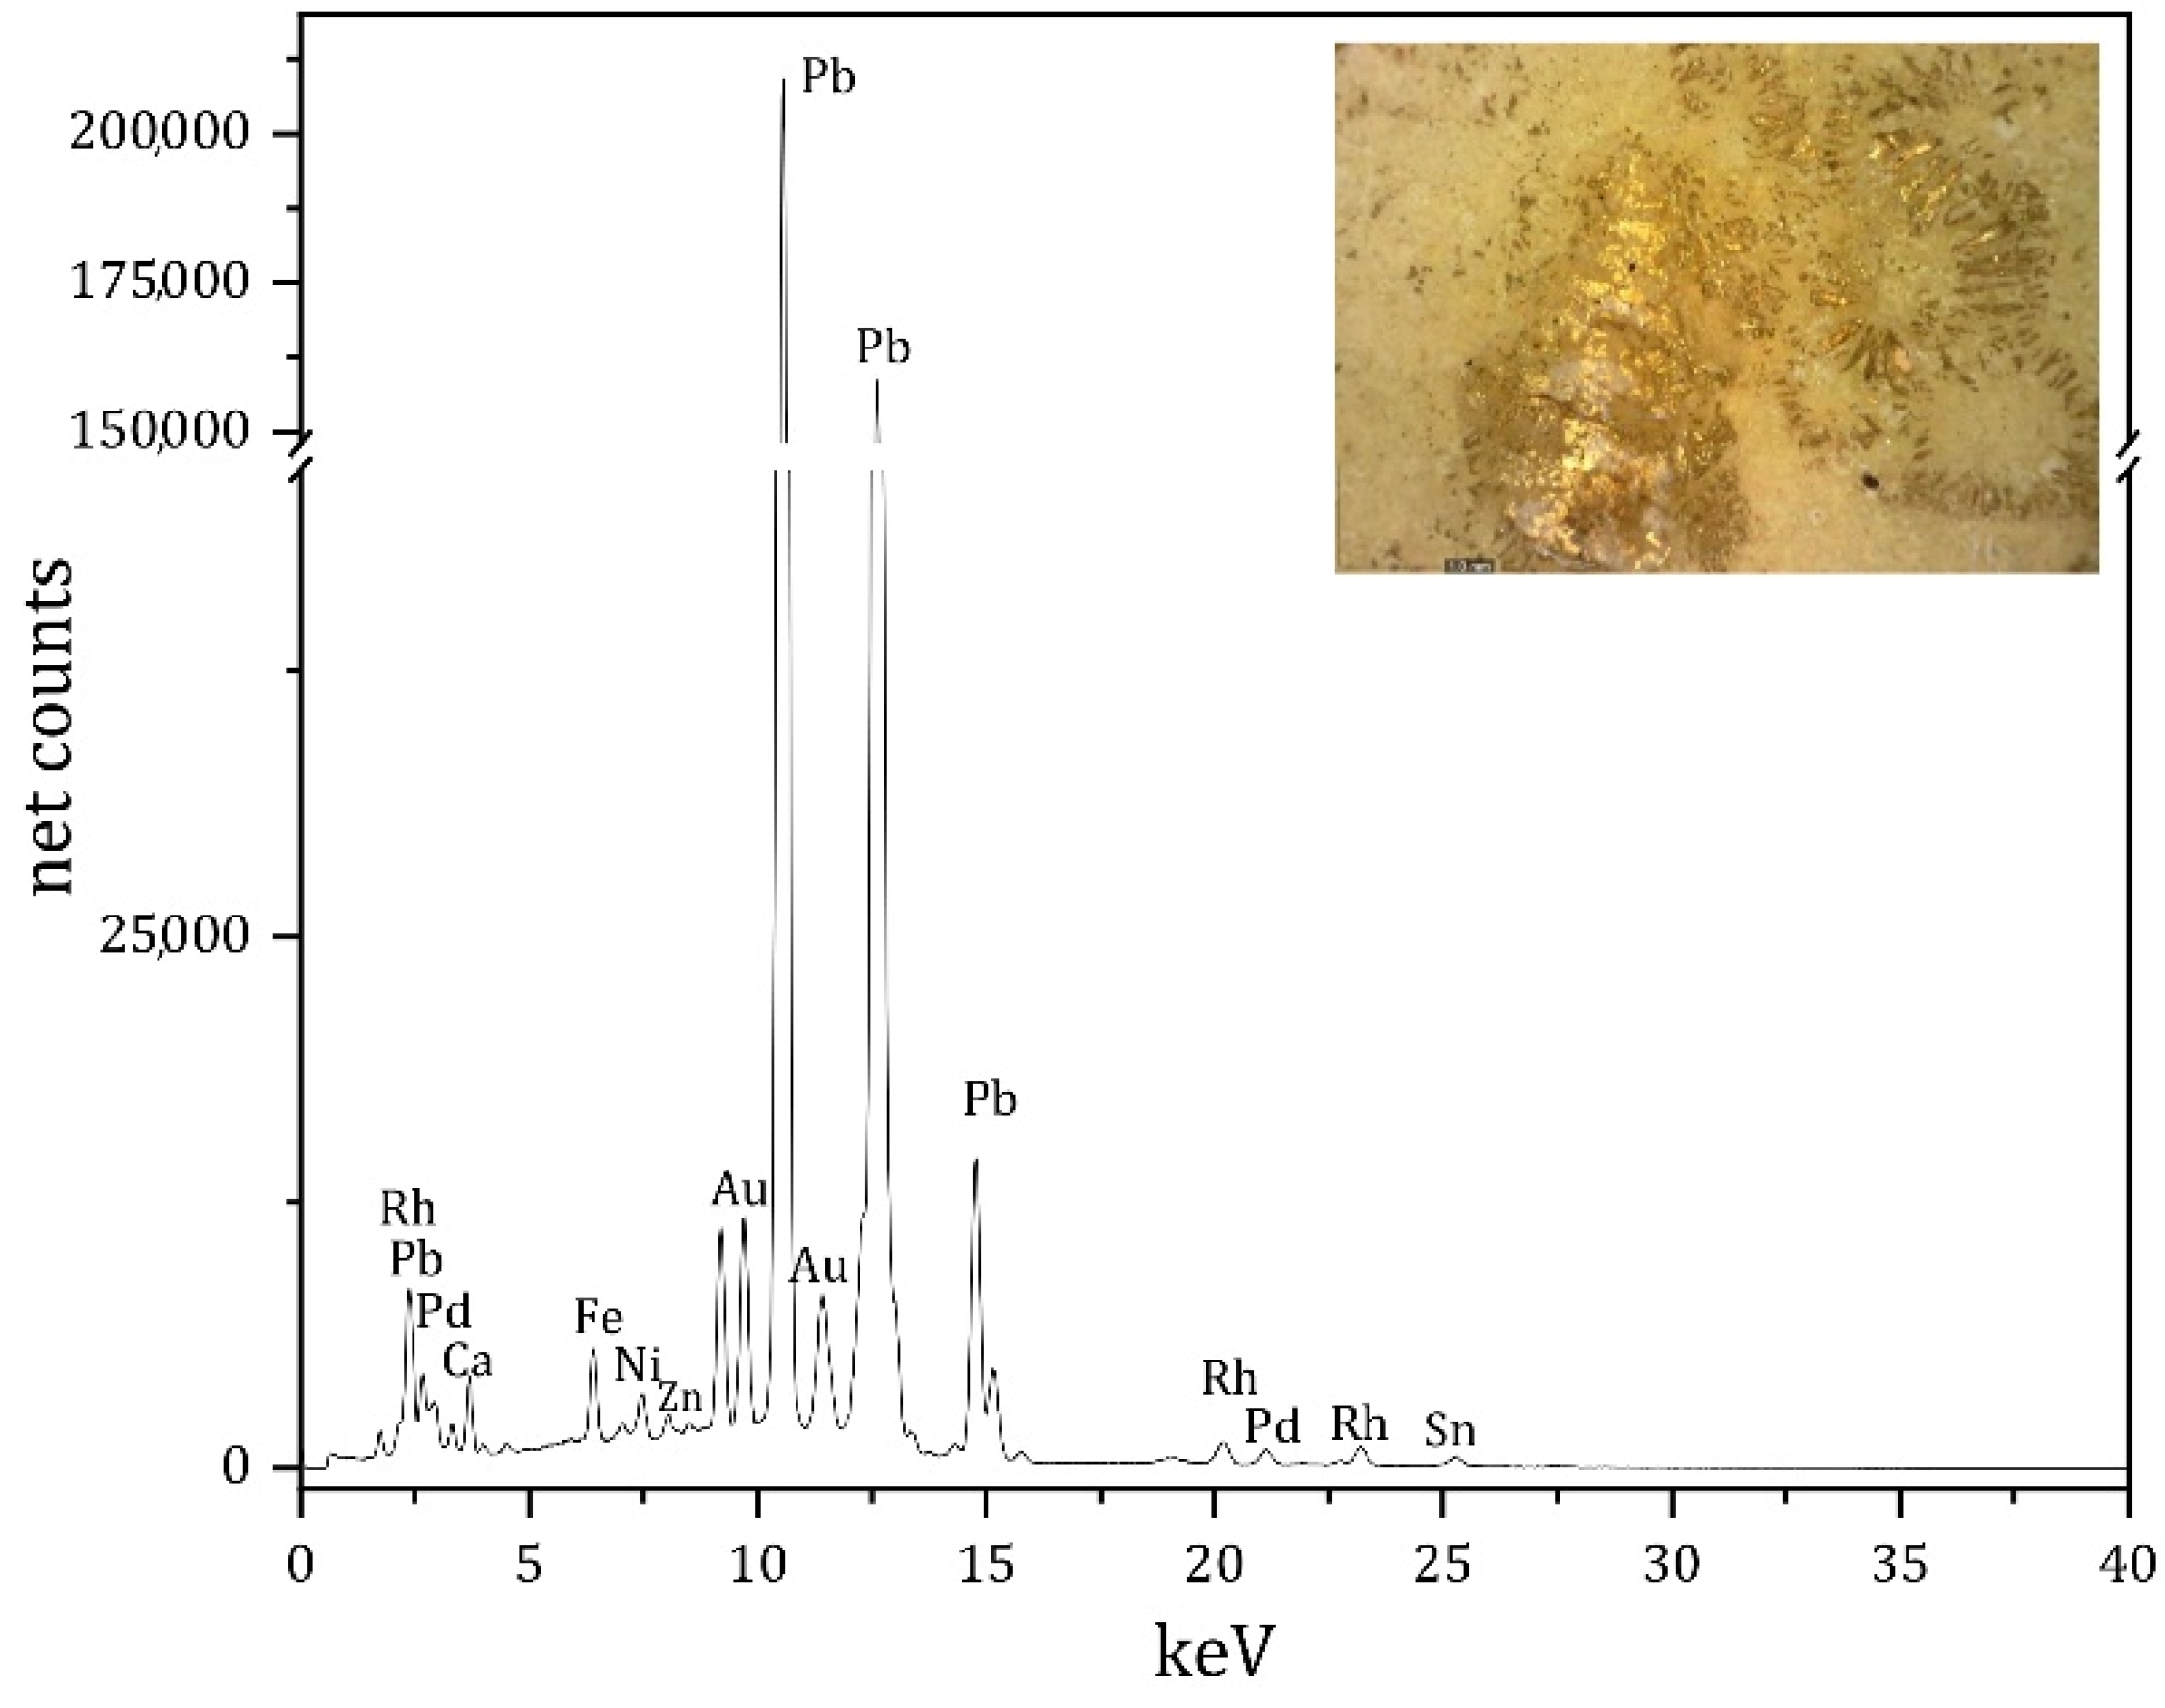
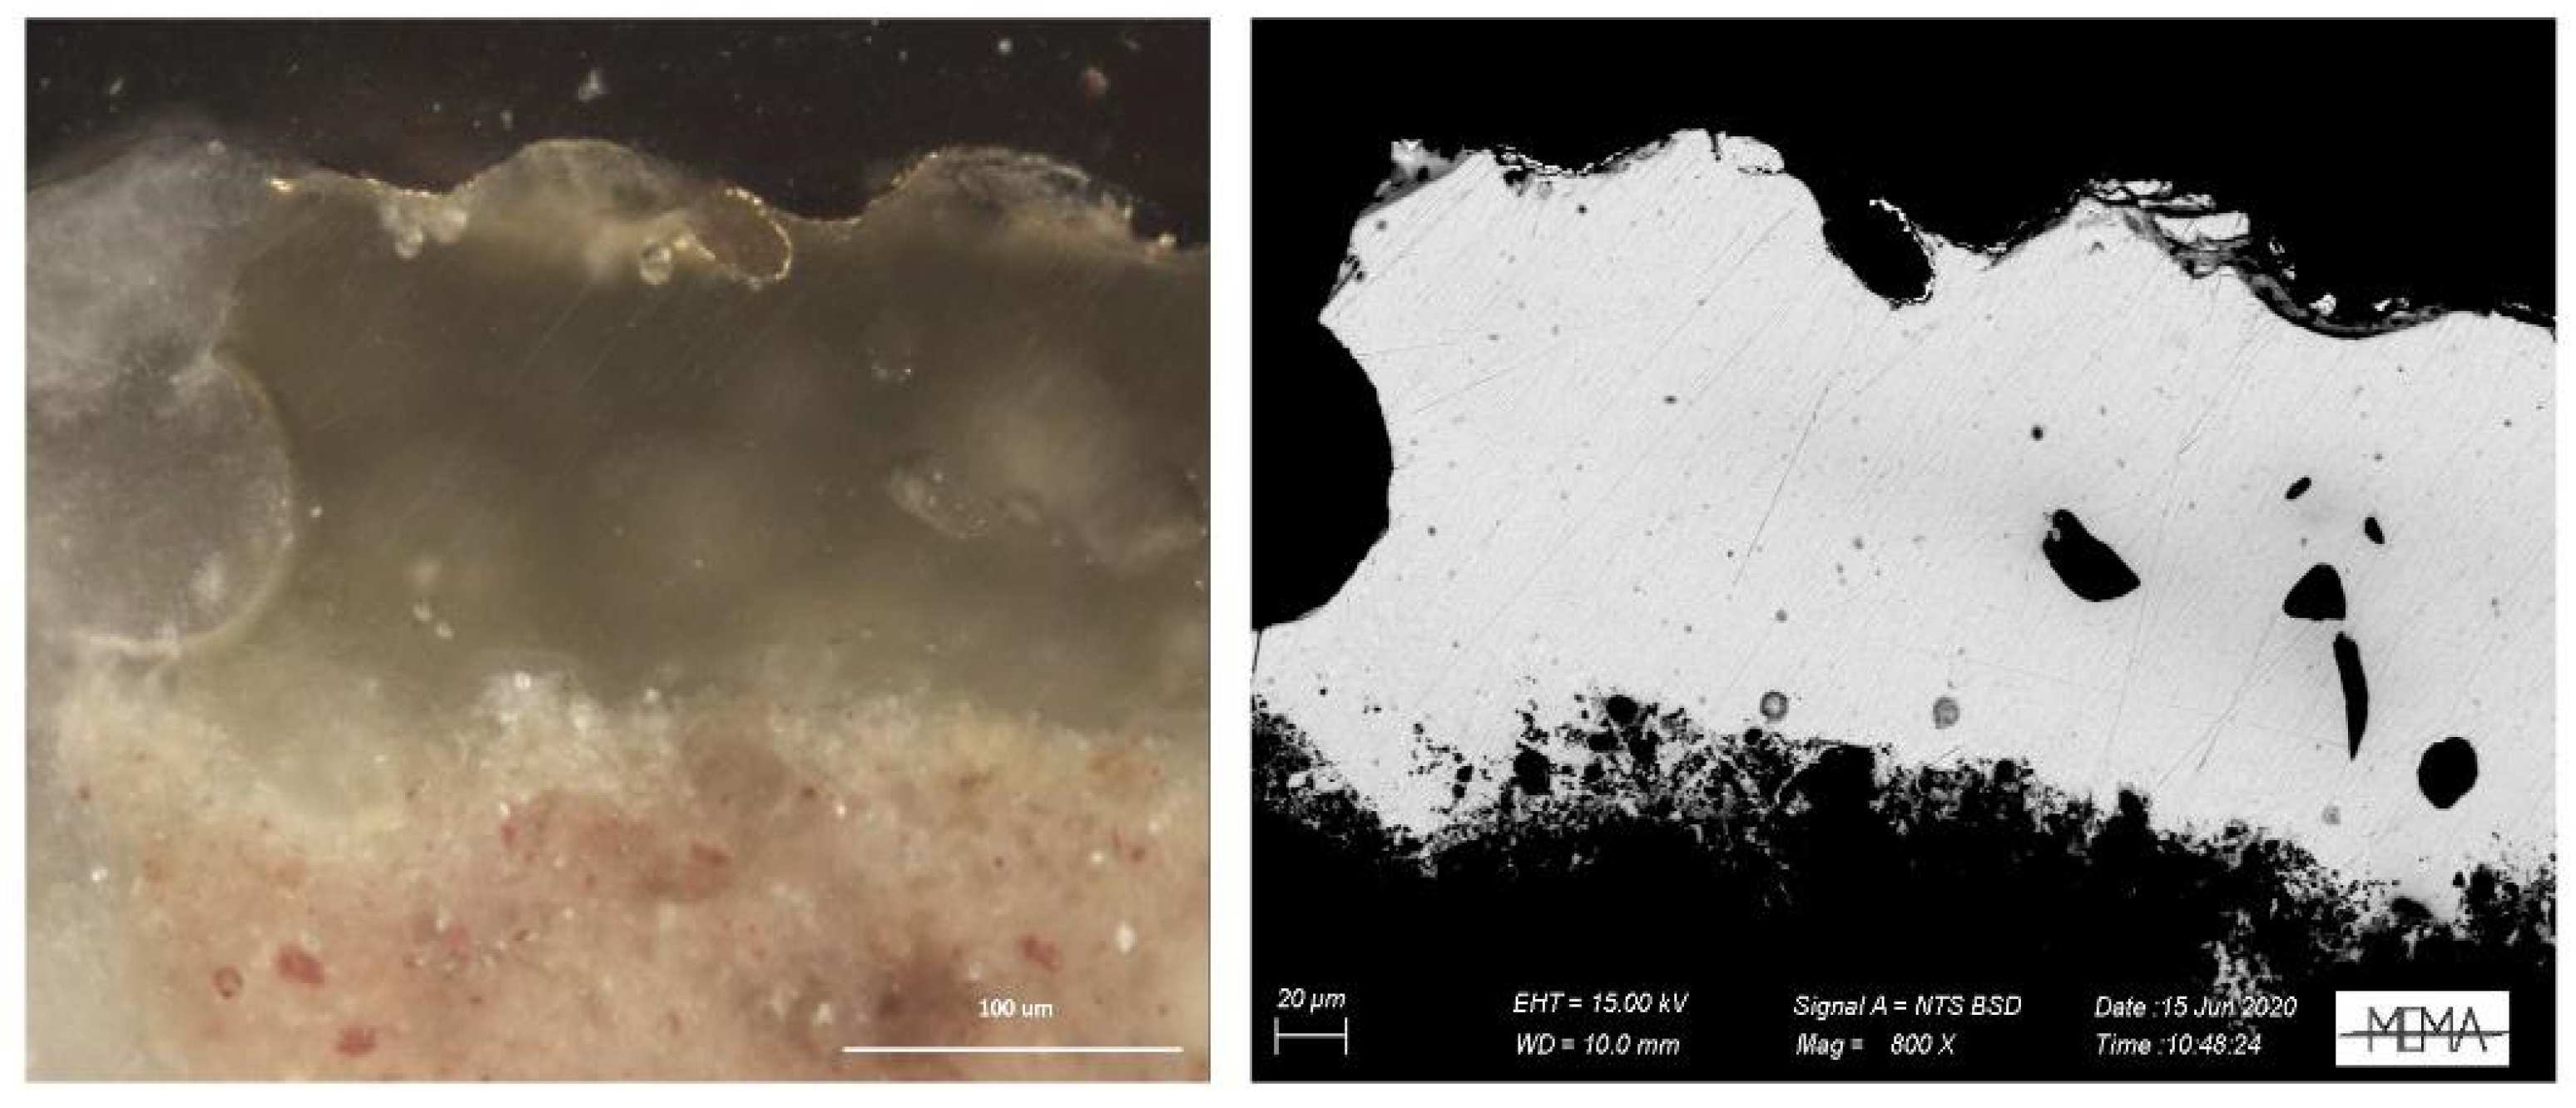
3.2. Gilding
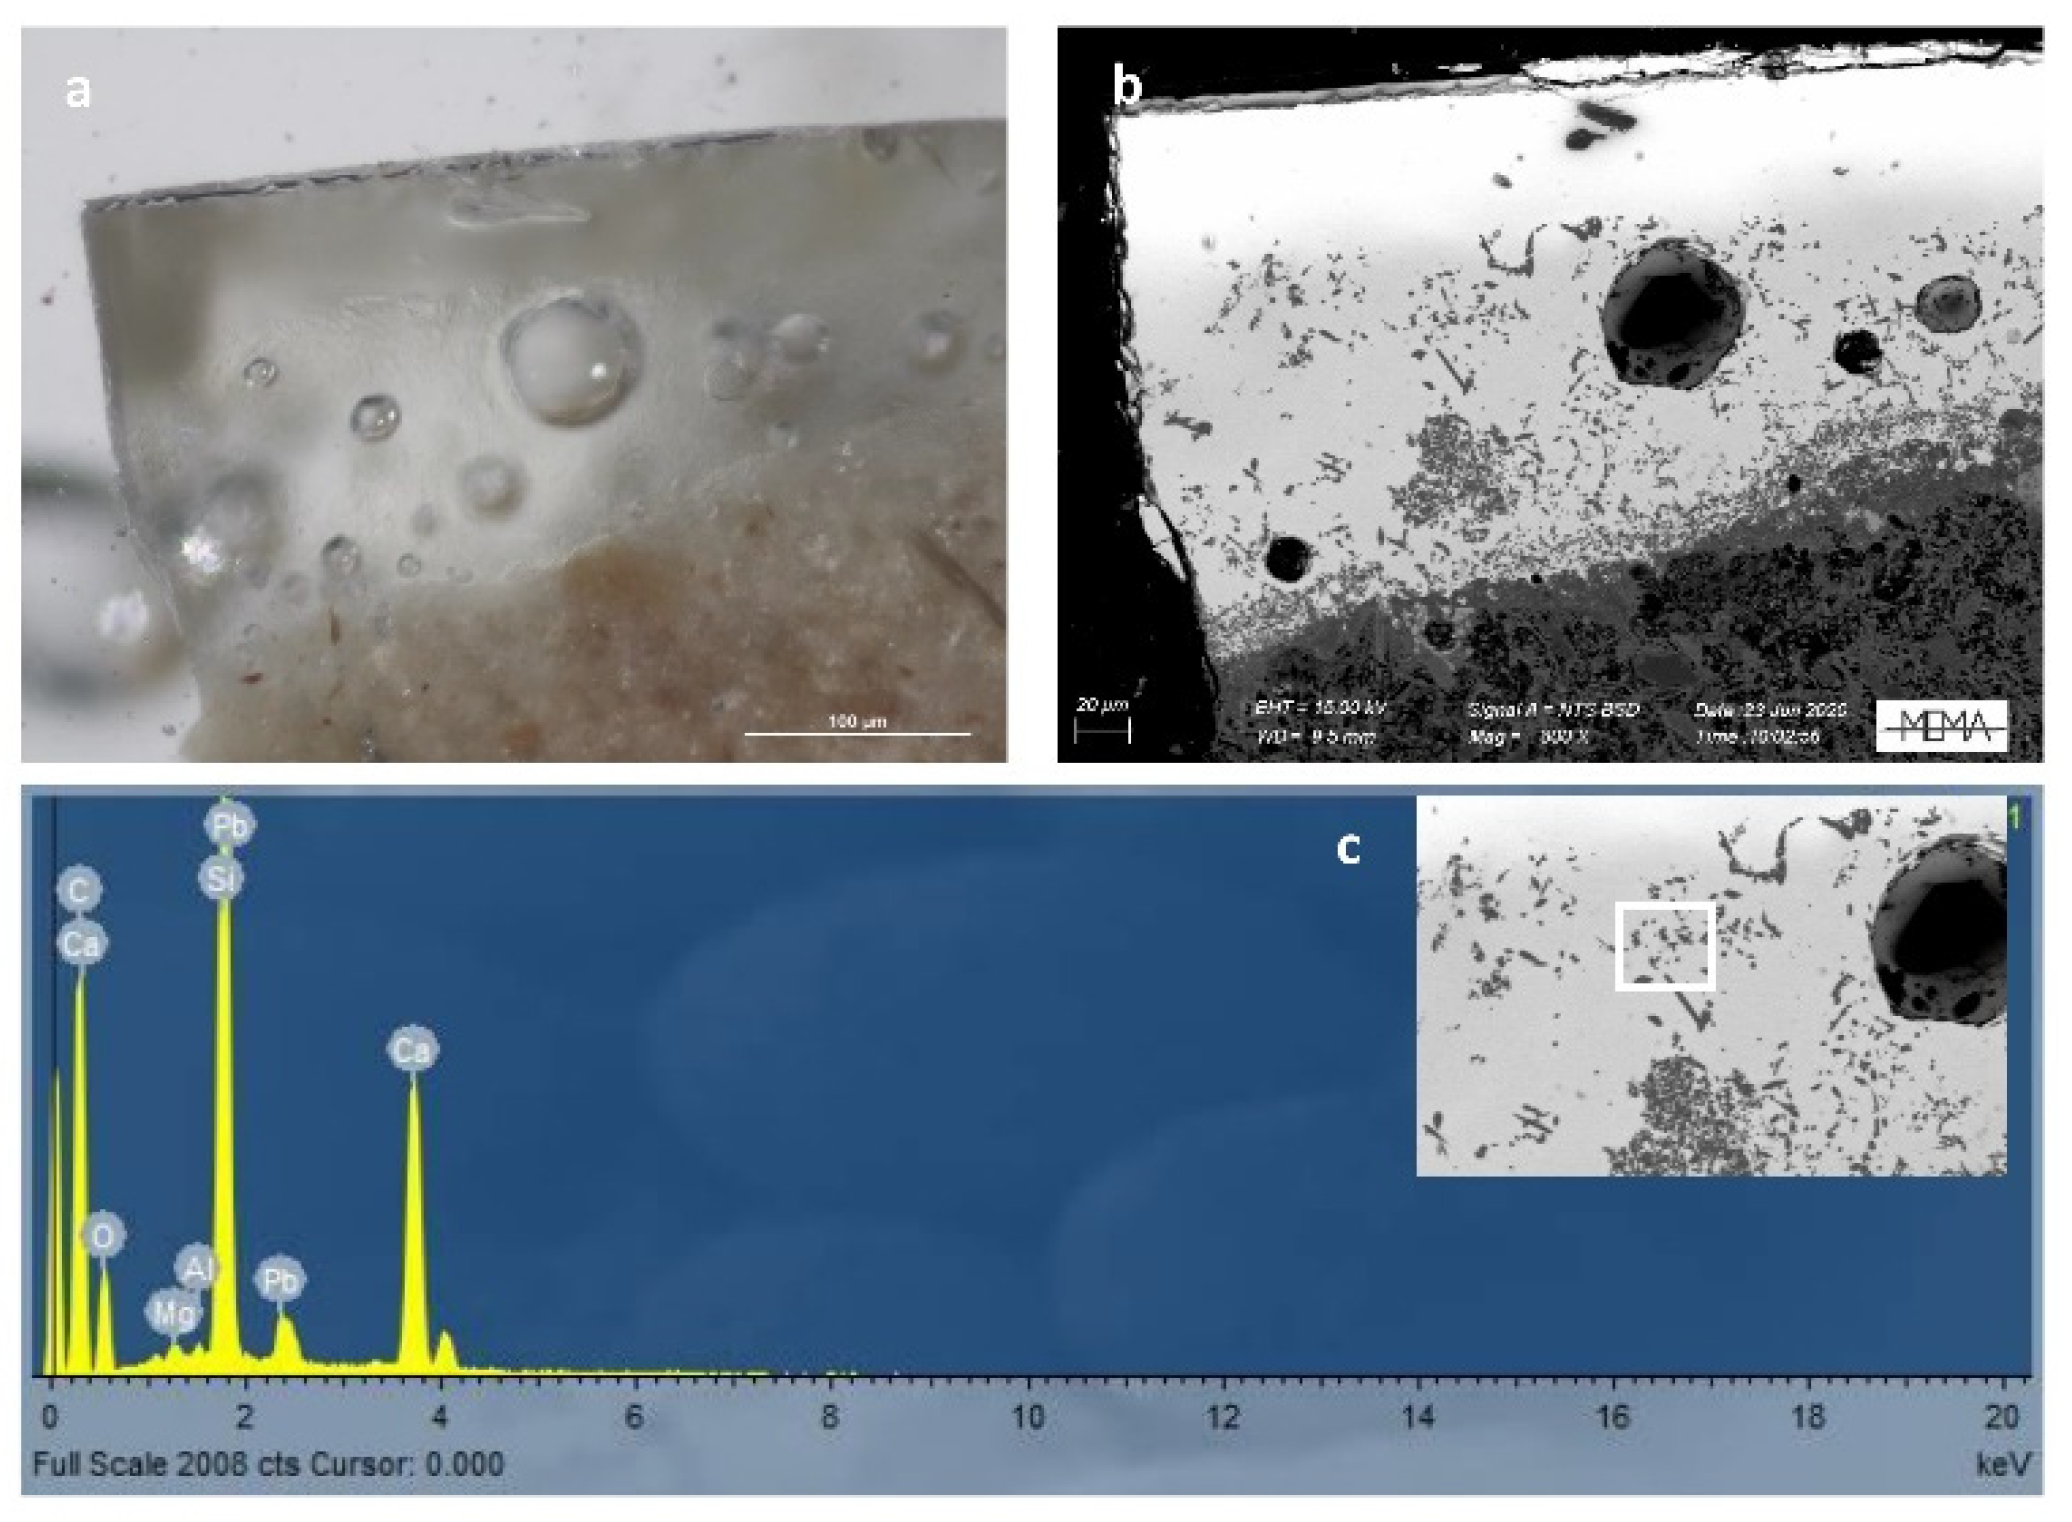
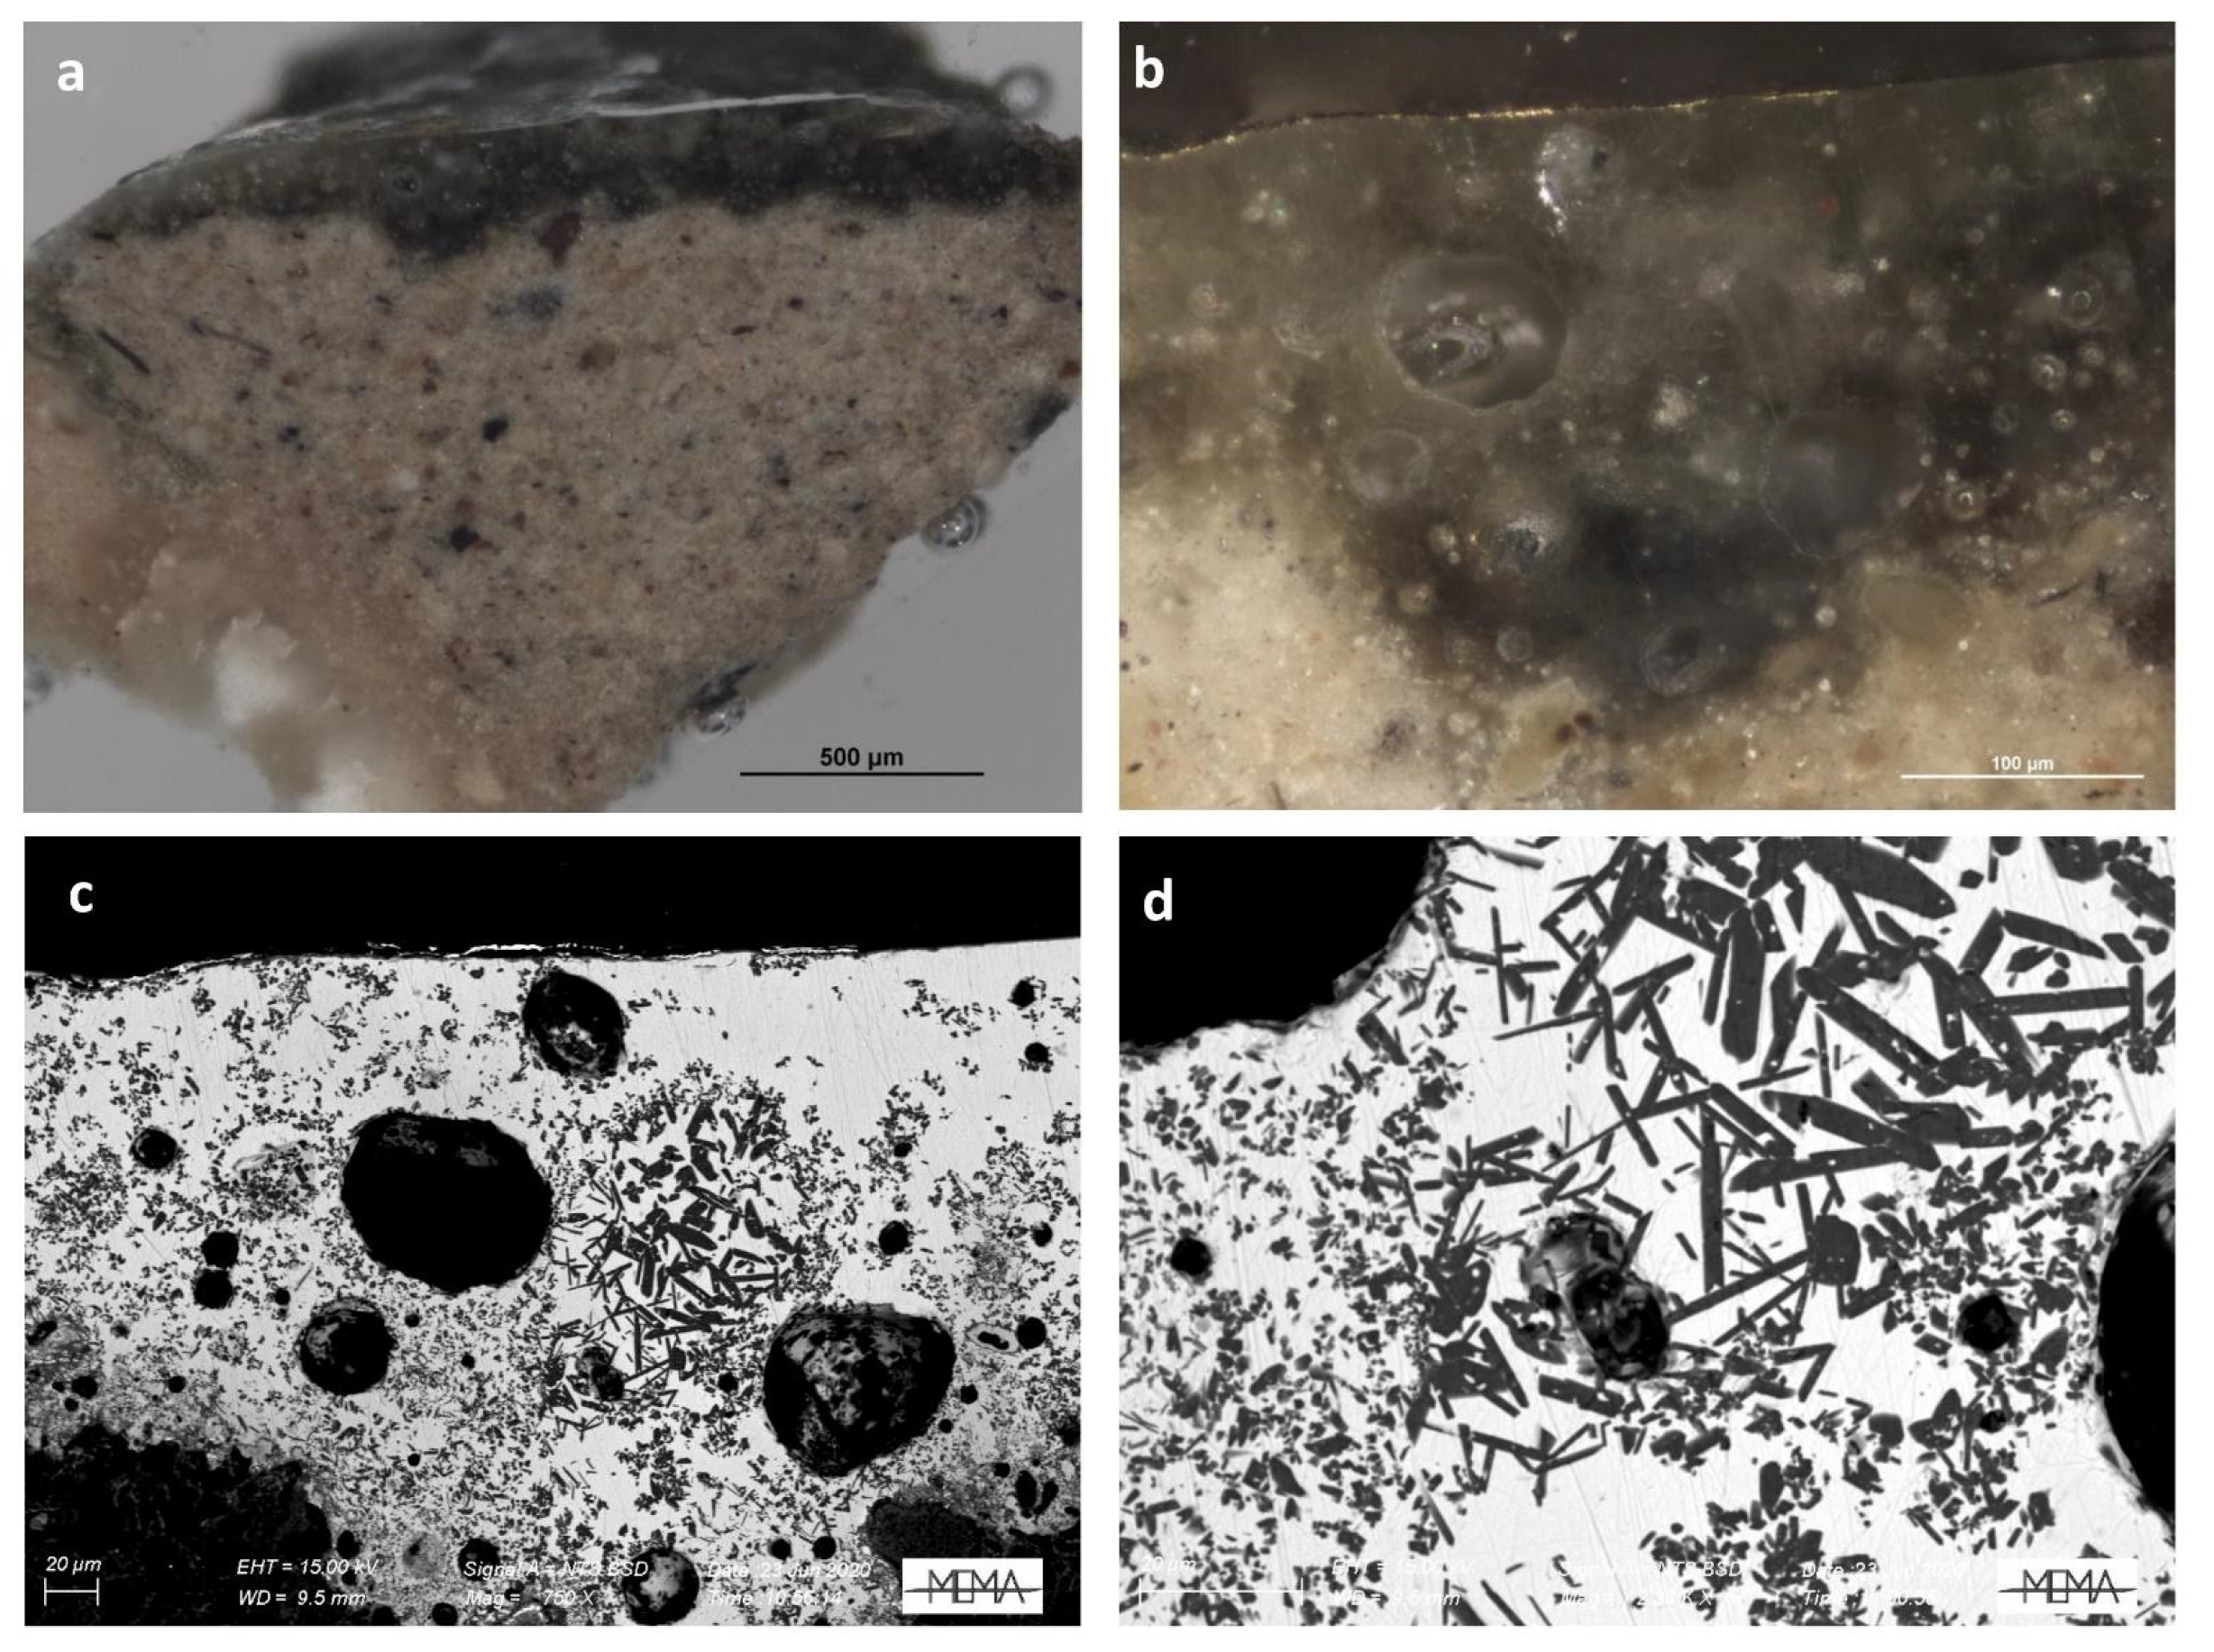
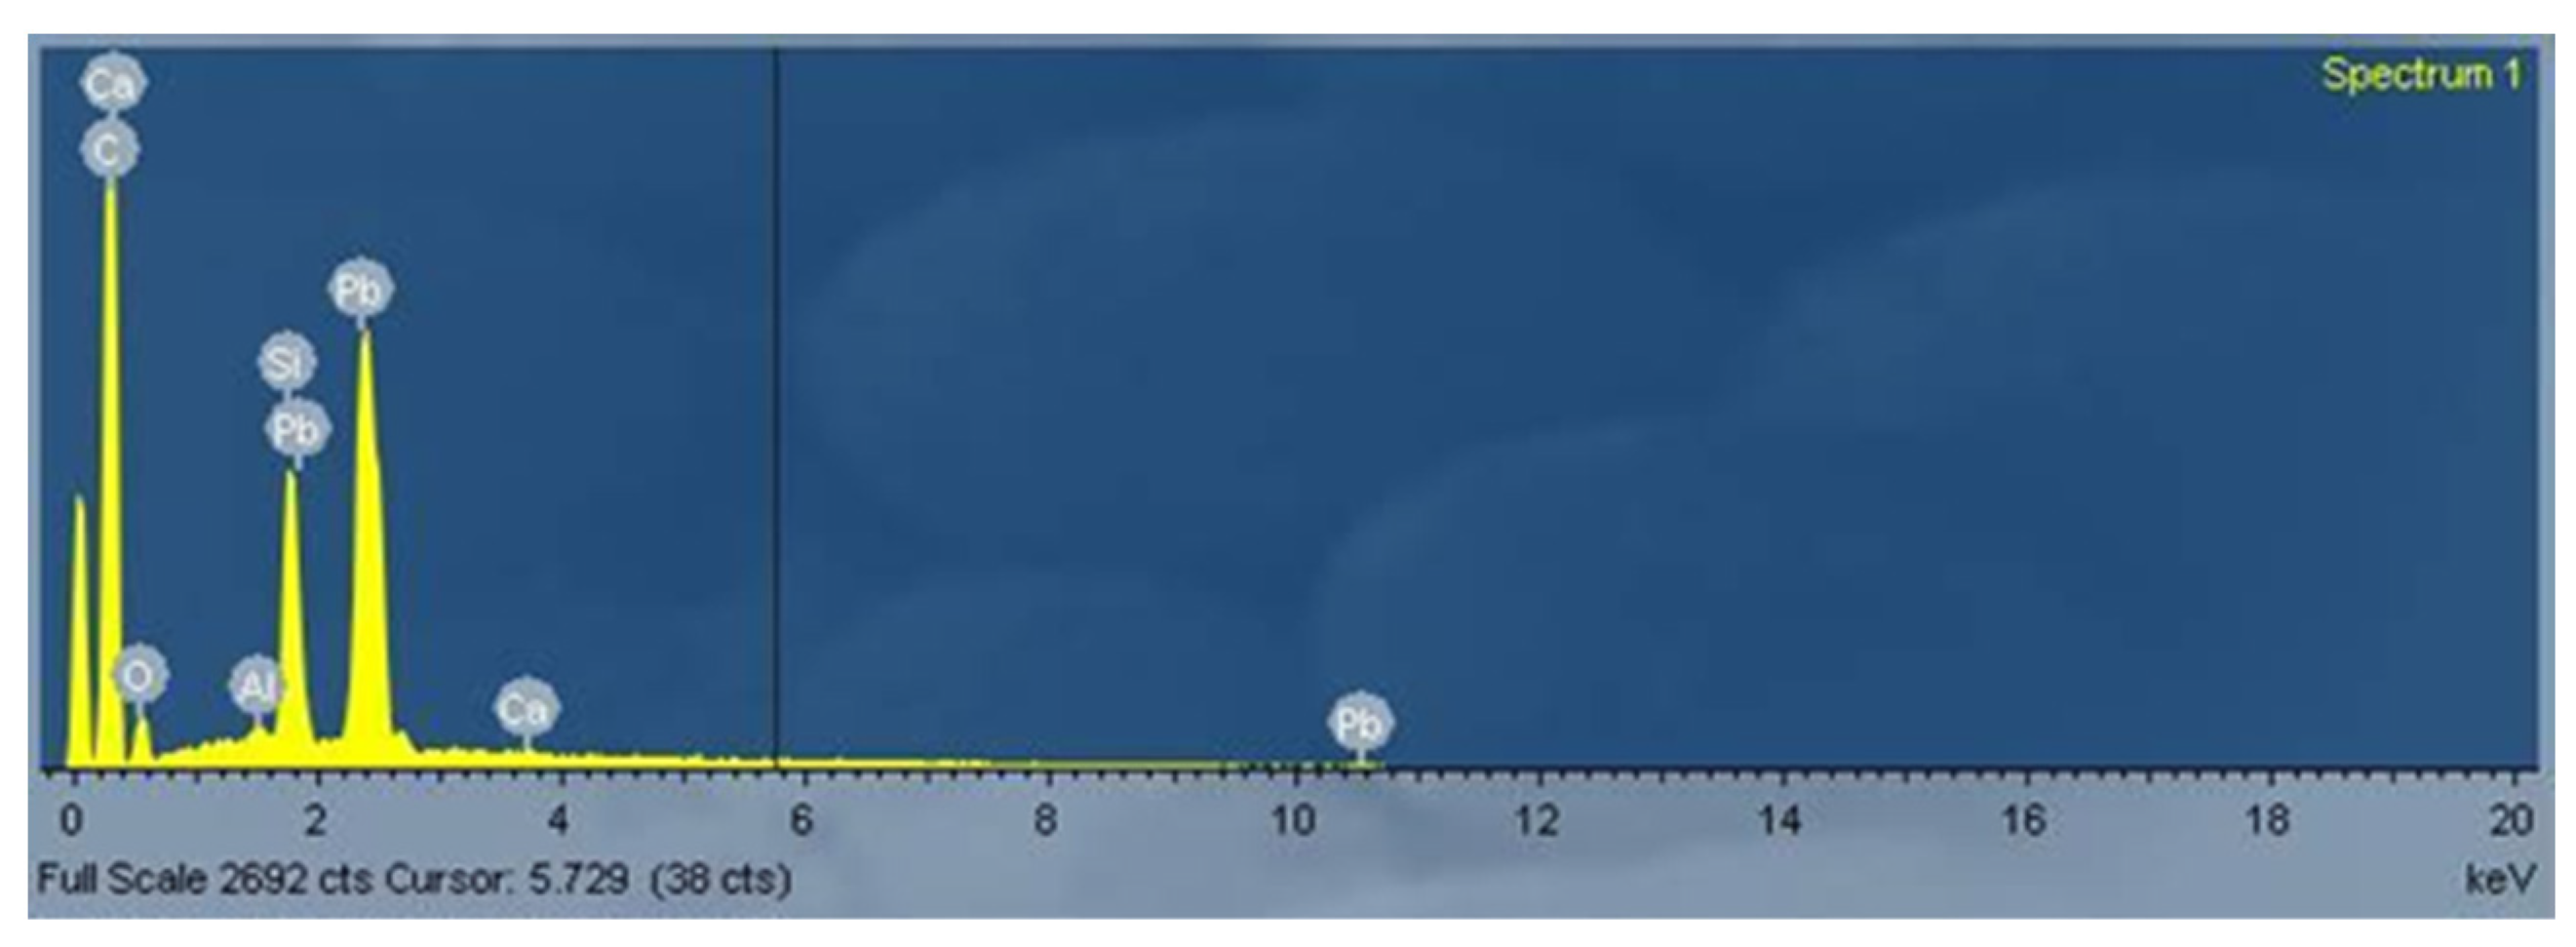
3.3. Glazes Composition of Gilded Tiles
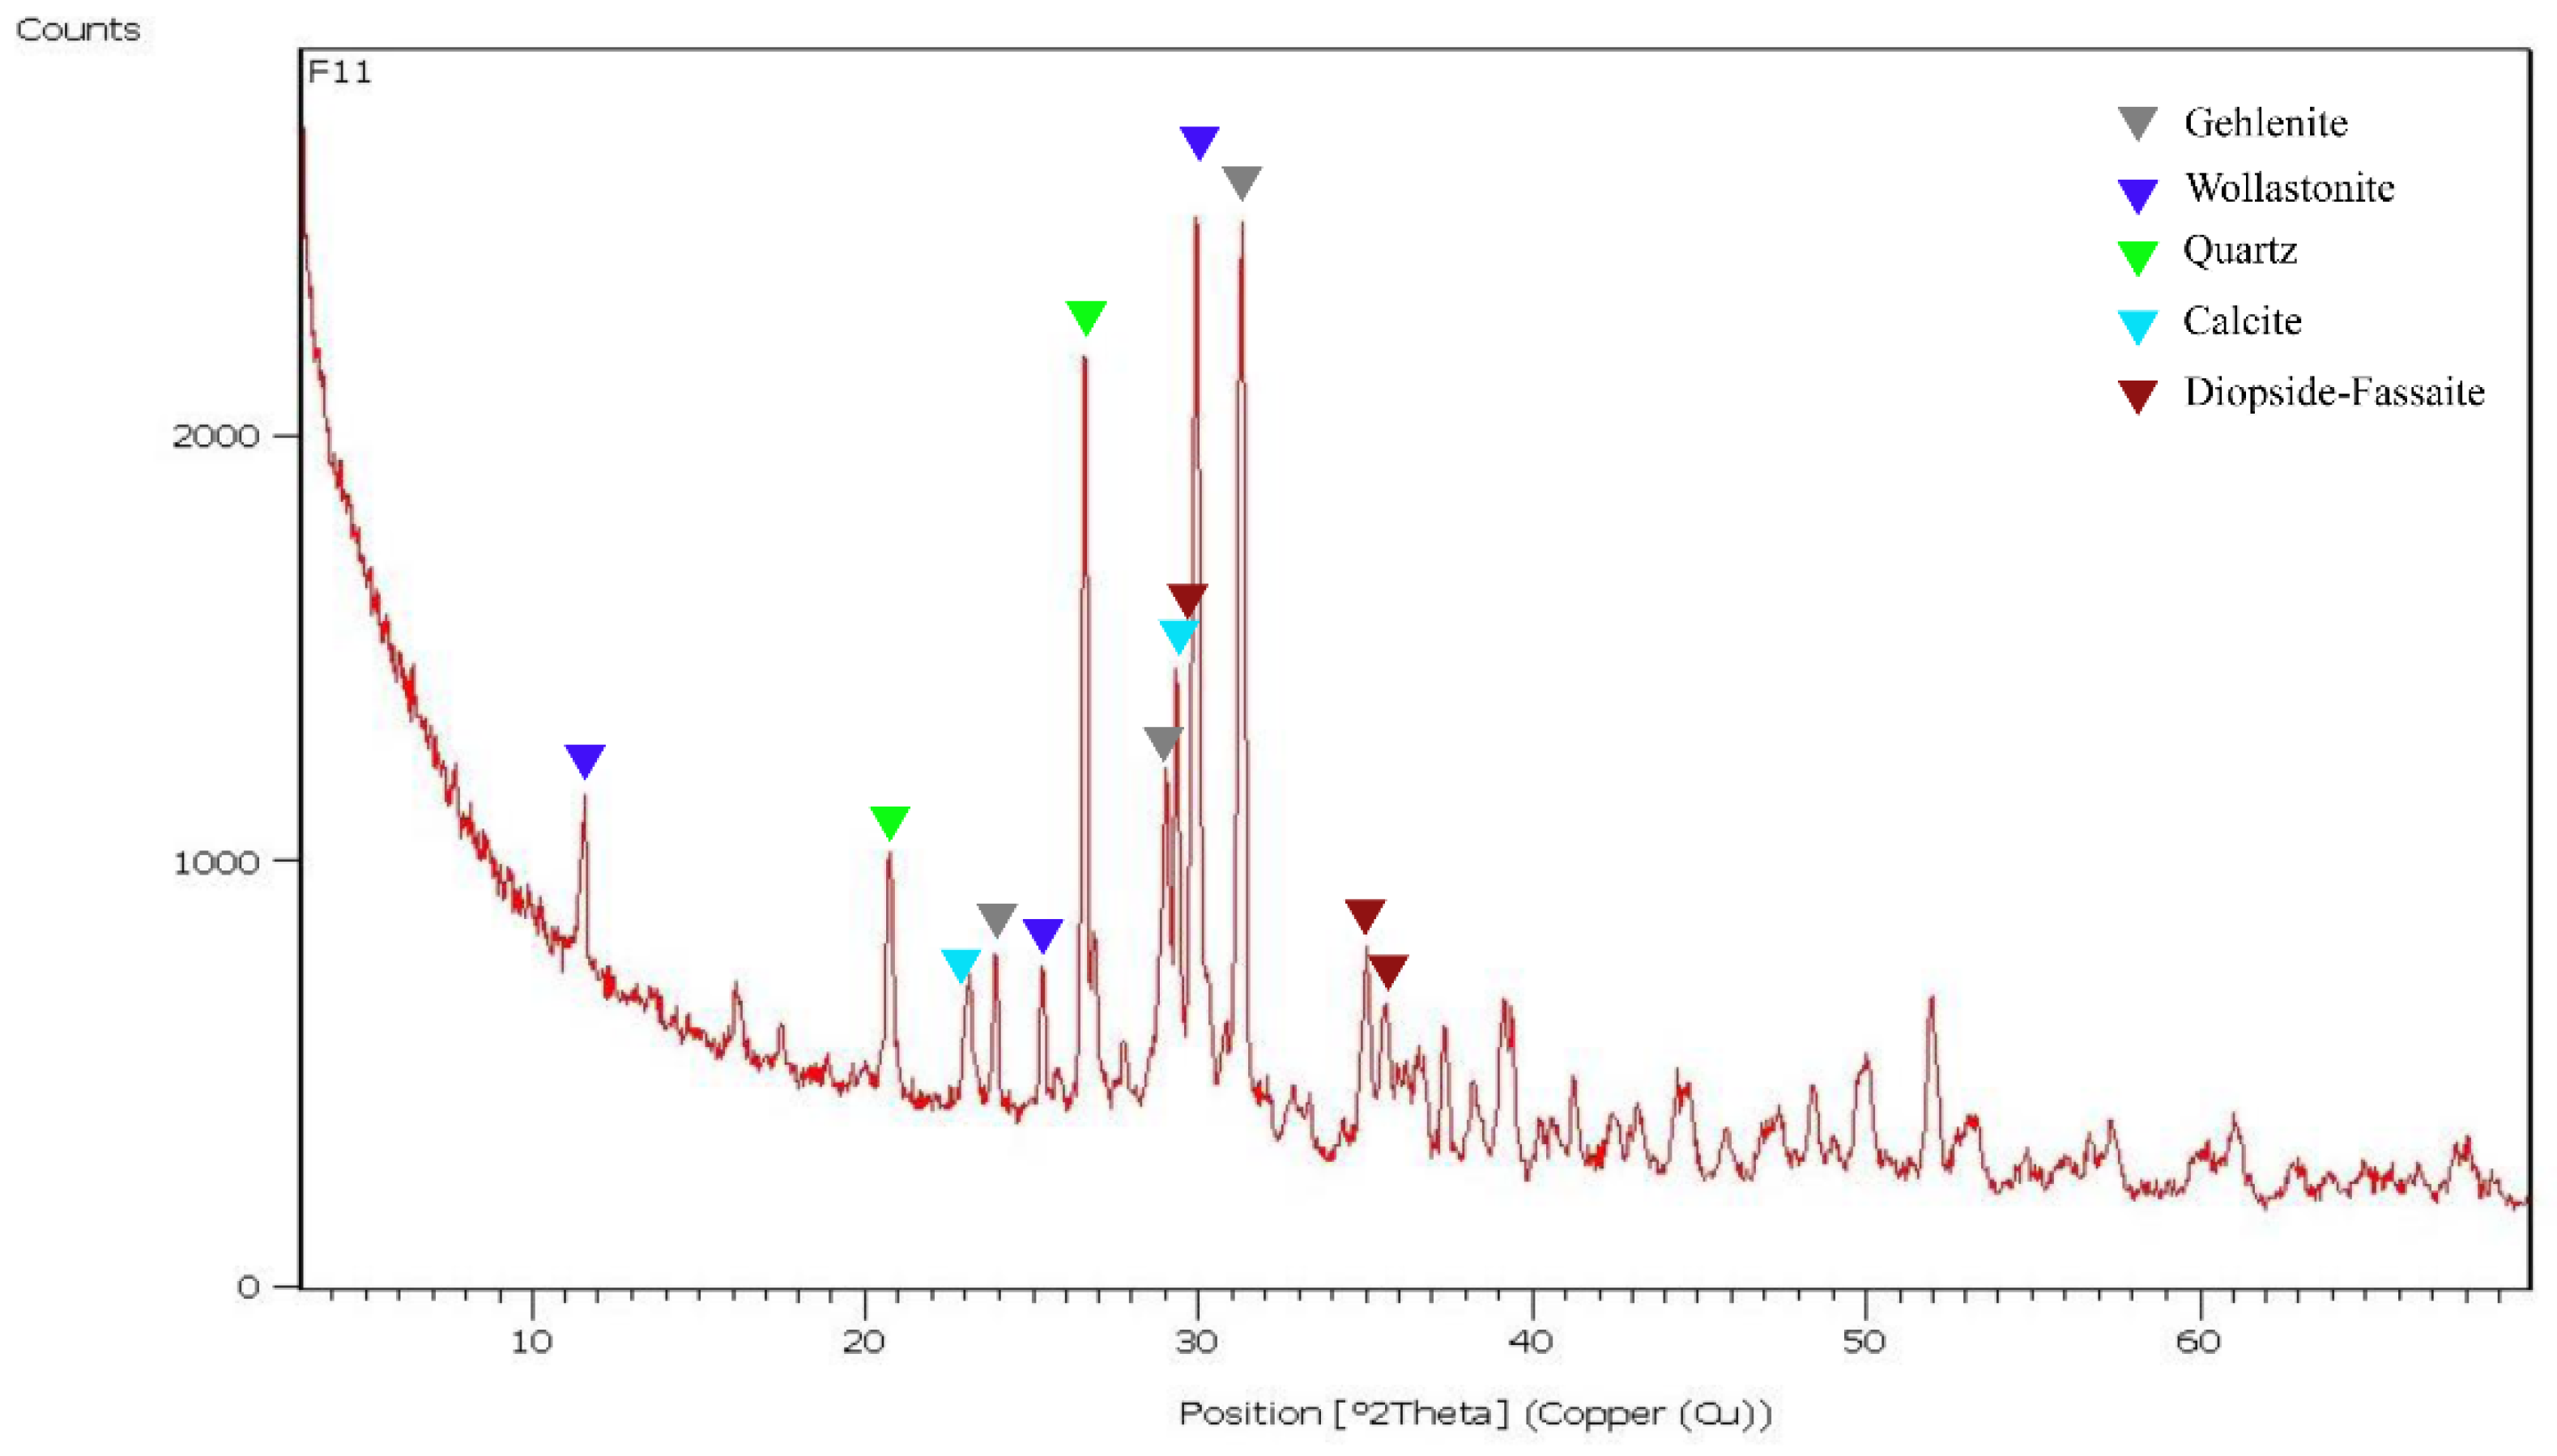
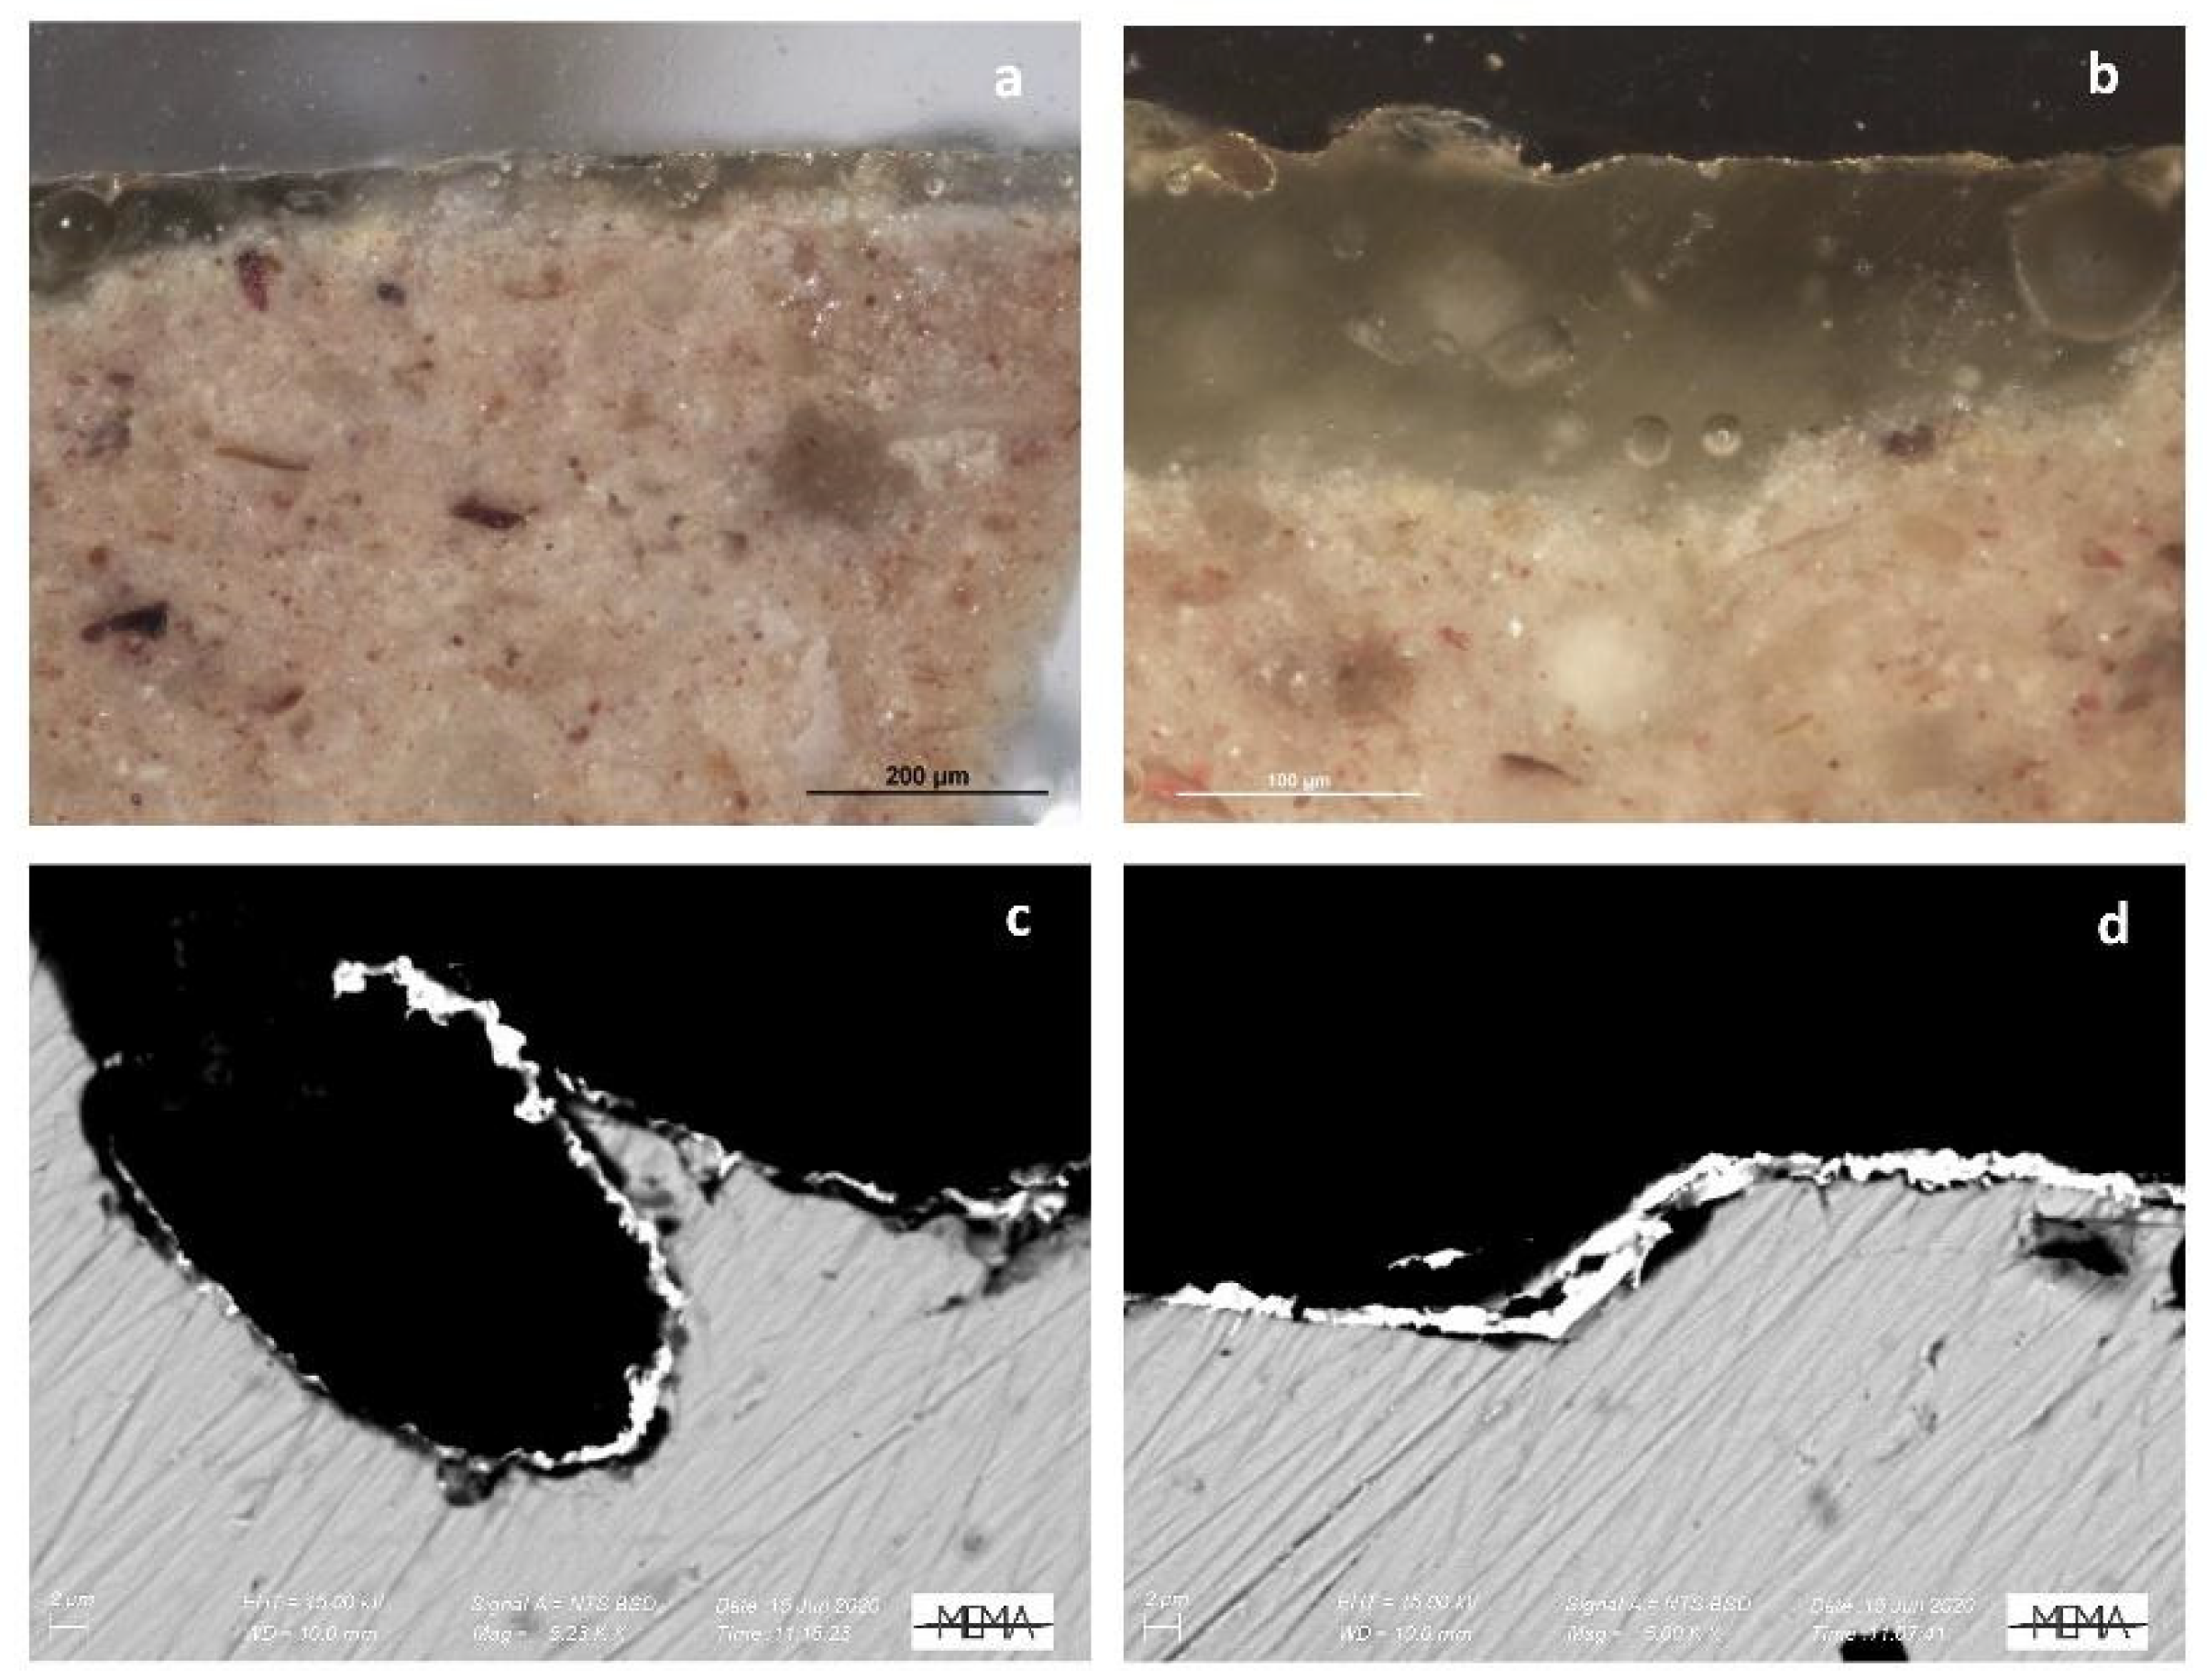
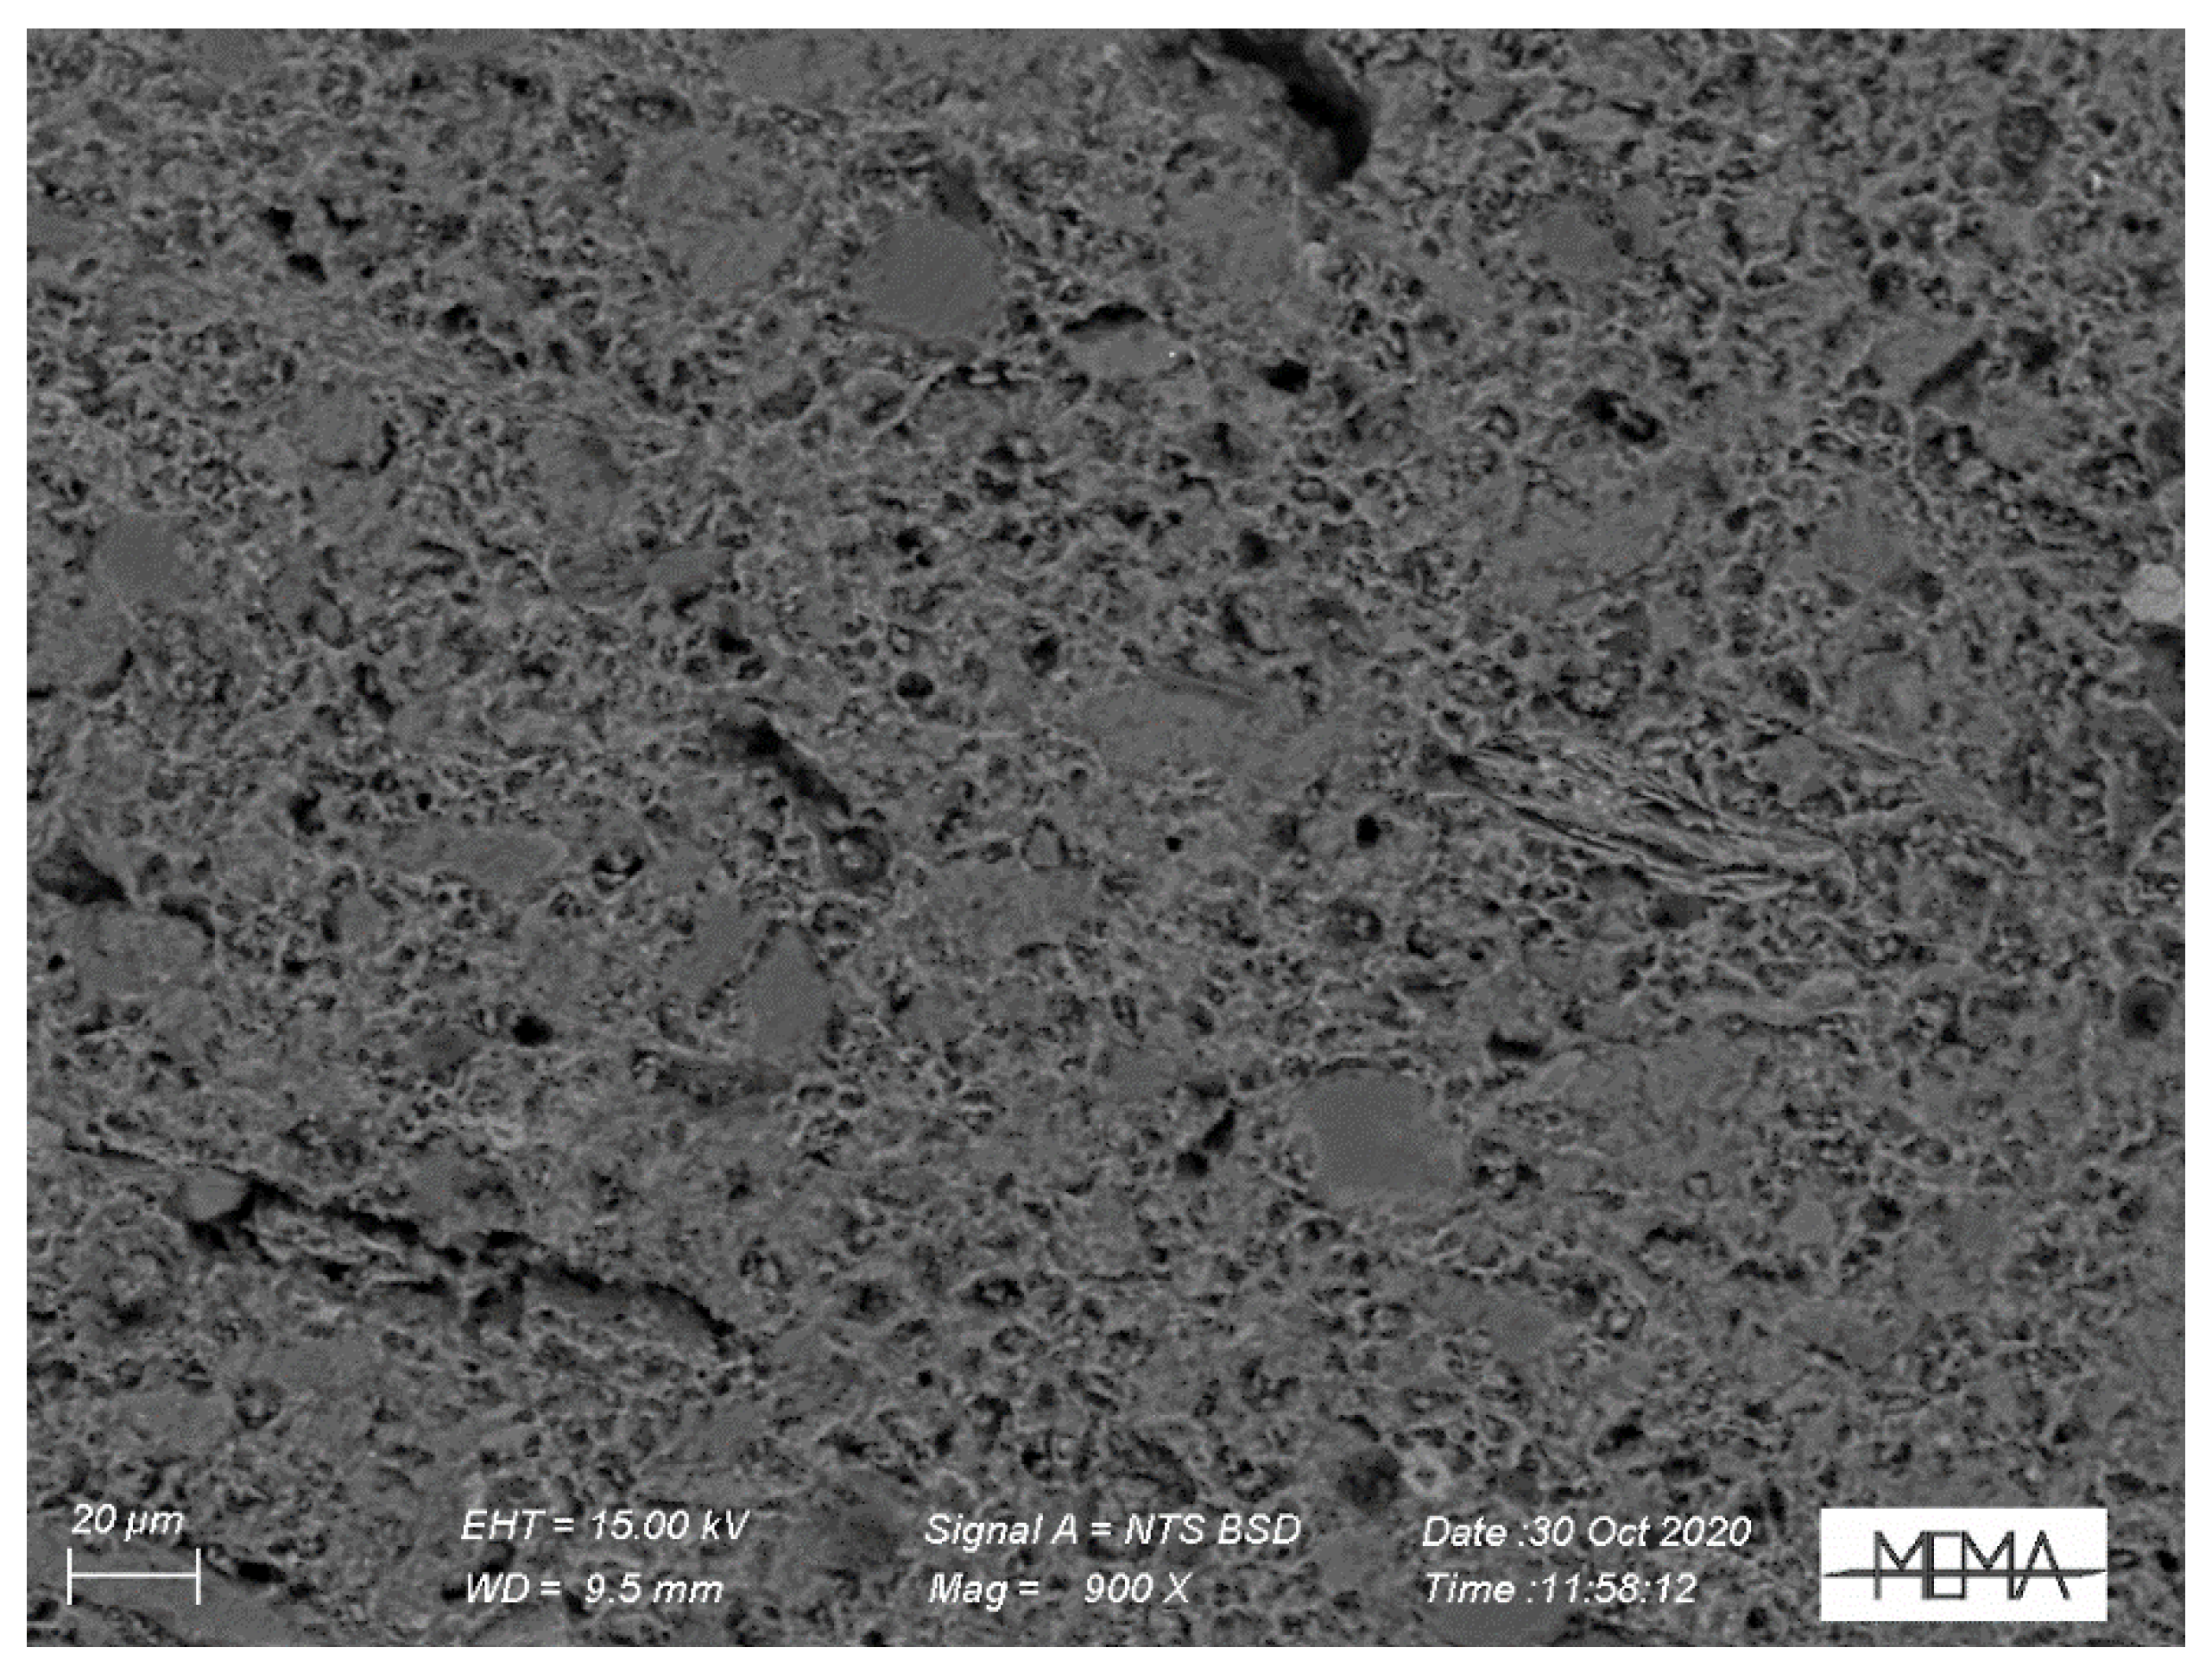
3.4. The Terracotta Body
4. Conclusions
Author Contributions
Funding
Institutional Review Board Statement
Acknowledgments
Conflicts of Interest
References
- Manara, M.A.; La Tomba, J. Federighi: Un Esempio di Piccolo Fuoco nel XV Secolo? Master’s Thesis, Istituto Statale d’arte per la Ceramica Gaetano Ballardini, Faenza, Italy, 1997. [Google Scholar]
- Biavati, E. Oro metallico. decorazione a terzo fuoco sulla maiolica italiana dal Quattrocento al sec. In Proceedings of the XVIII Convegno della Ceramica, Rimini, Italy, 25–27 November 1986; pp. 11–26. [Google Scholar]
- Severi, C. Evoluzione Delle Tecniche di Doratura in Ceramica. Master’s Thesis, Istituto Statale d’arte per la ceramica Gaetano Ballardini, Faenza, Italy, 1995. [Google Scholar]
- Deck, T. (Ed.) Librairies-Imprimeries Réunies; The British Museum: London, UK, 1887; pp. 270–271. [Google Scholar]
- Amadori, M.L.; Barcelli, S.; Barcaioni, S.; Bouquillon, A.; Padeletti, G.; Pallante, P. The altarpieces of Della Robbia atelier in Marche region: Investigations on technology and provenance. Appl. Phys. A 2014, 113, 1129–1141. [Google Scholar] [CrossRef]
- Pappalardo, G.; Costa, E.; Marchetta, C.; Pappalardo, L.; Romano, F.P.; Zucchiatti, A.; Prati, P.; Mandò, P.A.; Migliori, A.; Palombo, L.; et al. Non-destructive characterization of della Robbia sculptures at the Bargello museum in Florence by the combined use of PIXE and XRF portable systems. J. Cult. Herit. 2004, 5, 183–188. [Google Scholar] [CrossRef]
- Zucchiatti, A.; Bouquillon, A.; Castaing, J.; Gaborit, J. Elemental analyses of a group of glazed terracotta angels from the Italian Renaissance. As a tool for the reconstruction of a complex conservation history. Archaeometry 2003, 45, 391–404. [Google Scholar] [CrossRef]
- Zucchiatti, A.; Bouquillon, A.; Katona, I.; D’Alessandro, A. The ‘della Robbia blue’: A case study for the use of cobalt pigments in ceramics during the Italian Renaissance. Archaeometry 2006, 48, 131–152. [Google Scholar] [CrossRef]
- Zucchiatti, A.; Pascual, C.; Ynsa, M.; DCastelli, L.; Recio, P.; Criado, E.; Valle, F.J.; Climent-Font, A. Compositional analysis of XVIII century glazed. polychrome. layered porcelain by non-destructive micro α-PIXE. J. Eur. Ceram. Soc. 2008, 28, 757–762. [Google Scholar] [CrossRef]
- Kingery, W.D.; Aronson, M. The glazes of Luca della Robbia. In Bollettino del Museo Internazionale delle Ceramiche in Faenza LXXVI; Museo Internazionale delle Ceramiche: Faenza, Italy, 1990; Volume 5, pp. 221–235. ISSN 0014-679X. [Google Scholar]
- Bouquillon, A.; Castaing, J.; Vartanian, E.; Zink, A.; Zucchiatti, A. Etude des oeuvres robbiesques au Centre de Recherche et Restauration des Musées de France. In Les della Robbia: Sculptures en Terre Cuite Émaillée de la Renaissance Italienne; Gaborit, J.R., Bormand, M., Eds.; Rèunion des Musées Nationaux: Paris, France, 2002; pp. 139–158. [Google Scholar]
- Bouquillon, A.; Castaing, J.; Salomon, J.; Lucarelli, F.; Mandò, P.A.; Prati, P.; Zucchiatti, A. Iba techniques to study Renaissance pottery techniques. In Proceedings of the International Conference on Fundamental & Applied Aspects of Modern Physics, Luderitz, Namibia, 13–17 November 2000; Connel, S.H., Tegen, R., Eds.; World Scientific: Singapore, 2001; pp. 441–448. [Google Scholar]
- Bouquillon, A.; Lanterna, G.; Lucarelli, F.; Mandò, P.A.; Prati, P.; Salomon, J.; Vaccari, M.G.; Zucchiatti, A. Analisi non distruttive di smalti robbiani con fasci di ioni. In Proceedings of the Atti XXXIV Convegno Internazionale della Ceramica, Savona, Italy, 25–26 July 2001; Varaldo, C., Ed.; Edizioni del Giglio: Firenze, Italy, 2001; pp. 157–162. [Google Scholar]
- Olson, R.J.M.; Barbour, D.S. Toward a new method for studying glazed terracottas. Examining a group of tondi by Andrea della Robbia. Apollo 2001, 154, 44–52. [Google Scholar]
- Gentilini, G. I Della Robbia. La scultura Invetriata nel Rinascimento; Cantini: Florence, Italy, 1992; Volume I, p. 129. [Google Scholar]
- Glasser, H.; Corti, G. The Litigation Concerning Luca Della Robbia’s Federighi Tomb. Mitt. Kunsthistorischen Inst. Florenz 1969, 14, 1–32. Available online: http://www.jstor.org/stable/27652220 (accessed on 1 January 2022).
- Bacci, M. Fiber optics applications to works of art. Sens. Actuators 1995, 29, 190–196. [Google Scholar] [CrossRef]
- Bacci, M.; Picollo, M. Non-destructive spectroscopic detection of cobalt (II) in paintings and glass. Stud. Conserv. 1996, 41, 136–144. [Google Scholar]
- Bacci, M. UV-VIS-NIR. FT-IR. FORS Spectroscopies. In Modern Analytical Methods in Art and Archaeology; Ciliberto, E., Spoto, G., Eds.; Chemical Analysis Series; John Wiley & Sons: New York, NY, USA, 2000; Volume 155, pp. 321–362. [Google Scholar]
- Bacci, M.; Corallini, A.; Orlando, A.; Picollo, M.; Radicati, B. The ancient stained windows by Nicolò di Pietro Gerini in Florence. A novel diagnostic tool for non-invasive in situ diagnosis. J. Cult. Herit. 2007, 8, 235–241. [Google Scholar] [CrossRef]
- Picollo, M.; Aceto, M.; Vitorino, T. UV-Vis spectroscopy. In Chemical Analysis in Cultural Heritage; Sabbatini, L., van der Werf, I.D., Eds.; De Gruyter: Berlin, Germany, 2020; pp. 253–271. ISBN 978-3-11-045641-7. [Google Scholar] [CrossRef]
- Aceto, M.; Agostino, A.; Fenoglio, G.; Idone, A.; Gulmini, M.; Picollo, M.; Ricciardi, P.; Delaney, J. Characterisation of colourants on illuminated manuscripts by portable fibre optic UV-Visible-NIR reflectance spectrophotometry. Anal. Methods 2014, 6, 1488. [Google Scholar] [CrossRef]
- IFAC-CNR FORS Database Fiber Optics Reflectance Spectra (FORS) of Pictorial Materials in the 270–1700 nm Range. Available online: http://fors.ifac.cnr.it/index.php (accessed on 1 January 2022).
- Karidas, A.G.; Brecoulaki, H.; Bourgeois, B.; Jockey, P. In situ XRF analysis of raw pigments and traces of polychromy on marble sculpture surfaces. Possibilities and limitations. In Proceedings of the 28th International Symposium on the Conservation and Restoration of Cultural Property, “Non-destructive examination of Cultural Objects—Recent Advances in X-ray Analysis”, Tokyo, Japan, 1–3 December 2004; pp. 48–62. [Google Scholar]
- Shugar, A.N.; Mass, J.L. Handheld XRF for Art and Archaeology; Leuven University Press: Leuven, Belgium, 2013. [Google Scholar]
- Bezur, A.; Lee, L.; Loubser, M.; Trentelman, K. Handheld XRF in Cultural Heritage; J. Paul Getty Trust and Yale University: Los Angeles, CA, USA, 2020. [Google Scholar]
- Pouchou, J.L.; Pichoir, F. Quantitative Analysis of Homogeneous or Stratified Microvolumes Applying the Model “PAP”; Heinrich, K.F.J., Newbury, D.E., Eds.; Electron Probe Quantification; Plenum Press: New York, NY, USA, 1991; pp. 31–75. [Google Scholar] [CrossRef]
- Golitko, M.; Terrell, J.E. Mapping Prehistoric Social Fields on the Sepik coast of Papua New Guinea: Ceramic Compositional Analysis using Laser Ablation-Inductively Coupled Plasma-Mass Spectrometry. J. Archaeol. Sci. 2012, 39, 3568–3580. [Google Scholar] [CrossRef]
- Rasmussen, K.L.; van der Plicht, J.; La Nasa, J.; Ribechini, E.; Colombini, M.P.; Delbey, T.; Skytte, L.; Schiavone, S.; Kjær, U.; Grinder-Hansen, P.; et al. Investigations of the relics and altar materials relating to the apostles St James and St Philip at the Basilica dei Santi XII Apostoli in Rome. Herit. Sci. 2021, 9, 14. [Google Scholar] [CrossRef]
- Rasmussen, K.L.; De La Fuente, G.A.; Bond, A.D.; Mathiesen, K.K.; Vera, S.D. Pottery firing temperatures: A new method for determining the firing temperature of ceramics and burnt clay. J. Archaeol. Sci. 2012, 39, 1705–1716. [Google Scholar] [CrossRef] [Green Version]
- Vaccari, M.G. Tecniche e Materiali di Lavorazione in I Della Robbia e l’arte Nuova Della Scultura Invetriata; Gentilini, G., Ed.; Giunti Editore: Firenze, Italy, 1998; pp. 97–116. [Google Scholar]
- Piccolpasso, C. The Three Books of the Potter’s Art (1557); Lightbown, R., Ed.; Alan Caiger-Smith Scholar Press: London, UK, 1980. [Google Scholar]
- Barilaro, D.; Crupi, V.; Interdonato, S.; Majolino, D.; Venuti, V.; Barone, G. Characterization of blue decorated Renaissance pottery fragments from Caltagirone (Sicily, Italy). Appl. Phys. A 2008, 92, 91–96. [Google Scholar] [CrossRef]
- Gratuze, B.; Soulier, I.; Barrandon, J.N.; Foy, D. De l’origine du cobalt dans les verres. Rev. D’archéométrie 1992, 16, 97–108. [Google Scholar] [CrossRef]
- Ravanelli Guidotti, C. Oro e metalli preziosi per l’antica ceramica italiana. In Ori e Tesori d’Europa. Mille Anni di Oreficeria nel Friuli Venezia Giulia (Passariano. 1992); Mondadori Electa: Milano, Italy, 1992; pp. 161–178. ISBN 10: 8843540777. [Google Scholar]
- Alloin, E.; Bouquillon, A.; Gaborit, J.R. Contribution à l’étude des terres cuites glaçurées italiennes: Un tympan du milieu du XVIe siècle. Techne 1997, 6, 21–26. [Google Scholar]
- Amara, A.B.; Schvoerer, M. Interaction between leads glazes and bodies: Research on the mode of application of the glazing mixture. In Proceedings of the 34th International Symposium on Archaeometry, Zaragoza, Spain, 3–7 May 2004; pp. 399–404. [Google Scholar]
- Dondi, M.; Ercolani, G.; Fabbri, B.; Marsigli, M. An approach to the chemistry of pyroxenes formed during the firing of Ca-rich silicate ceramics. Clay Min. 1998, 33, 443–452. [Google Scholar] [CrossRef]
- Tite, M.S. The production technology of Italian maiolica: A reassessment. J. Archaeol. Sci. 2009, 36, 2065–2080. [Google Scholar] [CrossRef]
- Dias, M.I.; Prudêncio, M.I.; Kasztovszky, Z.; Maróti, B.I.; Harsányi, F.P. Nuclear techniques applied to provenance and technological studies of Renaissance majolica roundels from Portuguese museums attributed to della Robbia Italian workshop. J Radioanal Nucl. Chem. 2017, 312, 205–219. [Google Scholar] [CrossRef]
- Tite, M. Technological investigations of Italian Renaissance ceramics. In Italian Renaissance Pottery; Wilson, T., Ed.; British Museum Press: London, UK, 1991. [Google Scholar]
- Tite, M.S.; Freestone, I.; Mason, R.; Molera, J.; Vendrell-Saz, M.; Wood, N. Lead glazes in antiquity—methods of production and reasons for use. Archaeometry 1998, 40, 241–260. [Google Scholar] [CrossRef]


| Sample’s Name | Sample’s Name |
|---|---|
| SX7_yellowdark1 | SX4_white2 |
| SX7_yellowlight1 | SX4_white1 |
| SX6_purple2 | SX1_white1 |
| SX6_purple1 | SX1_lightblue1 |
| SX6_graydark | BA3_olive1 |
| SX6_graylight | BA1_blue1 |
| SX6_yellow1 | SX6_gilding6 |
| SX5_greenmedium tone1 | SX6_gilding5 |
| SX5_yellow2 | SX6_gilding4 |
| SX5_yellow1 | SX5_gilding3 |
| SX4_greendark1 | SX5_gilding2 |
| SX4_greenmedium tone1 | SX5_gilding1 |
| SX4_greenlight1 | DX6_gilding10 |
| SX4_blue2 | DX5_gilding9 |
| SX4_blue1 | DX5_gilding8 |
| SX4_white3 | DX4_gilding7 |
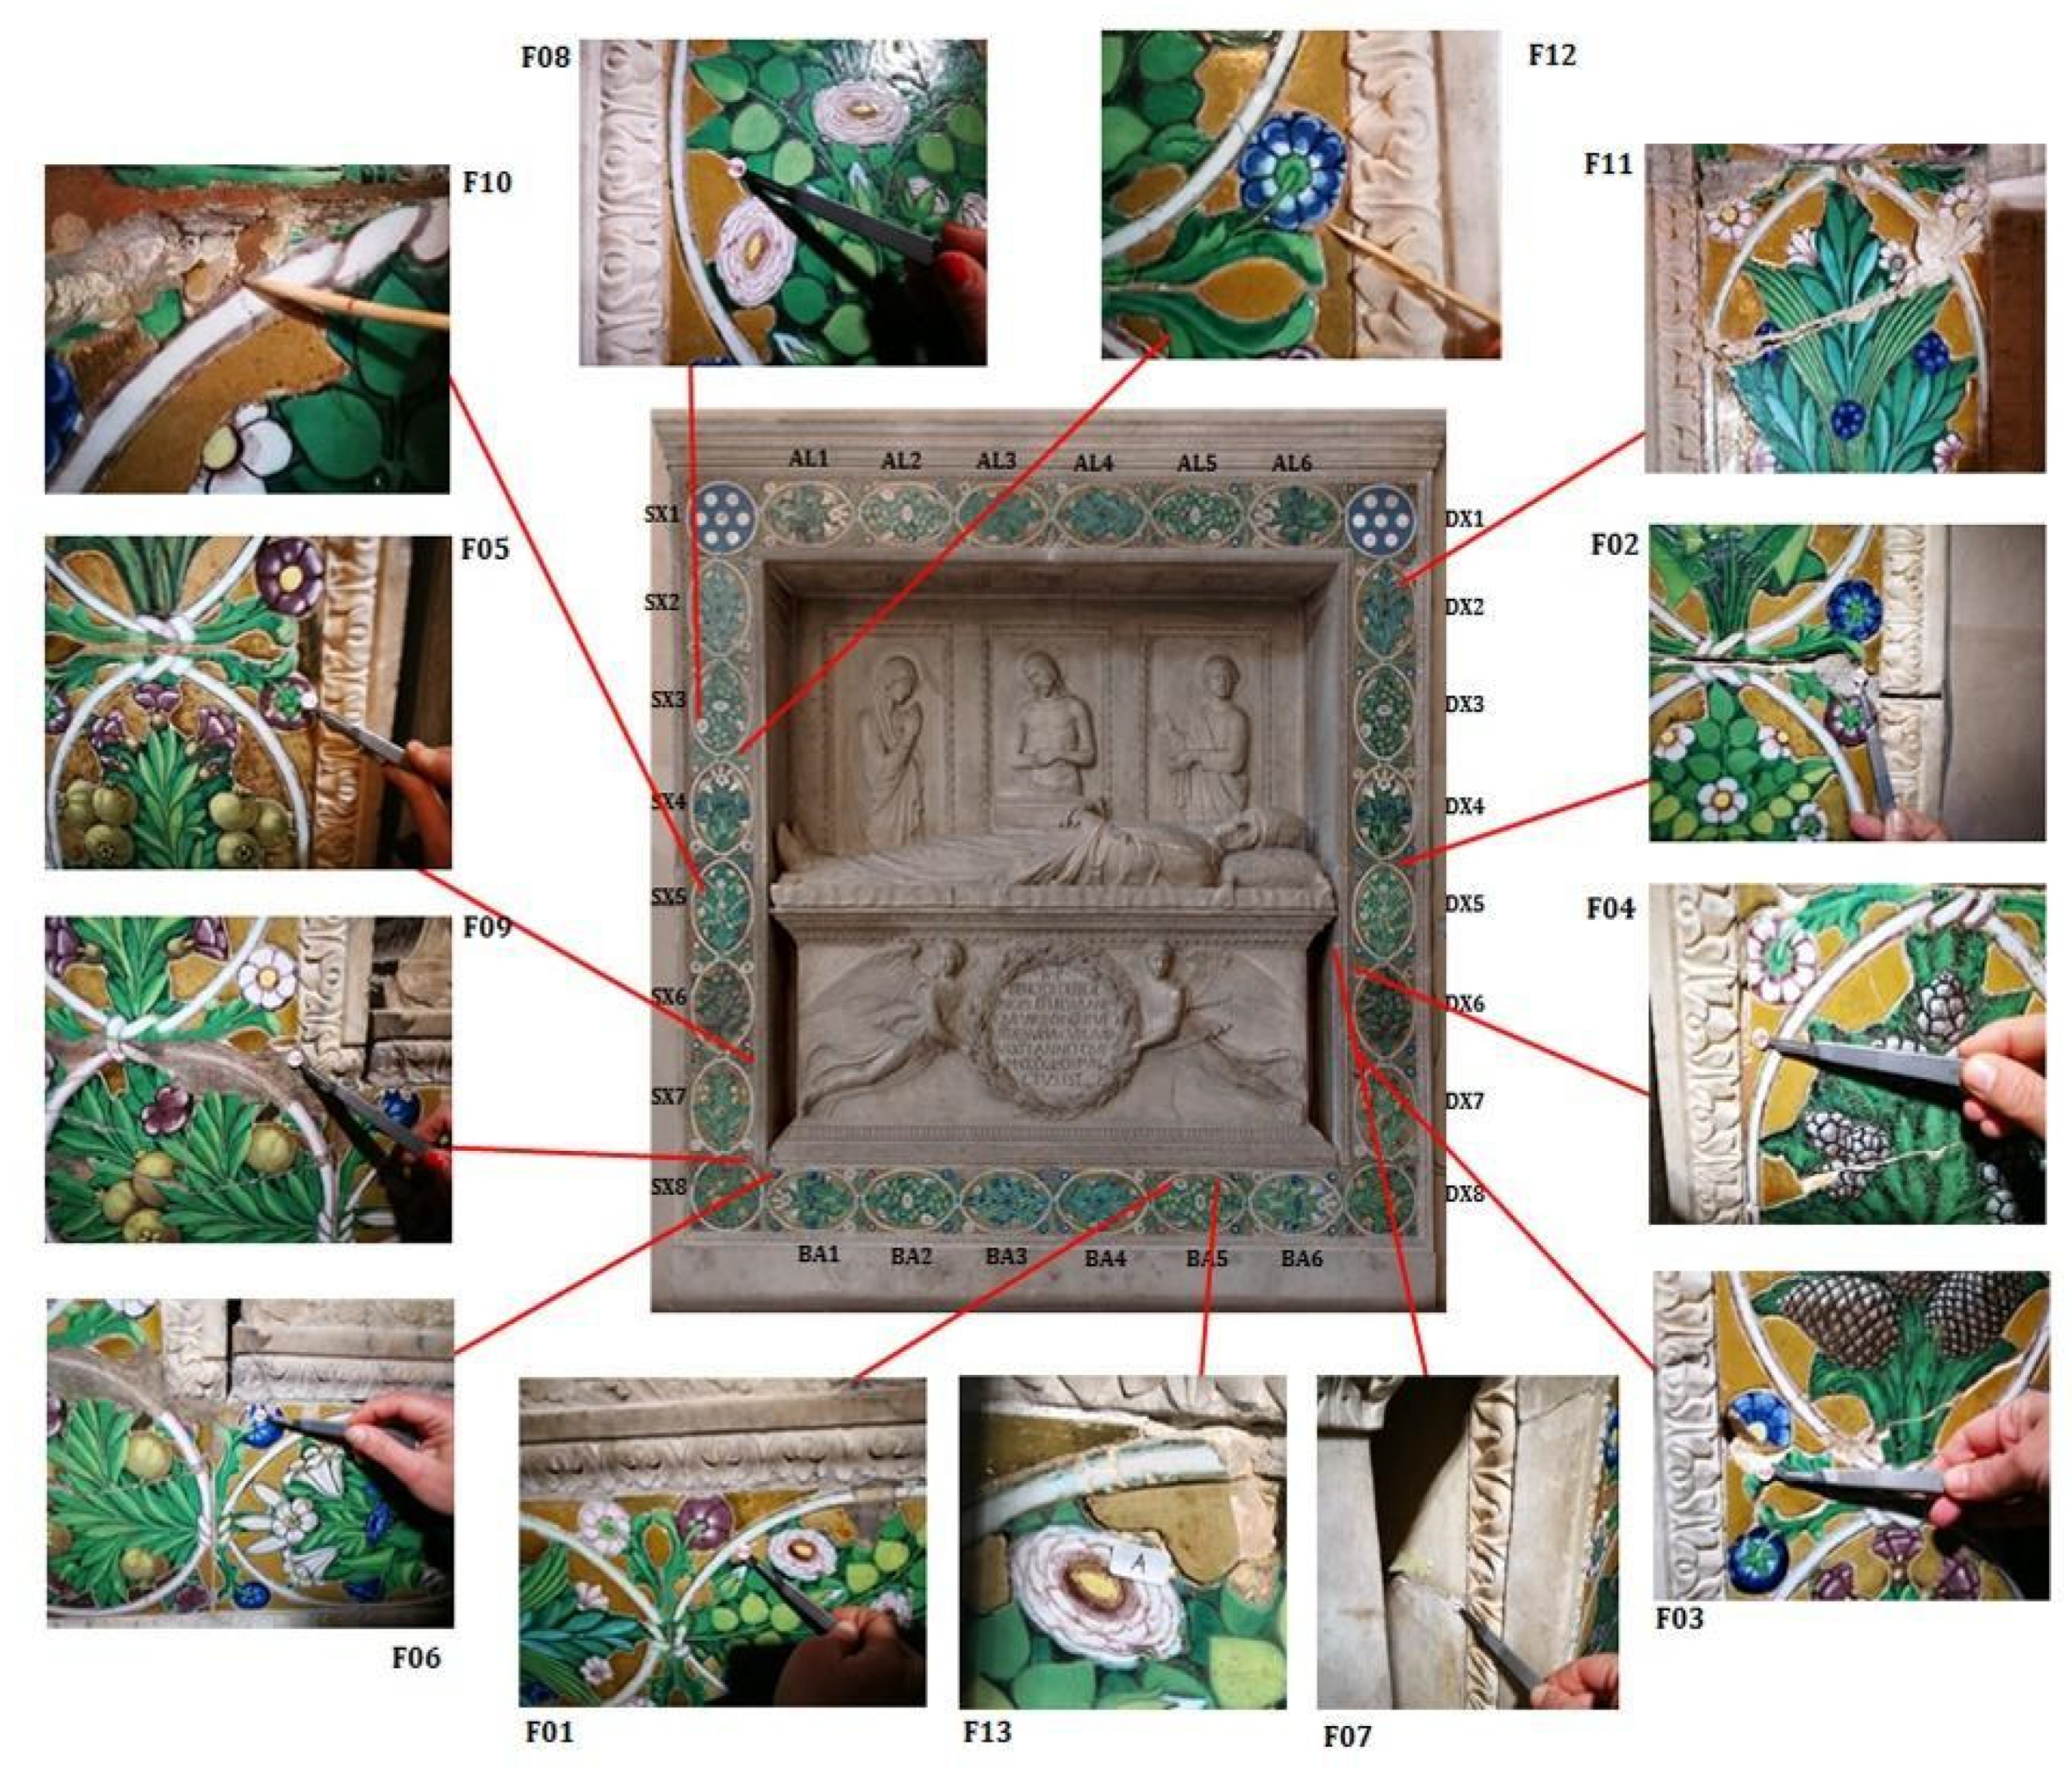
| Sample’s Name | Sampling Description | Analytical Techniques Applied |
|---|---|---|
| F_01 | Tile BA5. On an area with gilded glaze | OM, CS, SEM-EDS |
| F_02 | Between DX4 and DX5. On the gilding. | OM, CS, SEM-EDS, XRPD |
| F_03 | Tile DX6. Terracotta body | XRPD |
| F_04 | Tile DX6 stucco sample | XRPD |
| F_05 | Between SX6 and SX7 on the tile with darkened gilding | OM, CS, SEM-EDS, XRPD |
| F_06 | Tile BA1. On the blue decoration where there are high copper signals. Stucco is also present | OM, CS, SEM-EDS |
| F_07 | Brown adhesive on the back of a gilded tile. | OM |
| F_08 | Powder from stucco | XRPD |
| F_09 | Concrete | XRPD |
| F_10 | Tile SX5. Pinkish stucco around the blue flower | XRPD |
| F_11 | Fragment of terracotta and white plaster underneath | XRPD, LA-ICP-MS, firing temperature |
| F_12 | Fragment of gilded terracotta tile | OM, CS, XRPD, SEM-EDS |
| F_13 a | Tile BA5. Fragment of terracotta | XRPD, LA-ICP-MS, firing temperature |
| F_13 b | Tile BA5. Fragment of terracotta | XRPD, LA-ICP-MS, firing temperature |
| wt% Na2O | wt% MgO | wt% Al2O3 | wt% SiO2 | wt% K2O | wt% CaO | wt% PbO | |
|---|---|---|---|---|---|---|---|
| F01 | 1.91 | - | 1.51 | 33.75 | 1.86 | 2.05 | 58.91 |
| F05 fr2 | - | - | 1.35 | 38.33 | - | 22.56 | 37.82 |
| F02 | - | - | 0.83 | 25.01 | - | 0.77 | 73.38 |
| ID | Al2O3 | SiO2 | K2O | CaO | TiO2 | Cr2O3 | MnO | Fe2O3 | CoO | NiO | CuO | As2O3 | Rb2O | SrO | Ag2O | Sb2O5 | Au2O | PbO | ThO2 | U3O8 |
|---|---|---|---|---|---|---|---|---|---|---|---|---|---|---|---|---|---|---|---|---|
| wt% | wt% | wt% | wt% | wt% | ppm | ppm | wt% | ppm | ppm | ppm | ppm | ppm | ppm | ppm | ppm | ppm | ppm | ppm | ppm | |
| F11 | 19.0 | 40.3 | 0.859 | 34.9 | 0.797 | 144 | 1321 | 3.80 | 22.5 | 77.7 | 108 | 6.29 | 92.8 | 1197 | 1.38 | 0.823 | 0.0870 | 36.9 | 12.5 | 2.80 |
| F13 a | 16.9 | 38.6 | 0.862 | 38.8 | 0.794 | 165 | 1640 | 3.57 | 20.9 | 73.4 | 97.4 | 7.43 | 111 | 1328 | 0.952 | 1.45 | 0.283 | 1237 | 14.0 | 2.42 |
| F13 b | 16.7 | 38.8 | 0.781 | 38.7 | 0.802 | 166 | 1411 | 3.92 | 23.8 | 82.1 | 122 | 7.27 | 85.8 | 1710 | 0.869 | 0.970 | 0.252 | 220 | 16.3 | 2.85 |
| Sample ID | T1 | 1 σ |
|---|---|---|
| °C | °C | |
| F11 | 1070 | 10 |
| F13a | 950 | 10 |
| F13b | 850 | 10 |
Publisher’s Note: MDPI stays neutral with regard to jurisdictional claims in published maps and institutional affiliations. |
© 2022 by the authors. Licensee MDPI, Basel, Switzerland. This article is an open access article distributed under the terms and conditions of the Creative Commons Attribution (CC BY) license (https://creativecommons.org/licenses/by/4.0/).
Share and Cite
Magrini, D.; Cantisani, E.; Vettori, S.; Rasmussen, K.L. Insights into Della Robbia’s Terracotta Monument to Cardinal Federighi: Raw Materials and Technologies. Appl. Sci. 2022, 12, 4304. https://doi.org/10.3390/app12094304
Magrini D, Cantisani E, Vettori S, Rasmussen KL. Insights into Della Robbia’s Terracotta Monument to Cardinal Federighi: Raw Materials and Technologies. Applied Sciences. 2022; 12(9):4304. https://doi.org/10.3390/app12094304
Chicago/Turabian StyleMagrini, Donata, Emma Cantisani, Silvia Vettori, and Kaare Lund Rasmussen. 2022. "Insights into Della Robbia’s Terracotta Monument to Cardinal Federighi: Raw Materials and Technologies" Applied Sciences 12, no. 9: 4304. https://doi.org/10.3390/app12094304
APA StyleMagrini, D., Cantisani, E., Vettori, S., & Rasmussen, K. L. (2022). Insights into Della Robbia’s Terracotta Monument to Cardinal Federighi: Raw Materials and Technologies. Applied Sciences, 12(9), 4304. https://doi.org/10.3390/app12094304