Article

Grain Boundary—A Route to Enhance Electrocatalytic Activity for Hydrogen Evolution Reaction

1
Institute of New Energy Materials, School of Materials Science and Engineering, Tianjin University, Tianjin 300072, China
2
School of Earth and Environmental Sciences, Lanzhou University, Lanzhou 730000, China
*
Author to whom correspondence should be addressed.
Appl. Sci. 2022, 12(9), 4290; https://doi.org/10.3390/app12094290
Submission received: 30 March 2022 / Revised: 15 April 2022 / Accepted: 19 April 2022 / Published: 24 April 2022
(This article belongs to the Special Issue Low Carbon Water Treatment and Energy Recovery)

Abstract

:
The electrocatalytic hydrogen evolution reaction (HER) of a given metal catalyst is intrinsically related to its electronic structure, which is difficult to alter for further improvement. Recently, it was discovered that the density of grain boundaries (GBs) is mechanistically of great importance for catalytic activity, implying that GBs are quantitatively correlated with the active sites in the HER. Here, by modeling the atomistic structure of GBs on a Au(110) surface, we find that HER performance is greatly enhanced by Au GBs, suggesting the feasibility of the HER mediated by GBs. The promoted HER performance is due to an increase in the capability of binding adsorbed hydrogen on the sites around GBs. A Au catalyst with a dominantly exposed (110) plane is synthesized, where considerable GBs exist for experimental verification. It is found that HER activity is inherently correlated with the density of the GBs in Au NPs. The improvement in HER activity can be elucidated from the geometrical and electronic points of view; the broken local spatial symmetry near a GB causes a decrease in the coordination numbers of the surface sites and the shift up of the d–band center, thereby reducing the limiting potential for each proton−electron transfer step. Our finding represents a promising means to further improve the HER activity of a catalyst.

1. Introduction

In recent decades, human beings have relied on fossil fuels for over 80% of their total energy needs. Hydrogen, as a clean, economic and renewable energy carrier, is considered to be an attractive alternative to traditional fossil fuels, and it can greatly alleviate the global greenhouse effect and energy crisis at present [1]. Amongst various hydrogen production techniques, the electrocatalytic hydrogen evolution reaction (HER) via electrochemical water splitting, an important energy recovery technique, has received great attention as a hot research topic [2,3,4]. Consequently, ever–increasing efforts have been devoted to developing a variety of new catalysts with the aim of improving HER performance [5,6]. However, noble metal–based materials such as platinum (Pt) (e.g., Pt/C) are still the most efficient catalysts widely used to catalyze hydrogen evolution, owing to their outstanding thermodynamical and kinetic features for the HER [3]. Unfortunately, Pt is an extremely scarce and precious metal, which results in a high cost for the HER. Therefore, designing a new catalyst or boosting the activity of existing non–noble materials other than Pt has become urgent.
As an important descriptor, hydrogen bonding ability is often taken into account in the screening or designing of HER catalysts [7,8,9]. According to the Sabatier principle, either a too weak or too strong adsorption ability results in a drop in HER performance in that a too weak adsorption of H* leads to a pronounced decline in intermediate stabilization, while a too strong adsorption inhibits the desorption of gaseous hydrogen [10]. The superior HER of Pt is due to its optimal H* binding energy, or Gibbs free energy, which is close to zero. To date, many non–noble materials suffer from a weak H* binding ability. Identifying how to enhance their H* binding activity remains an enormous challenge. Therefore, various routes have been proposed to control the microstructure of catalysts in order to expose more active facets or sites [11,12,13]. However, further improving HER activity is still a great challenge due to the inherent electronic structure of the catalysts themselves, leading to a certain capacity for H* binding, which almost cannot be tuned. Inspired by a previous study on the relationship between grain boundaries (GBs) and catalytic activity in various reactions [14,15,16], GBs rich in the atomic arrangement disorder were found to alter the local electronic structure around GBs [17,18]. In addition, GBs feature under–coordinated sites and microstrains [16,19], which favor H binding. Kim [17], using extensive density functional theory (DFT) calculations to model the atomistic structure of GBs on a Au(111) surface, concluded that the grain boundary of Au is conducive to the adsorption of COOH by the active site, thus enhancing electrochemical CO2 reduction. Dong [18] believes that the GB sites on a Au(110) surface lead to a high selectivity toward CH3OH. Thus, GBs are expected to have a stronger H* binding capability so as to compensate for the unsaturated coordination of GB atoms resulting from such a disorder. However, these studies lack an investigation of the atomic and electronic structures of grain boundaries and an explanation of the enhanced catalytic performance of grain boundaries.
Herein, we first predict the impact of grain boundaries on a Au surface on the HER occurring at GBs via density functional theory (DFT) calculations, in light of the much weaker H* binding capacity of Au [20]. Then, a Au NP catalyst with GBs is prepared for the verification of GB–assisted HER activity. HER activity greatly increases with an increase in the density of GBs in Au NPs. Additionally, the atomic and electronic structures are analyzed to determine the role of the GBs. On the basis of the theoretical and experimental studies, it is found that the GBs can prodigiously promote the chemical bonding ability of H* intermediate, resulting in enhanced catalytic activity in hydrogen evolution.

2. Compactional and Experimental Methods

2.1. Computational Model and Method

Of many possible high–angle grain boundaries (HAGBs), an ∑6{2–21} HAGB atomistic model on a Au(110) surface was constructed using coincidence site lattice (CSL) theory, as shown in Figure 1. This HAGB surface model consists of three layers containing 52 Au atoms (Figure S1). Five atop catalytic active sites were selected, labeled as s1–s5 (Figure 1).
Spin–polarized DFT calculations were performed using Vienna ab initio Simulation Package (VASP) [21]. The revised Perdew−Burke−Ernzerhof (rPBE) exchange–correlation functional within the generalized gradient approximation (GGA) was used with the projector augmented wave (PAW) pseudopotential [22]. A plane–wave cutoff energy of 450 eV was used for clean surface and adsorbate surface relaxation. The relaxation was complete when the residual force was less than 0.05 eV/Å. During the structure relaxation, two downmost layers were fixed to their original position of the slab without the adsorbate, while the uppermost layer and adsorbate were fully relaxed. Then, 2 × 1 × 1 Monkhorst−Pack mesh sampling was employed for the clean surface and adsorbate surface in the surface Brillouin zone. A vacuum space of 15 Å perpendicular to the slab surface was used to avoid artificial interaction. Additional computational details about the calculation of the free energy diagram can be found in the Supporting Information.

2.2. Preparation of Au/CFP Electrodes

Au nanoparticles were deposited on carbon fiber paper by magnetron sputtering under a sputtering vacuum of 5 × 10⁻² mbar and a sputtering current of 20 mA for 30 s using a tabletop DC magnetron sputtering coater (Leica EM SCD 500). The purity of the Au target used for deposition was 99.999%. The annealing of Au/CFP electrodes was performed using a tube furnace (Thermo Scientific) with a flowing Ar atmosphere at 100 sccm, heated at a given temperature (200~400 °C) for 2 h. The use of an Ar atmosphere prevented the formation of carbon coatings on the Au nanoparticles.

2.3. Electrochemical Characterization

All electrochemical measurements were performed on a CHI 1100C electrochemical workstation (Chenhua, China). The Pb underpotential deposition (upd) measurements of the Au/CFP electrodes were performed in 0.1 M NaOH solution containing 1 mM Pb(OAc)2, and Pt and Ag/AgCl electrode (3.0 M KCl) were the counter electrode and reference electrode, respectively. The voltammogram scan rate was 50 mV s–1.
Electrochemical hydrogen evolution measurements were performed in 0.5 M H2SO4 with continuous purging of N2 (>99.999% purity) using a standard three–electrode cell, where the Au/CFP electrodes, the graphite rod (>99.999% purity) and the Hg/Hg2Cl2 electrode (saturated KCl solution) were used as the working, counter and reference electrodes, respectively. The potential was calibrated with respect to RHE in the high–purity hydrogen–saturated electrolyte, with a Pt plate as the working electrode. A flow of N2 was maintained over the electrolyte (0.5 M H2SO4) during the electrochemical measurements in order to eliminate the possible effects of other gases. The polarization curves were recorded with a scan rate of 5 mV s−1 without iR correction.

3. Results and Discussion

3.1. Theoretical Prediction of GB–Assisted HER

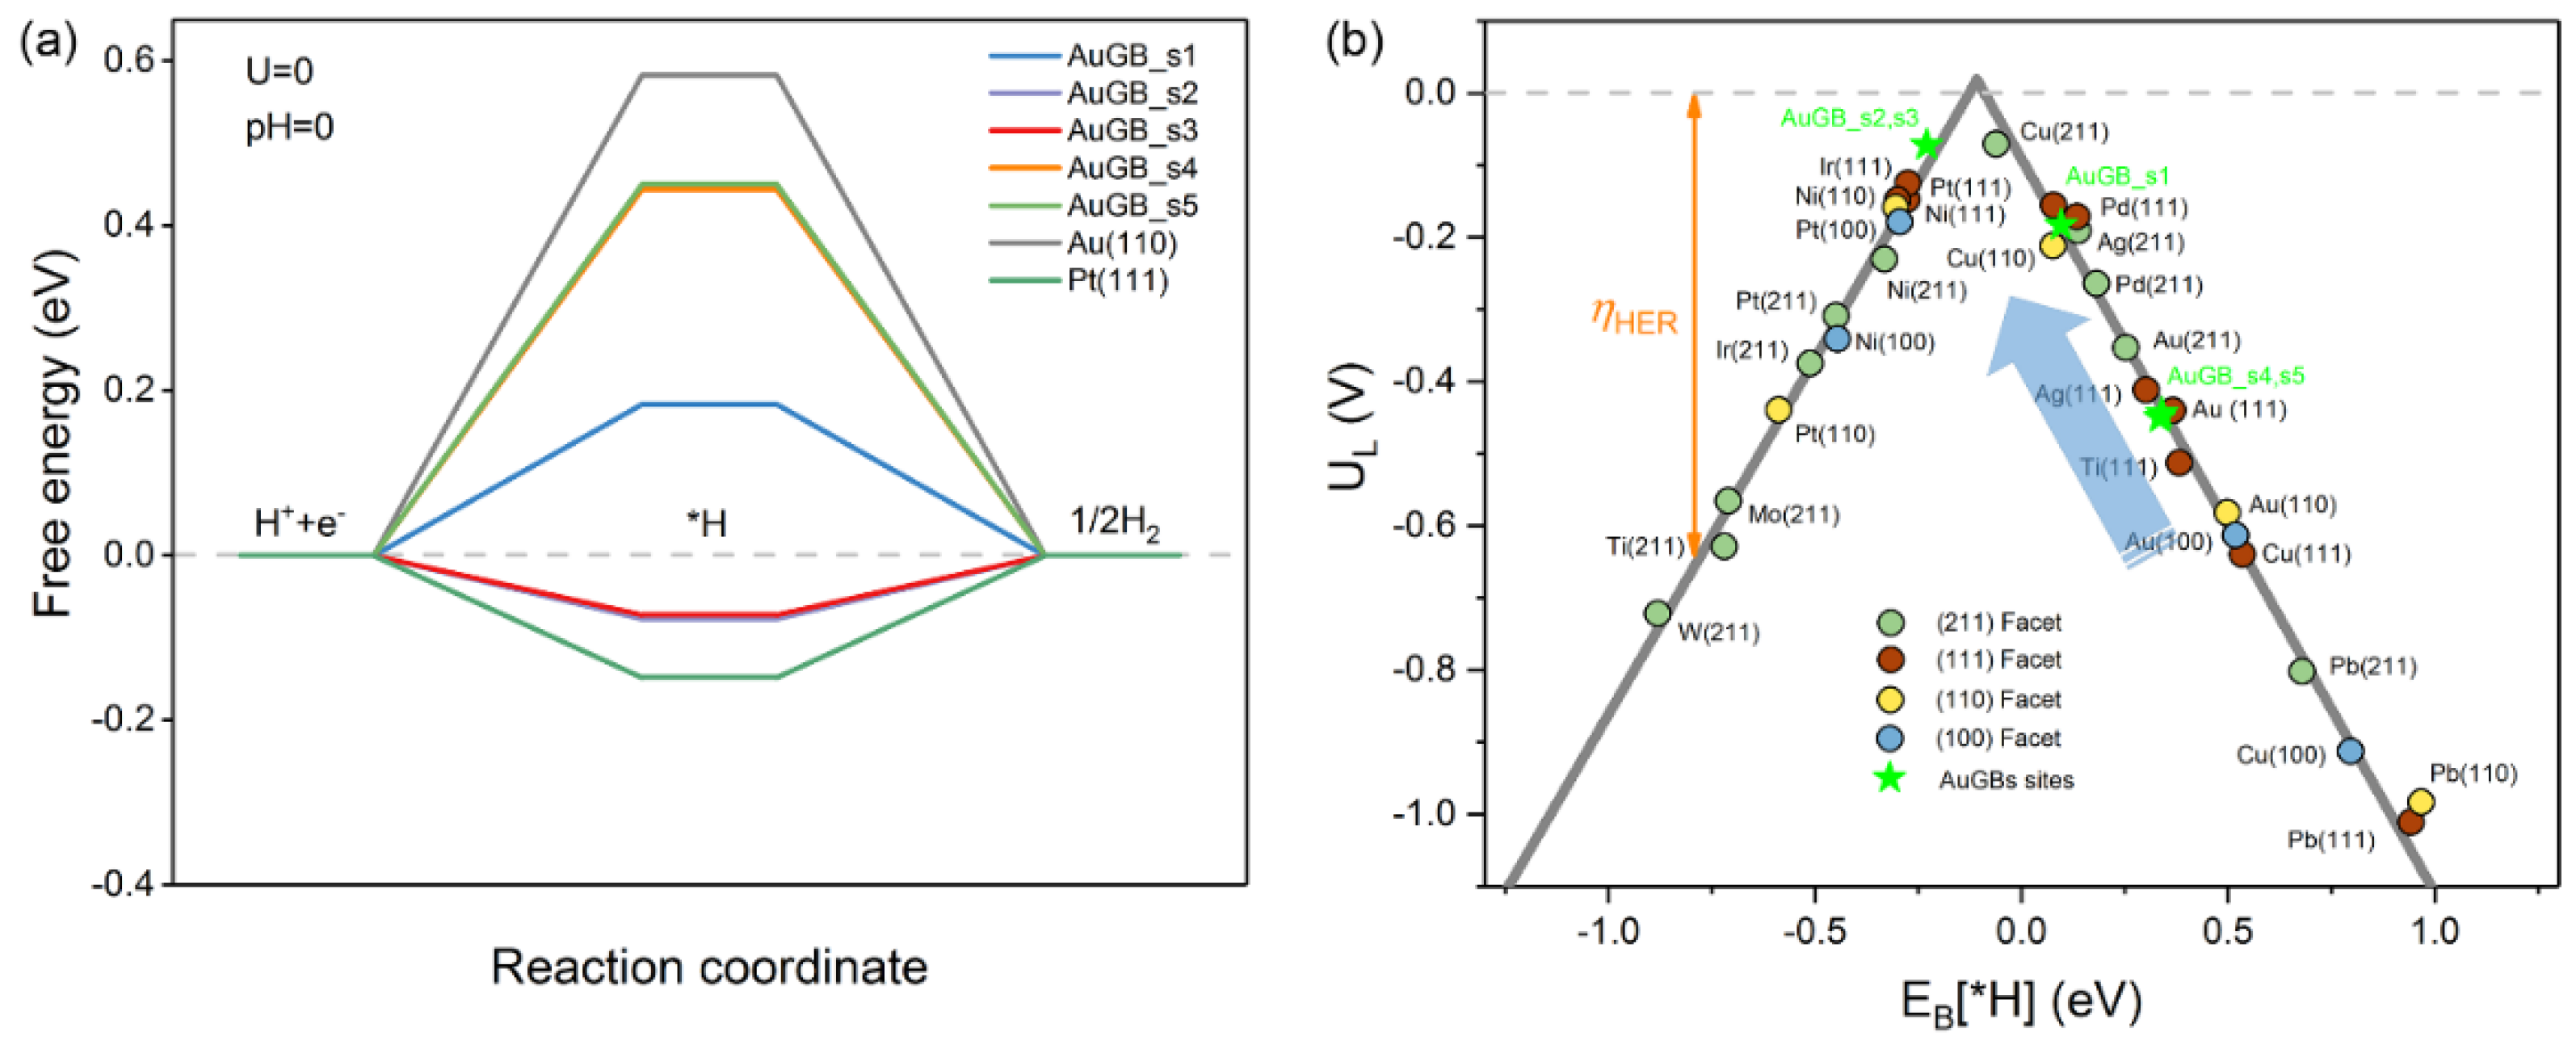
3.1.1. Gibbs Free Energy

The HER is a multi–step electrochemical process occurring on the surface of an electrode [23]. In acid media, two possible routes have been elucidated for the HER, i.e., the Volmer−Heyrovsky and the Volmer−Tafel mechanisms, which can be described as follows [24,25]:
H 3 O + + M + e H   * M + H 2 O
H   * M + H 3 O + + e M + H 2 + H 2 O
2 H   * M 2 M + H 2
Step (1) refers to the Volmer reaction, while steps (2) and (3) refer to the Heyrovsky and Tafel reactions, respectively. We first explore the impact of the GBs on the Au(110) surface on the Volmer reaction, which dominantly determines the overall HER performance; for this, we chose various active sites at and near the Au GBs (Figure 1). Figure 2a shows the Gibbs free energy change (ΔGH*) profile of the HER in acid media. The ΔGH* values of the flat Au(110) and Pt(111) GB–free surfaces are also presented for comparison (Tables S1 and S2). It should be noted that ΔGH* dramatically reduces once the GBs are introduced. Additionally, ΔGH* exhibits site–dependent HER activity for sites in the vicinity of the GBs. To be specific, the ΔGH* for s1 is 0.18 eV, approximately 0.4 eV less than the flat Au(110) (0.58 eV), whereas s2 and s3 have a ΔGH* of about −0.07 eV; this is less than that of Pt (−0.09 eV), which is more close to zero. As is well known, the optimal value of ΔGH* for the HER is zero, as hydrogen binding is neither too strong nor too weak. Therefore, the activity for the Volmer reaction is greatly promoted by the GBs. In addition, the sites near the GBs (s4 and s5) reduce ΔGH* by ~0.13 eV with regard to the Au(110) surface, suggesting that GBs on the Au(110) surface not only greatly promote HER activity on their own (s1–s3) but also activate the sites nearby (s4–s5) to further lower the reaction barrier.

3.1.2. Limiting Potentials

To further evaluate the HER performance, we compared the limiting potential (UL = −ΔGH*/e) of various metal materials with different exposed facets (Tables S3 and S4). Figure 2b presents a volcano plot, which typically correlates EB(H*) with UL. GB–free Au(110) is located far from the top on the right side of the volcano plot, indicating that Au(110) binds H* weakly enough not to form a stable intermediate, which readily desorbs off the surface; thus, a much higher overpotential is required to yield gaseous hydrogen [10], which is in agreement with the previous discussion. When GBs are formed on Au(110), HER activity moves close to the top of the volcano. The active sites at the GBs (s1–3) possess superior HER performance to almost all the metal catalysts considered here. Additionally, the UL required is also reduced for sites near the GBs (s4 and s5). In particular, s1, s2 and s3 lie close to the top of the volcano plot near Pt, although PDS is different, suggesting that their HER activity is similar to that of the Pt extended surface. The enhanced HER performance is mainly due to the increase in the ability to bind H* on the Au(110) surface with GBs. Therefore, the GBs on the Au(110) surface can dramatically improve H* binding strength and, thus, boost the HER process.

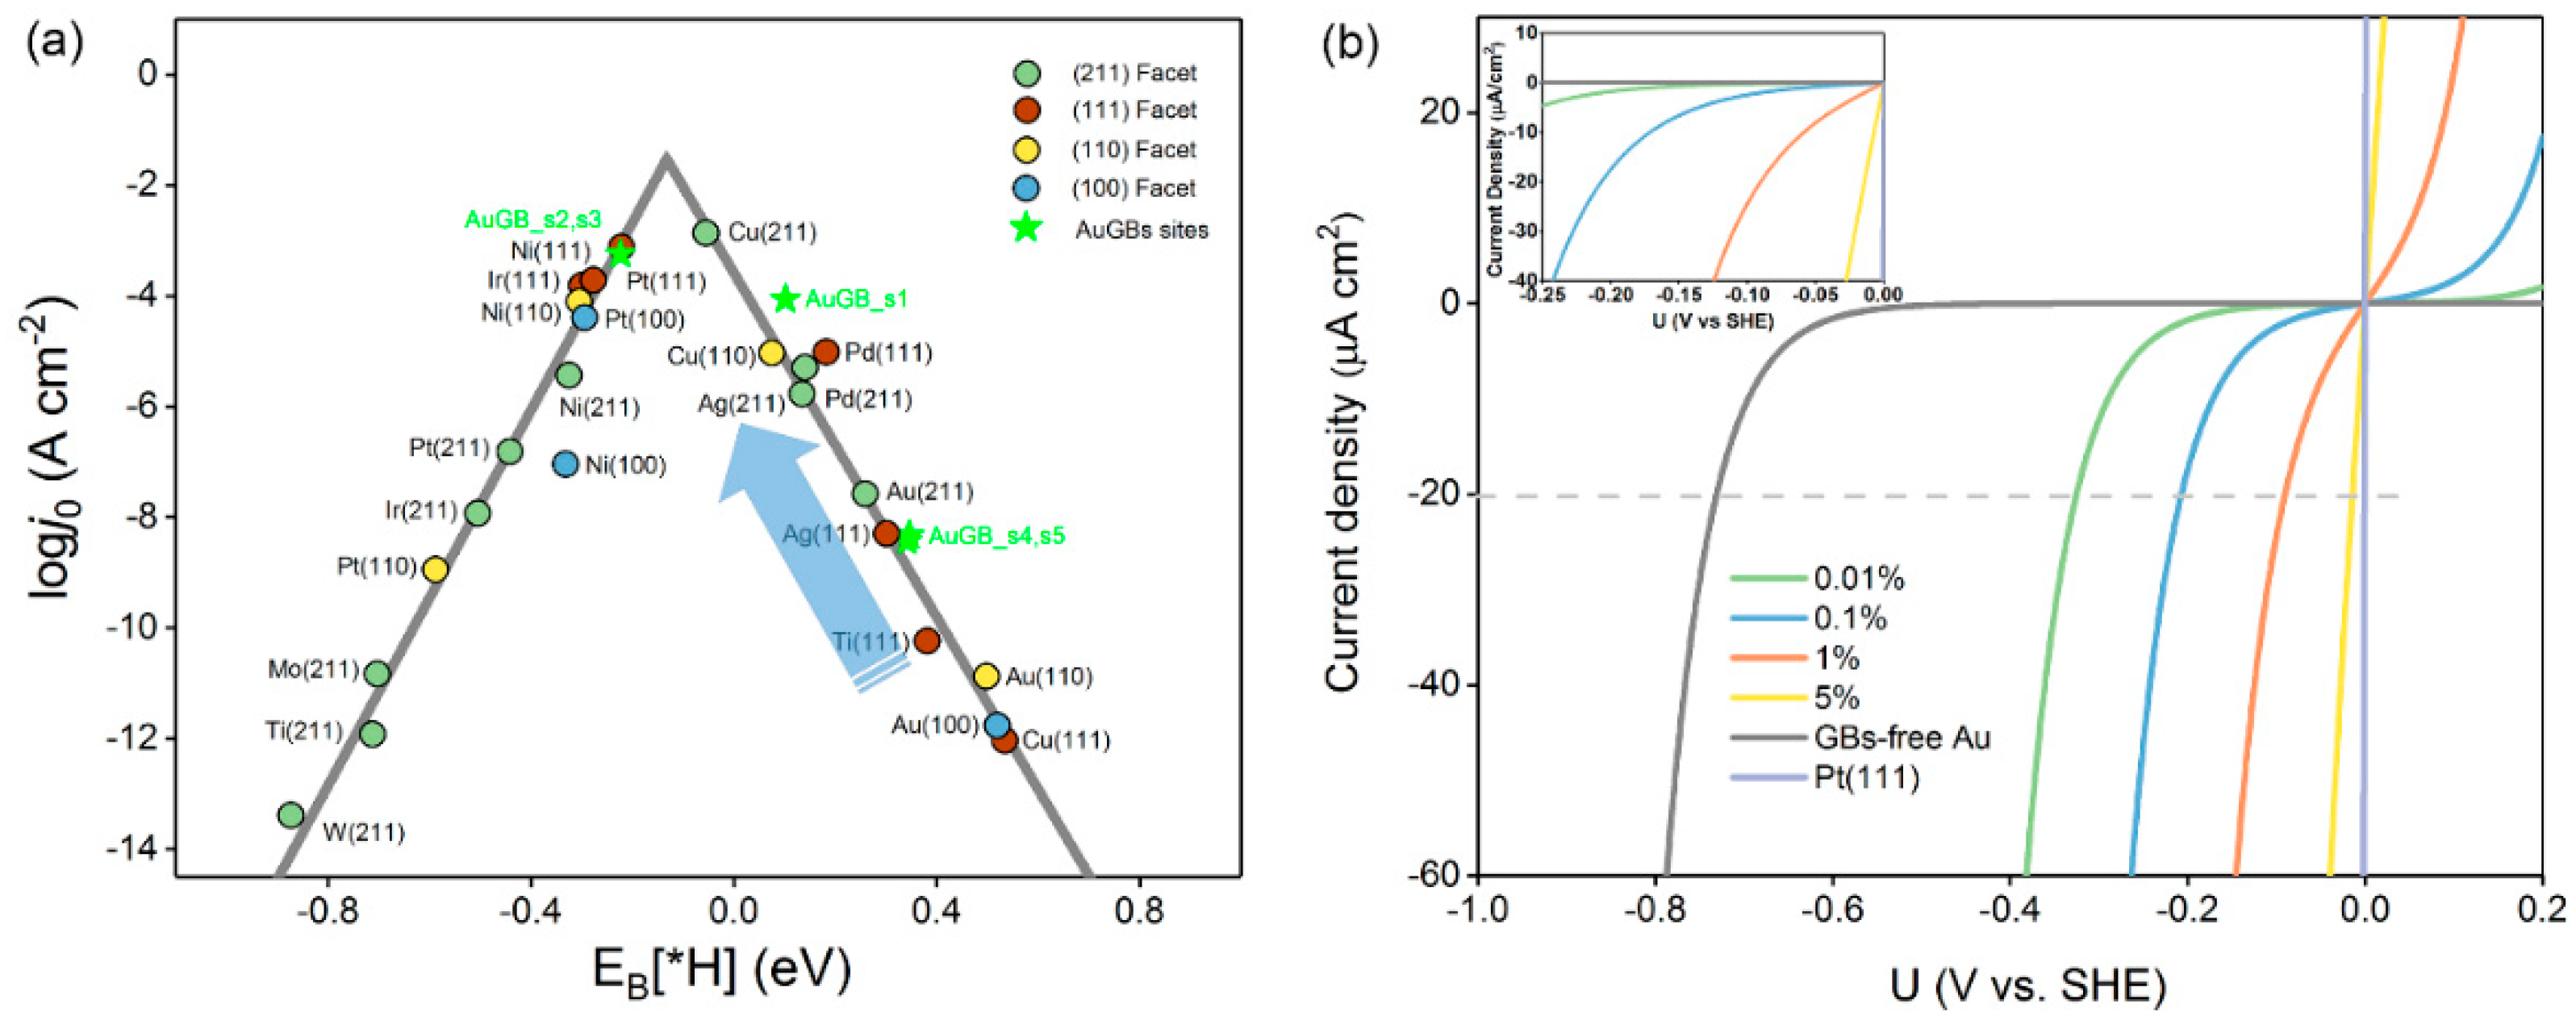
3.1.3. Exchange Current Density

For the purpose of the application of the GB concept in the HER experiment, we calculated the exchange current density (j0), the most common experimental descriptor, to measure the catalysts’ HER activity [10,26]. According to the micro–kinetic model, at equilibrium, j0 can be theoretically computed as an indirect function of ∆GH* [10],
j 0 = F k 0 C t o t a l [ ( 1 θ ) 1 α θ α ]
θ = e x p ( Δ G * H k B T ) 1 + e x p ( Δ G * H k B T )
where k 0   is the standard rate constant, α is the transfer coefficient (α was set to 0.5 in this work), C t o t a l   is the total number of HER active sites on the surface of the catalyst, and k B is the Boltzman constant. The relationship of catalysts correlating EB(H*) is presented with the logarithm of j0 (log j0) (Figure 3a). Similar to the UL–EB[H*] plot, a typical volcano plot is also clearly observed, which is consistent with that in a previous study [10]. Pt and other HER–active materials are close to the top of the volcano curve, which denotes the scaling relationship between log j0 and EB[H*]. The flat Au(110) surface has log j0 = −10.88 A·cm−2 at EB[H*] = 0.50 eV, which implies that Au(110) is not a good HER catalyst because its j0 is extremely small. Once GBs are formed on the Au(110) surface, the log j0 of the sites around the GBs is significantly increased (s1–s5), and they shift up toward the volcano top. s1–s3 are promoted several to a dozen million times in j0 with respect to the Au(110) surface. It is more surprising that, for s1 and s2, log j0 jumps to −3.30 A·cm−2, which is close to the volcano top, outperforming Pt(111) (log j0=−3.50 A·cm−2). This dramatic increase in j0 is also ascribed to the strong H* binding capability caused by GBs on the Au surface.

3.1.4. GB–Mediated Current Density

In fact, the active sites on the Au surface with GBs consist of GB sites and normal sites, which both contribute to the hydrogen evolution. Thus, the overall HER performance of the Au(110) surface with GBs should be described by current density (j) at a given applied potential, which results from the combination of Au GBs and a flat Au(110) surface. For this purpose, we plotted the current density of hydrogen evolution as a function of the applied potential (U) using the kinetics of electrode reactions [27], which can simulate a linear scan voltammetry (LSV) curve. Under the precondition of ruling out mass transfer effects, the LSV curve of the HER can be predicted using the Butler–Volmer Equation (Supporting Information),
  j = j f o r w a r d + j b a c k w a r d = j 0 [ e α f η e ( 1 α ) f η ]
where α is the transfer coefficient, η is a certain overpotential, and f denotes F/RT. Figure 3b shows a j–U plot of Au(110) surfaces with varying amounts of GBs by controlling the ratio of GB sites (s1–s3)/normal sites. The GB–free Au(110) surface has the largest overpotential of −0.73 V (vs SHE) at a current density of 20 μA cm−2. Surprisingly, GBs induce a significant decrease in the overpotentials required for the HER. Of particular note is that only 0.01% of the GBs on Au(110) lead to a dramatic decrease in the overpotential by almost one–half from −0.73 to 0.33 (V vs. SHE), suggesting that quite a low GB density on Au(110) can extremely boost the overall HER performance. As can be clearly seen in Figure 3, the higher the density of the Au GBs, the lower the potential that the catalyst will have. When the density of the GBs increases to 1%, the overpotential to achieve 20 μA cm−2 further reduces to −0.09 V (see inset). A total of 5% of GBs can further reduce the overpotential to 0.01 V. However, we cannot expect even higher HER activity by continuously increasing the GB density, because there exist only a few GBs on a real catalyst surface.

3.2. Experimental Verification of GB–Assisted HER Activity

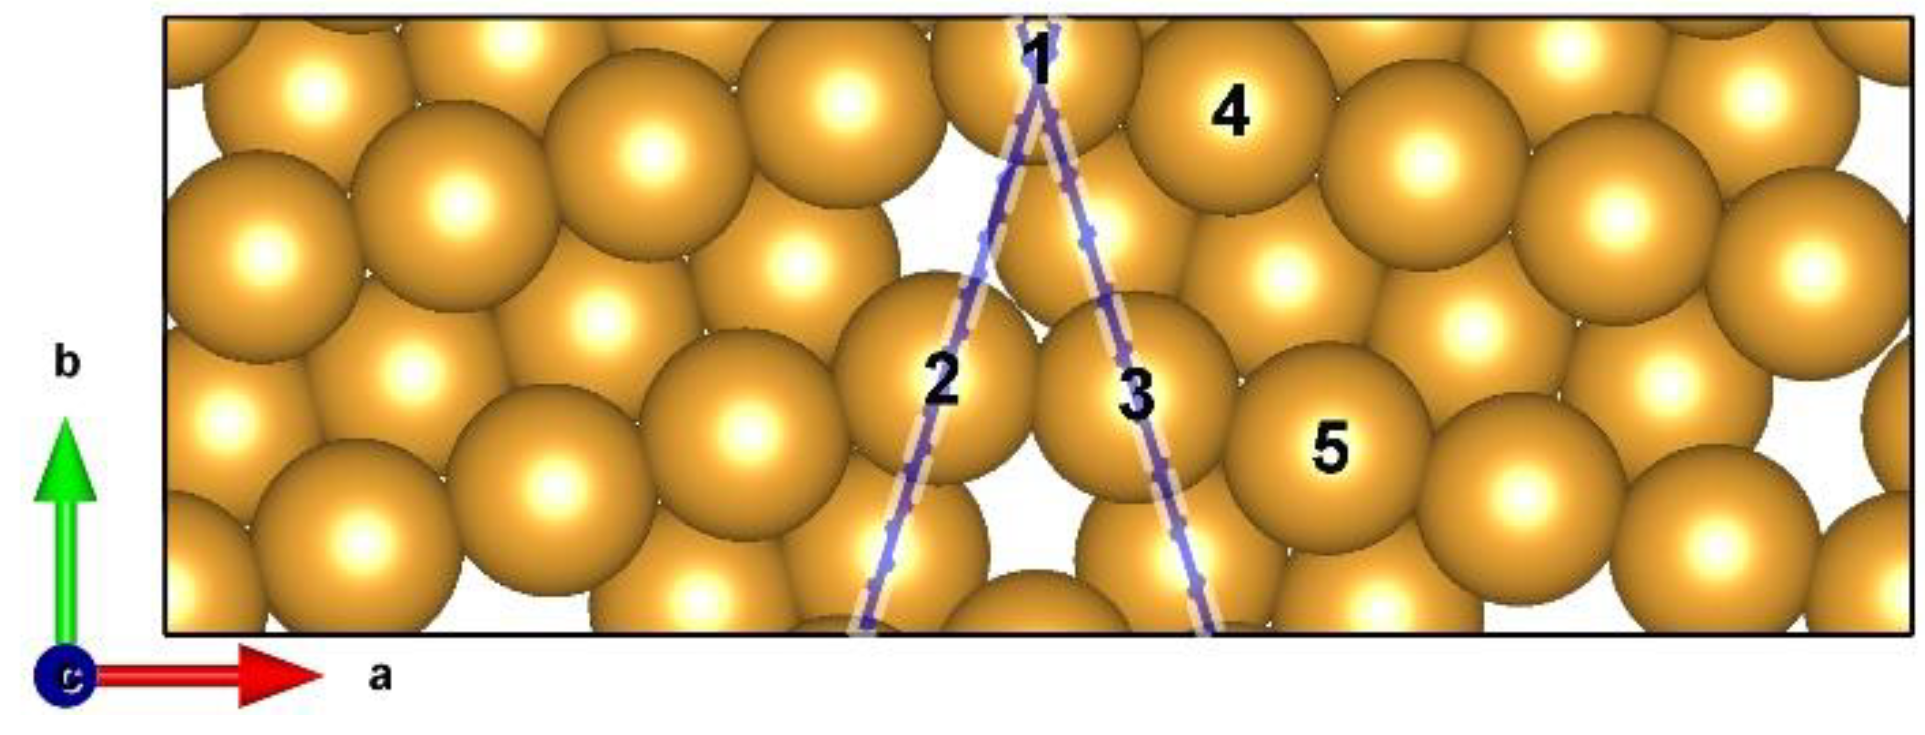
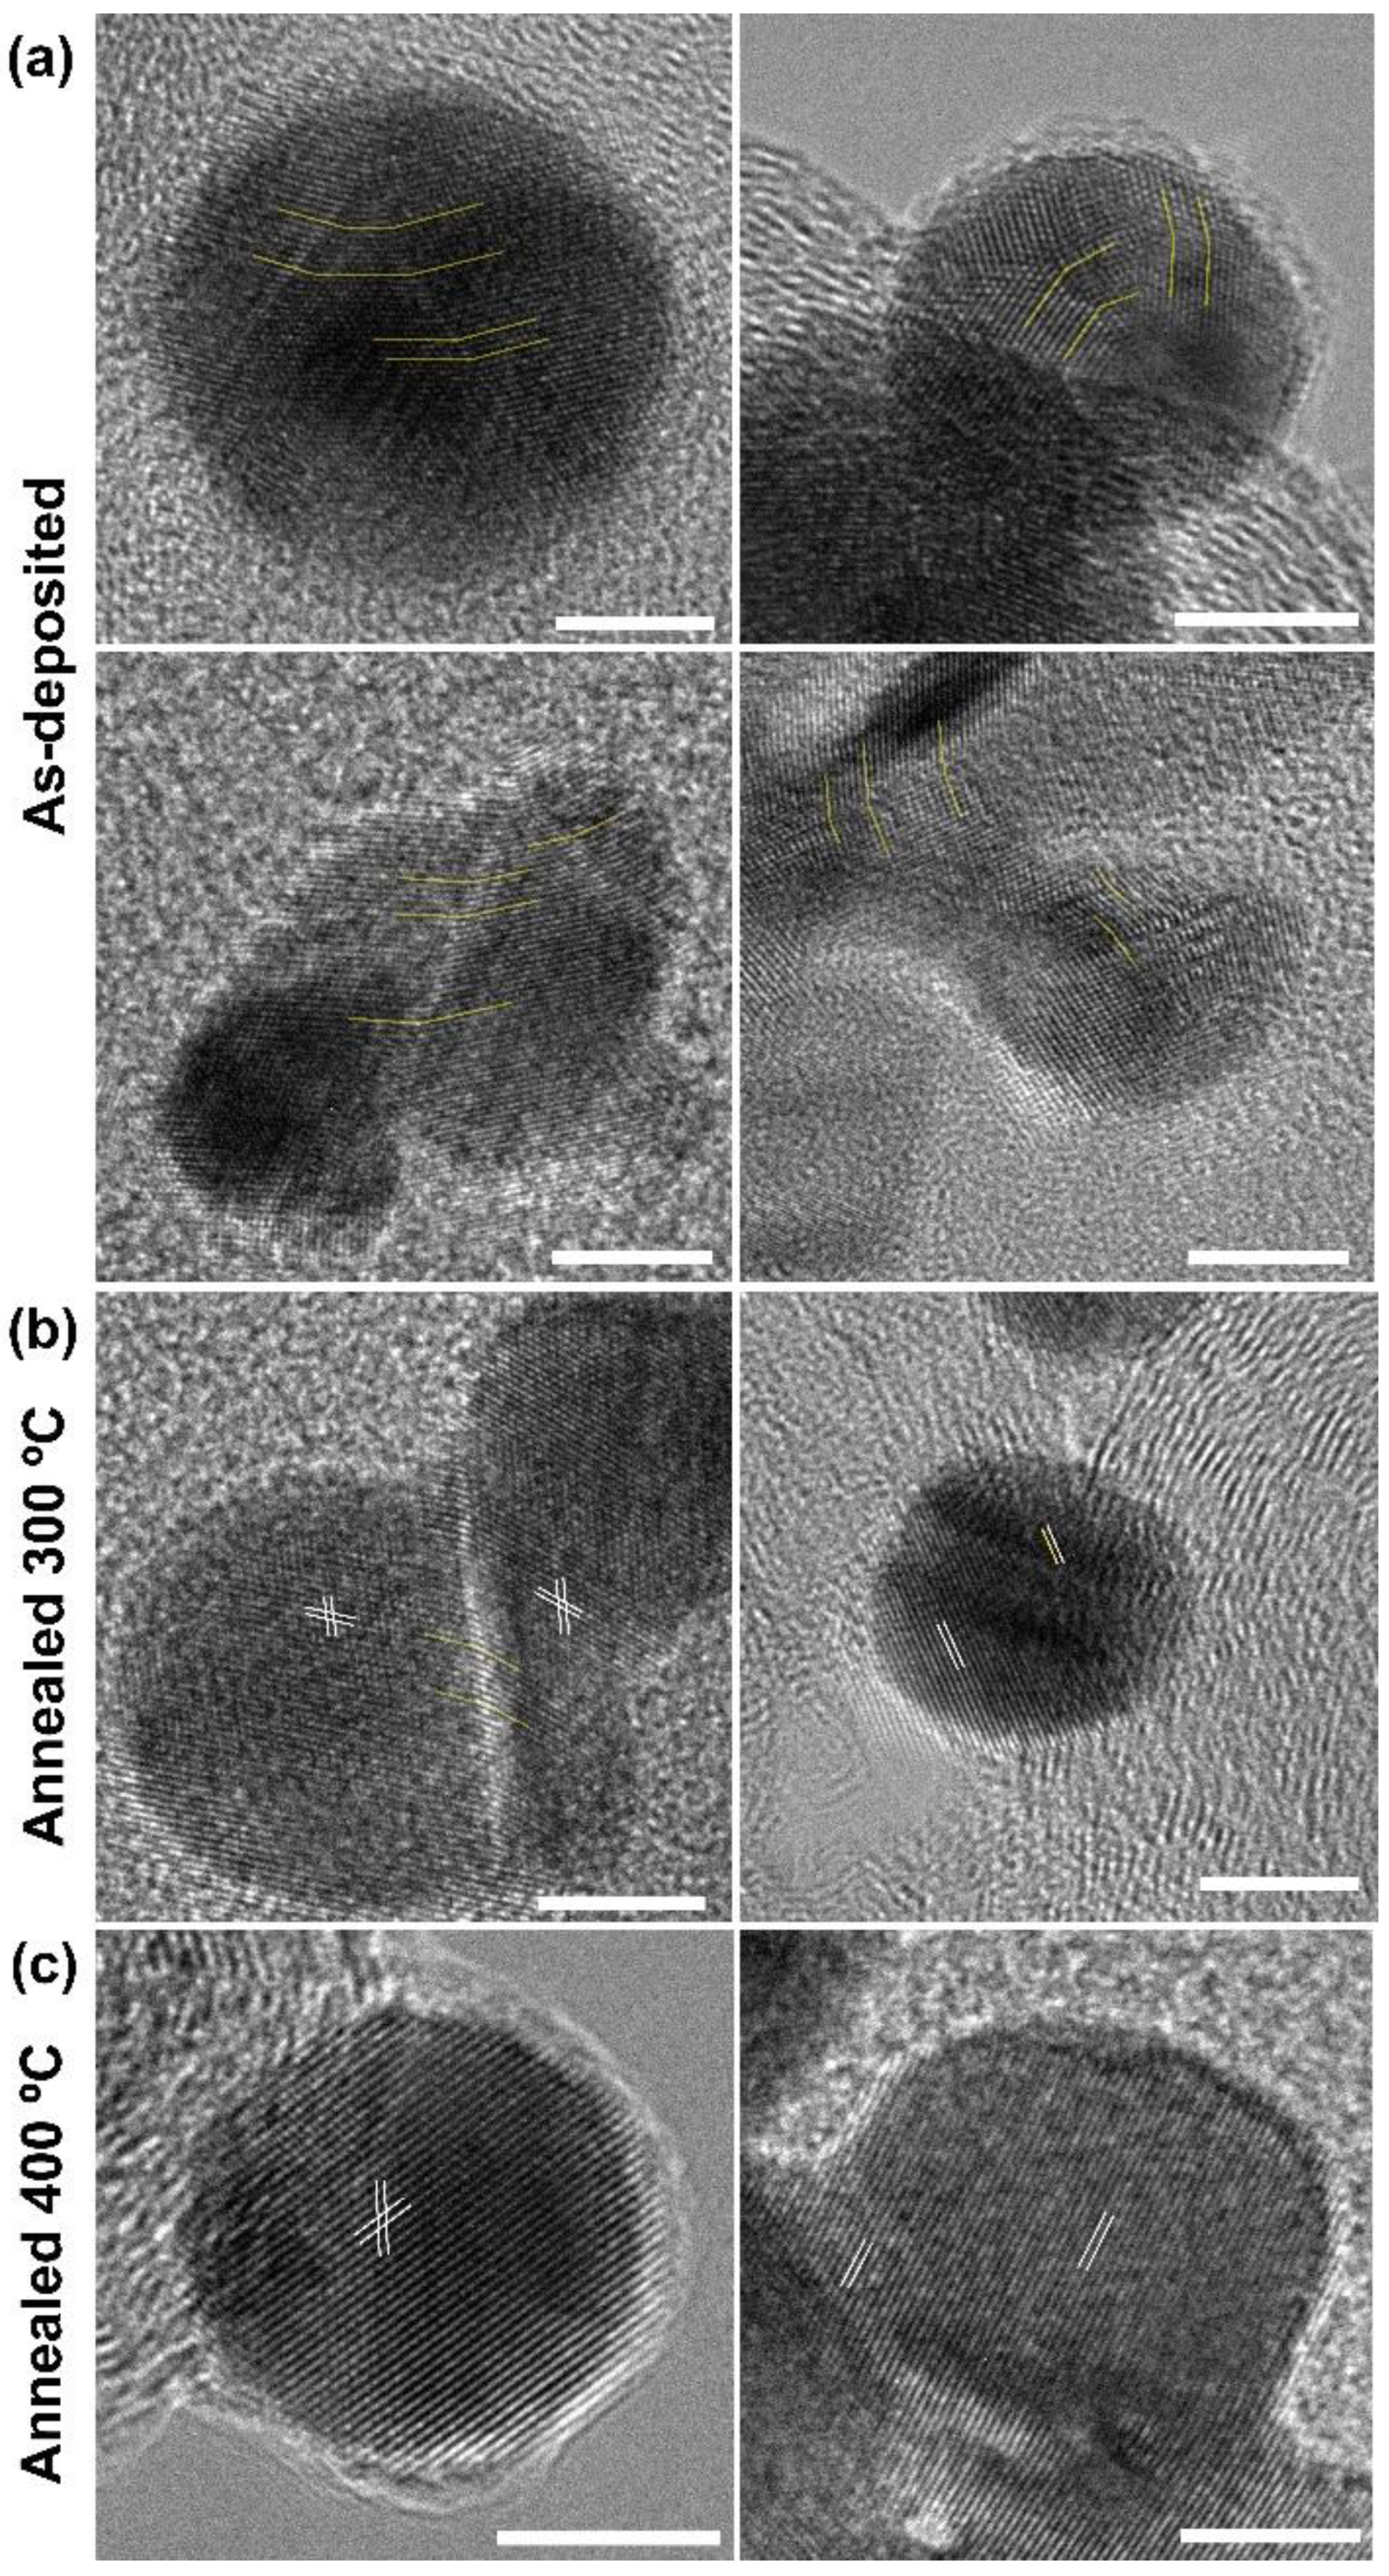
3.2.1. Exposed Surface Characterization

To determine the accessible exposed facet of the as–prepared Au electrodes, we used the lead underpotential deposition (Pb–upd) technique. The Pb–upd process is very sensitive to the surface structure of the gold electrode with a distinct voltammetric profile, where the main peaks appear at different characteristic potentials for different exposed facets of Au electrodes [28,29]. As a result, the main peaks can be used as indicators to characterize the surface structure of the electrode. In Figure 4, it can be clearly observed that the pristine Au/CFP electrode shows only one significant deposition peak in the Pb–upd voltammogram profile, which is located at ~−0.47 V (vs. Ag/AgCl) and corresponds to the (110) facet of Au. Upon scan reversal, the Pb–upd layer is oxidized to dissolved Pb2+ in the form of Pb(OH) in alkaline solution in a sharp peak at ~−0.38 V (vs. Ag/AgCl), which is in good agreement with the results of a previous study [30]. Additionally, the CFP electrode exhibits no Pb–upd peak, suggesting that Pb–upd is attributed to the Au itself. Therefore, Au(110) is the dominant exposed surface faceting of the as–deposited Au/CFP electrodes, which provides the experimental basis for the verification of our GB–assisted HER on Au(110).
We performed a detailed characterization of the morphology and structure of the as–prepared and annealed Au/CFP. From SEM and compositional maps (Figure S2), it can be seen that Au is deposited on the CFP electrode with a uniform distribution and a small particle size. The as–deposited Au/CFP was characterized by X–ray diffraction (XRD) (Figure S3). When the sputtering time is short, such as 30 s or 2 min, the intensity of the Au diffraction peaks is weak, because the content of Au is small and the particle size is small.
The morphological structures of the as–deposited and annealed Au/CFP were investigated via transmission electron microscopy (TEM) observation (Figure 5). The high–resolution TEM (HR–TEM) images show a lattice fringe spacing of 2.35 Å corresponding to the (111) facet direction of the Au nanoparticles (NPs). It can be clearly seen that the as–deposited Au NPs feature a representative surface rich in GBs, showing a polycrystalline character to some extent (Figure 5a). Notably, the grain boundary angle in Figure 5a is similar to that in our calculated GBs surface model (Figure 1).
To control the density of the GBs on Au(110), we annealed the pristine Au/CFP under an Ar atmosphere at different temperatures, namely, 300 °C and 400 (producing Au/CFP300 and Au/CFP400, respectively). By comparing the change in the morphology before and after annealing, it is interesting to note that the (110) facet is still dominant on various Au/CFP electrodes. In addition, the density of the GBs in the Au NPs dramatically decreases as the annealing temperature is increased (Figure 5b,c). At 300 °C, only a few Au NPs with GBs are observed, and the GB density in the Au NPs becomes much lower, suggesting that most Au NPs are transformed into a monocrystalline form. Nevertheless, Au NPs are completely monocrystalline after annealing at 400 °C.

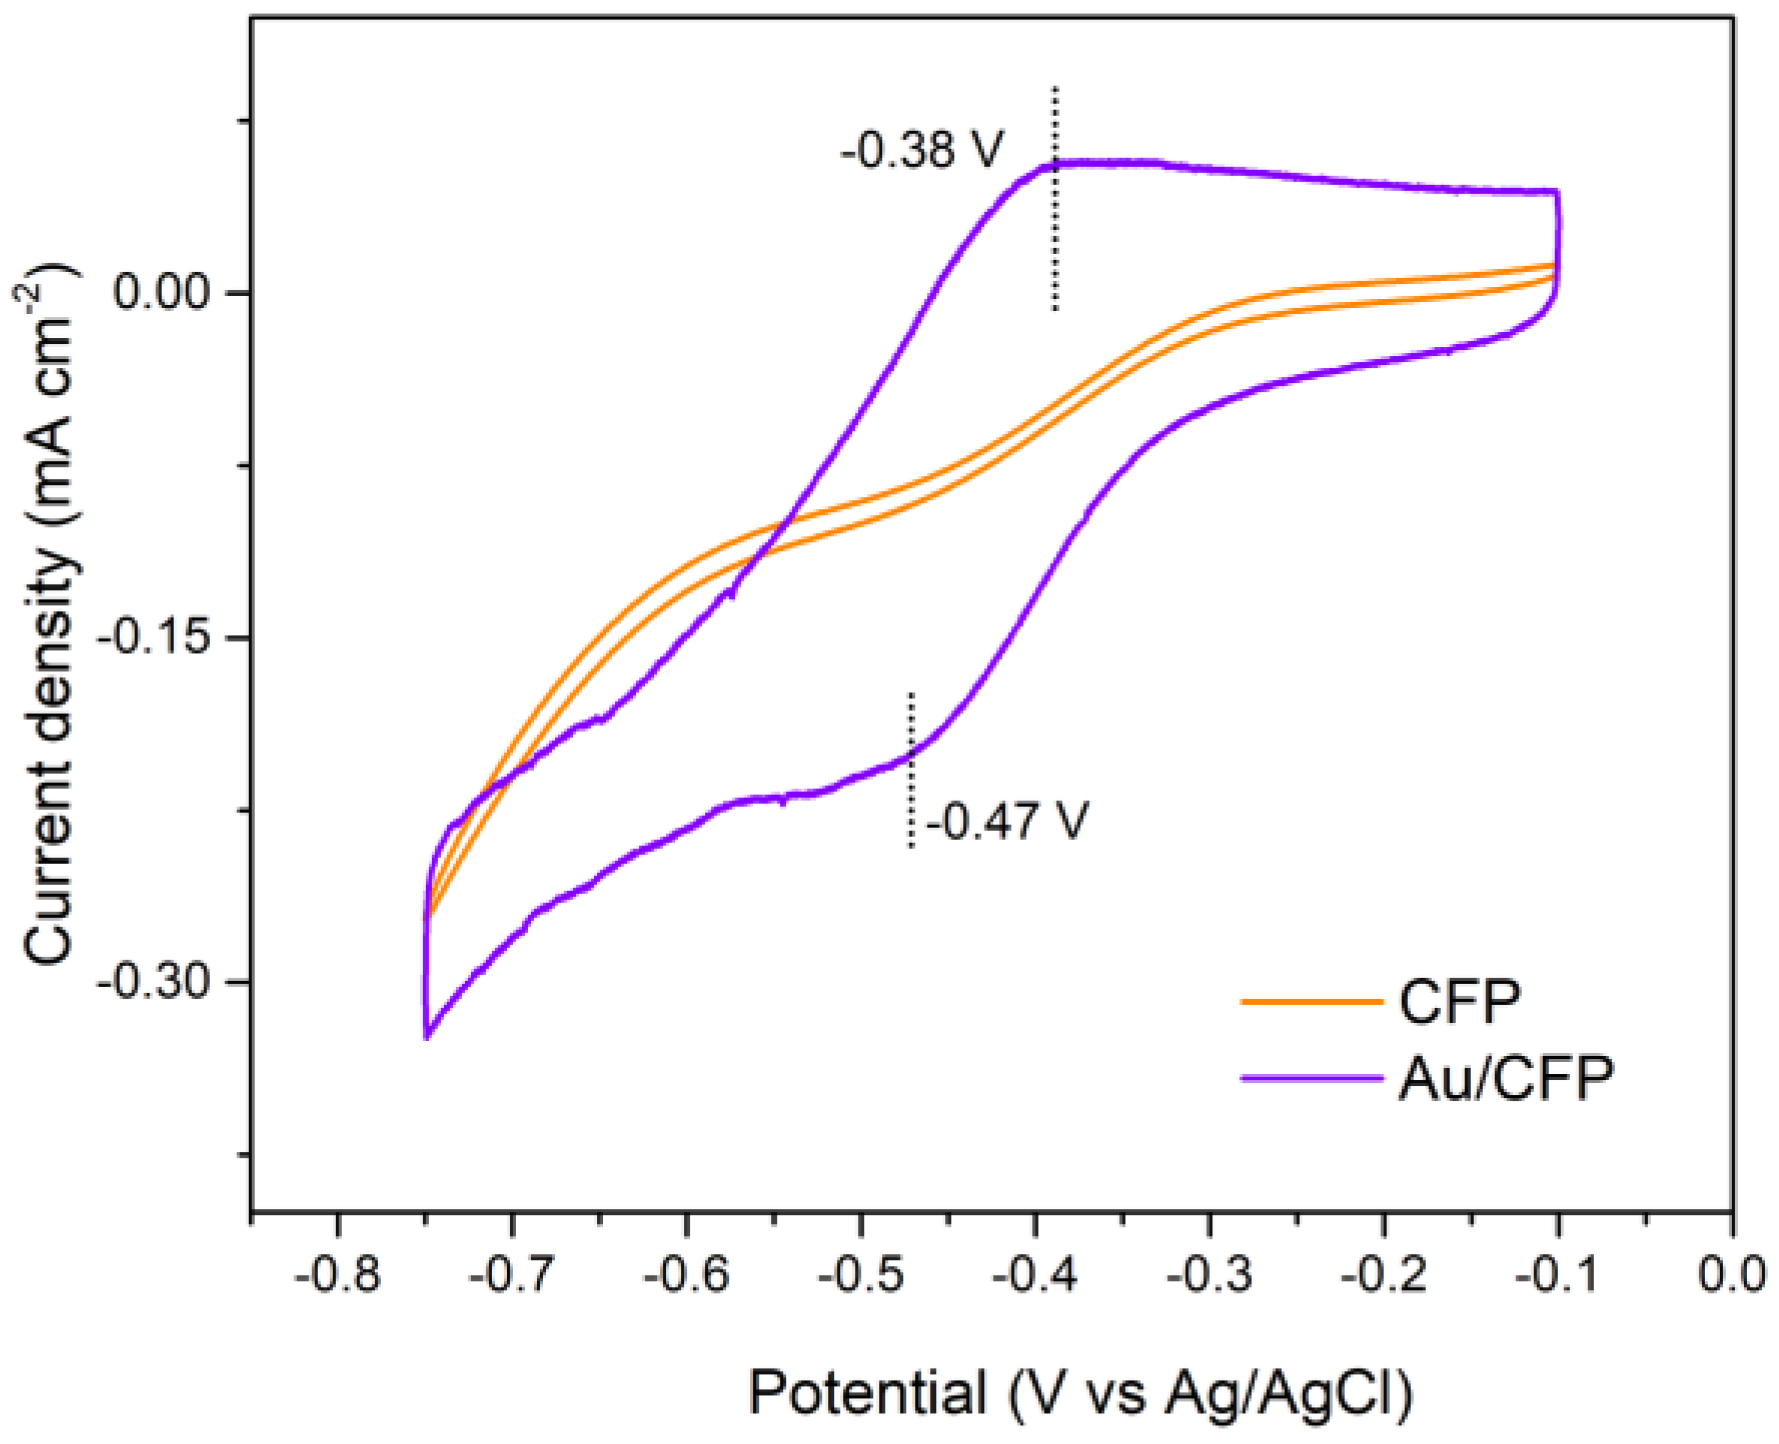
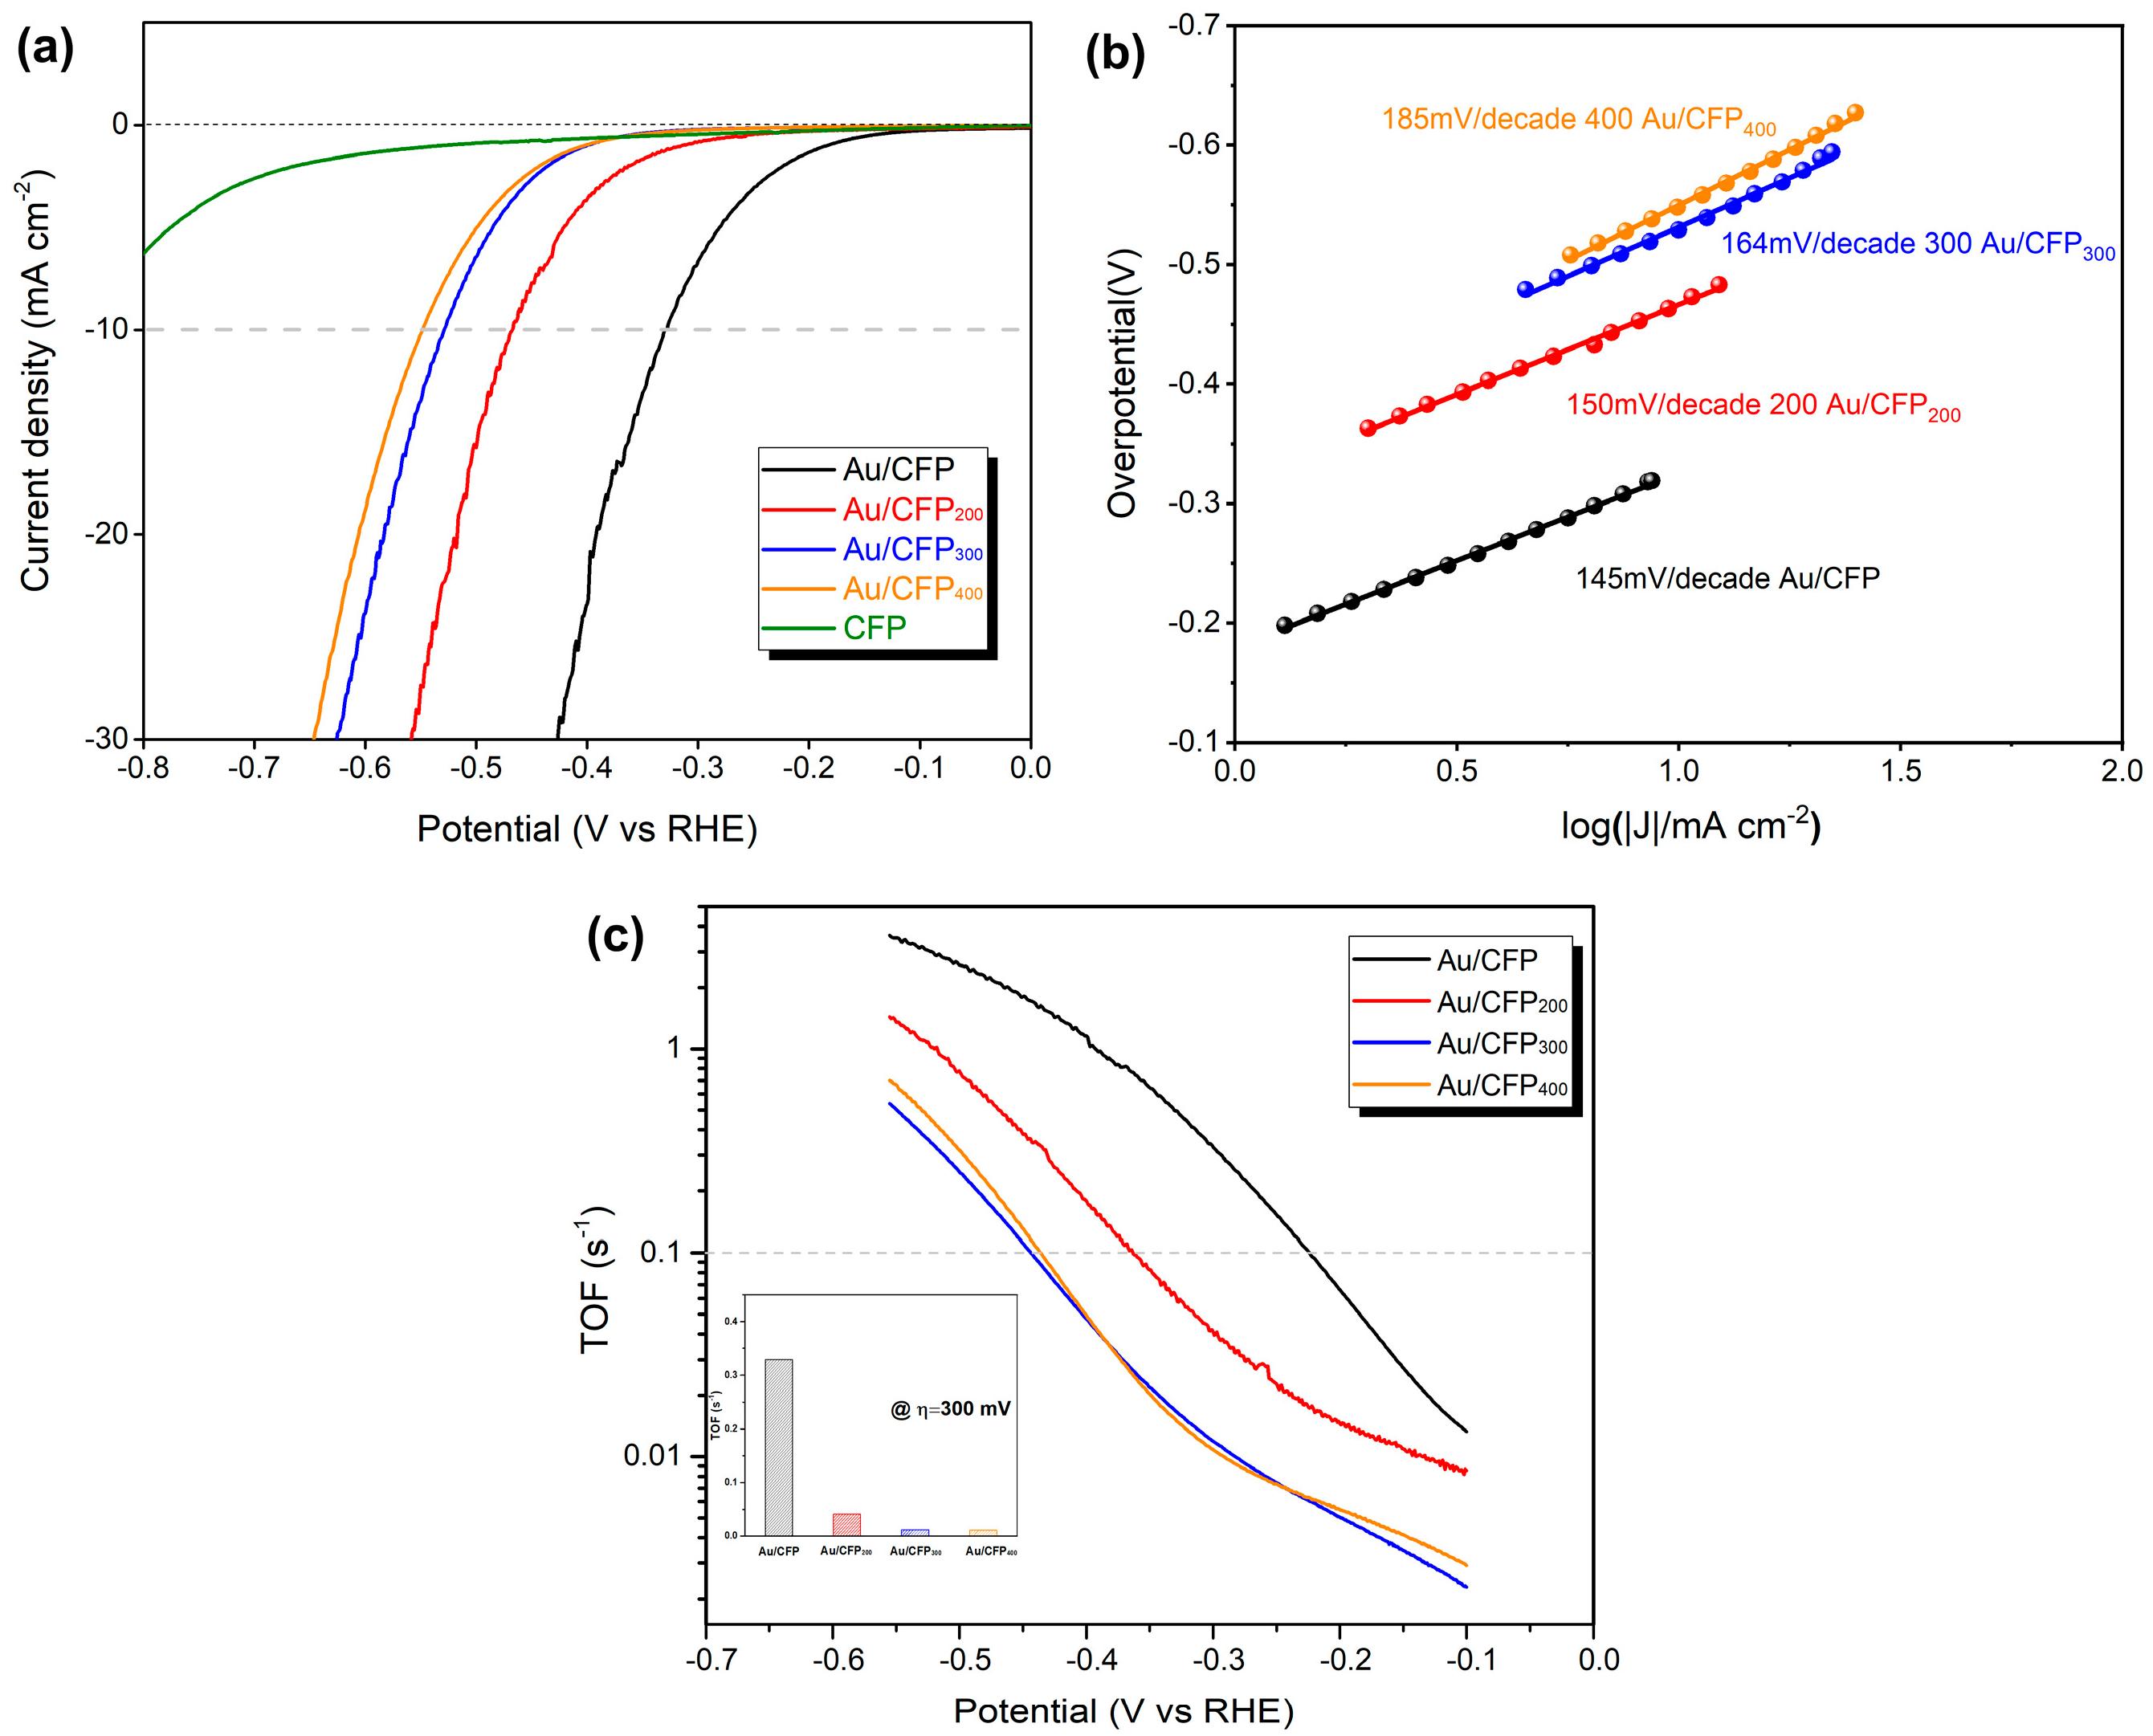
3.2.2. Electrochemical HER Characterization

The effect of GBs on the HER activity of the Au NPs was examined in acid aqueous solution (0.5 M H2SO4). Figure 6a shows representative LSV curves for the CFP substrate, pristine Au/CFP and annealed Au/CFP electrodes (Au/CFP200, Au/CFP300 and Au/CFP400). The CFP substrate has negligible HER activity and, thus, is expected to exert no influence on the current density contribution by the GBs. The pristine as–deposited Au/CFP has the highest HER activity and shows an overpotential of 330 mV at a current density of 10 mA/cm2. By contrast, the overpotentials required to achieve 10 mA/cm2 HER current density for the annealed Au/CFP electrodes are 470 mV (Au/CFP200), 530 mV (Au/CFP300) and 550 mV (Au/CFP400). In combination with the above TEM analysis, the HER activity significantly decreases with the decrease in the density of the GBs in the Au NPs. Au/CFP300 has only a 20 mV lower overpotential than Au/CFP400, as the GBs in the Au NPs almost diminish after annealing at 300 °C and 400 °C, which is consistent with the above TEM observation (Figure 5b,c). Obviously, the experimental LSV curve is in good agreement with our simulated current density curve (Figure 3b). Although it is quite difficult to measure the GB density accurately due to the irregular shape of Au NPs, the overpotential difference (220 mV) still indeed suggests that the GBs in Au NPs could significantly enhance HER activity.
A comparison of Tafel plots for various Au/CFP electrodes is shown in Figure 6b. It can be seen that the introduction of GBs in Au NPs leads to a smaller Tafel slope compared with the GB–free counterparts, resulting in values of 145 and 185 mV dec−1 for Au/CFP and Au/CFP400, respectively. As widely accepted, Tafel slopes of 120, 40 and 30 mV dec−1 have been observed for the Volmer, Heyrovsky and Tafel determining rate steps, respectively [31]. Regarding the HER mechanism, the rate–determining step for this Au catalyst is the Volmer reaction, i.e., the initial adsorption of protons from the acid solution to form adsorbed H [10]. Of note is that GBs may change the rate–determining step (RDS); that is, RDS may be changed from binding H* to desorbing hydrogen at Au atoms around the GBs by increasing the capability of binding H (Figure 2a, Table S2), which is in agreement with the theoretical ΔGH* for the GB sites and normal sites (Figure 2a).
To exclude the improvement in HER activity caused by particle size and surface areas, we calibrated the electrochemically active (EA) surface area (Figure S4) of the as–prepared Au/CFP electrodes. Based on the EA surface area, we then calculated the turnover frequency (TOF) per surface Au atom to compare the intrinsic activity of various Au/CFP electrodes. Figure 6c shows the experimental TOF as a function of applied overpotential. The TOF value increases with the overpotential following the Tafel behavior for all Au/CFP electrodes. The TOF value of the as–deposited Au/CFP is even higher than those of the other annealed Au/CFP electrodes, indicating that, after annealing treatment, the highly effective sites for the HER significantly decrease. Additionally, the TOF values of Au/CFP300 and Au/CFP400 are almost the same over the whole overpotential range. Specifically, at an overpotential of 300 mV, the as–deposited Au/CFP electrode exhibits a high TOF value of 0.33 s−1, which is extremely higher than those of the annealed Au/CFP electrodes (0.04 s−1 for Au/CFP200 and 0.01 s−1 for Au/CFP300 and Au/CFP400) (see inset, Figure 6c). The trend in the TOF value for various Au/CFP electrodes is consistent with LSV and Tafel, and it is inherently correlated with the decrease in the density of the GBs on the Au surface after annealing (Figure 5). Thus, creating GBs is a much more effective strategy to improve HER activity of the originally inactive metal electrocatalyst.

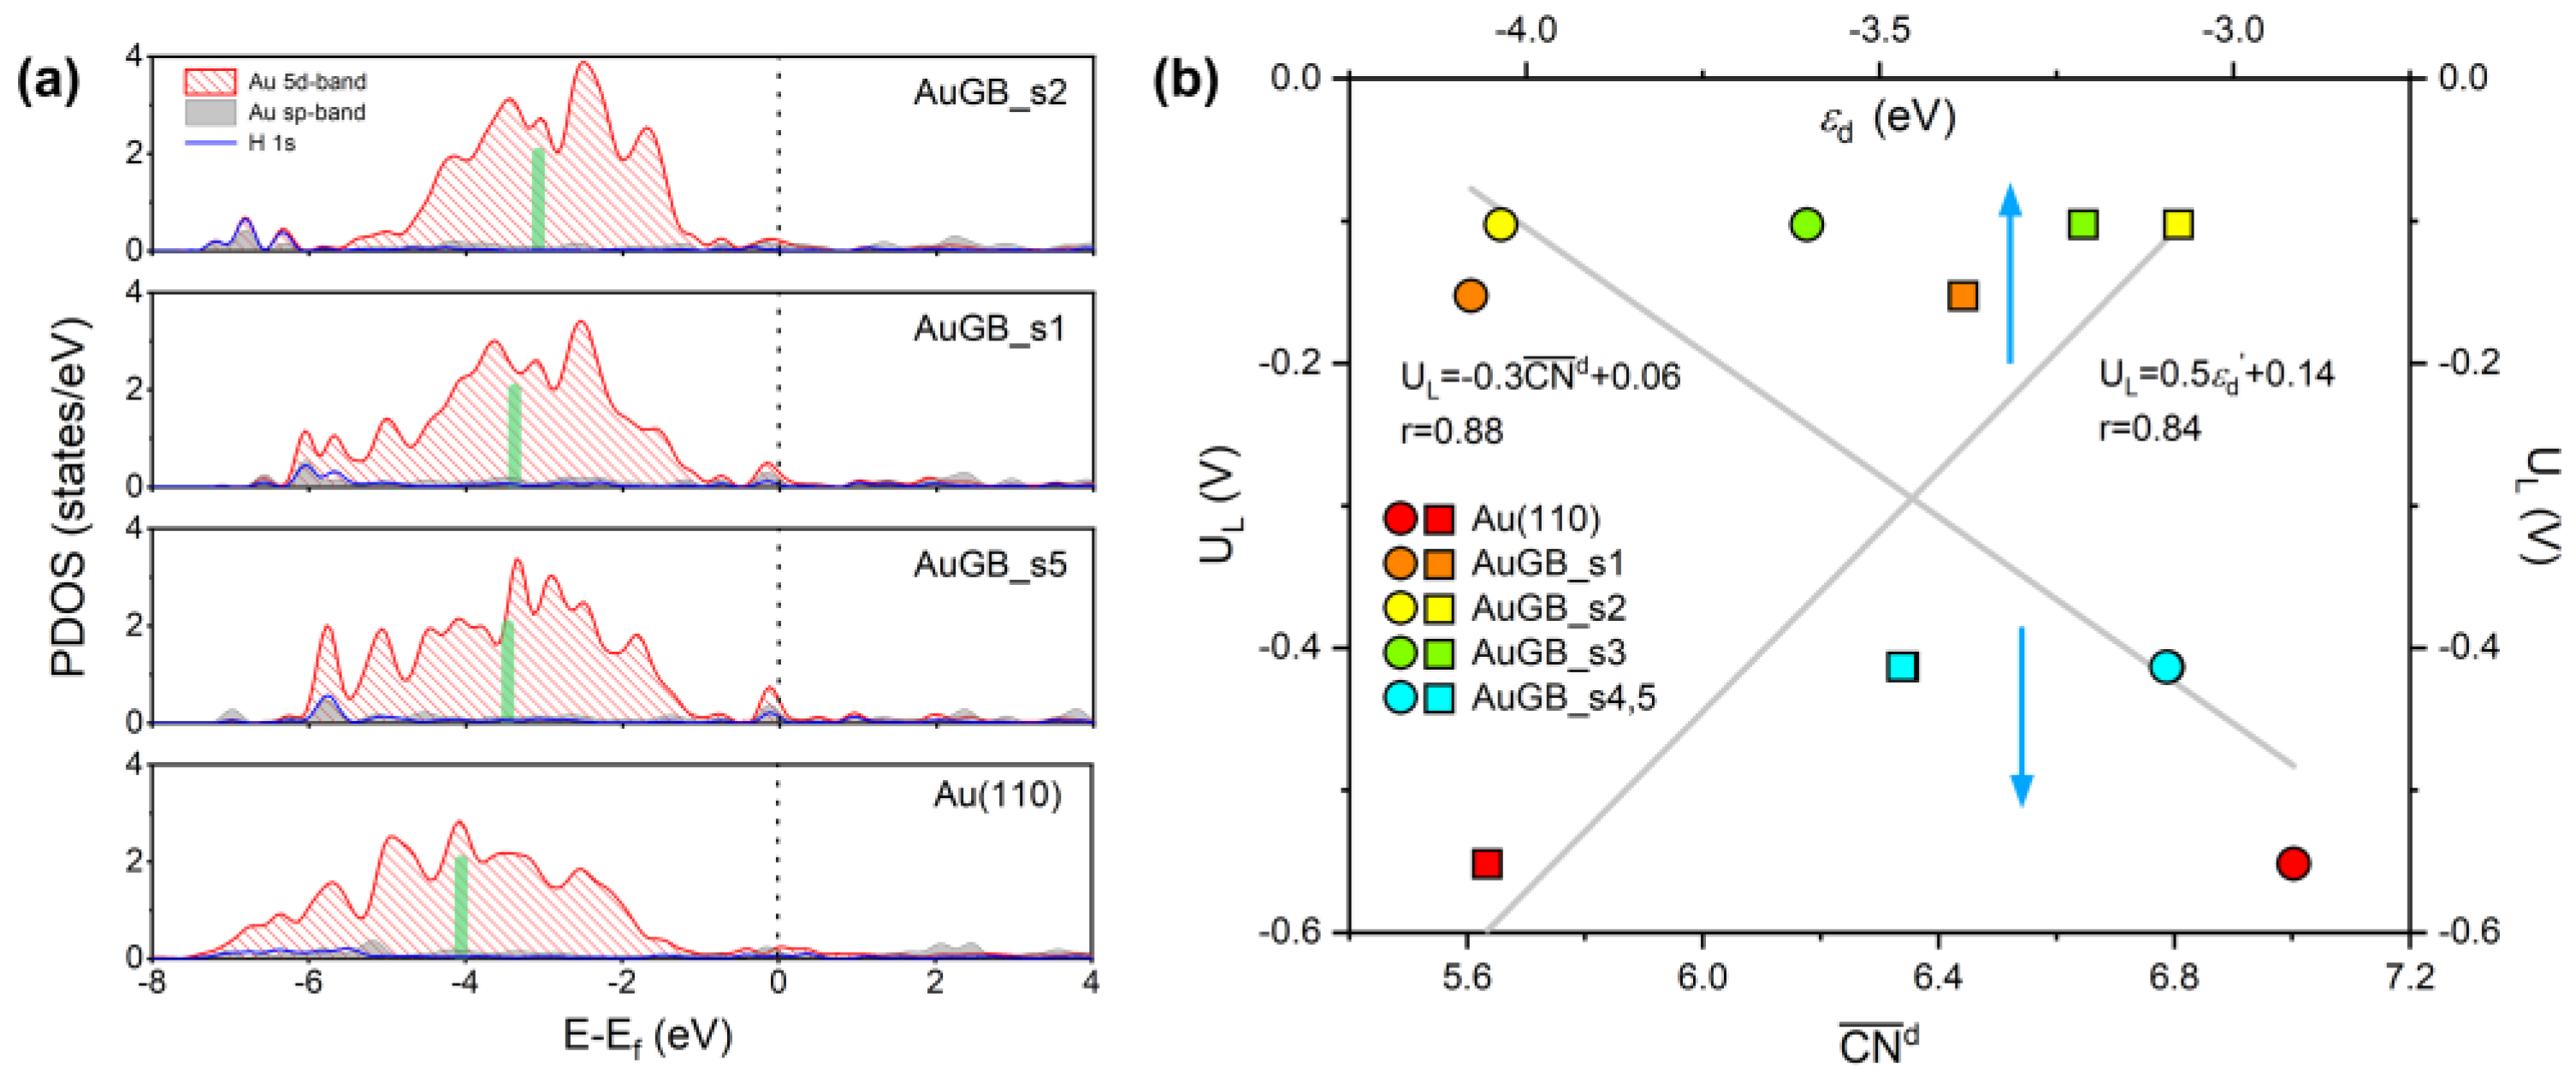
3.3. Origin of GB–Enhanced HER

Although Au(110) is not a traditional active catalyst for the hydrogen evolution reaction [20], it becomes a great activity catalyst for the HER by forming grain boundaries, as stated above. The improved HER activity is ascribed to the H* binding energy caused by the GBs in the Au electrocatalyst. As the strength to bind H* is inherently decided by the underlying electronic structure of the catalyst itself, we focus on the differences in atomic and electronic structures, which may provide good guidance. The density of states (DOS) is calculated to understand the interaction between the H atoms and Au GB sites and, thus, to gain an insight into the different HER activities of the GB sites. Only the 5d–projected DOS of Au atoms is presented because Au 5d orbitals decide the formation of H−Au bonds. Figure 7 shows the Au 5d orbital–projected DOS (PDOS) onto s1, s2 and s5 on Au(110) with GBs. The 5d–PDOS of the flat Au(110) with H* is also presented for comparison. Compared with the GB–free Au(110), the peak positions and shapes of Au(110) with GBs vary. The variation in the H* binding strength for different GBs sites can be explained by a d–band model, in which the d–band center (εd) is correlated with the adsorption energy of the adsorbate by considering either the adsorbed H* state by itself or the energy–level realignment in the HER process [32]. As previously mentioned, neither a too strong nor a too weak binding strength is suitable for HER, and an appropriate εd can ensure an appropriate strength of the H−Au bond and catalytic activity for the HER. The value of εd can be calculated by
ε d = + E × D O S ( E ) d E + D O S ( E ) d E
Considering the dominant role of d–states under the Fermi level in the H* binding process, we integrated the domain of the Au 5d states below the Fermi energy to obtain an effective εd. As seen in Figure 7a, the εd values for s1, s2 and s5 around the GBs are calculated to be −3.38 eV, −3.08 eV and −3.47 eV, respectively, higher than the GB–free Au(110) surface (−4.05 eV). That is, GBs indeed allow εd to shift up toward the Fermi energy on the Au(110) surface. It is well known that a higher d–band center corresponds to stronger adsorption [32]. Consequently, the upper shift of εd suggests that the sites near GBs have a larger H* binding strength and, thus, a lower UL in comparison with the clean Au surface. To quantitively evaluate the relationship between HER activity and the electronic structure of Au(110) GBs, we present the trend in UL(H*) on different GB sites as a function of εd in Figure 7b. We can see that εd exhibits an approximately linear relationship with UL with r = 0.84, suggesting that the sites just at the GBs are superior to the sites near the GBs.
In fact, GBs feature disorder of the atomic arrangement, where under–coordinated atoms exist; we can also elucidate the origin of GB–assisted HER from a geometrical point of view. By considering the environment of their neighboring atoms, we use the concept of the bond–energy–integrated coordination number ( CN ¯ d ) proposed by us [33,34]. CN ¯ d can differentiate the surface sites in HER activity. The CN ¯ d of the five active sites mentioned above is calculated according to the following expression [34]:
CN ¯ d = i j r i j < r c μ i d ( 2 ) ( V n n d , ) 2
where μ i d ( 2 ) is the second moment of the local density of states projected on the d orbital of site i, which is calculated by summing the square of the d–electron hopping integrals to the neighboring d orbitals by only counting the first nearest neighboring atom j within a cutoff distance of rc = 3.2 Å. Vdsσ, Vddσ, Vddπ and Vddδ are the d–electron hopping integrals to the s or d orbital of the first nearest–neighbor atom for the formation of σ, π and δ bonds. V n n d , is the corresponding d–electron hopping integral in bulk metal, which is a constant for the catalysts of the same metal.
In Figure 7b, we can see that CN ¯ d exhibits an approximately linear relationship with UL, with r = 0.88. The sites around the GBs (s1–s5) have a smaller CN ¯ than those on the flat Au(110) surface (=7.00). Of note is that a decrease in CN ¯ d corresponds to a decrease in UL. As stated above, UL is strongly correlated with H* binding strength; therefore, a smaller CN ¯ d implies a higher EB[H*] for Au GBs and, thus, better HER performance. Therefore, HER activity (or H* binding) can be directly evaluated by the CN ¯ d of the active sites around the GBs. Compared with the flat extended surface, atoms around GBs have no regular arrangement; that is, they are rich in atomic disorder, leading to the lack of complete coordination (unsaturated coordination). Thus, strong Au–H bonds have to form to compensate for the lack of coordination, following the bond–order conservation theory [35,36], leading to a higher H* binding capacity of the sites around GBs. By making a comparison with the UL CN ¯ d relationship, it is evident that a smaller CN ¯ d corresponds to a larger εd shift, indicating that the lack of a coordination number alters the εd of active sites around GBs. Hence, in the present case, the bond–energy–integrated coordination number or the d–band center theory explains the origin of the improved HER activity; both originated from the disorder of the atomic arrangement, which inherently exists at GBs.

4. Conclusions

In summary, via DFT simulations, we studied the HER performance of Au mediated by GBs. The active site around GBs exhibited superior HER performance with a remarkably low overpotential required, which arose from the significant enhanced capacity of binding H. The Au catalyst with GBs was experimentally prepared using the magnetron sputtering technique, and it exhibited superior HER activity compared to the Au catalyst without GBs. HER activity was inherently correlated with the density of the GBs in the Au catalyst, where active sites bind hydrogen more strongly. The possible reasons for this increase in H* binding ability were discussed, including geometrical and electronic features. The origin of the GB–assisted HER was the disorder of the atomic arrangement in the GB region on the Au surface, leading to the lack of complete coordination; thus, a strong H–Au bond formed to compensate for the lack of coordination. In addition, this disorder gave rise to the migration of the d–band center upward to the Fermi energy, leading to increased bonding. The GB–mediated HER performance emphasizes that the GB technique may be particularly suitable for applications in practical electrochemical hydrogen production.

Supplementary Materials

The following supporting information can be downloaded at: https://www.mdpi.com/article/10.3390/app12094290/s1, Figure S1: Front and side views of fully relaxed periodic supercells for ∑6{2–21} HAGB; Figure S2: SEM images of as–prepared (a) and annealed Au/CFP electrodes at 300 °C (c) and 400 °C (e). Compositional maps of as–prepared (b) and annealed Au/CFP electrodes at 300 °C (d) and 400 °C (f), with red indicating Au and green indicating carbon; Figure S3: X–ray diffraction patterns of Au/CFP for 30 s, 2 min and 5 min magnetron sputtering; Figure S4: Cyclic voltammograms under different scan rates for (a) Au/CFP, (b) Au/CFP300 and (c) Au/CFP400. (d) Electrochemically active (EA) surface area derived from a change in charging current density related to scan rate; Table S1: Calculated values for conversion of electronic energies to free energies. Assumed fugacities for gaseous H2 are also included; Table S2: Calculated values for conversion of electronic energies to free energies on the GBs on Au(110) surface. Assumed fugacities for gaseous species are also included; Table S3: Calculated values for conversion of electronic energies to free energies of metals on (111) and (211) surfaces. Assumed fugacities for gaseous species are also included; Table S4: Calculated values for conversion of electronic energies to free energies of metals on (100) and (110) surfaces. Assumed fugacities for gaseous species are also included; Table S5: The flat surface and grain boundary active sites on Au(110). The coordination numbers and band centers are given.

Author Contributions

Data curation, formal analysis and writing—original draft preparation, R.J.; methodology and software, J.F.; supervision, Z.W.; supervision, funding acquisition and writing—review and editing, C.D. All authors have read and agreed to the published version of the manuscript.

Funding

This research was funded by Natural Science Foundation of China (No.21403152) and Tianjin Natural Science Foundation (16JCQNJC05700).

Institutional Review Board Statement

Not applicable.

Informed Consent Statement

Not applicable.

Data Availability Statement

This study did not report any data.

Acknowledgments

This study was supported by the Natural Science Foundation of China (No. 21403152) and the Tianjin Natural Science Foundation (16JCQNJC05700).

Conflicts of Interest

The authors declare no conflict of interest.

References

  1. Jacobson, M.Z.; Colella, W.G.; Golden, D.M. Cleaning the air and improving health with hydrogen fuel-cell vehicles. Science 2005, 308, 1901–1905. [Google Scholar] [CrossRef] [PubMed] [Green Version]
  2. Zheng, Y.; Jiao, Y.; Jaroniec, M.; Qiao, S.Z. Advancing the Electrochemistry of the Hydrogen-Evolution Reaction through Combining Experiment and Theory. Angew. Chem. Int. Ed. 2015, 54, 52–65. [Google Scholar] [CrossRef] [PubMed]
  3. Conway, B.E.; Tilak, B.V. Interfacial processes involving electrocatalytic evolution and oxidation of H2 and the role of chemisorbed H. Electrochim. Acta 2002, 47, 3571–3594. [Google Scholar] [CrossRef]
  4. Li, H.; Tsai, C.; Koh, A.L.; Cai, L.; Contryman, A.W.; Fragapane, A.H.; Zhao, J.; Han, H.S.; Manoharan, H.C.; Abild–Pedersen, F.; et al. Activating andoptimizing MoS2 basal planes for hydrogen evolution through the formation ofstrained sulphur vacancies. Nat. Mater. 2016, 15, 48–53. [Google Scholar] [CrossRef]
  5. Voiry, D.; Yamaguchi, H.; Li, J.; Silva, R.; Alves, D.C.B.; Fujita, T.; Chen, M.; Asefa, T.; Shenoy, V.B.; Eda, G.; et al. Enhanced catalytic activity in strained chemically exfoliated WS2 nanosheets for hydrogen evolution. Nat. Mater. 2013, 12, 850–855. [Google Scholar] [CrossRef]
  6. Jaramillo, T.F.; Jørgensen, K.P.; Bonde, J.; Nielsen, J.H.; Horch, S.; Chorkendorff, I. Identification of Active Edge Sites for Electrochemical H2 Evolution from MoS2 Nanocatalysts. Science 2007, 317, 100–102. [Google Scholar] [CrossRef] [Green Version]
  7. Conway, B.E.; Bockris, J.O.M. Electrolytic Hydrogen Evolution Kinetics and Its Relation to the Electronic and Adsorptive Properties of the Metal. J. Chem. Phys. 1957, 26, 532–541. [Google Scholar] [CrossRef]
  8. Parsons, R. The rate of electrolytic hydrogen evolution and the heat of adsorption of hydrogen. Trans. Faraday Soc. 1958, 54, 1053–1063. [Google Scholar] [CrossRef]
  9. Greeley, J.; Jaramillo, T.F.; Bonde, J.; Chorkendorff, I.; Nørskov, J.K. Computational high-throughput screening of electrocatalytic materials for hydrogen evolution. Nat. Mater. 2006, 5, 909–913. [Google Scholar] [CrossRef]
  10. Nørskov, J.K.; Bligaard, T.; Logadottir, A.; Kitchin, J.R.; Chen, J.G.; Pandelov, S.; Stimming, U.J. Trends in the exchange current for hydrogen evolution. Electrochem. Soc. 2005, 152, J23–J26. [Google Scholar] [CrossRef] [Green Version]
  11. Lv, H.; Xi, Z.; Chen, Z.; Guo, S.; Yu, Y.; Zhu, W.; Li, Q.; Zhang, X.; Pan, M.; Lu, G.; et al. A New Core/Shell NiAu/Au Nanoparticle Catalyst with Pt-like Activity for Hydrogen Evolution Reaction. J. Am. Chem. Soc. 2015, 137, 5859–5862. [Google Scholar] [CrossRef] [PubMed]
  12. Gao, D.; Guo, J.; Cui, X.; Yang, L.; Yang, Y.; He, H.; Xiao, P.; Zhang, Y. Three-Dimensional Dendritic Structures of NiCoMo as Efficient Electrocatalysts for the Hydrogen Evolution Reaction. ACS Appl. Mater. Interfaces 2017, 9, 22420–22431. [Google Scholar] [CrossRef] [PubMed]
  13. Li, G.; Zhang, D.; Qiao, Q.; Yu, Y.; Peterson, D.; Zafar, A.; Kumar, R.; Curtarolo, S.; Hunte, F.; Shannon, S.; et al. All the Catalytic Active Sites of MoS2 for Hydrogen Evolution. J. Am. Chem. Soc. 2016, 138, 16632–16638. [Google Scholar] [CrossRef]
  14. Vidruk, R.; Landau, M.V.; Herskowitz, M.; Talianker, M.; Frage, N.; Ezersky, V.; Froumin, N.J. Grain boundary control in nanocrystalline MgO as a novel means for significantly enhancingsurface basicity and catalytic activity. J. Catal. 2009, 263, 196–204. [Google Scholar] [CrossRef]
  15. Gavrilov, A.N.; Savinova, E.R.; Simonov, P.A.; Zaikovskii, V.I.; Cherepanova, S.V.; Tsirlina, G.A.; Parmon, V.N. On the influence of the metal loading on the structure of carbon–supported PtRu catalysts and their electrocatalytic activities in CO and methanol electrooxidation. Phys. Chem. Chem. Phys. 2007, 9, 5476–5489. [Google Scholar] [CrossRef] [PubMed]
  16. Li, C.W.; Ciston, J.; Kanan, M.W. Electroreduction of carbon monoxide to liquid fuel on oxide—derived nanocrystalline copper. Nature 2014, 508, 504–507. [Google Scholar] [CrossRef] [PubMed]
  17. Kim, K.-S.; Kim, W.J.; Lim, H.-K.; Lee, E.K.; Kim, H. Tuned Chemical Bonding Ability of Au at Grain Boundaries for Enhanced Electrochemical CO2 Reduction. ACS Catal. 2016, 6, 4443–4448. [Google Scholar] [CrossRef]
  18. Dong, C.; Fu, J.; Liu, H.; Ling, T.; Yang, J.; Qiao, S.Z.; Du, X.-W. Tuning the selectivity and activity of Au catalysts for carbon dioxide electroreduction via grain boundary engineering: A DFT study. Mater. Chem. A 2017, 5, 7184–7190. [Google Scholar] [CrossRef]
  19. Feng, X.; Jiang, K.; Fan, S.; Kanan, M.W. A Direct Grain-Boundary-Activity Correlation for CO Electroreduction on Cu Nanoparticles. ACS Cent. Sci. 2016, 2, 169–174. [Google Scholar] [CrossRef] [Green Version]
  20. Hammer, B.; Nørskov, J.K. Why gold is the noblest of all the metals. Nature 1995, 376, 238–240. [Google Scholar] [CrossRef]
  21. Kresse, G.; Joubert, D. From Ultrasoft Pseudopotentials to the Projector Augmented—Wave Method. Phys. Rev. B Condens. Matter Mater. Phys. 1999, 59, 1758. [Google Scholar] [CrossRef]
  22. Blöchl, P.E. Projector augmented-wave method. Phys. Rev. B 1994, 50, 17953–17979. [Google Scholar] [CrossRef] [PubMed] [Green Version]
  23. de Gennero Chialvo, M.R.; Chialvo, A.C. Existence of Two Sets of Kinetic Parameters in the Correlation of the Hydrogen Electrode Reaction. J. Electrochem. Soc. 2000, 47, 1619–1622. [Google Scholar] [CrossRef]
  24. de Gennero Chialvo, M.R.; Chialvo, A.C. Hydrogen diffusion effects on the kinetics of the hydrogen electrode reaction. Part, I. Theoretical aspects. Phys. Chem. Chem. Phys. 2004, 6, 4009–4017. [Google Scholar] [CrossRef]
  25. Quaino, P.M.; de Gennero Chialvo, M.R.; Chialvo, A.C. Hydrogen diffusion effects on the kinetics of the hydrogen electrode reaction. Part, II. Evaluation of kinetic parameters. Phys. Chem. Chem. Phys. 2004, 6, 4450–4455. [Google Scholar] [CrossRef]
  26. Parsons, R. Catalysis in Electrochemistry; Santos, E., Schmickler, W., Eds.; Wiley: Hoboken, NJ, USA, 2011; Chapter 1; pp. 1–15. [Google Scholar]
  27. Zheng, Y.; Jiao, Y.; Zhu, Y.; Li, L.H.; Han, Y.; Chen, Y.; Du, A.; Jaroniec, M.; Qiao, S.Z. Hydrogen evolution by a metal-free electrocatalyst. Nat. Commun. 2014, 5, 3783. [Google Scholar] [CrossRef] [Green Version]
  28. Hamelin, A. Underpotential deposition of lead on single crystal faces of gold: Part, I. The influence of crystallographic orientation of the substrate. J. Electroanal. Chem. 1984, 165, 167. [Google Scholar] [CrossRef]
  29. Hamelin, A.; Lipkowski, J. Underpotential deposition of lead on gold single crystal faces: Part II. General discussion. J. Electroanal. Chem. 1984, 171, 317. [Google Scholar] [CrossRef]
  30. Hernaández, J.; Solla–Gulloán, J.; Herrero, E. Gold nanoparticles synthesized in a water-in-oil microemulsion: Electrochemical characterization and effect of the surface structure on the oxygen reduction reaction. J. Electroanal. Chem. 2004, 574, 185. [Google Scholar] [CrossRef]
  31. Shinagawa, T.; Garcia–Esparza, A.T.; Takanabe, K. Insight on Tafel slopes from a microkinetic analysis of aqueous electrocatalysis for energy conversion. Sci. Rep. 2015, 5, 13801. [Google Scholar] [CrossRef] [Green Version]
  32. Hammer, B.; Nørskov, J.K. Theoretical surface science and catalysis—Calculations and concepts. Adv. Catal. 2000, 45, 71–129. [Google Scholar]
  33. Wu, D.; Xi, C.; Dong, C.; Liu, H.; Du, X.-W. Bond-energy-integrated coordination number: An accurate descriptor for transition—metal catalysts. J. Phys. Chem. C 2019, 123, 28248–28254. [Google Scholar] [CrossRef]
  34. Xi, C.; Zou, C.; Wang, M.; Wu, D.; Liu, H.; Dong, C.; Du, X.-W. A bond-energy-integrated-based descriptor for high-throughput screening of transition metal catalysts. J. Phys. Chem. C 2020, 124, 5241–5247. [Google Scholar] [CrossRef]
  35. Shustorovich, E.; Sellers, H. The UBI-QEP method: A practical theoretical approach to understanding chemistry on transition metal surfaces. Surf. Sci. Rep. 1998, 31, 1–119. [Google Scholar] [CrossRef]
  36. Kleis, J.; Greeley, J.; Romero, N.A.; Morozov, V.A.; Falsig, H.; Larsen, A.H.; Lu, J.; Mortensen, J.J.; Dułak, M.; Thygesen, K.S.; et al. Finite Size Effects in Chemical Bonding: From Small Clusters to Solids. Catal. Lett. 2011, 141, 1067–1071. [Google Scholar] [CrossRef]
Figure 1. Top view of the Σ6{2–21} HAGB model on Au(110) surface with three atomic layers in an orthogonal supercell (25.29 × 8.94 × 17.80 Å3). The GB area is highlighted by blue lines. The selected Au around GB is labeled as s1–s5.
Applsci 12 04290 g001
Figure 2. (a) The calculated free−energy diagram of HER at the equilibrium potential (U = 0 V) for Au(110) (black), Pt(111) (green) and different active sites on Au GBs. (b) The volcano relation of the limiting potential for HER as a function of EB(H*). The arrow indicates the desired direction for catalyst design with higher activity, and the color pentagrams represent GB sites on Au surface for prodigious promotion of HER. Theoretical overpotentials (ηHER) are the vertical difference between the points and the equilibrium potential (red dashed line).
Applsci 12 04290 g002
Figure 3. (a) Computational exchange current density (log (j0)) for hydrogen evolution over Au GB sites, and various metal surfaces plotted as a function of the hydrogen binding energy. (b) Current density of hydrogen evolution as a function of the applied potentials for Au(110) with varying concentrations of GBs on Au(110), and Pt(111) is presented for comparison. The inset presents a magnified version of the plot.
Applsci 12 04290 g003
Figure 4. Pd−upd voltammetric profile of as−deposited Au/CFP and clean CFP electrodes (0.5 × 1 cm2). Scan rate: 50 mV/s.
Applsci 12 04290 g004
Figure 5. High–revolution TEM images of as–prepared (a) and annealed Au/CFP electrodes at 300 °C (b) and 400 °C (c). The light yellow lines indicate GBs in the Au NPs. The white lines indicate the lattice fringe spacing for Au NPs. The scale bar represents 5 nm.
Applsci 12 04290 g005
Figure 6. Effect of GBs on Au surface on the electrochemical HER activity of Au/CFP electrodes. (a,b) Electrochemically active (EA) surface area−calibrated linear sweep voltammetry (LSV) curves and Tafel plots for four Au/CFP electrodes with a size of 0.5 × 1 cm2 (electrolyte: 0.5 M H2SO4, scan rate: 5 mVs−1). (c) Turnover frequency per surface Au atom of various Au/CFP samples, and the inset is the TOF value obtained at an overpotential of 300 mV.
Applsci 12 04290 g006
Figure 7. (a) Au 5d orbital−PDOS on active sites on Au(110) with and without GBs. The Fermi energy (Ef) is set to zero and is represented by a black vertical dashed line. The green, thick bar represents the εd of a specific atom on Au(110) surface in the absence or presence of GBs. (b) The trends in UL for HER on different GBs sites as a function of CN ¯ d and εd. The perfect Au(110) plane is also presented for comparison.
Applsci 12 04290 g007
Publisher’s Note: MDPI stays neutral with regard to jurisdictional claims in published maps and institutional affiliations.

