Article

Two Approaches to Analyze Whether Citizens’ National Identity Is Affected by Country, Age, and Political Orientation—A Fuzzy Eco-Apostle Model

by
Alessandro Indelicato
* and
Juan Carlos Martín
Institute of Tourism and Sustainable Economic Development, University of las Palmas de Gran Canaria, 35017 Las Palmas de Gran Canaria, Spain
*
Author to whom correspondence should be addressed.
Appl. Sci. 2022, 12(8), 3946; https://doi.org/10.3390/app12083946
Submission received: 3 March 2022 / Revised: 6 April 2022 / Accepted: 12 April 2022 / Published: 13 April 2022
(This article belongs to the Special Issue Applications of Fuzzy Optimization)

Abstract

:
The study analyzes national identity using the International Social Survey Program (ISSP) database for the waves of 2003 and 2013. First, the Exploratory Factor Analysis (EFA) and the Multigroup Confirmatory Factor Analysis (MGCFA) are used to find the dimensions of the items included in the national identity module. Second, the civic and ethnic dimensions are analyzed through both a fuzzy clustering analysis and an extended apostle model to classify citizens’ national identity as the following: (1) post nationalists; (2) ethnic oriented; (3) civic-oriented; (4) credentialists. Third, the fuzzy eco-extended apostle model is applied to analyze 16 different national identity categories, for which the four pure mentioned categories are further studied. Fourth, the effects of some social characteristics, such as country-year, political orientation-year, and age-year, on the respective pure national Identity categories are studied using two distinct approaches, namely, contingency tables and conditional probability ratios. Results show that citizens tend to be more pure-credentialist than any other category and that social characteristics play a determinant role in explaining each category of citizens’ national identity.

1. Introduction

Tamir [1] affirms that “Nationalism is one of those words that evokes a knee-jerk, invariably negative response in polite company. Associated with military aggression, genocide, and ethnic cleansing, it is tainted by the worst horrors of the twentieth century. Our present-day demagogues and populists in the United States and Europe—Donald Trump, Marine Le Pen, Viktor Orban, and others—are further reinforcing this image by fanning the flames of nativism, xenophobia, and religious bigotry in its name” [1] (p. 33). Various theories have defined national identity as having linguistic, religious, and ethnic traits [2,3,4,5,6]. Furthermore, literature is divided between those who define national identity as a personal characteristic based on civic and ethnic criteria [4] and those who identify the most inclusive nationalism that shapes a moral community [7].
Following the studies by [4,8,9], data from the International Social Survey Program (ISSP) were extracted for two different waves, 2003 and 2013, and for the following ten countries: Denmark, France, Germany, Ireland, Norway, Portugal, Russia, Spain, Great Britain, and the United States. This study analyses the different dimensions of national identity and how these are influenced by different social characteristics. First, the Exploratory Factor Analysis (EFA) was used to analyze whether the previous ethnic and civic dimensions obtained in other studies were present in the dataset. Second, the Multigroup Confirmatory Factor Analysis (MGCFA) was used to confirm the adequacy of the two dimensions. Third, using two fuzzy logic methods, such as the fuzzy hybrid TOPSIS (The Technique for Order of Preference by Similarity to Ideal Solution) and the fuzzy clustering analysis, the national identity, ethnic, and civic dimensions are studied for each citizen. Fourth, the eco-apostle model is extended with the help of the membership functions of the fuzzy cluster analysis to divide the individuals according to the national identity categories as follows: (1) post-nationalists; (2) ethnic-oriented; (3) civic-oriented; (4) credentialists. Finally, using two different approaches, contingency tables and conditional probability ratios, the effects of three social covariates, namely, country-year, political orientation-year, and age-year, are analysed for each of the four pure nationalist categories.
Thus, the study aims to provide a new methodology for social science research in the context of national identity, complementing other previous prestigious studies [4,9,10,11]. The main advantages of the eco-extended model are mainly based on considering uncertainty in a situation where the indicators are extracted from subjective and vague answers. The following section presents the literature review that contextualizes the study.

2. National Identity as a Construct

National identity has been studied and analyzed over time by various researchers. Conover and Feldman [12] defined national identity as an emotional link between members of a society who share something in common [3,13,14]. Similarly, Miller [15] described national identity as an essential component of personal identity. Moreover, Huddy and Khatib [16] assigned to national identity the connotation of belonging to a nation not represented by an ideological form of national attachment [17].
Jaspal et al. [18] argued that national identity could be complicated, taking the British as an example, and that it cannot be based on any simple geographic territory, ethnicity, or religion. In this context, in recent UK politics, the institution intends to impose a Britishness sense several times, especially as a result of significant events, such as the July 7 attacks in London in 2005 [19].
One of the central issues of national identity theories is the ethnic and civic dichotomy [18]. Researchers associate ethnic orientation as the harmful national identity version, which is the source of unjust and illiberal actions. On the other hand, civic orientation is compatible with liberal values [3,4,5,6,20]. Ethnic orientation is used to distinguish inner and outer nations. On the other hand, civic orientation is associated with social capital and cultural diversity. Nevertheless, national identity has an emotional component that is mutable in the short term. Citizens usually see national identity as a factor that provides structure and political stability in a nation [3,21,22].
Kohn [23] was one of the first scholars who mentioned the following two national identity dimensions: ethnic and civic. The author linked the civic dimension to compliance with the laws and institutions in Western countries. The indicators included in each dimension have been controversial because the dimensions are not easily identified. For example, Kymlicka [24] affirmed that perceptions of a nation are often modeled around broader cultural symbols such as shared norms, values, and customs rather than a common origin that is considered essential to people. Larsen [9] also argued that the conceptual difference is ambiguous because some current methods of interpreting data are inappropriate, and new approaches are needed to revive a bidirectional national identity.
In addition to the strength of personal identity and its importance in daily life, the content of national identity makes it possible to distinguish between sub-concepts such as ethnic or civic national identity [4,25,26,27]. However, as the meaning and understanding of these terms vary widely in different contexts [11,28], the personal concept of becoming an actual member of one’s country has emerged. For this reason, analyses of ethnic identity between countries and cultures were conducted [3,4,11,29,30,31]; this topic cannot be underestimated [32].
Recent studies underline a particular ethnic/civic dichotomy, as some definitions of national identity do not belong to either category. For example, Pehrson et al. [33] argued that popular notions of national identity were more confusing than the theory suggested. Analyzing data from the International Social Survey Program (ISSP) modules on national identity conducted in 1995, 2003, and 2013, Pehrson et al. [33] pointed out that citizens can accept various criteria, such as respecting country’s institutions and laws and the ability to speak the official language. Thus, the two attributes have a positive correlation, as those who support the first tend to support the second. Analyzing the differences in responses between countries, the authors also found that, contrary to the theoretical practice of attributing national identity as civic or ethnic, citizens tended to define it as a combination of both. This observation will be relevant in the study of the category of pure credentialists.
The current literature has neglected, in part, other variants of national identity that could broaden the existing national identity duality between ethnic and civic orientations. Thus, according to [10], the extension of this analysis would allow better highlighting of the complex interaction between the representations of the elites and the prevalent attitudes of the national identity, each noting the impact on political institutions and public policies in various fields, as well as on immigration and integration. In this context, Medrano [10] escaped from the classic ethnic/civic dichotomy of national identity and proposed an alternative nuance for citizens who consider both criteria as necessary, the credentialists, and those who do not consider any criteria as central, the post nationalists.

3. Data

The International Social Survey Program (ISSP) dataset is used with two different waves, 2003 and 2013, and the following ten countries: Denmark, France, Germany, Ireland, Norway, Portugal, Russia, Spain, Great Britain, and the United States. We have chosen eight indicators for the national identity module. These are the following: (1) born in (country); (2) have the citizenship (of the country); (3) have lived in (country) for most of their life; (4) speak the (country) language; (5) to be (religion); (6) respect political institutions and laws (of the country); (7) feel (nationality of the country); (8) have (nationality of the country) ancestors. The terms “country” and “religion” indicate the respective country and religion of the majority of the interviewers.
The sample is made up of 27,873 respondents, divided as follows: Denmark in 2003: 1322; Denmark in 2013: 1325; France in 2003: 1669; France in 2013: 2017; Germany in 2003: 1287; Germany in 2013: 1717; Ireland in 2003: 1065; Ireland in 2013: 1215; Norway in 2003: 1469; Norway: 2013: 1585; Portugal in 2003: 1600; Portugal in 2013: 1001; Russia, 2003: 2383; Russia in 2013: 1514; Spain, 2003: 1212; Spain, 2013: 1225; Great Britain, 2003: 873; 2013 Great Britain: 904; United States, 2003: 1216; United States in 2013: 1274. Our primary intention was to include more countries in the study, but the inclusion of some countries was not possible as the measurement of national identity varied between countries. This is an important issue when researchers apply MGCFA, because the equivalent measurements become more difficult to achieve when the number of countries and waves increases.
Table 1 shows that the sample is well balanced between the two consecutive waves, with about 50% of respondents in each wave. The data shows that most respondents are women, about 55%, compared to men, about 45%. The citizens identify more with a moderate political orientation, as the most represented categories are, respectively, Right (20.98%), Left-Center (20.63%), and Center-Liberal (15.92%). Interestingly, the far-left respondents’ group is more representative than the far-right group. Most of the interviewees are over 45 years old (65.41%), while citizens under 25 represent the least represented category, with just over 4%. Regarding religion, catholic (35%) and protestant (27%) are the most representative religions for the sample. The sample is mainly made up of educated individuals because over 63% of people have a higher than or equal to upper secondary education.

4. Ethnic/Civic Dichotomy

4.1. Exploratory Factor Analysis

Similarly to [8], the dimensionality of the eight ISSP indicators of the national identity module was studied. First, an Exploratory Factor Analysis (EFA) (rotational Promax) was performed to evaluate the factorial structure between countries. EFA provides the number and content of factors in each group. So, with EFA, the initial structure was obtained with the following two factors: (a) the ethnic dimension; (b) the civic dimension.
Table 2 shows the results, and it can be seen that the ethnic dimension contains the following indicators: (1) being born in (country), (2) having citizenship in (country), (3) having lived in (country) for most of their lives, (5) being of (religion), and (8) having (nationality of the country) ancestors. On the other hand, the civic dimension includes the following: (4) speaking the language (of the country), (6) respect for the institutions and political laws (of the country), and (7) Feeling (nationality of the country). Measurement of the internal consistency of the dimensions is carried out with Cronbach’s alpha, and in both cases, the ethnic and civic dimensions, the results are greater than 0.6 (0.80 and 0.60, respectively). Therefore, the EFA results for both the ethnic and civic factors can be considered acceptable [34].

4.2. Multigroup Confirmatory Factor Analysis

The MGCFA is used to test for measurement equivalence between groups. Based on the literature on the topic and considering the results of EFA, the MGCFA model is used to verify various measurement equivalences, such as pool, multi-group, metric, and scalar, for the following two different models: (1) a model with only one latent variable that represents the national identity; (2) a model with three latent variables that adds the expected structure obtained by EFA with two latent variables representing the ethnic and civic dimensions and a second-order latent variable named as the national identity that depends on the two mentioned latent variables.
Although there is no absolute rule [35,36] to compare the fit index (CFI) and the Tucker-Lewis index (TLI), these should be greater than 0.95. The standardized mean square root (SRMR) and mean square error (RMSEA) must be less than 0.05, although some scholars believe that values between 0.05 and 0.08 are acceptable [37].
These indicators analyze whether a model fits well with the data. However, they have less information about the changes between the two stages of the equivalence measurement test. In this sense, the fit index tests [38,39] show that small changes (between steps) in CFI and RMSEA reliably indicate that the additional step has achieved equivalence in the analysis. Thus, according to [38], when there is a decrease of 0.010 or less in the CFI and an increase of 0.015 or less in RMSEA, a stricter equivalent level is reached [40].
We test configural pools, configural groups, metric, and scalar equivalence in different factor structures through confirmatory factor analysis. We compare a first model with a latent construct to test the equivalent configural (pool), configural (group), metric, and scalar models. The second model includes three latent constructs that represent ethnic and civic dimensions and national identity (Table 3). The structure of the model uses the national identity module from 2003 and 2013 [4]. Results show that the model with single-factor solutions does not fit well with the data. When we include the second structure, the chi-square model is reduced, so it seems that a second order with a two-factor model is more suitable due to this statistically significant reduction. Furthermore, RMSEA and SRMR seem to confirm that the two-factor model is more suitable for the data, as they turn out to be lower for the unidimensional model.
Different measurement equivalences were obtained using the second model, which concurs with the results obtained in [4,9,10,11]. Thus, results showed that the items or attributes to be included in the ethnic dimension are the following: have ancestry; to be (religion), to be born (in the country), to have citizenship (of the country); having lived in the country. Meanwhile, the civic national identity dimension is based on the following: respect for laws and institutions (of the country); feeling (of the country); speaking the language of the country.

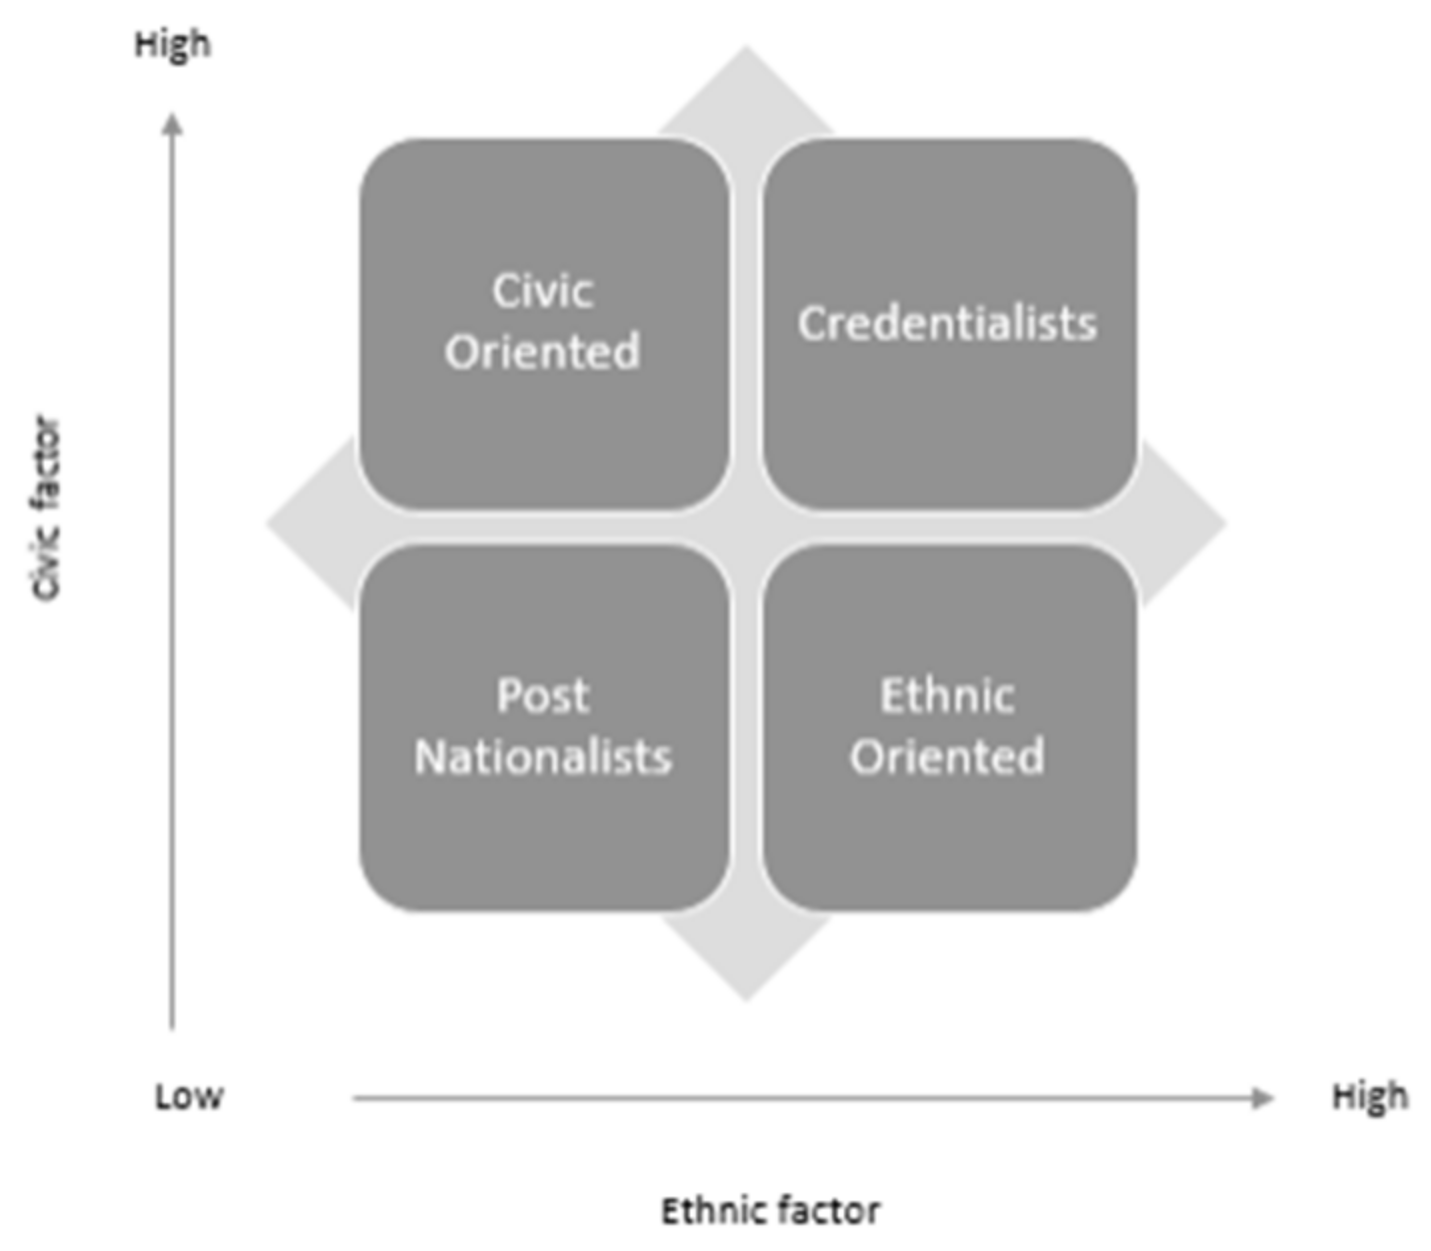
5. The Extended Eco-Apostle Model Applied to National Identity

5.1. Fuzzy TOPSIS and Fuzzy Clustering

The problem of expressing some form of vagueness arose in various disciplines in the mid-1900s, such as logic, linguistics, physics, and mathematics. Importantly, for the subsequent development of fuzzy set theory, the first attempts to propose logic with three truth values (rather than the classic true/false dichotomy) were made in the 1930s [41]. The study of fuzzy sets obtained an excellent impetus for the mathematical development of the so-called multi-value logic. Similarly, multi-value logic does not only consider true or false as truth values but introduces others. From the simplest case, the “I don’t know” is added up to infinite values between 0 and 1 [41].
Fuzzy set theory (FST) has been successfully applied to various analyses and disciplines, such as education [42], supplier selection [43], or green energy [44]. The essence of the application of FST in multi-criterion decision-making techniques (MCDM) provides a non-unique multivariate perspective for measuring common hidden concepts in the social sciences [45].
The study uses FST to adequately handle the vagueness of the information provided by the ISSP national identity module. First, we convert semantic ordinal scales to triangular fuzzy numbers (TFNs). The transformation of the semantic ordinal scales provided by the interviewees, from 1 to 4, into TFN is characterized by the interval [0, 100] without loss of generalization. It can be summarized as follows: (1) not at all important (0,0,50); (2) not very important (30,50,70); (3) quite important (50,70,90); (4) very important (70,100,100). Given the vagueness of the information, we represent the semantic scale with 3-tuples ( a 1 , a 2 , a 3 ) , for which the intersection of all the consecutive ordinal semantic points is an interval.
The fuzzy hybrid analysis (FHA) is an extension of TOPSIS that can process information at an individual level using the fundaments of FST. The first step is to calculate the ideal solution. For that, the positive and negative ideal solutions are obtained as follows:
A + = max V i j j J , min V i j j J , i = 1 , 2 , , m ,
A = min V i j j J , max V i j j J , i = 1 , 2 , , m ,
where V i j stands for the crisp information matrix given by ( a 1 + 2 a 2 + a 3 ) / 4 , where i = 1 to 27,873 (total sample of respondents) and j stands for the items included in each of the national identity dimensions (5 and 3 for ethnic and civic national identity, respectively). J′ is an empty set as all the items included in the national identity module can be considered as a benefit [46].
The positive ideal solution is represented by the largest number observed in the data set, and the opposite logic prevails for the negative ideal solution [46]. Afterwards, each individual observation can be compared with these ideal solutions by using the Euclidean distance and comparing the relative distances between them as follows [47]:
D i + = d i s t ( V i , A + ) = j = 1 n V i j A . j + 2 i = 1 , 2 , , m D i = d i s t ( V i , A + ) = j = 1 n V i j A . j 2 i = 1 , 2 , , m
Therefore, the TOPSIS indicator is calculated as follows:
T O P S I S i = D i D i + + D i i = 1 , 2 , , m ,
The analysis of the national identity at the individual level will be based on fuzzy clustering [47]. Thus, the membership function can determine the degree of similarity that each citizen has for a representative group [48]. The fuzzy cluster analysis segmentation extends the bagged cluster algorithm introduced by [49]. Hence, the C-means fuzzy algorithm for fuzzy data can be expressed as follows:
min : i = 1 n c = 1 C u i c m d F 2 ( x ˜ i , p ˜ c ) = i = 1 n c = 1 C u i c m [ w 2 2 a 2 i p 2 c 2 + + w 1 2 ( a 1 i p 1 c 2 + a 3 i p 3 c 2 ) ] s . t . m > 1 , u i c 0 , c = 1 C u i c = 1 , w 1 w 2 0 , w 1 + w 2 = 1 ,
where d F 2 ( x ˜ i , p ˜ c ) is the squared fuzzy distance between the ith citizen and the profile of a set of representative citizens x ˜ i ( a 1 i k a 2 i k a 3 i k ) : k = 1 K where the vector represents the TFN assigned to the information provided by the ith citizen [45]. p ˜ c p ˜ c k = ( p 1 c k , p 2 c k , p 3 c k ) : k = 1 K represents the TFN provided by the representative citizen of the cth cluster, while the expression a 2 i p 2 c 2 is the squared Euclidian distances between the centers of the TFN vectors of the ith citizen and the representative citizen of the cth cluster. The squared Euclidian distances between the left and right extreme components of the TFN vectors of the ith citizen and the representative citizen of the cth cluster are represented by a 1 i p 1 c 2 and a 3 i p 3 c 2 . In addition, w 1 w 2 ≥ 0 are suitable weights, respectively, for the center and extreme components of the fuzzy distance considered, and the weighted exponent that controls the fuzziness of the obtained partition m is larger than one. Thus, the membership degree of the ith resident in the cth cluster is given by u i c and it is obtained by the Lagrangian minimization problem. For more information on cluster validation and cluster profiles, consult [50,51,52].

5.2. Fuzzy-Cluster Profiles

Table 4 shows the profiles of the 3-solution cluster according to selecting the most exigent citizen, the least exigent citizen, and the intermediate citizen regarding the TOPSIS index obtained in Equation (4) for both national identity dimensions [48]. The three cluster solutions for each dimension are obtained to adequately characterize each citizen regarding the exigency in both dimensions. The prototype names reflect the degree of stiffness concerning each indicator as follows: (1) most, (2) least, and (3) intermediate.
Following the ethnic and civic dichotomy [4,9,11], Figure 1 shows the ternary diagram of the ethnic (a) and civic (b) dimensions and represents the distribution of the citizens graphically according to the weights that represent their membership function. The analysis of the ethnic dimension graph shows a considerable majority of respondents who are close to the pure intermediate profile. 47.5 percent are similar to intermediate ethnic nationalists, 36.8 percent are similar to pure ethnic nationalists, and 15.8 percent are similar to non-ethnic nationalists. The graph representing the civic dimension appears less dispersed than for the ethnic dimension, and this is partly explained because the number of items included in the dimension is only 3 in comparison with the 5 items included in the ethnic dimension. The average aggregated membership function shows that pure civic nationalists account for 60.2%, while non-civic and intermediates account for only 6.3% and 33.5%, respectively. Thus, it is evident that there is more consensus between citizens for the civic dimension than for the ethnic dimension. Additionally, citizens define respect for the national laws and the country’s institutions as the most important criteria of national identity, the right chart shows that results are not uniform [11].

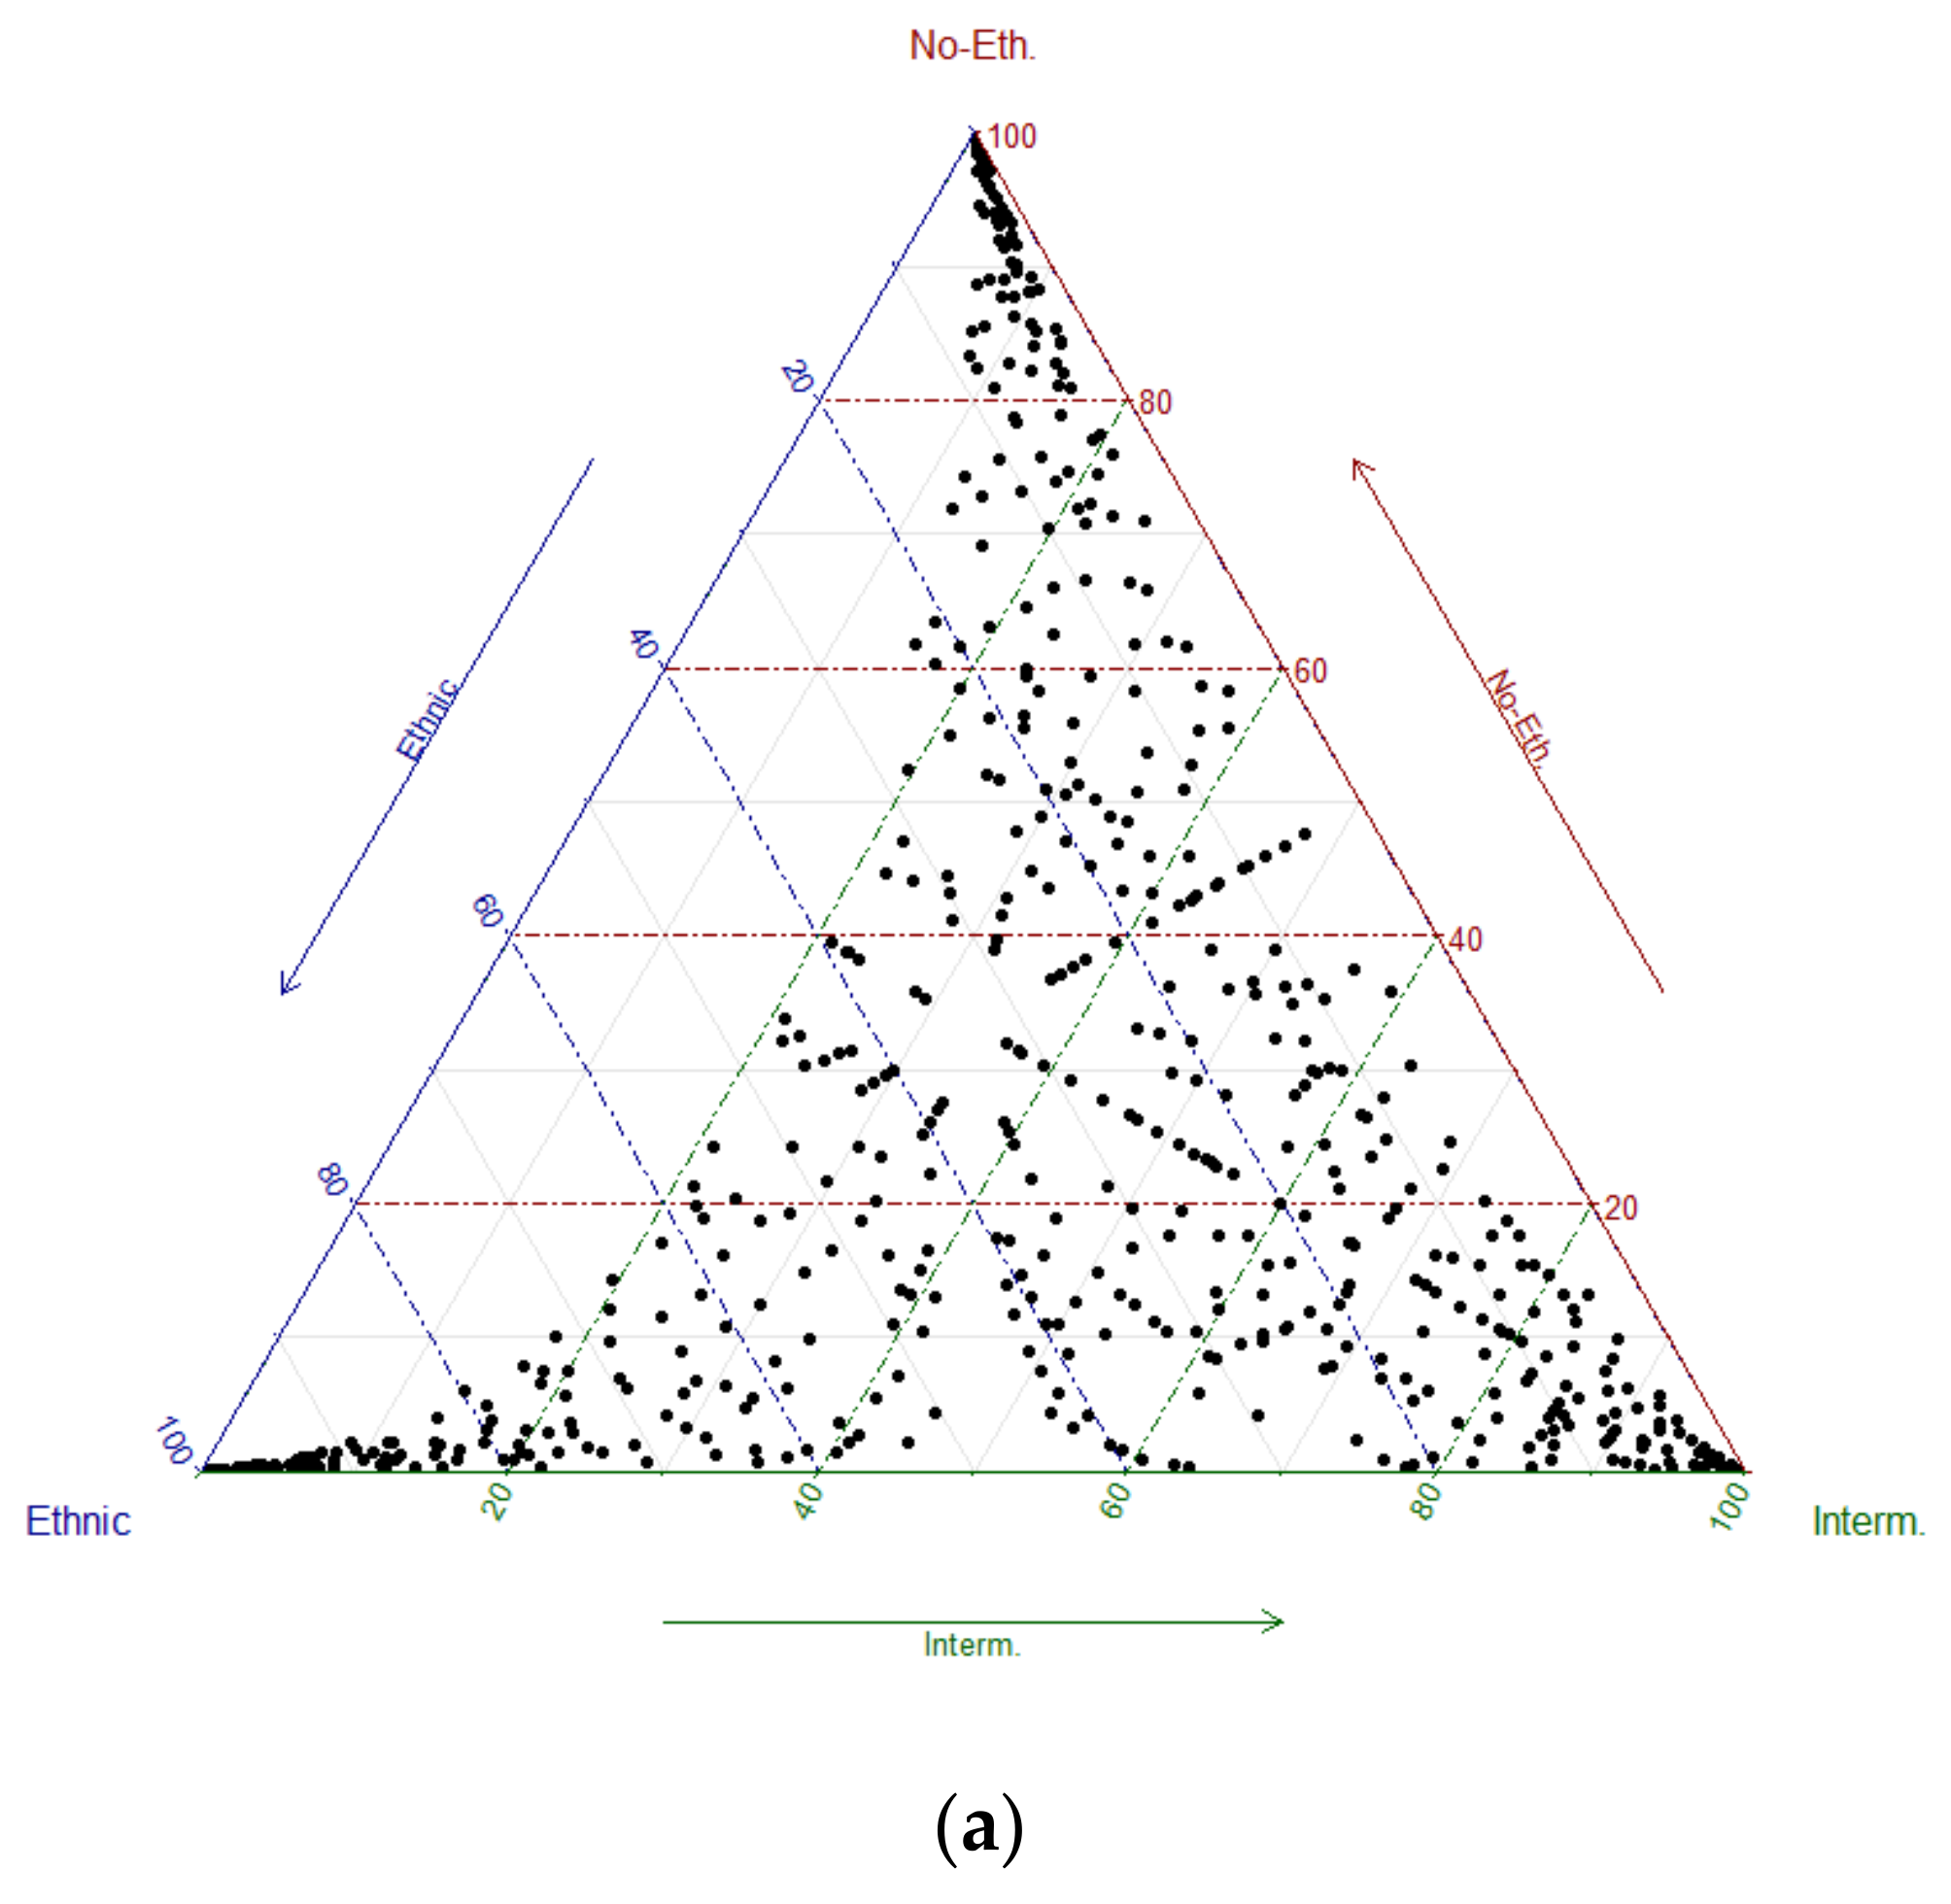
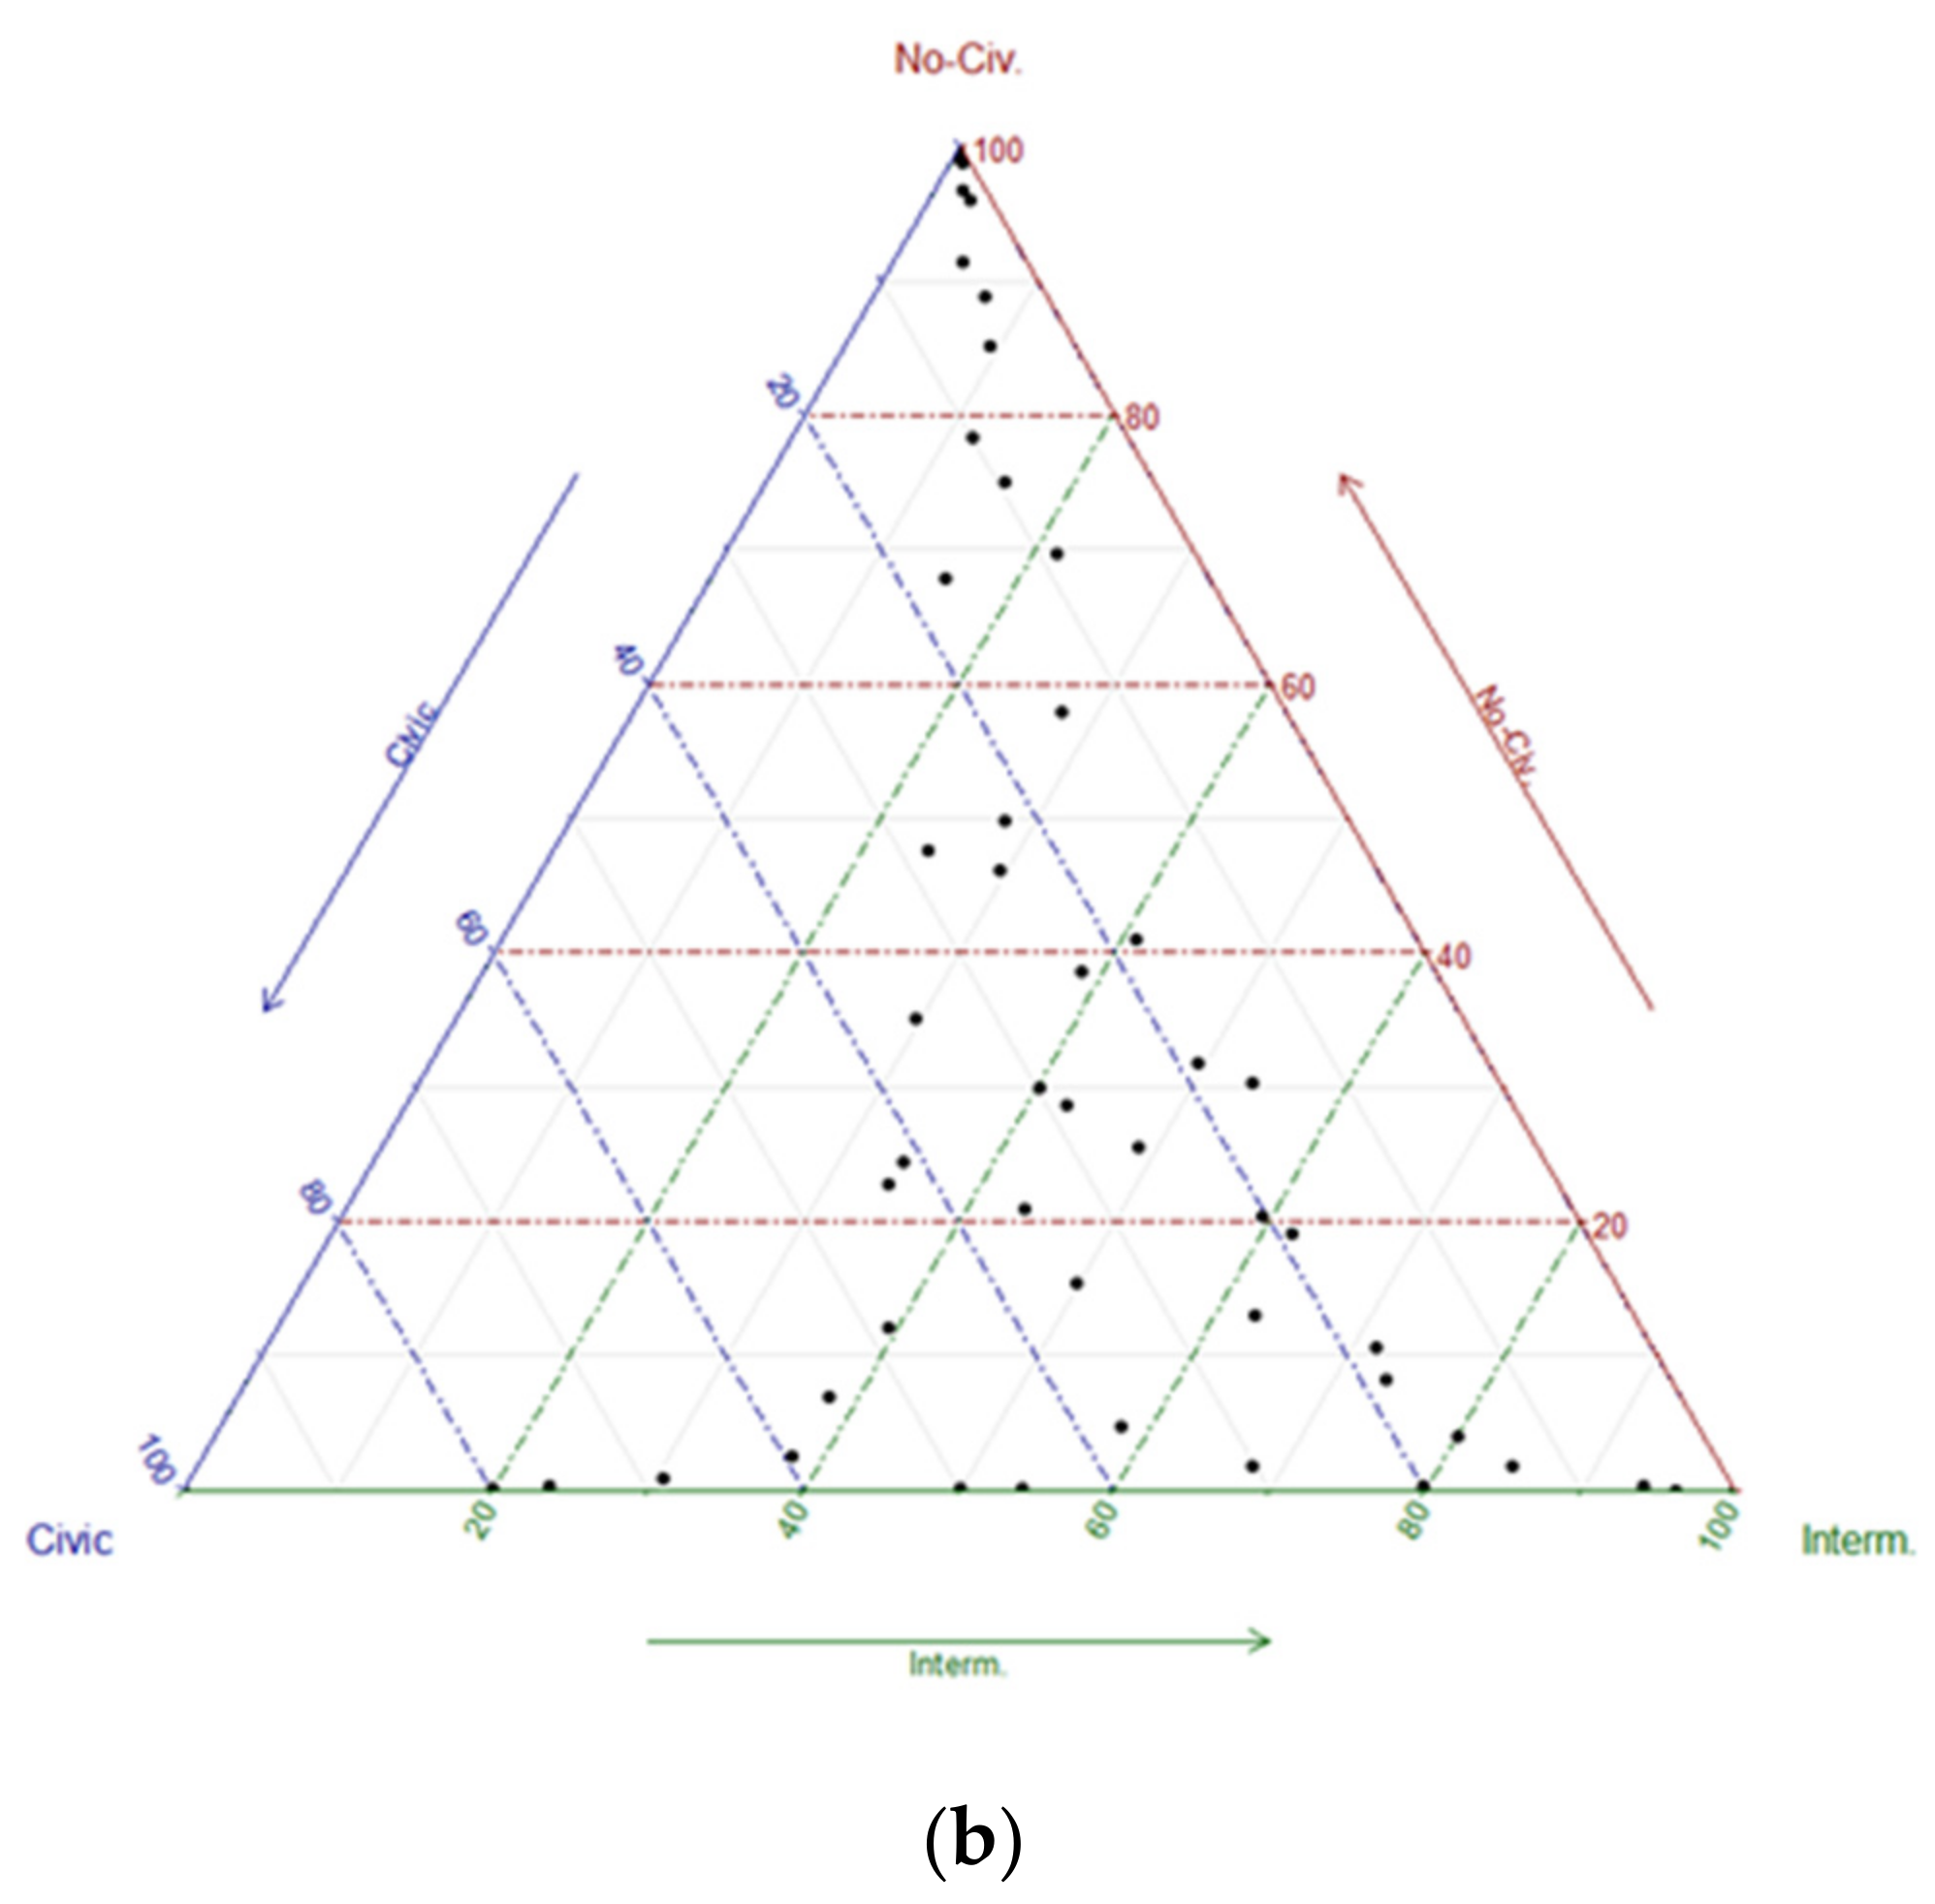
5.3. Beyond the Classical Duality

The “apostle model” is a widely used approach to understanding invasive species’ ecology [53]. This approach was developed in the mid-1990s by Harvard Business School as a tool for achieving the best product performance for customers [54]. This approach was born to understand ecology [53], but it also compares customer loyalty with customer satisfaction. In this regard, Schaefer [53] extended the “apostles” to very satisfied and loyal customers who would also have convinced more customers of the product to a natural ecosystem. On the contrary, the “deserters” are not very satisfied and not very loyal, so they switch to other products. “Hostages” are customers with no alternatives, while “mercenaries” choose the product based on the price [54].
Similar to the Schaefer study [53], apostles, hostages, mercenaries, and deserters in the apostle model can be associated with national ethnic-civic identity. So, we proxy [53] satisfaction-fidelity axes with axes based on ethnic and civic national identity. Thus, the model can distinguish between credentialists and post-nationalists as in [10]. Thus, the parallel model determines that the apostles are credentialists, the deserters or defectors are post-nationalists, the hostages are civic-oriented, and the mercenaries are ethnic-oriented.
Through the TOPSIS indicator at an individual level, the four quadrants presented in Figure 2 can be obtained. Thus, credentialists are those citizens who base their national identity on giving the highest importance to all the items. On the contrary, post nationalists are the citizens who do not give any importance to any attribute, and they are those who are more similar to both the non-ethnic and non-civic profiles in Figure 1. The classical apostle model finds that ethnic and civic-oriented citizens are 20.3 and 16.2 percent, respectively. Meanwhile, credentialists are 33.4% and post nationalists are 30%.
A limitation of this method is that the attributed citizens’ taxonomy for those near the average values of the TOPSIS indicators for both dimensions is unclear. For example, a citizen in the lower left of the credentialist quadrant should have different characteristics than those in the upper right of the credentialist quadrant. Hence, the pure apostle model is blurred in the area mentioned, and for that, a new proposal based on the ternary graphs is developed and named the extended alpha 0.5 national identity extended eco-apostle model. The model reduces the potential blurred area when researchers determine credentialists, post-nationalists, and civic- and ethnic-oriented citizens.
The extended model moves from four categories to a model that defines sixteen different classes. Among these, it is worth mentioning the 4 pure categories as pure credentialists, citizens in the upper right quadrant of the credentialist quadrant, and pure post nationalists, citizens whose location is located in the lower left quadrant of the post-nationalist quadrant. Similarly, the pure ethnic and civic-oriented citizens’ quadrants can be obtained.
Let us assume that e = e 1 , e 2 , e 3 and c = c 1 , c 2 , c 3 are 2 vectors that contain the membership functions for the national ethnic and civic identity obtained with the fuzzy clustering method explained in the previous section. We define the following function for each vector e:
f ( e ) = 1 i f e 2 > 0.5 3 i f e 3 > 0.5 4 i f e 1 > 0.5 2 o t h e r w i s e ,
Without loss of generality, the same function can be applied to any vector c. Thus, the classical apostle model is extended to a model with 16 different classes in which the pure post nationalists are now characterized because the pair f* = (f(e), f(v)) is equal to (1,1). Similarly, pure credentialists are those citizens for whom f* is equal to (4,4), f* is equal to (4,1) for pure ethnic-oriented citizens, and f* is equal to (1,4) for pure civic-oriented citizens. The extended apostle model finds that the pure post-nationalist group is represented by only 1.7% of the sample. Most of the citizens, almost 76%, are classified as credentialists, although pure credentialists account for only for 23.6%. It is also worth remarking that pure civic- and ethnic-oriented citizens are represented by 3.7% and 0.3%, respectively. In a nutshell, the results conclude that only the pure credentialist group is significant and that the pure ethnic-oriented citizens are a minority.

6. Two Approaches to Analyze the Effects of Country, Age, and Political Orientation on Citizens’ National Identity

6.1. Contingency Tables

This section presents the contingency table method used to understand whether the citizens’ national identity is affected by country, age, or political orientation. In this context, contingency tables are used to determine whether the national identity categories are independent of the covariates determined by country, age, and political orientation. The analysis was carried out for each analyzed wave, 2003 and 2013.
Pearson [55] was the first author to formulate contingency tables. He stated that a contingency table is a matrix format table that displays the (multivariate) frequency distribution of variables. They are widely used in survey research, business intelligence, engineering, and scientific research [56]. It is a method that provides a primary picture of the interrelationship between two variables, and with its help, researchers can analyze the interactions between variables. Thus, the study analyzes the degree of independence between the national identity type and the following three mentioned covariates: country-year, age-year, and political orientation-year. For ease of exposition, the analysis is mainly focused on the four pure categories, so a fifth category, named “hybrid”, was obtained for all the citizens who do not belong to one of the pure categories.
The chi-square independence test is used to analyze the contingency table of two categorical variables. The chi-squared test evaluates whether there is a significant association between the categories of the two variables. To determine which cells contribute most to the total Chi-squared score, we compute the Chi-squared statistic for each cell, as shown in Figure 3. Positive residuals are in blue. The cells’ positive values specify an attraction (positive association) between the corresponding row and column variables. The negative residuals are in red, implying a repulsion (negative association) between the corresponding row and column variables.
Figure 3a shows that Ireland and Spain, in both waves but especially in 2013, were the two countries most positively associated with post nationalists. Germany also presented a similar trend. On the other hand, Central and Northern European countries, such as Denmark, France, and Norway, presented a negative association with post-nationalism. Regarding credentialism, it can be concluded that most of the countries for both waves are negatively associated, with the exception of Denmark and Portugal in 2003, and Russia and the US for both waves. It is particularly interesting to remark that the observed results for these two latter countries presented the highest positive relationship with being credentialist. The analysis for pure ethnic- and civic-oriented categories showed that Ireland and Russia were positively associated with ethnic and negatively associated with civic. The opposite trend is observed for Denmark, Germany, and Norway.
Figure 3b shows the relationship between national identity categories and political orientation-year. It was seen that for post-nationalism, there was a positive and negative association with far-left citizens and right conservative, respectively, for both waves of 2003 and 2013. Regarding credentialism, it was seen that leftist political orientation is negatively associated, and rightist political orientation is positively associated in contrast. The civic- and ethnic-oriented national identity did not show a clear relationship pattern for the political orientation. There were only the following two issues to highlight: (1) the positive association of center-left with the pure civic-oriented category in the wave 2013; (2) the positive association of far-right voters with the pure ethnic-oriented category in the wave 2003.
The section ends with an analysis of the contingency table between the national identity and the age-year categories (Figure 3c). It can be seen that the older generations tend to be positively associated with credentialism and negatively associated with post nationalists and civic-oriented nationalists. On the other hand, the younger generations were negatively associated with credentialism and positively associated with post-nationalism and civic-oriented nationalism.

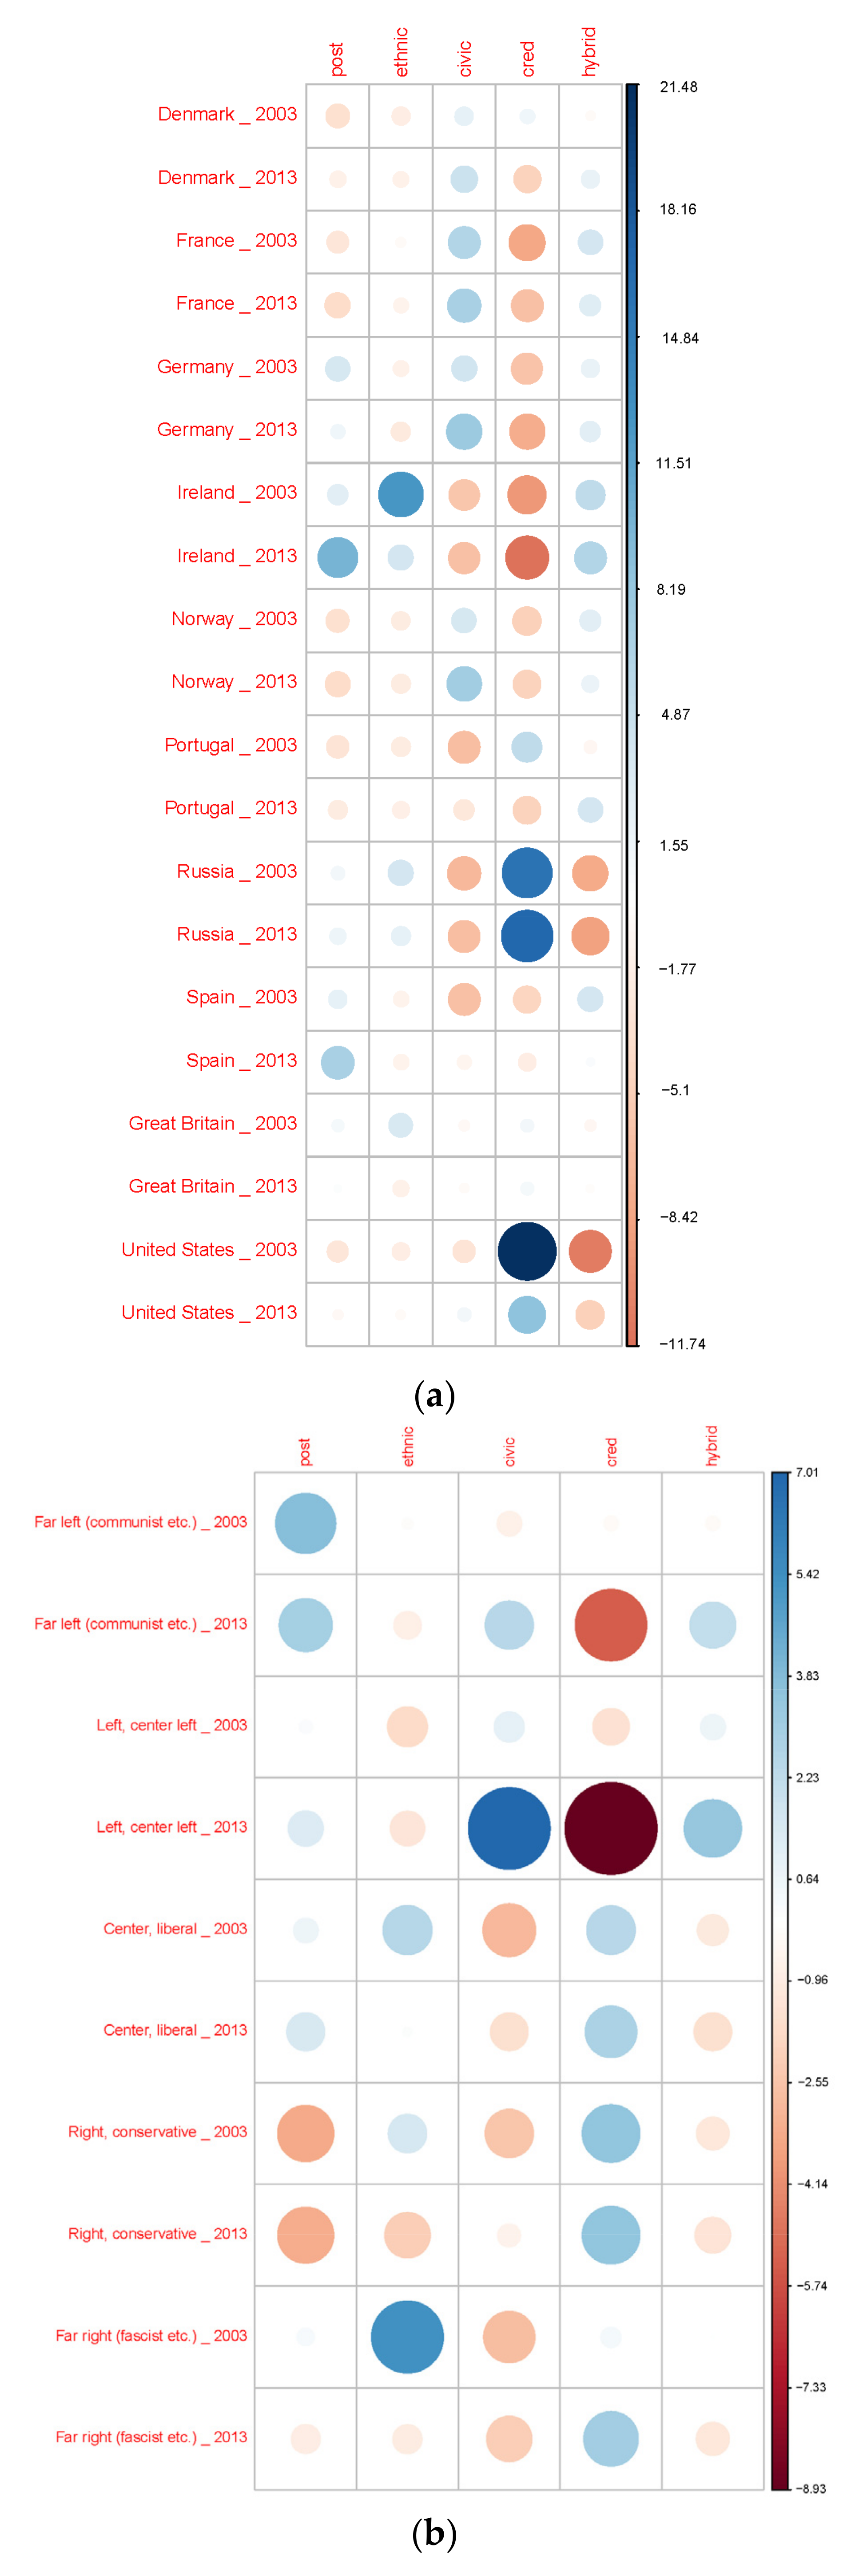
6.2. Conditional Probability Ratios

The section presents a second approach that analyzes the relationship between the national identity categories and the following three covariates of interest: country-year, political orientation-year, and age-year. The second approach is based on whether two events are independent, that is, whether being a pure credentialist is independent of being a respondent for a country j in the wave of 2003 or 2013.
Theoretically, it is known that two events A and B are independent if and only if the following:
P ( A B ) = P A P B P A / B = P ( A ) P B / A = P ( B )
Thus, the conditional probability ratios can be calculated for each of the four pure categories of the national identity, namely, credentialists, post nationalists, pure civic-oriented nationalists, and pure ethnic-oriented nationalists, for each of the categories for the three covariates mentioned above. If these ratios are significantly greater than one, it can be concluded that A and B are positively associated, and they are not independent. Similarly, A and B are negatively associated when the ratios are lower than one.
Thus, the method is based on the calculus of the following ratios:
R A B = P ( A B ) P ( A ) P ( B ) ,
That will be used to analyze the relationship between the national identity categories and other sociodemographic categories of citizens.
The ratios in Equation (8) are obtained for 1000 bootstrap subsamples obtained with replacement. Bootstrap is a well-known tool in statistics that is used for statistical inference. The idea behind the method is that if a sample approximates the population that generated it, then we can sample the sample to calculate a statistic of interest and measure its accuracy [57]. Bootstrapping is useful when there is doubt that the usual distributive assumptions and asymptotic results are valid and accurate. Bootstrap is a non-parametric method that calculates estimated standard errors, confidence intervals, and hypothesis tests [58].
Table 5 shows the ratios for each type of national identity interacting with each country-year, political orientation-year, and age-year. We find that the results are robust and that the same conclusions can be obtained with both methods. One notable result to remark is that there were only nine AB observations for which the ratios were zero, and interestingly, eight out of nine were referred to as the pure ethnic-oriented nationalists at country level, as follows: Denmark and the US in 2003, Germany and Great Britain in 2013, and Norway and Portugal for both waves. These observations correspond to those with the most existing negative associations. On the other hand, at the country level, results showed that the most positive associations existed for the following observations: (1) post nationalism (Ireland and Spain in 2013); (2) ethnic-oriented (Ireland and Russia in both waves and Great Britain in 2003); (3) civic oriented (Germany and Norway in 2013); (4) credentialists (the US in 2003).
At the political orientation level, the most positive associations were found in the following: (1) post nationalism (Far-leftist in both waves); (2) ethnic-oriented (Centrist, rightist, and far-rightist in 2003); (3) civic-oriented (leftist in both waves and far-leftist in 2013); (4) credentialists (Rightist and far-rightist in 2013). Meanwhile, the most negative associations were found in the following: (1) post nationalism (rightist for both waves and far-rightist in 2013); (2) ethnic-oriented (leftist in both waves, and far-leftist and far-rightist in 2013); (3) civic-oriented (far-rightist in both waves); (4) credentialists (far-leftist in 2013).
Finally, at age level, results showed that the most positive associations were found in the following: (1) post nationalism (youngest generation −24 years or under in 2003 and 35–44 years old group in 2013); (2) ethnic-oriented (youngest generation, 25–34, 45–54, and eldest generation, 75 years or older in 2003); (3) civic-oriented (youngest generation in 2013); (4) credentialists (eldest generation in both waves). In the meantime, the most negative associations were found in the following: (1) post nationalism (eldest generation in both waves and 65–74 years old group in 2013); (2) ethnic-oriented (25–44 years old in 2013); (3) civic oriented (youngest generation and 65–74 age group in 2003 and eldest generation in both waves); (4) credentialists (35–44 age group).

7. Discussion

7.1. National Identity Apostle Model

The study presents an alternative method to that used by the literature to analyze whether different types of national identity are affected by country, political orientation, and age using two waves of the ISSP national identity module. Indeed, many researchers have found various dimensions that structure individuals’ national identities. The ethnic and civic dimensions were obtained following [4,9,10] using EFA and MGCFA to identify the dimensions of national identity. The EFA and MGCFA identified which items needed to be included in each dimension.
Ethno-national identity is based on ethnic heritage, such as being born in the country, having national ancestors, professing the country’s predominant religion, having lived most of the time in the country, and possessing the country’s citizenship. This type of nationalism has been much claimed in history and the present day. It is typical to resort to national identity based on ethnic criteria when people go through moments of both economic and social crisis [59]. Clear examples are the exploits of Fascism and Nazism during the post-World War I crisis. Hitler and Mussolini took advantage of the moment of identity crisis and the consequences of the Great War to emphasize the importance of fighting the enemy who undermined national integrity [2]. We can also see these attitudes from European extremists, such as Marine Le Pen, Matteo Salvini, Santiago Abascal, and Viktor Orban in France, Italy, Spain, and Hungary. Now, the national enemy is the immigrant, as he is “the different” who threatens the identity and economic stability of the country [1].
Civic national identity is represented by liberal principles, independent of wealth, race, ethnicity (language and culture), gender, religion, or place of birth. The civic dimension of nationalism is based on the following three things: speaking the country’s language, being a citizen of the country, and, above all, respecting the laws and institutions of the country. Civic national identity is typical in those multicultural societies, such as the United States and the countries of Northern Europe [60,61].
The civic and ethnic national identity are studied at the individual level through the fuzzy hybrid approach and fuzzy clustering. The ethnic dimension analysis showed that a large majority (84.2%) is between giving a lot or intermediate importance to the five items included in the factor. There were only 15.8% of citizens who could be considered non-ethnic nationals. Therefore, for over a third of the sample citizens, national identity coincides with the speeches of European leaders such as Marine Le Pen, Matteo Salvini, Santiago Abascal, and Viktor Orban [9]. In addition, less than a fifth [1] of citizens do not share these extreme or intermediate ethnic opinions and can be associated with other leftist positions, such as the sympathizers of Podemos in Spain [7]. On the other hand, citizens that support civic criteria give more importance to items, such as speaking the language, respect for laws and institutions, and feel (nationality), are the vast majority, over 60%.
Medrano [10] believed that citizens cannot be only divided into two categories supporters of civic dimension and supporters of ethnic dimension and mentioned two additional categories for those citizens who do not give importance to any item (post nationalists) and those who give importance to all the items (credentialists). The four categories can be individually extracted through the apostle model. Other authors have defined credentialists as those who are mobilized for all the items [9]. In this sense, the mentioned authors contended that this national identity category considers that all the ethnic and civic items are important. On the other hand, the post nationalists do consider that all the items, independently of their dimension, are not important. Larsen [9] named this category as the “non-mobilized citizens”.
Finally, through the extension of the apostle model, the number of categories is enlarged to sixteen. The analysis can filter the following four additional important categories: pure post nationalists, pure ethnic-oriented nationalists, pure civic-oriented nationalists, and credentialists. The extended apostle model showed that only a minority of 3.7% and 0.3% can be considered pure civic nationalists and pure ethnic nationalists, respectively. It is worth noting that a large majority of the society (75%) can be considered credentialists and that 23.6% of the society are pure credentialists. The extended apostle model refined to a large extent the total number of post nationalists, and it was seen that only 1.7% of the sample could be considered pure post nationalists. They do not associate national identity with linguistic, cultural, and institutional attributes. Custodi [7] mentioned that it is probably that some citizens could give greater importance to being part of a moral community.

7.2. Effects of Country, Political Orientation, and Age in Both Waves on the National Identity Categories

As stated, we do not detect any significant difference between the results obtained by the analysis carried out by contingency tables or conditional probability ratios. One of the most interesting results was the positive association found for post nationalism in Ireland and Spain in 2013. Nevertheless, both countries showed a very different pattern regarding the ethnic-oriented nationalism, for which Ireland also showed a positive association in comparison with Spain, which showed a negative association. The results can be partly explained by the fact that Spain is constitutionally a multi-national country, with strong independence movements in Catalonia and the Basque Country, so the negative relationship with ethnic nationalism can be explained by the influence of these movements, as there are other ethnic realities in their respective territories [62,63]. On the other hand, the results for Ireland are explained because Irish nationalism was created against British institutions due to historical religious and ethnic differences [64].
The case of Ireland is a paradigmatic example of the following two disjoint types of societies: one a self-governing island fortress of Christian and conservative values in a pagan, radical sea; the other bearing the burdens and sharing the glories of the mighty British empire [64]. The following two national identities are rooted in religion and social class: Protestant and Catholic; conqueror and conquered; master and serf. It can be said that the observed trend is “that religion served as the demarcation line separating those with power from the powerless, those with property from the disposed of” (p. 527). The Protestant community was seen as Unionist with a British cultural identity.
Meanwhile, Kymlicka [24] found that some countries, such as Belgium, Spain, and the United Kingdom, moved toward giving regional autonomy to their national ethnic minorities. In all of these countries, the elimination of minority national identities was abandoned, and policies towards facilitating that minority groups could see themselves as separate and self-governing nations within the larger state. The policy trend is seen as soft or hard federalism that “ensures peace, democracy, freedom, and prosperity for multination states like Spain, Canada, Belgium, Britain and Switzerland” (p. 201).
Central-northern European countries, such as Denmark, France, Germany, and Norway, are among the countries in which there are positive associations for civic-oriented nationalism. The results can be explained because these countries have selectively implemented political multiculturalism, trying to redefine the prevailing conceptions of national identity [65]. The discussion of country effects ends with the interesting result observed for credentialists that are mainly characterized by the positive association found in Russia and the US in both waves. Both countries were the main primary actors in the cold war, so citizens could consider that all the items are important to form a national identity. Nevertheless, an essential difference between the countries existed regarding ethnic-oriented nationalism, which is positively associated with Russia and negatively associated with the US. Ethnic preference in Russia may result from Putin’s ethnic policies, such as the annexation of Crimea, due to his ethnic identity [66].
Credentialism in Russia can be partly explained by the recent occupation of Ukraine that continues the annexation of the Crimean Peninsula that took place in 2014. The justification is based on the vintage Putin rhetoric that declares the Russian people as an ethnic entity, claiming that, after the collapse of the Soviet Union, ‘the Russian people have become one of the largest divided nations in the world [66].
The analysis of the political orientations showed differences regarding the affinity for one type of nationalism. The new waves of migration flows have intensified the resurgence of nationalist movements across Europe. The populist speeches of far-right leaders have awakened the fear that immigrants could undermine the national identity of a country and the economic situation [1]. Indeed, far-rightist citizens appear, from our analyses, to support ethnic-oriented nationalism over civic-oriented nationalism in 2003 and credentialism in 2013. Ding and Hlavac [67] found that voting for right-wing populist parties is more rooted in firm beliefs about national identity preservation and cultural purity than in negative sentiments against political elites and the establishment.
In addition, far-leftist, leftist, and centrist citizens do also have a particular conception of national identity. Custodi [7] contended that leftist citizens preferred to associate a national identity with more moral criteria than ethnic or civic, so it seems reasonable to assume that these citizens are more similar to post nationalists. Liberals and centrist citizens, on the other hand, showed unexpected results as they were positively associated with ethnic-oriented nationalism in the year 2003. It can be concluded that citizens might have different definitions of liberalism for each of the countries analyzed in the study.
Finally, the age results showed an apparent dichotomy between the youngest and eldest generations regarding the national identity formation. The eldest generation tended to be more credentialist, less post-nationalist, and less civic-oriented nationalist than other age groups. On the other hand, the youngest generation tended to be more post-nationalist, ethnic-oriented, and less civic-oriented than other age groups. The distinction can be explained by different political views regarding globalization and climate change [68]. These results were also confirmed by [3], where the authors found that the younger and well-educated American generations showed low levels of nationalism. Meanwhile, a larger group of citizens, characterized by being older and less well educated, embraces every form of nationalist sentiment.

8. Conclusions

The study aimed to analyze the concept of national identity as studied by various scholars [2,3,4,5,6]. The classic distinction between ethnic and civic national identity was further addressed, allowing the possibility of giving more or less importance to each of the considered dimensions, following previous studies [4,9,10]. Thus, it was possible to distinguish between 4 and 16 national identity categories. The pure post nationalists, pure civic-oriented nationalists, pure ethnic-oriented nationalists, and pure credentialists were further studied according to the following three covariates: country, political orientation, and age, in each of the waves.
The study confirms and complements some previous results found in the literature, contributing to innovation by applying a novel approach based on fuzzy set theory. In this sense, the study can identify the different national identity types of an ample sample of citizens at the individual level. Previous published cross-national studies used MGCFA to analyze metric and scalar measurement equivalence through the respective global fit tests, such as CFI differences, RMSEA differences, and SRMR differences, and most of them failed to even find partial scalar equivalence. For this reason, most of the studies frequently reduced the number of countries. Davidov et al. [69] contended that researchers needed to omit 30% of the countries, on average, in order to obtain equivalent scales.
The novel approach presented in the study, based on FST and the extended eco-apostle model, is more flexible than MGCFA and deals adequately with the vague information provided by the Likert scales used by the ISSP national identity module. The novel approach analyzes the national identity at the individual level, and this is also a novel characteristic that produces insightful results. Therefore, we conclude that methods based on FST can also be a suitable tool to analyze social science topics, as in the case of national identity.
The results showed that most citizens are credentialists—neither civic nor ethnic nationalists. Thus, most citizens consider that national identity should be based on both ethnic and civic items, concurring with results obtained by [10]. The existence of these two extreme classes of citizens, post nationalists, and credentialists, was already found by [3]. The intermediate classes resemble the ethnic and civic-oriented national identity types named in their study as ethno-cultural and creedal nationalism.
The results showed that national identity differences were observed at the country, political orientation, and age level. As with any other study, future research is needed to overcome some limitations. First, the analysis could be broadened to other waves beyond 2003 and 2013. It would be interesting to analyze if the citizens’ national identity has changed in the last decade as a consequence of the last refugee crisis and the recent Russian invasion of Ukraine. Second, the four pure categories are based on an alpha coefficient, which is equal to 0.5 in the study, and other alpha parameters can be studied to analyze the robustness of the results. Finally, the study included only three covariates, namely, country, political orientation, and age, to analyze their effects on national identity, and other variables more related to sociological types, such as multiculturalism or traditionalism, could also be objects of interest.

Author Contributions

Conceptualization, J.C.M. and A.I.; methodology, J.C.M.; software, J.C.M. and A.I.; validation, J.C.M. and A.I.; investigation, J.C.M. and A.I.; data curation, J.C.M. and A.I.; writing—original draft preparation, J.C.M. and A.I.; writing—review and editing, J.C.M. and A.I. All authors have read and agreed to the published version of the manuscript.

Funding

This research received no external funding.

Institutional Review Board Statement

Not applicable.

Informed Consent Statement

Informed consent was obtained from all subjects involved in the study.

Data Availability Statement

Data available on http://www.issp.org/data-download/by-topic/ (accessed on 15 June 2021).

Conflicts of Interest

The authors declare no conflict of interest.

References

  1. Yael, T. Why Nationalism; Princeton University Press: Princeton, NJ, USA, 2020. [Google Scholar]
  2. Smith, A.D.; Hutchinson, J.; Smith, A.D. Nationalism; Oxford Readers: Oxford, UK, 1994. [Google Scholar]
  3. Bonikowski, B.; DiMaggio, P. Varieties of American Popular Nationalism. Am. Sociol. Rev. 2016, 81, 949–980. [Google Scholar] [CrossRef] [Green Version]
  4. Kunovich, R.M. The sources and consequences of national identification. Am. Sociol. Rev. 2009, 74, 573–593. [Google Scholar] [CrossRef]
  5. Theiss-Morse, E. Who Counts as an American? The Boundaries of National Identity; Cambridge University Press: Cambridge, UK, 2009. [Google Scholar]
  6. Wright, M.; Citrin, J.; Wand, J. Alternative Measures of American National Identity: Implications for the Civic-Ethnic Distinction. Politi-Psychol. 2012, 33, 469–482. [Google Scholar] [CrossRef]
  7. Custodi, J. Nationalism and populism on the left: The case of Podemos. Nations Natl. 2021, 27, 705–720. [Google Scholar] [CrossRef]
  8. Sarrasin, O.; Green, E.G.T.; Davidov, E. Measurement Equivalence Across Subnational Groups: An Analysis of the Conception of Nationhood in Switzerland. Int. J. Public Opin. Res. 2013, 25, 522–534. [Google Scholar] [CrossRef] [Green Version]
  9. Larsen, C.A. Revitalizing the ‘civic’ and ‘ethnic’ distinction. Perceptions of nationhood across two dimensions, 44 countries and two decades. Nations Natl. 2017, 23, 970–993. [Google Scholar] [CrossRef] [Green Version]
  10. Medrano, J.D. Nation, Citizenship and Immigration in Contemporary Spain. Int. J. Multicult. Soc. 2005, 7, 133–156. [Google Scholar]
  11. Reeskens, T.; Hooghe, M.; Meuleman, B. Beyond the civic-ethnic dichotomy: The nature of citizenship concepts in 24 countries. Nations Natl. 2007, 16, 579–597. [Google Scholar] [CrossRef] [Green Version]
  12. Conover, P.J.; Feldman, S. Memo to NES Board of Overseers Regarding ‘Measuring Patriotism and Nationalism; Interuniversity Consortium for Political and Social Research: Ann Arbor, MI, USA, 1987. [Google Scholar]
  13. Anderson, B. Imagined Communities: Reflections on the Origin and Spread of Nationalism; Verso Books: New York, NY, USA, 2006. [Google Scholar]
  14. Greenfeld, L.; Eastwood, J. National Identity. In The Oxford Handbook of Comparative Politics; Oxford University Press: Oxford, UK, 2007; pp. 256–273. [Google Scholar]
  15. Miller, D. On Nationality; Clarendon Press: Oxford, UK, 1995. [Google Scholar]
  16. Huddy, L.; Khatib, N. Patriotism, National Identity, and Political Involvement. Polit. Sci. 2011, 51, 63–77. [Google Scholar] [CrossRef] [Green Version]
  17. Huddy, L. From social to political identity: A critical examination of social identity theory. Polit. Psychol. 2001, 22, 127–156. [Google Scholar] [CrossRef]
  18. Jaspal, R.; da Silva Lopes, B.C.; Breakwell, G.M. British national identity and life satisfaction in ethnic minorities in the United Kingdom. Natl. Identities 2021, 23, 455–472. [Google Scholar] [CrossRef]
  19. Asari, E.M.; Halikiopoulou, D.; Mock, S. British national identity and the dilemmas of multiculturalism. Natl. Ethn. Polit. 2008, 14, 1–28. [Google Scholar] [CrossRef] [Green Version]
  20. Azada-Palacios, R.A. Hybridity and national identity in post-colonial schools. Educ. Philos. Theory 2021, 1–13. [Google Scholar] [CrossRef]
  21. Wagner, U.; Becker, J.C.; Christ, O.; Pettigrew, T.F.; Schmidt, P. A Longitudinal test of the relation between German nationalism, patriotism, and outgroup derogation. Eur. Sociol. Rev. 2012, 28, 319–332. [Google Scholar] [CrossRef]
  22. Jones, F.L.; Smith, P. Individual and societal bases of national identity: A comparative multi-level analysis. Eur. Sociol. Rev. 2001, 17, 103–118. [Google Scholar] [CrossRef]
  23. Kohn, H. The Idea of Nationalism: A Study in Its Origins and Background; Transaction Publishers: Piscataway, NJ, USA, 1961. [Google Scholar]
  24. Kymlicka, W. Nation-building and minority rights: Comparing west and east. J. Ethn. Migr. Stud. 2000, 26, 183–212. [Google Scholar] [CrossRef]
  25. Schatz, R.T.; Staub, E.; Lavine, H. On the varieties of national attachment: Blind verus constructive patriotism. Polit. Psychol. 1999, 20, 151–174. [Google Scholar] [CrossRef]
  26. Blank, T.; Schmidt, P. National identity in a United Germany: Nationalism or patriotism? An empirical test with representative data. Polit. Psychol. 2003, 24, 289–312. [Google Scholar] [CrossRef]
  27. Davidoff, S.M.; Zaring, D. Regulation by deal: The government’s response to the financial crisis. Admin. Law Rev. 2009, 61, 463. [Google Scholar] [CrossRef] [Green Version]
  28. Latcheva, R. Cognitive interviewing and factor-analytic techniques: A mixed method approach to validity of survey items measuring national identity. Qual. Quant. 2011, 45, 1175–1199. [Google Scholar] [CrossRef]
  29. Brubaker, R. Citizenship and Nationhood in France and Germany; Harvard University Press: Cambridge, MA, USA, 2009. [Google Scholar]
  30. Shulman, S. Challenging the Civic/Ethnic and West/East Dichotomies in the Study of Nationalism. Comp. Political Stud. 2002, 35, 554–585. [Google Scholar] [CrossRef]
  31. Lenard, P.T.; Miller, D.; Uslaner, M. Trust and National Identity. In The Oxford Handbook of Social and Political Trust; Oxford University Press: Oxford, UK, 2018. [Google Scholar]
  32. Helbling, M.; Reeskens, T.; Wright, M. The mobilisation of identities: A study on the relationship between elite rhetoric and public opinion on national identity in developed democracies. Nations Natl. 2016, 22, 744–767. [Google Scholar] [CrossRef]
  33. Pehrson, S.; Brown, R.; Zagefka, H. When does national identification lead to the rejection of immigrants? Cross-sectional and longitudinal evidence for the role of essentialist in-group definitions. Br. J. Soc. Psychol. 2009, 48, 61–76. [Google Scholar] [CrossRef] [PubMed] [Green Version]
  34. Van Griethuijsen, R.A.L.F.; van Eijck, M.W.; Haste, H.; den Brok, P.J.; Skinner, N.C.; Mansour, N.; Gencer, A.S.; BouJaoude, S. Global patterns in students’ views of science and interest in science. Res. Sci. Educ. 2015, 45, 581–603. [Google Scholar] [CrossRef]
  35. Hu, L.T.; Bentler, P.M. Cutoff criteria for fit indexes in covariance structure analysis: Conventional criteria versus new alternatives. Struct. Equ. Model. 1999, 6, 1–55. [Google Scholar] [CrossRef]
  36. Marsh, H.W.; Hau, K.T.; Wen, Z. In search of golden rules: Comment on hypothesis-testing approaches to setting cutoff values for fit indexes and dangers in overgeneralizing Hu and Bentler’s (1999) findings. Struct. Equ. Model. 2004, 11, 320–341. [Google Scholar] [CrossRef]
  37. Schermelleh-Engel, K.; Moosbrugger, H.; Müller, H. Evaluating the fit of structural equation models: Tests of significance and descriptive goodness-of-fit measures. MPR Online 2003, 8, 23–74. [Google Scholar]
  38. Chen, F.F. Sensitivity of goodness of fit indexes to lack of measurement invariance. Struct. Equ. Model. 2007, 14, 464–504. [Google Scholar] [CrossRef]
  39. Cheung, G.W.; Rensvold, R.B. Evaluating Goodness-of-Fit Indexes for Testing Measurement Invariance. Struct. Equ. Model. 2002, 9, 233–255. [Google Scholar] [CrossRef]
  40. Byrne, B.M.; Stewart, S.M. The MACS approach to testing for multigroup invariance of a second-order structure: A walk through the process. Struct. Equ. Model. 2006, 13, 287–321. [Google Scholar] [CrossRef]
  41. Zadeh, L.A. Information and control. Fuzzy Sets 1965, 8, 338–353. [Google Scholar]
  42. Di Nardo, E.; Simone, R. A model-based fuzzy analysis of questionnaires. Stat. Methods Appl. 2019, 28, 187–215. [Google Scholar] [CrossRef] [Green Version]
  43. Rashidi, K.; Cullinane, K. A comparison of fuzzy DEA and fuzzy TOPSIS in sustainable supplier selection: Implications for sourcing strategy. Expert Syst. Appl. 2019, 121, 266–281. [Google Scholar] [CrossRef]
  44. Mohsin, M.; Zhang, J.; Saidur, R.; Sun, H.; Sait, S.M. Economic assessment and ranking of wind power potential using fuzzy-TOPSIS approach. Environ. Sci. Pollut. Res. 2019, 26, 22494–22511. [Google Scholar] [CrossRef] [PubMed]
  45. Martín, J.C.; Moreira, P.; Román, C. A hybrid-fuzzy segmentation analysis of residents ’ perception towards tourism in Gran Canaria. Tour. Econ. 2020, 26, 1282–1304. [Google Scholar] [CrossRef]
  46. Behzadian, M.; Khanmohammadi Otaghsara, S.; Yazdani, M.; Ignatius, J. A state-of the-art survey of TOPSIS applications. Expert Syst. Appl. 2012, 39, 13051–13069. [Google Scholar] [CrossRef]
  47. Cantillo, J.; Martin, J.C.; Román, C. A Hybrid Fuzzy TOPSIS Method to Analyze the Coverage of a Hypothetical EU Ecolabel for Fishery and Aquaculture Products (FAPs). Appl. Sci. 2021, 11, 112. [Google Scholar] [CrossRef]
  48. Kruse, R.; Döring, C.; Lesot, M.J. Fundamentals of Fuzzy Clustering. In Advances in Fuzzy Clustering and Its Applications; John Wiley & Sons: Hoboken, NJ, USA, 2007; pp. 1–30. [Google Scholar] [CrossRef] [Green Version]
  49. Leisch, F. Bagged clustering. Adapt. Inf. Syst. Model. Econ. Manag. Sci. 1999, 51, 11. [Google Scholar]
  50. D’Urso, P.; Disegna, M.; Massari, R.; Prayag, G. Knowledge-Based Systems Bagged fuzzy clustering for fuzzy data: An application to a tourism market. Knowl. Based Syst. 2015, 73, 335–346. [Google Scholar] [CrossRef]
  51. D’Urso, P.D.; Disegna, M.; Massari, R.; Osti, L. Fuzzy segmentation of postmodern tourists. Tour. Manag. 2016, 55, 297–308. [Google Scholar] [CrossRef] [Green Version]
  52. D’Urso, P.; De Giovanni, L.; Disegna, M.; Massari, R. Bagged Clustering and its application to tourism market segmentation. Expert Syst. Appl. 2013, 40, 4944–4956. [Google Scholar] [CrossRef] [Green Version]
  53. Schaefer, V. Nature’s apostles: A model for using ecological restoration to teach ecology. Am. Biol. Teach. 2013, 75, 417–419. [Google Scholar] [CrossRef]
  54. Jones, T.O.; Sasser, W.E. Why Satisfied Customers Defect. Harv. Bus. Rev. 1995, 73, 88–99. [Google Scholar] [CrossRef]
  55. Pearson, K.; Lee, A. On the Laws of Inheritance in Man: I. Inheritance of Physical Characters. Biometrika 1903, 2, 357. [Google Scholar] [CrossRef]
  56. Greenacre, M.J. Clustering the rows and columns of a contingency table. J. Classif. 1988, 5, 39–51. [Google Scholar] [CrossRef]
  57. Efron, B.; Tibshirani, R.J. An Introduction to the Bootstrap; Chapman Hall: London, UK, 1993. [Google Scholar]
  58. Davison, A.C.; Hinkley, D.V. Bootstrap Methods and Their Application. Biometrics 1998, 54, 795. [Google Scholar] [CrossRef] [Green Version]
  59. Wang, Z. From Crisis to Nationalism?: The Conditioned Effects of the COVID-19 Crisis on Neo-nationalism in Europe. Chin. Polit. Sci. Rev. 2021, 6, 20–39. [Google Scholar] [CrossRef]
  60. Xenos, N. Civic Nationalism: Oxymoron? Crit. Rev. 1945, 2, 213–231. [Google Scholar] [CrossRef]
  61. Kaufmann, E. Ethnic or civic nation: Theorizing the American case. Can. Rev. Stud. Natl. 2000, 27, 133–154. [Google Scholar]
  62. Muro, D. Nationalism and nostalgia: The case of radical Basque nationalism. Nations Natl. 2005, 11, 571–589. [Google Scholar] [CrossRef]
  63. Conversi, D.; Jeram, S. Despite the crisis: The resilience of intercultural nationalism in Catalonia. Int. Migr. 2017, 55, 53–67. [Google Scholar] [CrossRef]
  64. Mccaffrey, L.J. American Society of Church History Irish Nationalism and Irish Catholicism: A Study in Cultural Identity. In Church History; Cambridge University Press: Cambridge, UK, 1973; Volume 42, pp. 524–534. [Google Scholar]
  65. Citrin, J.; Levy, M.; Wright, M. Multicultural Policy and Political Support in European Democracies. Comp. Polit. Stud. 2014, 47, 1531–1557. [Google Scholar] [CrossRef] [Green Version]
  66. Kolstø, P.; Blakkisrud, H. The New Russian Nationalism; Edinburgh University Press: Edinburgh, UK, 2016; ISBN 9781474410434. [Google Scholar]
  67. Ding, I.; Hlavac, M. “Right” Choice: Restorative Nationalism and Right-Wing Populism in Central and Eastern Europe. Chinese Polit. Sci. Rev. 2017, 2, 427–444. [Google Scholar] [CrossRef]
  68. Tyson, A.; Kennedy, B.; Funk, C. Gen z, Millennials Stand out for Climate Change Activism, Social Media Engagement with Issue. Pew Res. Cent. 2021, 26. Available online: https://www.pewresearch.org/science/2021/05/26/gen-z-millennialsstand-out-for-climate-change-activism-social-media-engagement-with-issue/ (accessed on 21 August 2021).
  69. Davidov, E.; Cieciuch, J.; Meuleman, B.; Schmidt, P.; Algesheimer, R.; Hausherr, M. The comparability of measurements of attitudes toward immigration in the European social survey: Exact versus approximate measurement equivalence. Public Opin. Q. 2015, 79, 244–266. [Google Scholar] [CrossRef]
Figure 1. Fuzzy clustering ternary graphs; (a) Ethnic National Identity; (b) Civic National Identity.
Applsci 12 03946 g001aApplsci 12 03946 g001b
Figure 2. Apostle model applied to National Identity.
Applsci 12 03946 g002
Figure 3. Pearson Residuals. Contingency Tables; (a) country-year; (b); political orientation-year; (c) age-year.
Applsci 12 03946 g003aApplsci 12 03946 g003b
Table 1. Survey socio-demographic characteristics (N and %).
VariableN% *VariableN% *
Year Gender
200314,09650.57Male12,64545.37
201313,77749.43Female15,21954.60
Political Orientation Age
Far Left15305.4924 years or under11514.13
Left-Center575120.6325–34 years365513.11
Center-Liberal443615.9235–44 years477317.12
Right584920.9845–54 years520318.67
Far Right6912.4855–64 years491917.65
65–74 years426515.30
75 years or over384313.79
Religion Education
No Religion582820.90No Formal education8483.04
Catholic970034.80Primary school18276.55
Protestant748326.85Lower secondary731326.24
Other Christians354012.70Upper secondary610221.89
Jewish960.34Post-secondary431615.48
Islamic4641.66Lower level tertiary721325.88
Other Religions3081.10
* Some categories do not add 100 because the variable contains some missing values.
Table 2. Factor loadings for EFA. ISSP 2003 and 2013 criteria for being a truly national.
CriteriaEthnicCivic
To have been born in (country)0.85−0.11
To have the (country) citizenship0.450.30
To have lived in (country) for most of one’s life0.620.14
To be able to speak the (country) language0.010.60
To be (religion)0.58−0.05
To respect the (country’s) political institutions and laws−0.180.68
To feel (country nationality)0.280.43
To have (country nationality) ancestry0.84−0.13
Cronbach’s alfa0.800.60
Promax rotation
Table 3. Fit indices that test the configural (pool and multi-group), metric, and scalar equivalence.
ModelDfχ2CFITLIRMSEASRMR
Unidimensional model. Group by country-year
Configural (pool)207342.20.9760.9670.1150.071
Configural (MGCFA)4006977.60.9030.8650.1090.049
Metric53310,934.60.8470.8390.1180.098
Scalar66625,765.10.6320.6900.1640.152
Second order latent model (2 factors (Ethnic:Ind1-Ind3,Ind5,Ind8; Civic:Ind4,Ind6,Ind7; Nat.Id (Ethnic, Civic)Group by country-year
Configural (pool)184420.70.9850.9780.0930.054
Configural (MGCFA)3605482.50.9250.8840.1010.042
Metric3877716.40.8940.8800.1020.076
Scalar29216,799.30.7620.7730.1400.111
Note: In the analysis of the fits of the subsequent steps, fit indices are usually worsening, that is CFI and TLI are lower and RMSEA and SRMR are higher. However, changes in the other direction (i.e., higher CFI and TLI and lower RMSEA and SRMR) are also possible because most fit indices depend also on the number of degrees of freedom. CFI = comparative fit index; TLI = Tucker–Lewis index; RMSEA = root mean square error of approximation; SRMR = standardized root mean square residual.
Table 4. Fuzzy Cluster Profiles.
Ethnic IdentityMostLeastInterm.Civic IdentityMost LeastInterm
Nativity413
Citizenship414Language413
Living414Respect414
Religion411Feeling414
Ancestry413
Table 5. Ratios between national identity and country-year, political-orientation-year, and age-year.
Country-YearPost NationalistsEthnic OrientedCivic OrientedCredentialists
Denmark 20030.26137101.3075331.076628
Denmark 20130.6519490.2311671.6510990.732112
France 20030.4485650.7340841.8124490.578677
France 20130.3140690.4555731.8077230.705653
Germany 20031.7898630.2379931.5949210.651695
Germany 20131.24099401.9820030.611842
Ireland 20031.6222217.7652690.0507210.413658
Ireland 20133.1756813.0251530.0666880.306806
Norway 20030.31362201.5076350.726669
Norway 20130.25433601.9766630.750991
Portugal 20030.39592300.1519241.286691
Portugal 20130.4602500.5666170.685549
Russia 20031.184162.4421470.2493461.667388
Russia 20131.3313142.0230960.1248751.896975
Spain 20031.4729820.252720.0445690.726973
Spain 20132.4915990.2500380.8157740.885241
Great Britain 20031.2533653.1576980.8662591.077201
Great Britain 20131.08297600.8963071.073062
United States 20030.37887400.5330672.267803
United States 20130.858860.7212641.1659971.496239
Political Orientation-YearPost NationalistsEthnic OrientedCivic OrientedCredentialists
Far left (communist etc.) 20031.634780.7904430.9409491.000247
Far left (communist etc.) 20131.4492560.4056911.5382450.611558
Left. center left 20030.7659060.3879631.1545840.96578
Left. center left 20130.9105830.4724981.801970.653454
Center. liberal 20030.8366421.7799320.7193611.130289
Center. liberal 20130.9472650.9042920.8999111.136275
Right. conservative 20030.3475021.334850.8239331.150243
Right. conservative 20130.3415950.2137451.0083511.152859
Far right (fascist etc.) 20030.8489765.2680020.3318021.061607
Far right (fascist etc.) 20130.40555500.3804051.402062
Age-YearPost NationalistsEthnic OrientedCivic OrientedCredentialists
24 years or under 20031.599691.7912090.552810.724582
24 years or under 20131.1098490.6558821.6772010.589596
25–34 years 20031.2476161.5081080.904280.71956
25–34 years 20131.27660.5658191.3803720.612971
35–44 years 20031.0721330.8146191.1800920.769307
35–44 years 20131.6407840.2861251.488570.504523
45–54 years 20030.9958971.6120880.944290.944345
45–54 years 20131.2681770.6022351.306360.664637
55–64 years 20030.8033321.2016870.8477021.179955
55–64 years 20131.2285620.9334761.2758410.885933
65–74 years 20030.5164921.2209140.5113761.496431
65–74 years 20130.7906350.9495471.1124051.114347
75 years or over 20030.2262191.5469530.3182851.756688
75 years or over 20130.4470750.5944620.5372911.749079
Publisher’s Note: MDPI stays neutral with regard to jurisdictional claims in published maps and institutional affiliations.

