Article

Multimycotoxin Analysis in Oat, Rice, Almond and Soy Beverages by Liquid Chromatography-Tandem Mass Spectrometry

Laboratory of Food Chemistry and Toxicology, Faculty of Pharmacy, University of Valencia, Av. Vicent Andrés Estellés s/n, 46100 Burjassot, Valencia, Spain
*
Author to whom correspondence should be addressed.
Appl. Sci. 2022, 12(8), 3942; https://doi.org/10.3390/app12083942
Submission received: 18 March 2022 / Revised: 9 April 2022 / Accepted: 11 April 2022 / Published: 13 April 2022
(This article belongs to the Special Issue Novel Techniques for Analysis and Determination of Mycotoxins in Food)

Abstract

:
This study developed and validated an analytical methodology for the determination of aflatoxins, enniatins, beauvericin, zearalenone, ochratoxin-A, alternariols, HT-2 and T-2 toxin in soy, oat, rice and almond beverages, based on solid phase extraction columns (SPE) and analyzed by liquid chromatography coupled to mass spectrometry in tandem. C18 SPE was successfully applied, obtaining recoveries that range from 72 ± 12% (ochratoxin-A) to 99 ± 4% (ENA1) at high level (L1) and 65 ± 8% (T-2) to 128 ± 9% (alternariol monomethyl ether) at low levels (L3). The methodology was validated according to Commission Decision 2002/657/EC, with limits of quantification ranging from 0.3 (AFs in oat beverages) to 18 ng/mL (HT-2 in rice beverage). The analysis of 56 beverage samples purchased from Valencia (Spain) showed at least one mycotoxin occurring in 95% of samples, including carcinogenic aflatoxins, and oat beverage was the most contaminated. This is a newest validated methodology for the quantification of sixty mycotoxins in oat, rice, almond and soy beverages.

1. Introduction

Food alarms in Europe have generated great interest and concern among consumers, and it is increasingly necessary to establish adequate control measures to ensure the safe consumption of food (Commission implementing regulation (EU) 2019/1715) [1]. Food may contain dangerous organisms or substances, and their presence may be due to the intentional addition of substances (such as pesticides, veterinary drugs and other products used in primary production) or toxic substances naturally present in food that have been generated during the processing or storage, such as mycotoxins.
According to data published by the Rapid Alert System for Food and Feed (RASFF) [2], mycotoxins are the toxic substances with the highest number of notifications, following by those of biological origin and pesticides.
Although there are numerous studies that have evaluated the presence of free mycotoxins in foods, many of these studies have revealed that despite the control measures that are carried out to prevent the growth of fungi and the production of mycotoxins, as well as a control legislation to avoid the presence of contaminated food in the market [3], samples contaminated with legislated mycotoxins continue to appear occasionally and in low concentrations. Among the causes, due to the globalization of the raw material markets, the controls must be even more demanding. Another aspect to note is the co-presence of several mycotoxins in the same food, despite their low levels present.
Studies on the analysis of mycotoxins in cereal products are very numerous, and among the most studied products are beer, bread, pasta and breakfast cereals; however, it should be noted that the dietary changes in the population respond to multiple factors, including economic and health benefits. These aspects must be taken into account, since it can be currently observed that the incorporation of foods in our diet until now was unknown, but due to the publicity about their nutritional benefits, they are having an important acceptance (goji berries, chia seeds, acai berries, spirulina and kombu seaweed). Among these products, we find vegetable drinks, or they are erroneously called “vegetable milks” according to Annex VII of Regulation (EU) No. 1308/2013 [4,5,6,7], among which soy beverages top the list, followed by oatmeal, rice, wheat, tigernut, almond, hazelnut or walnut. These products appeared on the market as an alternative to animal milk, either due to lactose intolerance or allergies, or due to dietary preferences such as vegans, ovo-lacteal-ovo-vegetarian or by specific consumers who are climacteric or experience menopause.
The raw materials with which vegetable drinks are made can be contaminated by mycotoxins, as indicated by the numerous studies carried out on oats, rice and nuts, for which today the ubiquity of producing fungi is undeniable. Regarding soybeans, although it is a product that combines humidity and temperature characteristics that are conducive to the growth of mycotoxigenic fungi, there are fewer studies evaluating its presence.
For this reason, rice, soy, oatmeal, almond and tigernut drinks can be another source of exposure to mycotoxins through the diet. Currently, in the bibliography, there are very few studies in this regard, and one was only found recently from 2017, in which a QuEChERS extraction method has been optimized for the determination in rice, soy and oat drinks, of only 11 mycotoxins (aflatoxins (AFB1, AFB2, AFG1 and AFG2), ochratoxin A (OTA) and 6 fusarotoxins (DON, ZEA, T-2, HT-2, FB1 and FB2)) [8].
Therefore, it is necessary to develop analytical methods for multimycotoxin residues, as a control and monitoring technique for the presence of these and modified ones, and the analytical techniques available are revolutionizing the analytical sector of mycotoxins, allowing analysis that is more sensitive and specific. Plant-based beverage are complex matrices (proteins, carbohydrates, lipids and fiber) [9]; therefore, pre-treatments and clean-up steps to avoid the matrix effects that might interfere in quantification by analytical instruments are necessary [10]. Several authors developed methods in plant-based beverages by applying salting-out assisted liquid–liquid extraction in the case of Fusarium toxin determination [11,12]; dispersive liquid–liquid microextraction for aflatoxins [13]; or QuEChERS (Quick, Easy, Cheap, Effective, Rugged and Safe) extraction in the case of a multidetermination of mycotoxins [8] to avoid matrix effects.
The aims of the present study were to develop and validate a multimycotoxin method in soy, oat, rice and almond beverages using liquid chromatography coupled to tandem mass spectrometry (LC-MS/MS) and to apply the developed method in the most consumed vegetable drinks marketed in the city of Valencia.

2. Materials and Methods

2.1. Chemicals and Reagents

The certified standards of aflatoxin (AFB1, AFB2, AFG1 and AFG2), OTA, ZEA, T-2 and HT-2 toxin; BEA; ENs (A, A1, B and B1); alternariol (AOH); alternariol monomethyl ether (AME); and tentoxin (TENT) were purchased from Sigma Aldrich (Madrid, Spain).

2.2. Samples

A total of 56 samples of vegetable drinks were carried out in Valencia retail establishments throughout 2017. The distribution according to the type of sample was as follows: eleven almond drinks samples, including one enriched with calcium and the other organic; ten rice drinks samples, including two organic samples, a sample enriched with omega 3 and 6, and a sample enriched with calcium; eighteen samples of soy drinks, including five enriched with calcium, three organic and two light (1.1 g fatty acid content); and seventeen oat drinks samples, including three calcium-enriched samples and five organic samples.

2.3. Multi-Mycotoxin Extraction Method in Vegetable Drinks

For the selection of the extraction method, as it is a liquid matrix, the use of solid phase extraction columns (SPEs) was chosen. Solid phase extraction is an extraction and purification process in which the sample is diluted or resuspended in a liquid mixture, and the compounds present are separated according to their physical and chemical properties. The extraction and pre-concentration of mycotoxins are dissolved through their selective retention in a solid stationary phase, followed by the elution of the retained analytes by a suitable organic solvent and in order to analyze the solubility of the analytes. The stationary phases of SPE are made up of particles that have a high affinity for analytes. The choice of the solid phase depends on the polarity of the mycotoxins and the type of matrix, and the most commonly used columns are modified silica. Different studies of optimization of extraction by SPE have been reviewed for the analysis of different mycotoxins such as ZEN, OTA or FBs and are collected in Table 1 [14,15].
In the literature, using C18 SPE columns is indicated; then, it was decided to use Strata C18-E specifically, which is reversed phase, for which its sorbent is based on silica and is very suitable for analytes of a certain hydrophobic nature [15,16,17,18,19].
Several tests with different proportions of methanol, acetonitrile and/or water were performed, as well as the acidification of the medium with 1% acetic acid on the sample before passing through the SPE column. Acetonitrile and water were chosen as solvents for the extraction. The use of acetonitrile allowed the precipitation of the protein content; in fact, these samples contain between 2.2 and 0.2 g of proteins.
The extraction procedure used was as follows, 10 mL of drink sample was taken in a centrifuge tube (50 mL) to which 5 mL of acetonitrile was added; after stirring for 1 min, it was centrifuged at 4500 rpm for 5 min at 5 °C (Eppendorf 5810R, Eppendorf AG, Hamburg, Germany). The supernatant is then collected in centrifuge tubes to which 15 mL of distilled water was added, and it was shaken and centrifuged again for another 5 min at 4500 rpm. On the other hand, STRATA® C18-E columns of Phenomenex (Phenomenex Int., Madrid, Spain) of 1 g/6 mL were used, which was then conditioned first with 5 mL of methanol and then with 5 mL of distilled water; the entire volume of the supernatant was then transferred to the columns. Subsequently, the column is cleaned with 5 mL of a mixture of water and methanol in the ratio of 80:20 (v/v), and then the analytes are eluted with 5 mL of methanol.
The dry residue was reconstituted to a final volume of 0.5 mL with methanol and water (70:30, v/v). Prior to its introduction in a vial, it was filtered with a 13 mm and 0.22 μm nylon filter (Análisis Vínicos SL, Tomelloso, Spain).

2.4. Determination by Liquid Chromatography Coupled to Tandem Mass Spectrometry (LC-MS/MS)

Mycotoxin analysis was performed using an LC-MS/MS equipment with a triplex ion trap analyser [20]. It comprised an Agilent 1200 LC binary pump chromatograph and autosampler, coupled to 3200 QTRAP® AB SCIEX (Applied Biosystems, Foster City, CA, USA) equipped with a Turbo-V™ source (ESI) interface. The chromatographic separation of the compounds was carried out at 33 °C with a reversed phase column Gemini ® C18 (3 μM, 150 × 2 mm ID) and guard column C18 (4 × 2 mm, ID; 3 μM) from Phenomenex (Madrid, Spain). The mobile phase, with LC-MS/MS quality solvents from Merck KGaA (Darmstadt, Germany), consists of a gradient of methanol (0.1% formic acid and 5 mM ammonium formate) as phase A and water (0.1% formic acid and 5 mM ammonium formate) as phase B. The chromatographic gradient to be used was as follows: equilibrated for 2 min at 90% B and 0.25 mL/min 80–20% B in 3 min at 0.25 mL/min; 20% B in 1 min at 0.25 mL/min; 20–10% B in 2 min at 0.25 mL/min; 10% B in 6 min at 0.25 mL/min; 10–0% B in 3 min at 0.25 mL/min; 100% A in 1 min at 0.25 mL/min; 100–50% A in 3 min at 0.25 mL/min; returned to initial conditions in 2 min; and maintained for 2 min at 0.25 mL/min. The total time of the gradient was 21 min. An injection volume of 20 µL was used (Figure 1).
Regarding spectrometric analysis, a QTRAP System is used in triple quadrupole mass spectrometry (MS/MS) mode. The Turbo-V ™ source is used in positive mode for the source/gas parameters: Vacuum Gauge (10 × 10−5 Torr) 3.1, curtain gas (CUR) 20, ionspray voltage (IS) 5500, source temperature (TEM) 450 °C, gas source ion 1 (GS1) and gas source ion 2 (GS2) at 50 V. The precursor ions (Q1), product (Q3), collision energy (CE), collision exit cell potential (CXP), declustering potential (DP) and collision cell entry potential (CEP) were used. The input potential (EP) is the same for all 10 V analytes. The fragments monitored (retention time, precursor ion and product ion) and spectrometric parameters (declustering potential, collision energy and collision cell potential) used were performed previously [20], and they are shown in Table 2. Data acquisition and processing were performed using Analyst® software, version 1.5.2 (MDS Analytical Technologies, 2008 MDS Inc., Toronto, ON, Canada).

3. Results and Discussion

3.1. Validation of the Multi-Mycotoxin Determination Method in Vegetable Drinks
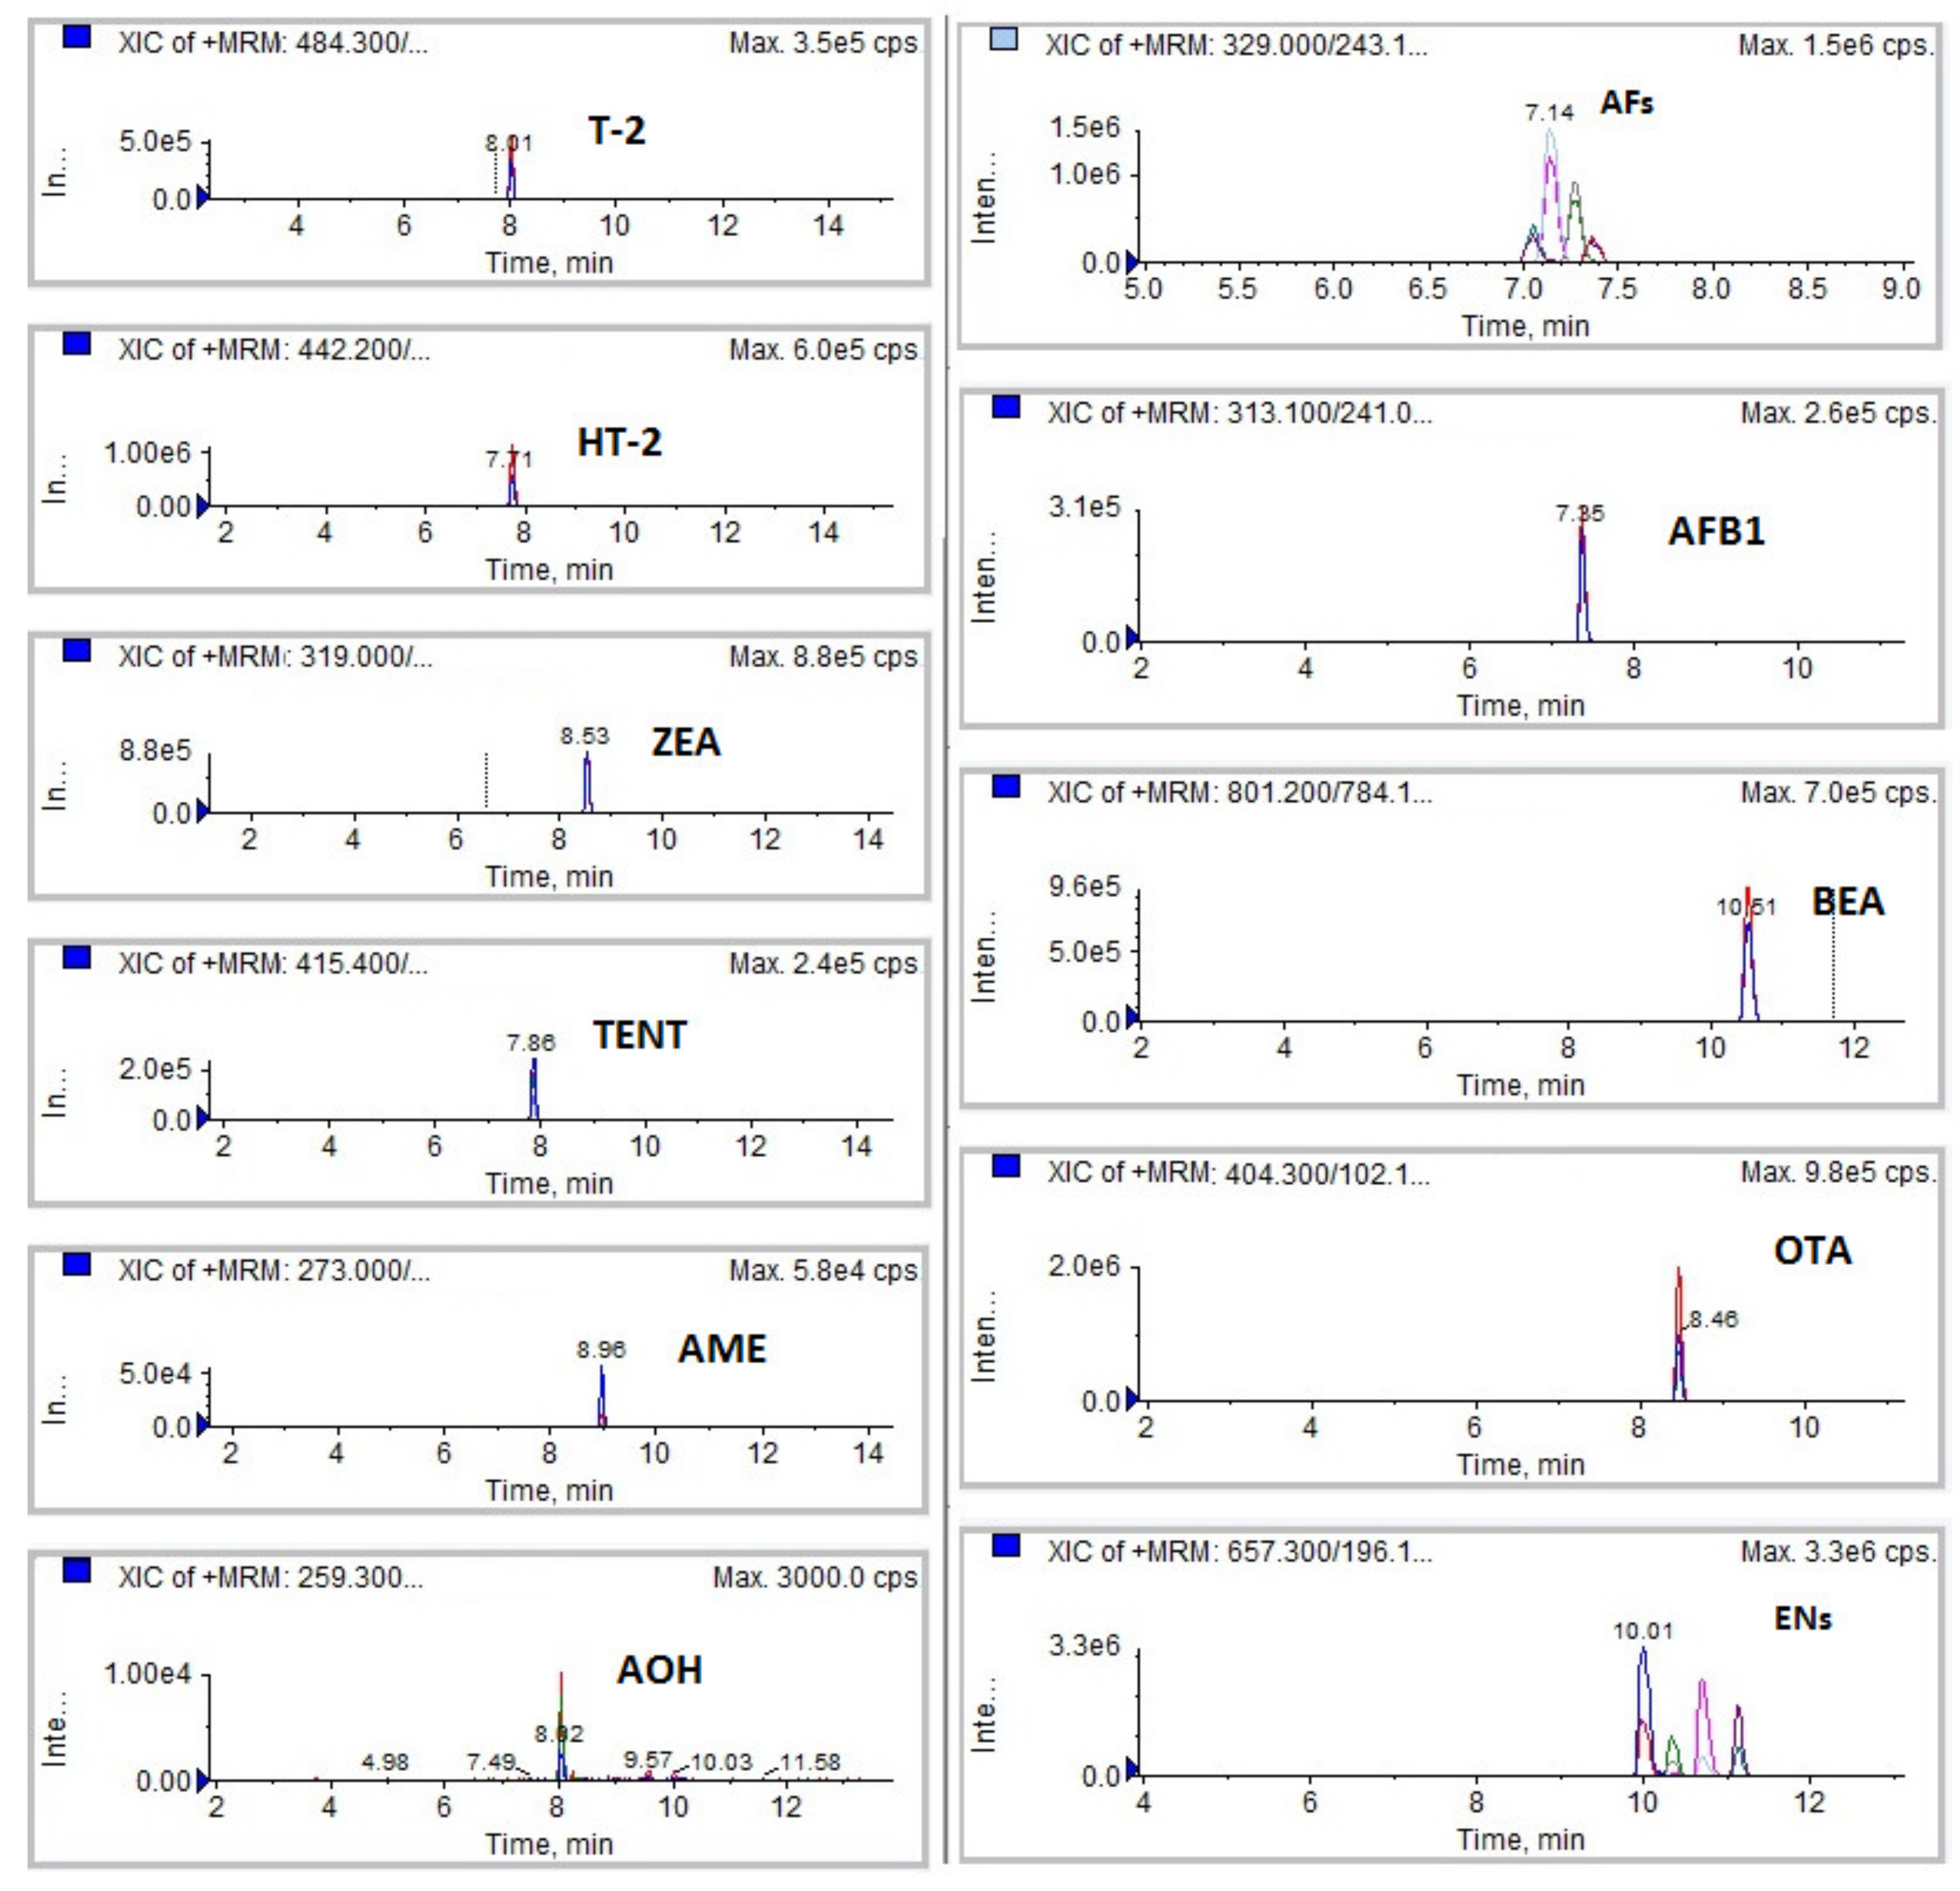
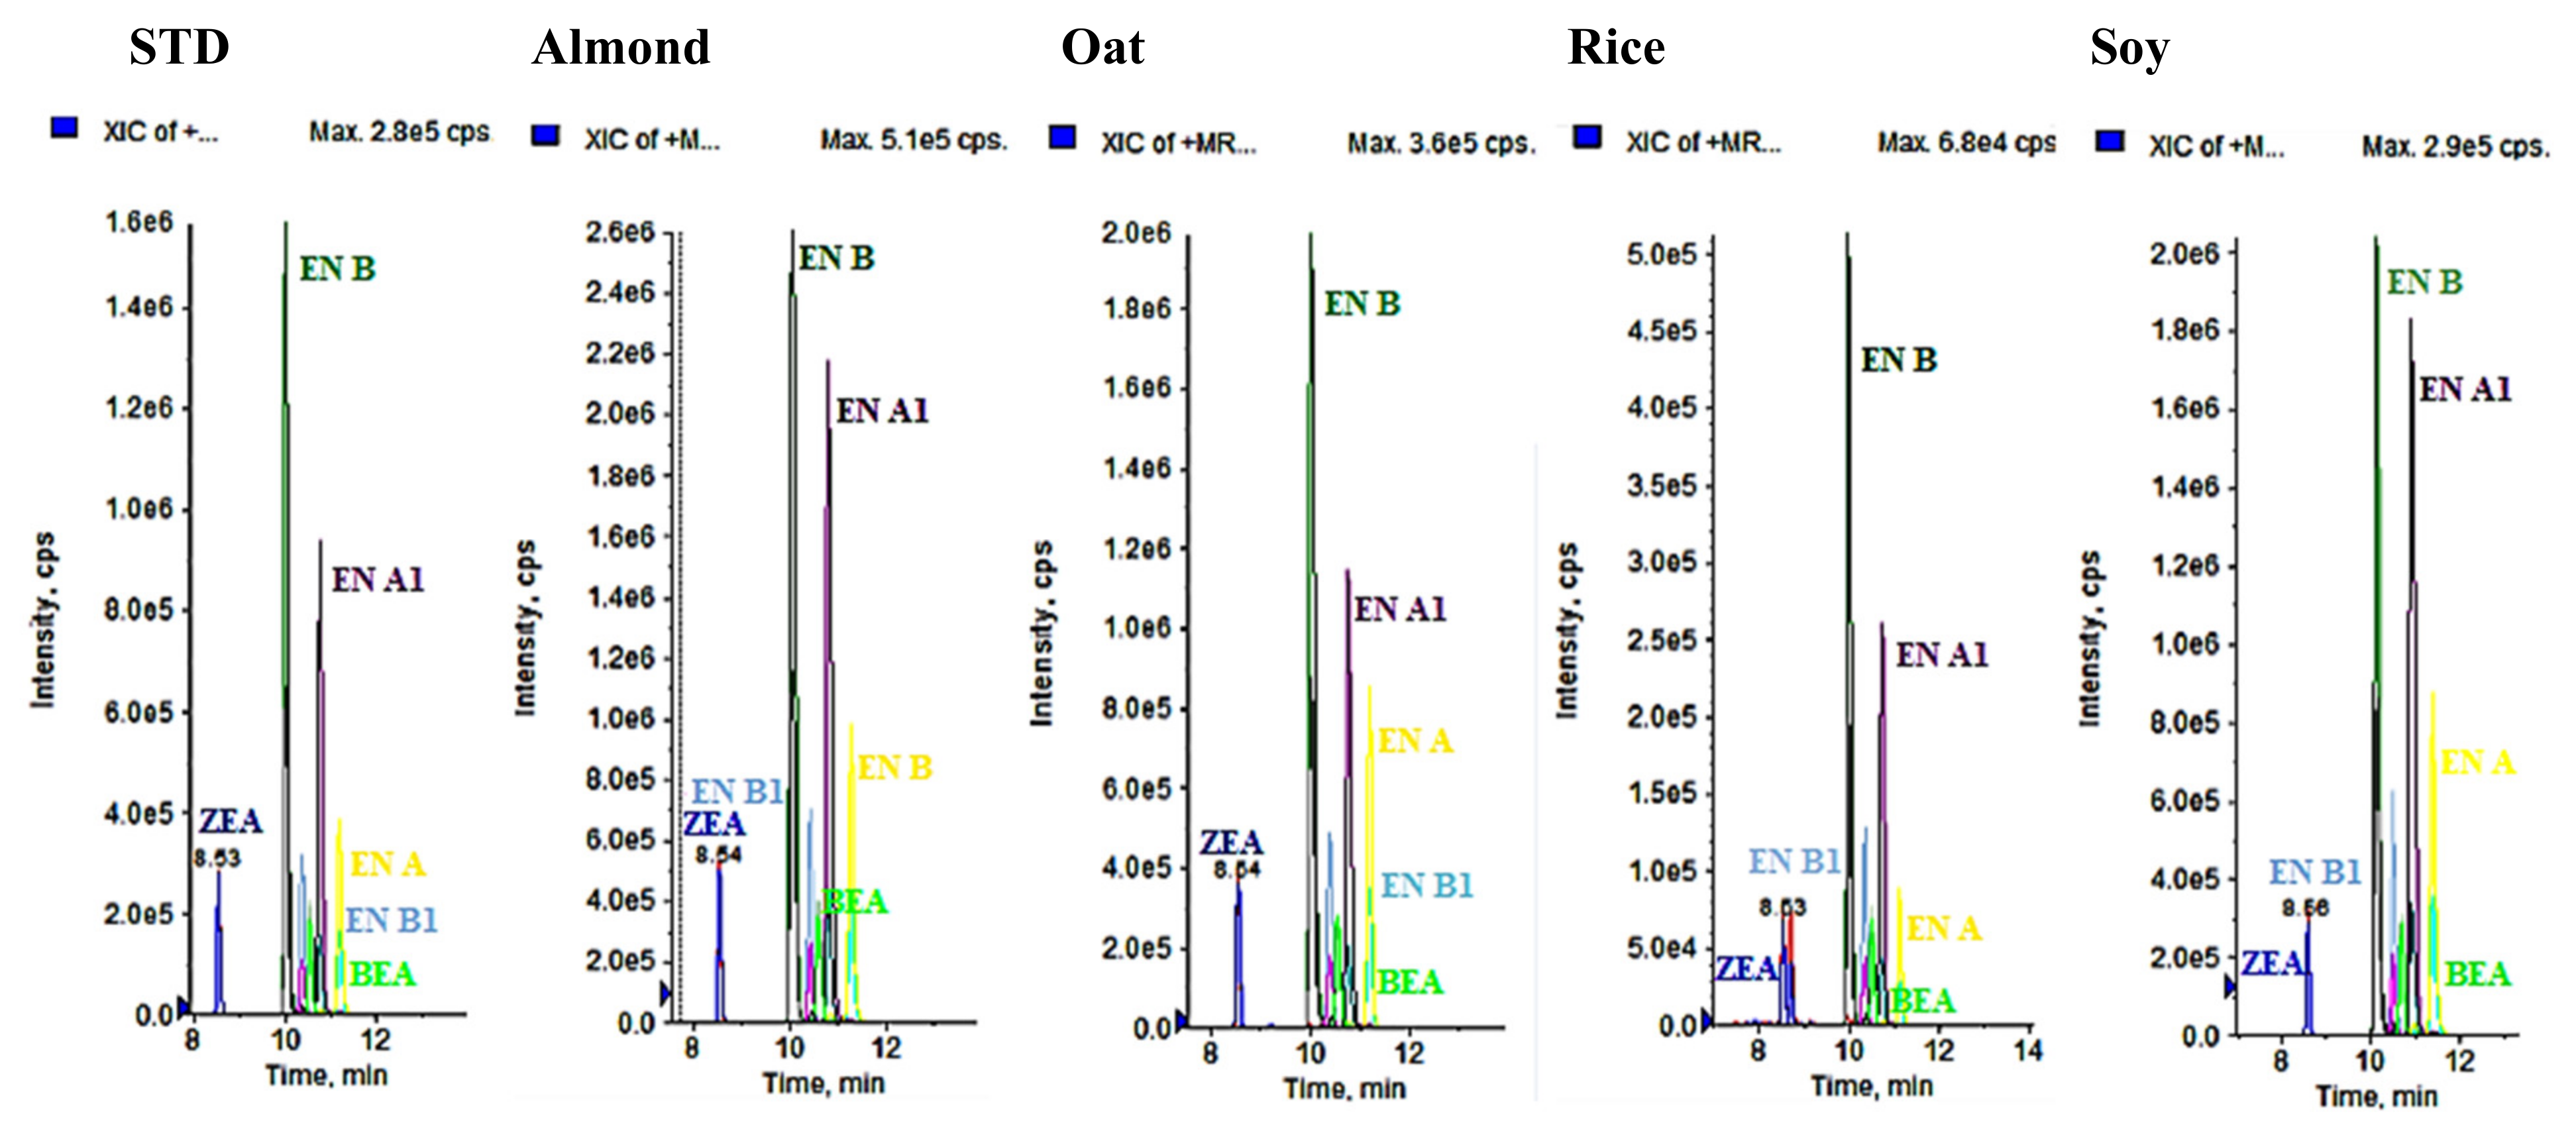
The described method was validated following European Commission Decision 2002/657/EC [21] to observe the performance and extraction behavior for each of the mycotoxins under study and for four types of beverages: rice, oats, soy and almonds. For this, the stock solutions of all mycotoxins were prepared individually, and working solutions with the calibration lines in the solvent and the calibration lines with the matrix were prepared for the quantification of the samples to evaluate the matrix effect and for the fortification of the samples for the study of intraday and interday recovery (reproducibility and repeatability). The solutions until their use were stored frozen at −20 °C and prepared periodically to maintain their stability.
The concentrations of the working solutions were 10 µg/mL for AFs OTA, AME, AOH and TENT; 40 µg/mL for T-2; 5 µg/mL for ENA, ENA1, ENB, ENB1 and BEA; 15 µg/mL for ZEA and HT-2; and the starting point solutions (P1) to prepare the calibration curves were 0.5 µg/mL for AFs OTA, AME, AOH and TENT; 2 µg/mL for T-2; 0.25 µg/mL for ENA, ENA1, ENB, ENB1 and BEA; and 2.5 µg/mL for ZEA and HT-2.
The validation of the method was carried out for the parameters of linearity, matrix effect, sensitivity, reproducibility and repeatability.

3.1.1. Selectivity

This parameter is related to the degree to which other substances interfere with the identification and, where appropriate, the quantification of the analytes in question. It measures the ability of the method to identify/quantify analytes in the presence of other substances, endogenous or exogenous, in a matrix sample under the conditions required by the method. For this, different mycotoxin solutions were prepared at the concentrations of a calibration line from 500 to 2.5 ng/mL: in a solution of methanol: water (70:30, v/v); in solution with oat extract; in solution with rice extract; in solution with soy extract; and in a solution with almond extract. In all of them, the following was studied: (a) The retention time of each analyte present in the sample coincided with the retention time of the corresponding standard in fortified matrix, with a tolerance of ±2.5%; this retention time had to be fulfilled for the two transitions (qualifier and quantifier). (b) The two transitions (product ions) chosen for each analyte were present in the samples. (c) The area ratio of product ion 1 and product ion 2 was within a tolerance of ±20% to ±50% depending on the relative intensities of the ions. Thus, the two product ions were present in the matrix solutions and their retention time oscillation (Rt) between the matrix solutions, and the solution prepared with solvents was less than (Rt ± 2.5%). This is shown in Figure 2, where the chromatograms of five (ENs and ZEA) of the sixteen mycotoxins analyzed in the four matrices studied are shown.

3.1.2. Linearity

The method showed a linear behavior within the 100LQ-LQ working range of analyte concentrations. It was calculated by means of a least squares adjustment for the relationship between the response obtained in the mass spectrophotometer and the concentration of the analyte both in solution and in a matrix solution. The acceptance criterion implies a test of the goodness of fit, using a correlation coefficient (r) between 0.9 and 0.999 as a criterion.

3.1.3. Sensitivity

The limit of detection (LD) is the lowest amount of analyte in a sample that can be detected but not necessarily quantified as an exact value, and the limit of quantification (LQ) is the lowest amount of analyte in a sample that can be quantitatively determined with adequate precision and accuracy. Acceptable LQ values were obtained for the studied mycotoxins, thus allowing the determination of mycotoxins below the maximum limits established for some of the mycotoxins in matrices of cereal or dried fruit products such as Suma (HT-2 + T-2), ZEA, AFB1, Sum (AFs) and OTA, which are detailed in Table 3.

3.1.4. Matrix Effect

Regarding the ionization of analytes, the matrix effect (ME) was studied, since this can interfere either by reducing or increasing the instrumental response to the analytes compared to that of the standards in solvents. It was observed that even though the intensities were of the same order, there was a certain effect of suppression or enhancement of the signal. To evaluate this ME, the calibration lines prepared from 500 from 2.5 ng/mL were used (after a linear least squares regression), and the slopes of the lines were compared (y = b + a·x; where “x” is the analyte concentration, “y” is the measured signal, “b” is the ordinate at the origin and “a” is the slope of the line). Thus, the relationship between the slope of the calibration curve of the solvent standard (aSTD) and that of the standard dissolved in matrix (aM) was calculated.
ME   % = aM aSTD × 100  
To obtain ME (%), the value obtained was subtracted from 100, from which it is extracted that the ME (%) values equal to 0 do not present a matrix effect; if they are positive values, there is an exaltation of the signal, and if they are negative, it is due to signal suppression. In Figure 3, we can observe the result obtained both by matrices and the total mean of them, observing that there is mainly an inhibition of the signal for all mycotoxins and that the soy matrix presents higher values of matrix effect, followed by rice, oats and, finally, almond. It should be noted that this last product only contains 2.5% raw material, so it is expected that the effect will be less than that of the other matrices.
As there is a matrix effect, the need to compensate for this matrix effect is established by using extracts of mycotoxin-negative vegetable drinks to construct the calibration curves and perform quantitative determination in the sample.

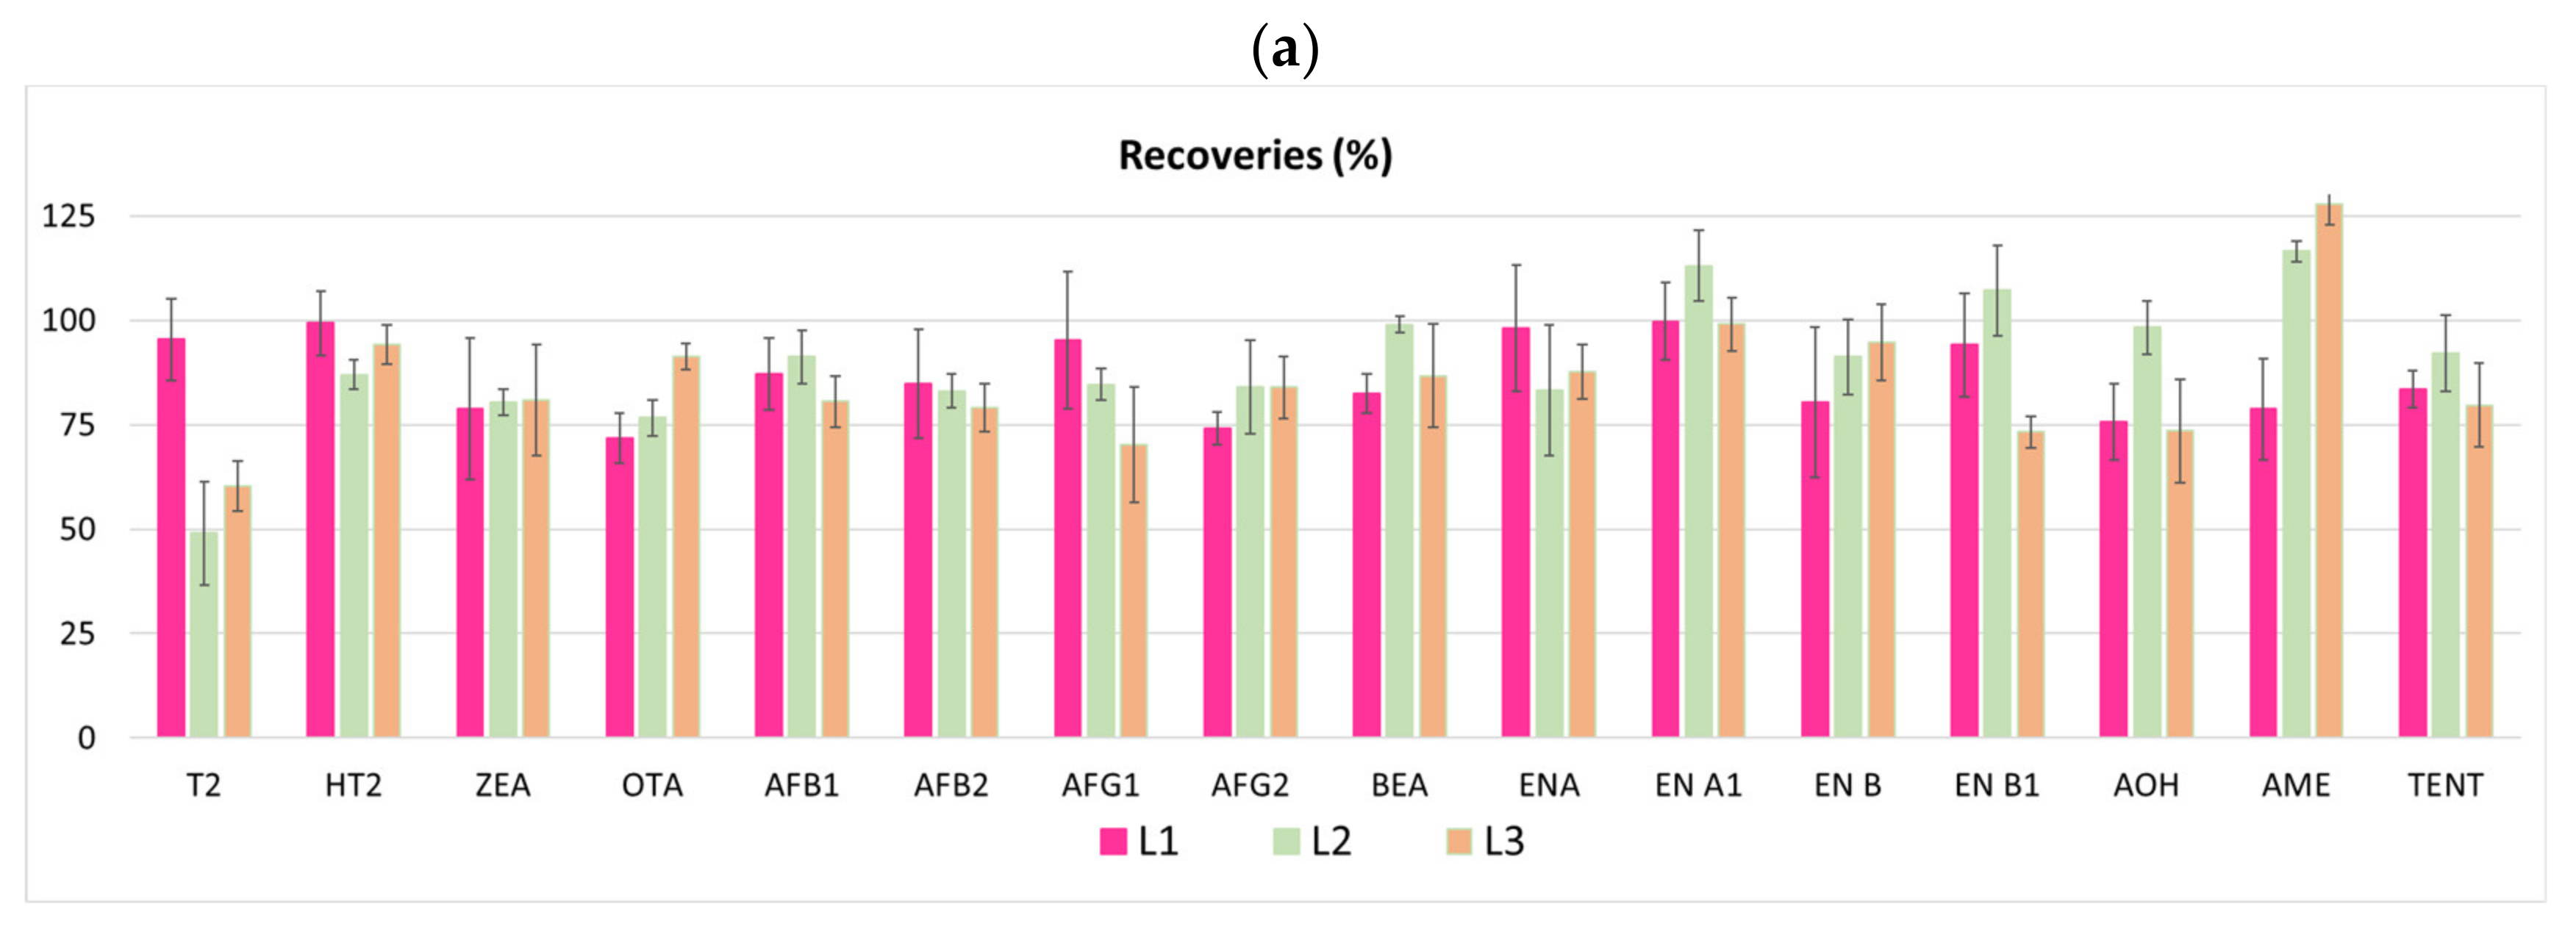
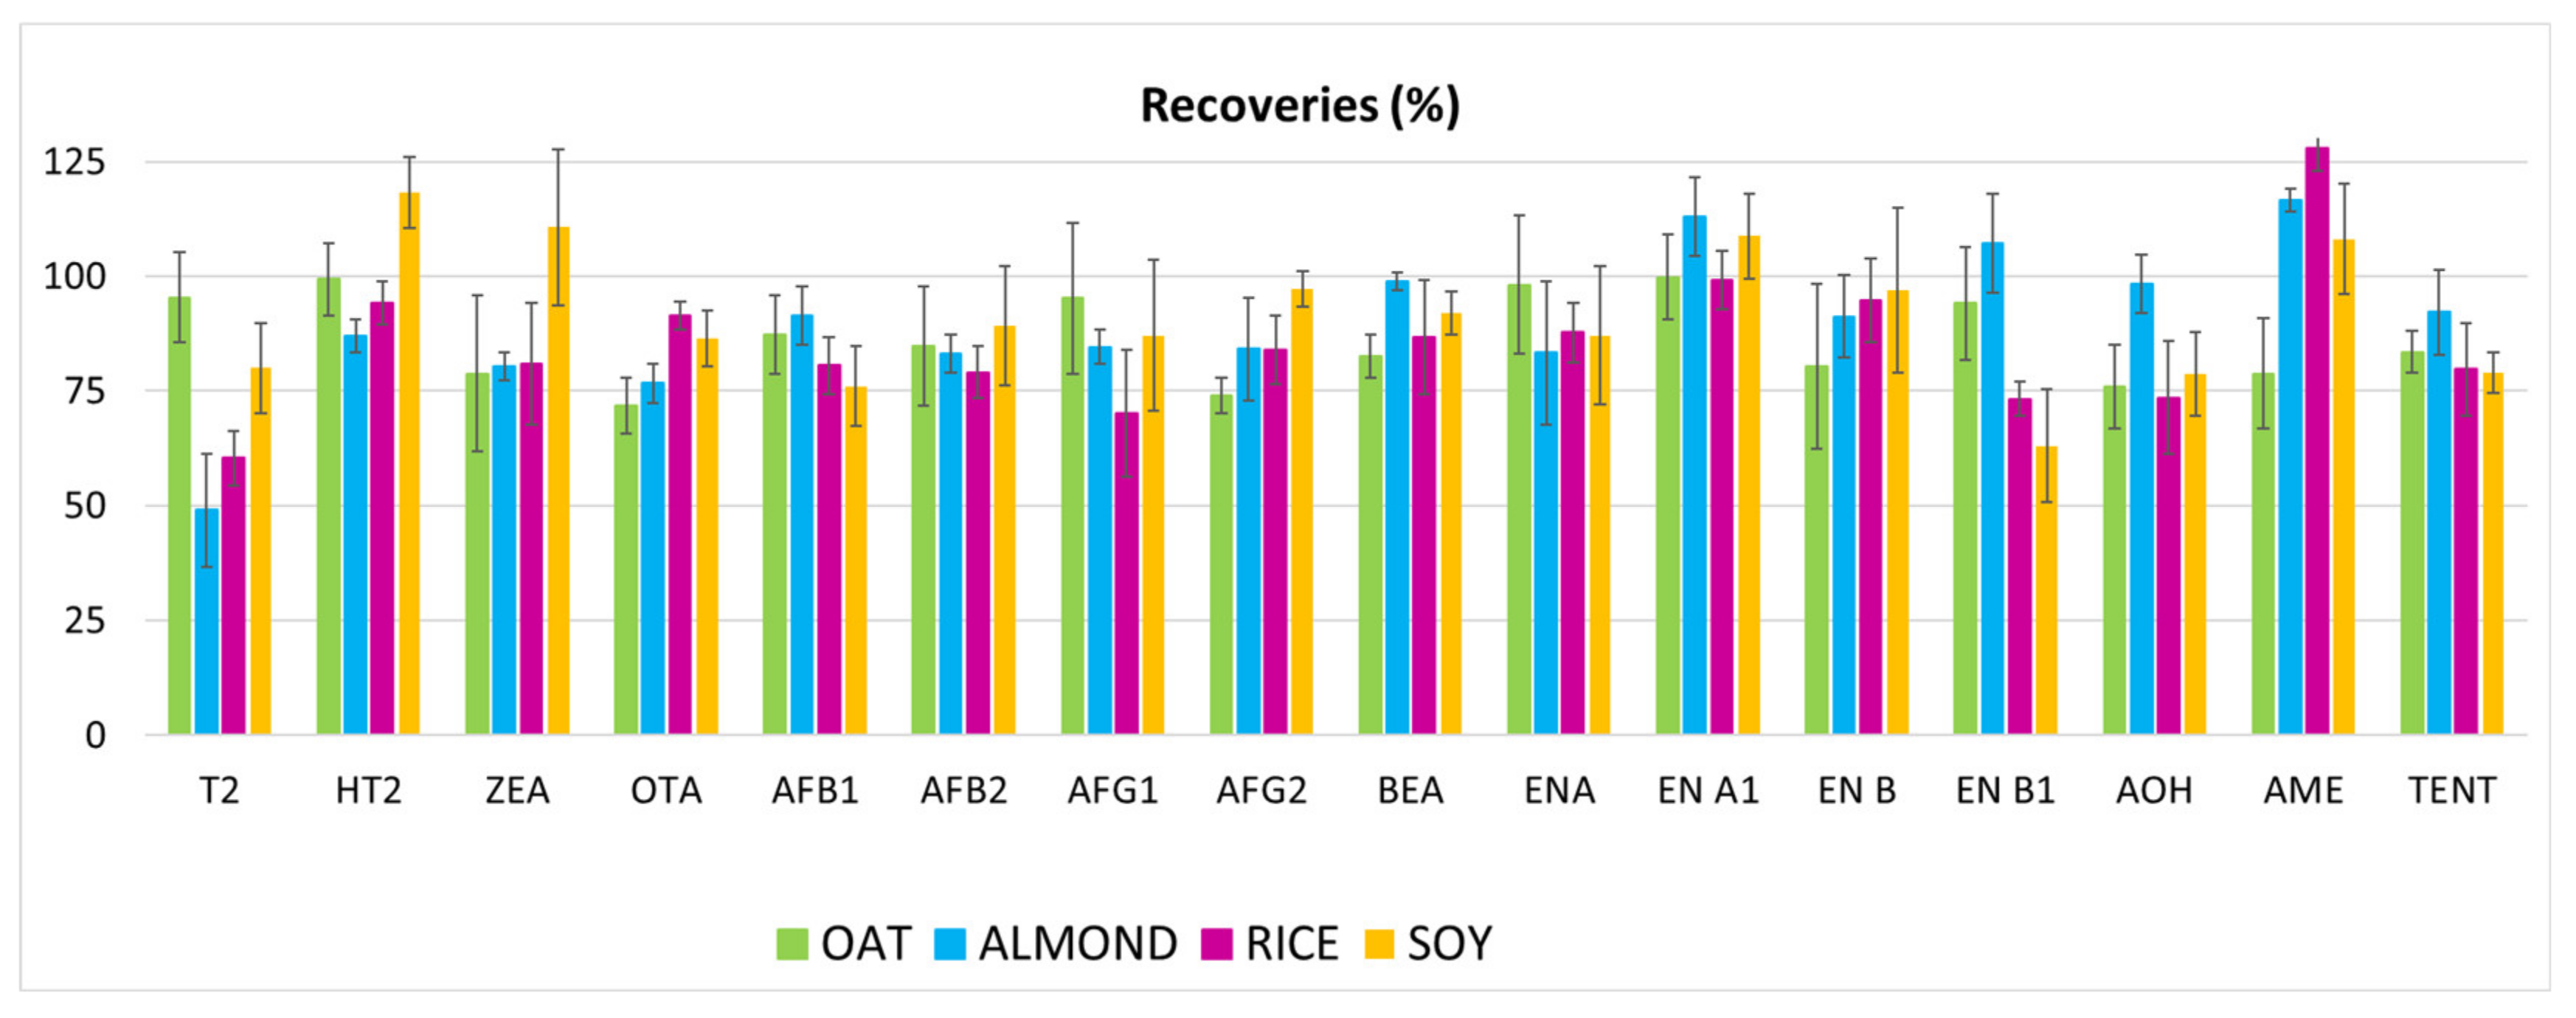
3.1.5. Repeatability and Reproducibility

Precision measures the degree of agreement between the analytical results obtained from a series of repeated measurements of the same analyte carried out under the conditions specified in the method. Precision reflects the random errors that occur when a method is used. The conditions under which precision was measured were under repeatability and reproducibility conditions. The repeatability of the conditions exists when the same analyst analyzes samples on the same day and with the same instrument or the same materials and in the same laboratory. Any change in these conditions (e.g., different analysts, different days, different instruments and different laboratories) implies that the conditions will be reproducible. Therefore, repeatability was measured with recovery studies in triplicate (n = 3) at three levels, including values corresponding to the maximum permitted limits and those close to the detection limit (L1, L2 and L3) with the four matrices. L1 was 0.5 µg/mL (AFs OTA, AME, AOH and TENT), 1 µg/mL (T-2), 0.25 µg/mL (ENA, ENA1, ENB, ENB1 and BEA), 1.25 ug/mL (ZEA, HT-2) and consecutive half values for L2 and L3. For reproducibility, the study was carried out on three different days (n = 9). Precision was measured in terms of the relative standard deviation of analytical results obtained with independently prepared control standards. Precision depends on the concentration and was measured with different concentrations within the working range, at high (L1), medium (L2) and low (L3) concentrations. Accuracy is acceptable when the lower concentration level is 20%. Precision was measured in terms of relative standard deviation of analytical results obtained with independently prepared control standards. The precision depends on the concentration and was measured with different concentrations within the working range at high (L1), medium (L2) and low (L3) concentrations. Accuracy is acceptable when the lower concentration level is 20%. Precision was measured in terms of relative standard deviation of analytical results obtained with independently prepared control standards. Precision depends on the concentration and was measured with different concentrations within the working range at high (L1), medium (L2) and low (L3) concentrations. Accuracy is acceptable when the lower concentration level is 20%.
The optimized method presented acceptable recovery values for both reproducibility, repeatability and precision, as shown in Figure 4a. Recovery mean values (intraday or repeatability and interday or reproducibility) were obtained for the three levels studied in the range from (49 ± 18)% to (128 ± 9)%, corresponding to T-2 and AME. Of the mycotoxins studied, higher recoveries were observed for EN A1 in the three levels (99% for L1, 113% for L2 and 99% for L3) and AME for L2 (116%) and L3 (128%) levels.
In Figure 4b, the reproducibility results are shown for all mycotoxins at the L1 level for the four matrices, and the values observed have no significance differences between matrices.
The repeatability results (n = 3) are shown in Figure 5 for the L1 level in the four matrices.

3.2. Analysis of Vegetable Drinks

A total of 56 vegetable drinks were analyzed, and it was observed that 95% of them presented levels of mycotoxins. The most detected was ENB (22%), followed by EN B1 (19%) and BEA (16%), as shown in Figure 6.

3.2.1. Presence of Mycotoxins

From the analysis performed, the presence of BEA (16%), ENA (3%), ENA1 (11%), ENB (22%), ENB1 (19%), ZEA (7%), HT-2 (5%), T-2 (3%), AOH (3%) and TENT (4%) has been observed.
This presence according to the type of matrix was different, observing a higher presence of ENB in soy beverages (43%) and oat beverages (20%) than ENB1 (19%) in almonds. On the other hand, in rice, the most detected was ZEA (29%) (Figure 6).
As shown in Table 4, the detected values were between 0.1 ng/mL (AFG2) and 108.9 ng/mL (ENB) not exceeding either the maximum or recommended limits for legislated mycotoxins and, therefore, being safe and compliant according to the legislation. Regarding the highest level that was detected, we found a sample of almond drink that contained 108.9 ng/mL of ENB. These concentrations are below the levels detected in other studies carried out on the cereals with which these drinks are made, thus indicating that it could have a very important role in reducing mycotoxin levels in the production and elaboration processes of beverages.
According to the type of drink, it was found that oat beverages and soy beverages were the most contaminated, finding levels of mycotoxins in all oat beverages samples and in 93% of soy beverages (Figure 6). This is a worrying aspect since these types of drink are usually the most chosen by consumers of vegetable drinks. On the other hand, in rice and almond drinks, 86% presented mycotoxin levels.
In oat beverages, a greater presence of emerging mycotoxins was detected, mainly ENB and ENB1, a result that coincides with previous studies carried out on this type of cereal. For example, Juan et al. [24] detected ENB in 43% of oats marketed in Italy and, in 2014, in 21% of baby food samples that combined between 2 and 8 different cereals including oats [25]. For this matrix, there are limits established for some of the mycotoxins, but no oat beverages exceeded these values.
Regarding soy beverages, the major mycotoxin also present was ENB (43%), followed by ENB1 (18%), ZEA and BEA (11%). No limits have been established for this food, so regardless of the results, they would be compliant samples; however, it should be noted that depending on the increase in consumption, the possible presence of the same mycotoxin and the fact that more than one mycotoxin may be found in a same sample should be considered, and more extensive studies and a collection of analytical data to make a full assessment should be performed.
The analyzed rice drink showed a higher presence of ZEA, being detected in 23% of the samples, but the values were lower than the legislated ones. On the other hand, for almond drinks, the most detected was ENB1 (19%), followed by the presence of ENB, ENA, ENA1 and ZEA in 9% of the samples (Figure 6).

3.2.2. Mycotoxin Co-Presence

The values detected did not exceed ML or the recommended values in any case, but it should be noted that the co-presence of more than one mycotoxin in a food, even at low levels, may have a synergistic, antagonistic or additive effect. In the literature, many authors have evaluated the toxicological effects of multimycotoxins presence. Juan-García et al. [26] evaluated the toxicological effect by conducting a cytotoxicity study with HepG2 cells by the binary and tertiary combination of 3-ADON, 15-ADON and AOH. Moreover, Zouaoui et al. [27] evaluated the cytotoxicity with the combination of beauvericin, patulin and sterigmatocystin, observing both synergistic and additive effects. These studies have generally been carried out with the combination of two to three mycotoxins (16 samples), but if we look at the results in Table 5 in five of the beverage samples analyzed, samples in which even more than five mycotoxins have been found in the same product were observed. The most frequent combination was that of three (ENA1 + ENB + ENB1) (BEA + ENB + ENB1) and four (BEA + ENA1 + ENB + ENB1) mycotoxins (Table 5). Co-presence was mainly observed by emerging mycotoxins, a fact that coincides with previous studies in which these mycotoxins have been evaluated along with others on different cereals. Stanciu et al. [28] showed that the most frequent combinations were (ENA1 + ENB + ENB1) in wheat grown in Romania, and Juan et al. [29] observed barley samples as having the highest frequency of two and three combinations of mycotoxins, both 26%, respectively.
Recently, works studied mycotoxin presence in oat, soy and rice-based beverage, as they are the most consumed globally [8,11,12,13,30]. Miró-Abella et al. [8] reported the presence of mycotoxins and found DON, OTA, ZEN and T-2 toxin co-occurrence with AFB1, AFB2, AFG1 and AFG2, and oat-based beverages were the most frequently contaminated. Moreover, Hamed et al. [11] studied Fusarium toxins in oat-based beverages, and DON was the most detected. Arroyo-Manzanares et al. [12] evaluated ENs and BEA in plant-based vegetables, reporting that 75% of oats were contaminated. Wheat beverages are also susceptible of OTA contamination, and 80% of studied wheat beverages by El-Badry [31] reported high levels. One product is frequently used to supplement infant diets, which are especially susceptible to mycotoxins. The most probable sources of mycotoxins in these beverages are from raw cereals, and new research is required to study toxins along with production processes.
The traditional tigernut beverage consumed in Spain and other African countries [13] was studied to evaluate the presence of mycotoxins, and the presence of aflatoxins (AFB1, AFB2 and AFG2) and OTA [32,33] was detected. Rubert et al. [33] reported more mycotoxins contamination in fresh beverage than those concentrated in Spanish tigernut beverages. Sebastia et al. [32] showed that the strict controls that guarantee quality tigernut beverages with Protected Origin Designation from Valencia prevent the commercialization of contaminated beverages.

4. Conclusions

Based on the results obtained, we can conclude that the validated analytical method is suitable for quantifying 16 mycotoxins in oat, almond, soy and rice beverages. Analytical data showed that out of total beverage samples, 95% of them presented levels of mycotoxins, and the most detected is ENB (22%). ENB showed a high registered level with 108.9 ng/mL. The co-occurrence of mycotoxins (up to two) was also observed in some positive samples. Risk assessment shows that the intake of mycotoxins through the consumption of these beverages in Valencia does not represent a risk for the population, except for AFs that are classified as carcinogenic compounds by international authorities. More investigations and monitoring studies are recommended to assess the multi-mycotoxin occurrence and the bioaccessibility of these compounds in these matrices to assess the potential risk for the consumers.

Author Contributions

Conceptualization, C.J. and A.J.-G.; methodology, C.J.; validation, C.J.; formal analysis, C.J.; investigation, C.J.; resources, C.J.; data curation, C.J.; writing—original draft preparation, C.J.; writing—review and editing, C.J. and A.J.-G.; project administration, C.J.; funding acquisition, J.M., J.C.M., A.J.-G. and C.J. All authors have read and agreed to the published version of the manuscript.

Funding

This research was funded by Spanish Ministry of Economy and Competitiveness AGL2016-77610-R.

Conflicts of Interest

The authors declare no conflict of interest.

References

  1. Commission implementing regulation (EU) 2019/1715 of 30 September 2019 laying down rules for the functioning of the information management system for official controls and its system components. Off. J. Eur. Union 2019, L261, 37–96.
  2. RASFF-Preliminary Annual Report. 2016. Available online: http://ec.europa.eu/food/food/rapidalert/index_en.htm (accessed on 2 September 2017).
  3. Codex Alimentarius. International Food Standards. In Code of Practice to Prevent and Reduce Mycotoxin Contamination of Cereals CAC/RCP 51-2003, Adopted in 2003; Codex Alimentarius Commission: Rome, Italy, 2003; Amendments 2014.
  4. REGULATION (EU) No. 1308/2013 of the European Parliament and of the Council of December 17, 2013 Creating the Common Organization of the Markets for Agricultural Products and Repealing Regulations (EEC) No. 922/72, (EEC) No. 234/79, (EC) No. 1037/2001 and (EC) No. 1234/2007. Off. J. Eur. Union 2013, L347, 671–854.
  5. Directive 2000/13/EC of the European Parliament and of the Council of March 20, 2000 on the approximation of the laws of the Member States regarding the labeling, presentation and advertising of food products. Off. J. Eur. Communities 2000, L109, 29–42.
  6. REGULATION (EU) No. 1169/2011 of the European Parliament and of the Council of October 25, 2011 on Food Information Provided to the Consumer and by which Regulations (EC) No. 1924/2006 and (EC) No. 1925/2006 are amended of the European Parliament and of the Council, and Repealing Commission Directive 87/250/EEC, Council Directive 90/496/EEC, Commission Directive 1999/10/EC, Directive 2000/13/EC of the European Parliament and of the Council, Directives 2002/67/EC, and 2008/5/EC of the Commission, and Commission Regulation (EC) No. 608/2004. Off. J. Eur. Union 2011, L304, 18–63.
  7. Directive 2006/114/EC of the European Parliament and of the Council of 12 December 2006 on misleading advertising and comparative advertising. Off. J. Eur. Union 2006, L376, 21–27.
  8. Miró-Abella, E.; Herrero, P.; Canela, N.; Arola, L.; Borrull, F.; Ras, R.; Fontanals, N. Determination of mycotoxins in plant-based beverages using QuEChERS and liquid chromatography–tandem mass spectrometry. Food Chem. 2017, 229, 366–372. [Google Scholar] [CrossRef]
  9. Silva, A.R.A.; Silva, M.M.N.; Ribeiro, B.D. Health issues and technological aspects of plant-based alternative milk. Food Res. Int. 2020, 131, 108972. [Google Scholar] [CrossRef]
  10. Yang, Y.; Guoliang, L.; Wu, D.; Liu, J.; Li, X.; Luo, P.; Hu, N.; Wang, H.; Wu, Y. Recent advances on toxicity and determination methods of mycotoxins in foodstuffs. Trends Food Sci. Technol. 2020, 96, 233–252. [Google Scholar] [CrossRef]
  11. Hamed, A.M.; Arroyo-Manzanares, N.; García-Campaña, A.M.; Gámiz-Gracia, L. Determination of Fusarium toxins in functional vegetable milks applying salting-out-assisted liquid–liquid extraction combined with ultra-high-performance liquid chromatography tandem mass spectrometry. Food Addit. Contam. Part A 2017, 34, 2033–2041. [Google Scholar] [CrossRef]
  12. Arroyo-Manzanares, N.; Hamed, A.M.; García-Campaña, A.M.; Gámiz-Gracia, L. Plant-based milks: Unexplored source of emerging mycotoxins. A proposal for the control of enniatins and beauvericin using UHPLC-MS/MS. Food Addit. Contam. Part B 2019, 12, 296–302. [Google Scholar] [CrossRef]
  13. Hamed, A.M.; Abdel-Hamid, M.; Gámiz-Gracia, L.; García-Campaña, A.M.; Arroyo-Manzanares, N. Determination of aflatoxins in plant-based milk and dairy products by dispersive liquid–liquid microextraction and high- performance liquid chromatography with fluorescence detection. Anal. Lett. 2019, 52, 363–372. [Google Scholar] [CrossRef]
  14. Romero-González, R.; Martinez, J.L.; Aguilera-Luiz, M.M.; Garrido, A. Application of Conventional Solid-Phase Extraction for Multimycotoxin Analysis in Beers by Ultrahigh-Performance Liquid Chromatography-Tandem Mass Spectrometry. J. Agric. Food Chem. 2009, 57, 9385–9392. [Google Scholar] [CrossRef]
  15. Mariño-Repizo, L.; Kero, F.; Vandell, V.; Senior, A.; Sanz-Ferramola, M.I.; Cerutti, S.; Raba, J. A novel solid phase extraction-Ultra high performance liquid chromatography–tandem mass spectrometry method for the quantification of ochratoxin A in red wines. Food Chem. 2015, 172, 663–668. [Google Scholar] [CrossRef]
  16. Delgado, T.; Gómez-Cordovés, C.; Scott, P.M. Determination of alternariol and alternariol methyl ether in apple juice using solid-phase extraction and high performance liquid chromatography. J. Chromatogr. A 1996, 731, 109–114. [Google Scholar] [CrossRef]
  17. Vendl, O.; Berthiller, F.; Crews, C.; Krska, R. Simultaneous determination of deoxynivalenol, zearalenone, and their major masked metabolites in cereal-based food by LC-MS-MS. Anal. Bioanal. Chem. 2009, 395, 1347–1354. [Google Scholar] [CrossRef]
  18. García-Moraleja, A.; Font, G.; Mañes, J.; Ferrer, E. Simultaneous determination of mycotoxin in commercial coffee. Food Control 2015, 57, 282–292. [Google Scholar] [CrossRef]
  19. Piacentini, K.C.; Rocha, L.O.; Fontes, L.C.; Carnielli, L.; Reis, T.A.; Corrêa, B. Mycotoxin analysis of industrial beers from Brazil: The influence of fumonisin B1 and deoxynivalenol in beer quality. Food Chem. 2017, 218, 64–69. [Google Scholar] [CrossRef]
  20. Juan, C.; Oueslati, S.; Mañes, J.; Berrada, H. Multimycotoxin Determination in Tunisian Farm Animal Feed. J. Food Sci. 2019, 84, 3885–3893. [Google Scholar] [CrossRef]
  21. Commission Decision No. 2002/657/EC of August 12, 2002 applying Council Directive 96/23/EC regarding the operation of analytical methods and the interpretation of results. Off. J. Eur. Communities 2002, L221, 8–39.
  22. Commission Recommendation No. 2013/165/EU of 27 March 2013 on the presence of T-2 and HT-2 toxin in cereals and cereal products. Off. J. Eur. Union 2013, L91, 12–15.
  23. Commission Regulation (EC) No. 1881/2006 of 19 December 2006 setting maximum levels for certain contaminants in foodstuffs (including amendments as of 01 September 2014). Off. J. Eur. Union 2006, L364, 5–24.
  24. Juan, C.; Ritieni, A.; Mañes, J. Occurrence of Fusarium mycotoxins in Italian cereal and cereal products from organic farming. Food Chem. 2013, 141, 1747–1755. [Google Scholar] [CrossRef]
  25. Juan, C.; Raiola, A.; Mañes, J.; Ritieni, A. Presence of mycotoxin in commercial infant formulas and baby foods from Italian market. Food Control 2014, 39, 227–236. [Google Scholar] [CrossRef]
  26. Juan-García, A.; Juan, C.; Manyes, L.; Ruiz, M.-J. Binary and tertiary combination of alternariol, 3-acetyl-deoxynivalenol and 15-acetyl-deoxynivalenol on HepG2 cells: Toxic effects and evaluation of degradation products. Toxicol. In Vitro 2016, 34, 264–273. [Google Scholar] [CrossRef]
  27. Zouaoui, N.; Mallebrera, B.; Berrada, H.; Abid-Essefi, S.; Ruiz, M.J. Cytotoxic effects induced by patulin, sterigmatocystin and beauvericin on CHO–K1 cells. Food Chem. Toxicol. 2016, 89, 92–103. [Google Scholar] [CrossRef]
  28. Stanciu, O.; Juan, C.; Miere, D.; Loghin, F.; Mañes, J. Presence of Enniatins and Beauvericin in Romanian Wheat Samples: From Raw Material to Products for Direct Human Consumption. Toxins 2017, 9, 189. [Google Scholar] [CrossRef] [Green Version]
  29. Juan, C.; Berrada, H.; Mañes, J.; Oueslati, S. Multi-mycotoxin determination in barley and derived products from Tunisia and estimation of their dietary intake. Food Chem. Toxicol. 2016, 89, 92–103. [Google Scholar] [CrossRef]
  30. El-Badry, S. Determination of ochratoxin A residues in some animal and plant milk products. Zagazig Vet. J. 2016, 44, 101–105. [Google Scholar] [CrossRef] [Green Version]
  31. Roselló-Soto, E.; García, C.; Fessard, A.; Barba, F.J.; Munekata, P.E.S.; Lorenzo, J.M.; Remize, F. Nutritional and microbiological quality of tiger nut tubers (Cyperus esculentus) derived plant-based and lactic fermented beverages. Fermentation 2018, 5, 3. [Google Scholar] [CrossRef] [Green Version]
  32. Sebastia, N.; Soler, C.; Soriano, J.M.; Mañes, J. Occurrence of aflatoxins in tigernuts and their beverages commercialized in Spain. J. Agric. Food Chem. 2010, 58, 2609–2612. [Google Scholar] [CrossRef]
  33. Rubert, J.; Sebastia, N.; Soriano, J.M.; Soler, C.; Mañes, J. One-year monitoring of aflatoxins and ochratoxin A in tiger-nuts and their beverages. Food Chem. 2011, 127, 822–826. [Google Scholar] [CrossRef] [PubMed]
Figure 1. Chromatograms of a standard solution containing the 16 mycotoxins analyzed by LC-MS/MS.
Applsci 12 03942 g001
Figure 2. Chromatograms ENA, ENA1, ENB, ENB1 and ZEA standard solution (STD) and matrix of almonds, oats, rice and soy.
Applsci 12 03942 g002
Figure 3. Average matrix effect (a) and matrix effect (b) for each mycotoxin of each studied matrices.
Applsci 12 03942 g003
Figure 4. Reproducibility results: (a) average reproducibility results (n = 9) of the four matrices at the three levels studied (L1, L2 and L3); (b) recoveries obtained from the reproducibility study (n = 9) at the L1 level for the four matrices.
Applsci 12 03942 g004aApplsci 12 03942 g004b
Figure 5. Recoveries obtained from the repeatability study (n = 3) at the L1 level for the four matrices.
Applsci 12 03942 g005
Figure 6. Distribution of the mycotoxins analyzed in the four types of drinks analyzed and in the total samples analyzed (n = 56).
Applsci 12 03942 g006aApplsci 12 03942 g006b
Table 1. SPE methods used in different studies for the extraction of mycotoxins in different liquid matrices.
AnalytesMatrixSPE Extraction TechniqueReferences
AOH, AMEApple juiceSPE C18 cartridges[16]
DON, ZEACereal-based foodsSPE C18 cartridges
Oasis HLB
[17]
21 mycotoxins: OTA, AFs (AFB1, AFB2, AFG1, AFG2) NIV, STG, DON, 3AcDON,
15AcDON, NEO, HT-2, T-2, FB1, FB2, ENA, ENA1, ENB, ENB1, BEA
Coffee drinksSPE C18 cartridges[18]
OTARed wineSPE C18 cartridges[15]
Table 2. MS/MS detection parameters for the analysis of the studied mycotoxins.
AnalyteMS/MS Detection Parameters
Precursor Ion
Q1 (m/z)
Product Ion Q3 (m/z)DP
(V)
CEP
(V)
EC
(V)
CXP
(V)
HT-2442.2
[M + NH4] +
262.8 Q
215.4
212219
19
4
8
T-2484.3
[M + NH4] +
185.1 Q
215.1
212322
29
4
4
ZEA319.0
[M + H] +
301.0 Q
282.9
261815
19
10
4
BEA801.2
[M + NH4] +
784.1 Q
244.1
1163327
39
10
6
ENA699.4
[M + NH4] +
210.1 Q
228.2
763035
59
14
16
ENA1685.4
[M + NH4] +
210.2 Q
214.2
662937
59
8
10
ENB657.3
[M + NH4] +
196.1 Q
214.0
512839
59
8
10
ENB1671.2
[M + NH4] +
214.1 Q
228.1
662961
57
10
12
AF B1313.1
[M + H] +
284.9 Q
241.1
461839
41
4
4
AF B2315.1
[M + H] +
286.9 Q
259.6
811833
39
6
6
AF G1329.1
[M + H] +
243.1 Q
311.1
761839
29
6
6
AF G2329.1
[M + H] +
313.1 Q
245.1
611827
39
6
6
OTA404.1
[M + H] +
239.0 Q
102.1
552127
97
6
6
AME273
[M + H] +
128 Q
228
321660
40
3
3
AOH259
[M + H] +
128 Q
184
391765
42
13
13
TENT415
[M + H] +
312 Q
256
552129
39
2
2
Q: quantification ion; decluster potential (DP); collision energy (CE); collision cell input potential (CEP); collision cell output potentials (CXPs) are expressed in voltage.
Table 3. Limits of quantification (LQ) and of detection (LD) in the four matrices studied, as well as the maximum limits and recommended values established in the EU.
MycotoxinMaximum Limits * (ng/g)OATALMONDRICESOY
LQ (ng/mL)LD (ng/mL)LQ (ng/mL)LD (ng/mL)LQ (ng/mL)LD (ng/mL)LQ (ng/mL)LD (ng/mL)
HT-2* Sum HT-2 + T-2: 50 a5.31.17.31.518.03.66.51.3
T-24.20.85.81.214.22.85.11.0
ZEA20 b0.70.10.90.22.30.50.80.2
AFB18 c; 2 b0.30.10.50.11.10.20.40.1
AFB2Sum AFs: 10 c; 4 b0.30.10.50.11.10.20.40.1
AFG10.30.10.50.11.10.20.40.1
AFG20.30.10.50.11.10.20.40.1
OTA3 d,e2.00.42.80.62.61.11.60.3
BEA-1.00.21.40.33.40.71.20.2
ENA-1.00.21.40.33.40.71.20.2
ENA1-1.00.21.40.33.40.71.20.2
ENB-1.00.21.40.33.40.71.20.2
ENB1-1.00.21.40.33.40.71.20.2
AOH-2.30.52.80.67.91.62.90.6
AME-2.30.54.60.96.81.42.50.5
TENT-1.00.21.40.33.40.71.20.2
* Indicative levels for the sum of HT-2 and T-2 [22]. a Indicative or recommended levels in cereal-based products for human consumption obtained from the milling of cereals [22]. b Cereal products for human consumption [23]. c Almonds, pistachios and apricot kernels intended for direct human consumption or used as ingredients in food products. d All cereals and all cereal-based products, including processed cereal products [22]. e All products derived from unprocessed cereals, including processed cereal-based products and cereals intended for direct human consumption [23].
Table 4. Mean of total samples (ng/mL), mean of positive samples (ng/mL) and maximum levels (ng/mL) of detected mycotoxins in analyzed samples.
MycotoxinOat Beverages
(n = 17)
Almond Beverages
(n = 11)
Rice Beverages
(n = 10)
Soy Beverages
(n = 18)
Total Beverages
(n = 56)
MMpMxMMpMxMMpMxMMpMxMMpMx
HT-22.68 ± 5.39.10 ± 0.810.210.33 ± 2.33.603.60n.d.n.d.n.d.4.56 ± 5582.0982.092.34 ± 5629.86 ± 3782.09
T-20.49 ± 2.94.18 ± 0.34.550.20 ± 1.42.202.20n.d.n.d.n.d.n.d.n.d.n.d.0.19 ± 31.70 ± 24.55
ZEA0.33 ± 3.85.685.680.57 ± 1.83.133.176.24 ± 8.415.61 ± 1.818.141.80 ± 6.510.79 ± 0.211.021.91 ± 128.59 ± 718.14
AFB1n.d.n.d.n.d.n.d.n.d.n.d.n.d.n.d.n.d.n.d.n.d.n.d.n.d.n.d.n.d.
AFB2n.d.n.d.n.d.0.07 ± 0.40.70.7n.d.n.d.n.d.n.d.n.d.n.d.n.d.0.14 ± 040.7
AFG10.01 ± 0.10.100.10n.d.n.d.n.d.n.d.n.d.n.d.n.d.n.d.n.d.n.d.0.03 ± 0.050.10
AFG2n.d.n.d.n.d.n.d.n.d.n.d.n.d.n.d.n.d.n.d.n.d.n.d.n.d.n.d.n.d.
OTAn.d.n.d.n.d.n.d.n.d.n.d.n.d.n.d.n.d.n.d.n.d.n.d.n.d.n.d.n.d.
BEA1.19 ± 0.71.35 ± 0.52.120.15 ± 11.601.600.50 ± 1.21.67 ± 0.352.170.30 ± 1.11.81 ± 0.011.820.58 ± 1.11.60 ± 042.17
ENA0.08 ± 040.650.650.37 ± 1.32.01 ± 0.22.250.00n.d.0.000.00n.d.0.000.09 ± 1.50.59 ± 1.22.25
ENA11.67 ± 2.42.59 ± 1.75.020.47 ± 2.32.57 ± 0.83.660.00n.d.0.000.30 ± 1.72.742.740.70 ± 32.17 ± 25.02
ENB2.83 ± 2.63.21 ± 2.36.5210.1 ± 6955.42 ± 37108.850.82 ± 2.54.08 ± 0.164.301.52 ± 1.72.29 ± 1.143.903.47 ± 7413.33 ± 68108.85
ENB11.02 ± 3.91.16 ± 3.86.525.79 ± 3815.92 ± 3160.030.17 ± 1.10.83 ± 0.61.650.72 ± 1.32.59 ± 0.022.621.71 ± 414.46 ± 3960.03
AOH0.16 ± 0.80.70 ± 0.51.35n.d.n.d.n.d.n.d.n.d.n.d.n.d.n.d.n.d.0.05 ± 0.90.21 ± 0.81.35
AMEn.d.n.d.n.d.n.d.n.d.n.d.n.d.n.d.n.d.n.d.n.d.n.d.n.d.n.d.n.d.
TENT2.93 ± 1916.62 ± 1030.6015.1 ± 5982.81 ± 1198.08n.d.n.d.n.d.n.d.n.d.n.d.3.85 ± 6721.30 ± 5498.08
n.d.: non detect; M: mean; Mp: mean positive; Mx: maximum.
Table 5. Combinations of the co-present mycotoxins. the number of samples containing these combinations is indicated in parentheses.
Combinations of Mycotoxins Present in the Same Sample (Incidence)
2 Mycotoxins3 Mycotoxins4 Mycotoxins>5 Mycotoxins
TENT + ZEAENA1 + B + B1 (3)BEA + ENA1 + B + B1 (3)BEA + ENA + A1 + B + B1 + HT-2 + TENT + ZEA
ENB + HT2ENB + B1 + ZEABEA + AOH + ENB + B1BEA+ EN A1 + B + B2 + HT-2 + TENT
ENB + B1BEA + ENB + ZEABEA + ENA1 + B + B1 (2)BEA + AOH + ENA + A1 + B + B1 + HT-2 + TENT
ENB + ZEABEA + EN B + B1 BEA + ENA1 + B + B1 + HT-2 + T-2 + TENT + ZEA
ENB1 + ZEABEA + ENB + ZEA BEA + ENA + A1 + B + B1 + HT-2
BEA + ENB + B1 (3)
BEA + ENA1 + B
Publisher’s Note: MDPI stays neutral with regard to jurisdictional claims in published maps and institutional affiliations.

