Article

A Deterministic Methodology Using Smart Card Data for Prediction of Ridership on Public Transport

Department of Geoinformatics, University of Seoul, 163 Seoulsiripdaero, Dongdaemun-gu, Seoul 02504, Korea
*
Author to whom correspondence should be addressed.
Appl. Sci. 2022, 12(8), 3867; https://doi.org/10.3390/app12083867
Submission received: 31 March 2022 / Accepted: 8 April 2022 / Published: 11 April 2022
(This article belongs to the Topic Intelligent Transportation Systems)

Abstract

:
In the present study, we propose a methodology that predicts the number of passengers on new public transport lines based on smart card data and an optimal path finding algorithm. It employs a deterministic approach that assumes that, when a new line is added to the public transport network, passengers choose the fastest route to their destination. The proposed methodology is applied to actual lines (bus and subway lines) in Seoul, the capital of South Korea, and it is validated through the observed traffic volume of those lines recorded in the smart card data. The experiments are conducted using smart card data, with more than 100 million trips stored, extracted from about 1 million passengers who have check-in records in the catchment area of the new lines. The experimental results show that the proposed methodology predicts the daily average number of passengers very similar to the observed data.

1. Introduction

Automated fare collection (AFC) systems using smart cards are used for public transport in many countries [1]. In South Korea and Australia, entry–exit AFC systems are in operation, and they require users to tap a smart card at the beginning and end of their trip [2,3]. The public transport agency of Seoul city collects an average of 9.25 million smart card data per day, and more than 3.4 billion trip records are stored in the database annually. In Seoul, about 99% of public transport passengers use smart cards. Therefore, data from almost all passengers are collected in real time.
Smart card big data can provide more valuable insights than traditional surveys because it contains detailed travel records of passengers, such as their origin (O), destination (D), travel time, lines, and vehicles [4,5]. The station-to-station data of each individual provide opportunities to conduct more microscopic research. As a result, various studies have been conducted, including analysis of travel patterns [6,7], behavioral models such as mode or route choice [8,9,10], estimation of the O-D matrix [11,12], and spatiotemporal dynamics [13,14]. Moreover, high-quality data play a major role in improving public transport systems by making them more user friendly for stakeholders.
The route choice model is important in public transport planning because it is used to predict ridership on new lines. Most related studies have described route choice behavior through logit models based on stochastic methodologies [15,16,17]. The stated preference (SP) is a survey that collects individuals’ opinions on the conditions of use assuming the introduction of new modes or lines of public transport. The SP survey is a key tool to model the utility function of choice, representing passengers’ decisions when facing different alternatives [18]. Generally, the utility function consists of factors such as in-vehicle time, fare, headway, number of transfers, and comfort (congestion) [19].
Van Oort et al., (2015a) predicted future demand using an elasticity model that considers comfort based on the current demand derived from smart card data [20]. This methodology was developed as short-term transport planning software to perform visualization and what-if analysis, and it was applied to a case study in The Hague, the Netherlands [21]. Xue et al., (2015) proposed short-term bus passenger demand prediction using a time-series model based on smart card data [22]. Menon and Lee (2017) showed how short-term demand can be accurately modeled with a neural network [23]. Santanam et al., (2021) proposed a data-based approach that exploits AFC to predict the demand for trains when special events, such as sport games and concerts, occur [24].
However, although various studies dealing with short-term public transport demand forecasting have been conducted [25,26], empirical studies that predict the number of passengers on actual new lines and that compare this number with observations are insufficient. Most of the related models were verified based on scenarios in which network changes were not considered. Updating a public transport network, such as adding new lines, can cause a large dispersion of overall demand. Therefore, it is very important to model the short-term ridership forecasting of new lines in order to obtain validation scenarios that reflect similar conditions. In addition, a model considering the trade-off relationship or relative weights between variables with different units, such as time, price, and comfort, or based on an SP survey has limitations in describing real-world situations.
In this study, a methodology that predicts ridership on new public transport lines using smart card data is proposed. The proposed methodology assumes that, when a new line is added to a public transport network, passengers choose the fastest route to their destination [27]. In the updated network, passengers’ new routes are computed using the optimal path finding algorithm. The path finding algorithm receives the card usage records of passengers before the network is updated and assigns individual passengers to the optimal path on the updated network. That is, the proposed methodology predicts the number of passengers on a new line based on the deterministic approach. Above all, this study is different from related studies in that it predicts the ridership for actual new lines in Seoul city and compares them with the observations from the smart card data.

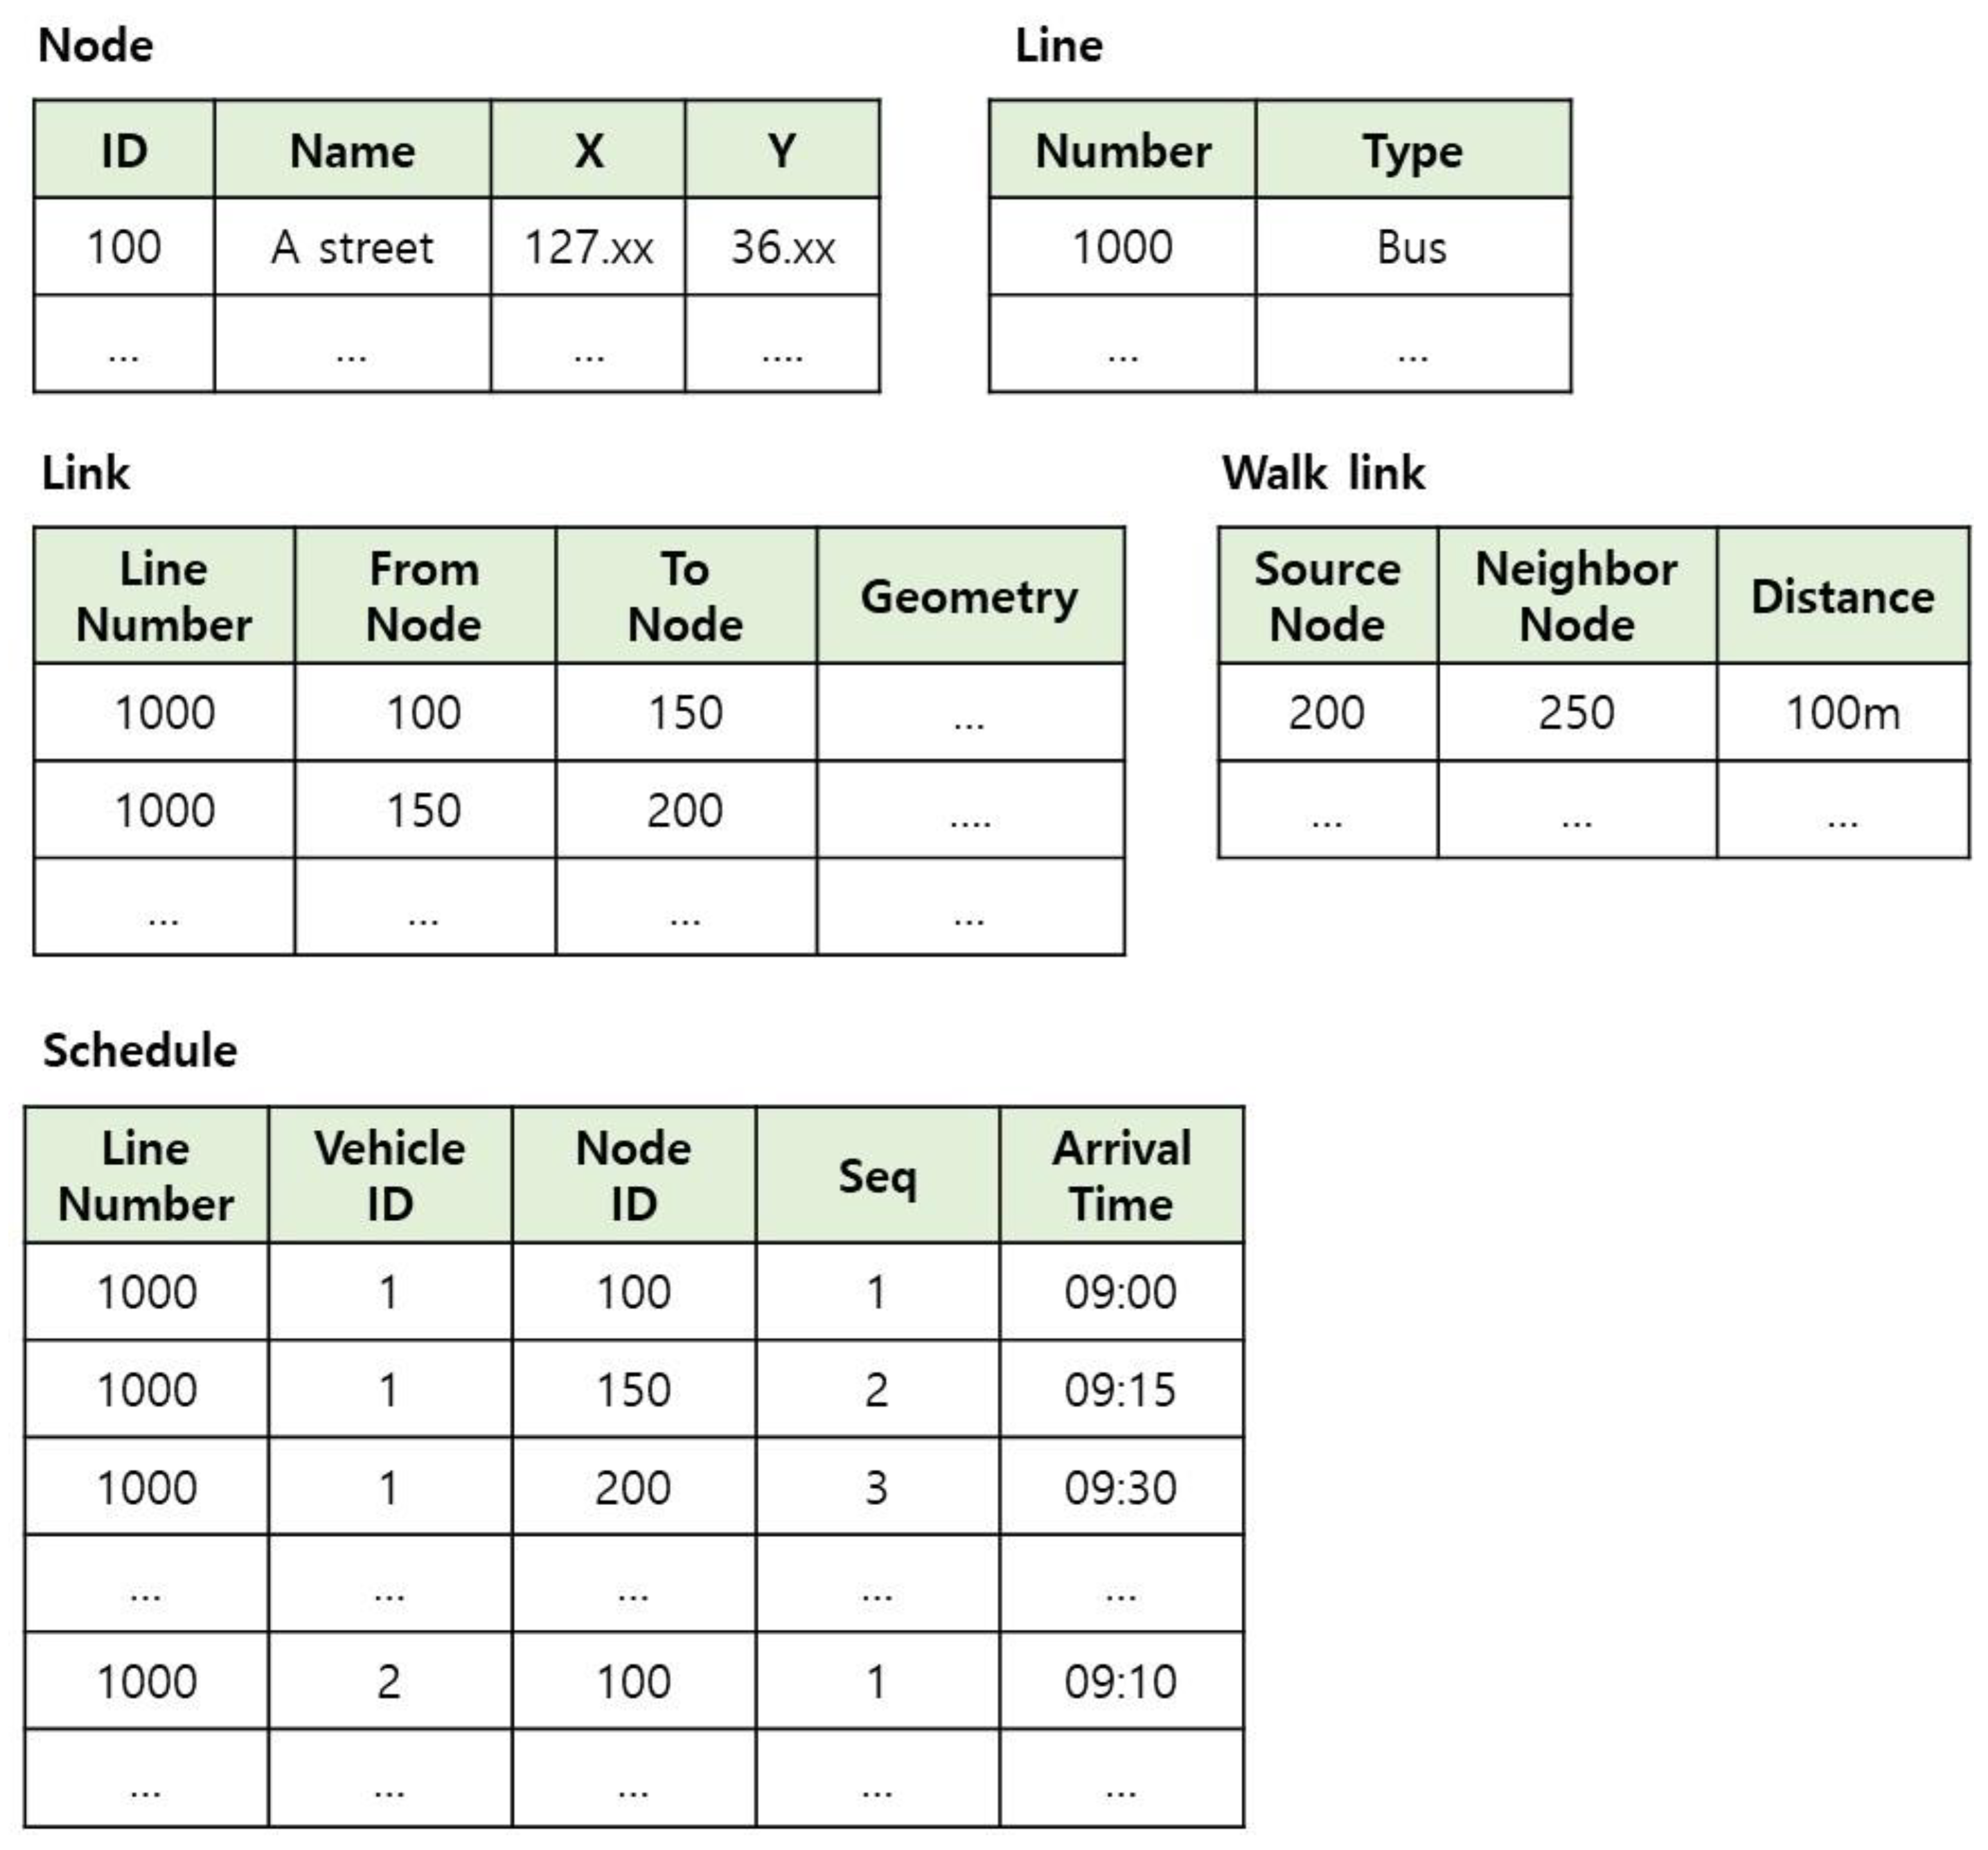
2. Smart Card Data and Public Transport Network

The prediction of ridership on a new line requires a spatiotemporal analysis using both smart card data and the public transport network. The smart card data of Seoul city records O-D nodes (bus stop or subway station); times of check in/out; line and vehicle number; and card type, such as teenager, adult, or senior. Some examples are listed in Table 1. The card ID represents an anonymous individual. An individual’s journey to their final destination is completed by connecting the continuous trips of the same card ID.
In the examples, passengers 2 and 3 transferred once, and passenger 3 transferred at another nearby stop. Passengers 1 and 2 used the same line at different times. This allows the headway of that line to be inferred. Passengers 2 and 3 were on the same vehicle and moved to node 200. This allows the occupancy and congestion of that vehicle to be computed.
The public transport network consists of nodes, lines, links, schedules, and walk links. Figure 1 is a simple example of a network, and Figure 2 shows the data tables of the given network. The link consists of two nodes and represents the directionality of the line containing that link. The walk link is necessary to describe the walking behavior for transfers. Based on studies of catchment areas [28], neighboring nodes within 500 m of each node are connected by walk links. The schedule indicates the time when the vehicles of each line arrive at node.

3. Methodology

When a new line is added to a public transport network, candidates affected by the new line are extracted from the smart card data. The candidates represent potential users of the new line. Then, in the updated network, a search is performed for the optimal route of each candidate. Among the candidates, passengers with the new line included in their optimal route become users of the new line.
Figure 3 shows the updated public transport network and part of the schedule table. The star-shaped nodes represent nodes included in the catchment area of the new line. These nodes include not only nodes through which the new line passes but also nodes connected to those nodes by walk links. The candidates are determined by extracting passengers with a check-in record from nodes included in the catchment area of the new line from smart card data.
A search is performed for the optimal route of each candidate using the RAPTOR algorithm [29]. The RAPTOR algorithm takes the passenger’s O-D and departure time as inputs, and it searches for a route that takes the minimum travel time. The minimum travel time includes in-vehicle time, waiting time, walking time, and transfer penalties. The transfer penalty is a value converted into time for the psychological resistance caused by the transfer. In the proposed methodology, a penalty of 5 min per transfer [30] is given.
Figure 4 displays an example of allocating the optimal routes to the passengers in Table 1, assuming that line No. 5000 has been added to the public transport network. Passengers 1, 2, and 3 are all included candidates because they have check-in records at the node through which the new line passes. Before the line was added, passenger 2 arrived at node 300 with one transfer. Using the new line, passenger 2 can arrive at their destination 10 min earlier without transferring. Similarly, passenger 3 can arrive 15 min earlier without transferring by walking to node 250. As a result, the ridership on line No. 5000 includes passengers 2 and 3.

4. Prediction

In this study, the number of passengers was predicted for two lines in Seoul city using the proposed methodology. These two lines started operating in August 2018 and October 2017. For this reason, the public transport network and smart card data for September 2017, a period for which there are no usage records for both lines, were used for the experiment. The public transport network includes approximately 11,000 nodes, 620 lines, and schedules for 80,000 vehicles. The smart card data include about 100 million trips recorded over 10 days.
Figure 5 and Figure 6 present maps of the route of bus No. 1167 and Ui-Sinseol subway, respectively, corresponding to the new lines. In the maps, the red point is the node through which the new line passes, and the green point is the node within the catchment area. Passengers on both lines are selected from passengers with a check-in history at nodes within the catchment area. About 1 million candidates were extracted from the smart card data applied in the experiment.
The proposed methodology assumes that passengers will choose the route that reaches their destination the fastest, and it calculates the optimal route using the RAPTOR algorithm. To support this logic, the algorithm must be able to predict the route that the passengers actually select. Therefore, an experiment comparing the routes used by the candidates recorded in the smart card data for September 2017 with the routes determined by the algorithm was performed first.
Figure 7 shows the matching rate relative to the number of transfers on the route. For 483,193 candidates who did not transfer, the algorithm produced the same routes for 404,380 passengers, which corresponded to approximately 84%. For candidates who made a single transfer, the route calculated by the algorithm matched the actual route by about 88%. Although the matching rate decreased with an increase in the number of transfers, the overall matching rate reached approximately 70%.
The ridership numbers on bus No. 1167 and the Ui-Sinseol subway line predicted using September 2017 data were validated using smart card data from April 2019. Figure 8 shows the daily average number of passengers per node for the two lines. Figure 8a shows the observed demand and predicted demand for bus No. 1167, and (b) shows the results for the Ui-Sinseol subway line. The prediction of ridership for both lines was highly accurate.
The observed daily average number of passengers for bus No. 1167 was 1431, and the predicted value using the proposed methodology was 1439. The number of passengers for each node was also similar to the observed value. The largest difference appeared at node No. 8502298, which is located immediately next to a subway station. The observed daily average number of passengers for Ui-Sinseol subway line was 38,036, and the predicted value using the proposed methodology was 37,559. The number of passengers per subway station was underestimated by about 480 compared to the observed value. The largest difference appeared at node No. 4713, which is a complex transfer station with several subway lines.
Figure 9 shows the average number of passengers per hour for each line. The prediction results for ridership per hour on the two lines showed similar patterns to those of the observed values. In particular, the expected values of the subway line showed a slight difference from the observed values, with an average error of 10%. The commuting patterns in which the number of passengers increases during peak hours in the morning and evening were also found in both the predicted and observed values.
Table 2 shows the prediction errors composed of the Mean Absolute Error (MAE) and the Root Mean Squared Error (RMSE) for two scenarios. As of April 2019, the daily average ridership numbers per node of bus No. 1167 and Ui-Sinseol subway line were 33 and 3050, respectively. For both lines, the MAE of the expected demand was found to be about 23% of the average value. The RMSE, sensitive to outliers, showed a value higher than that of the MAE. The average ridership numbers per hour of both lines were 70 and 2000, respectively. The prediction errors by time of the bus line were similar to the results at the node level. In the case of the subway line, compared to the average value, the MAE was 9%, and the RMSE was 13%, which clearly reduced the error compared to the node level.
As explained previously with Figure 8, the prediction error of the daily average number of passengers on each line was very small, about 1%. However, in the analysis results by node and by time period, some differences were revealed due to factors that were not considered in the proposed model, such as subway preference trends (node No. 8502298) and AFC data error of the complex transfer center (node No. 4713).

5. Conclusions

In this study, a deterministic methodology using smart card data and the path finding algorithm was proposed to predict ridership on new bus and subway lines. The proposed methodology was applied to actual public transport lines in Seoul, the capital of South Korea, and it was validated through the observed traffic volume of the lines recorded in the smart card data. The experimental results show that the proposed methodology predicts the daily average number of passengers very similar to the observed data. However, it was found that a more detailed consideration of subway usage preference and transfer behavior was needed in the process of traffic assignment. This study shows that it is possible to predict ridership with high accuracy using the abundant amounts of high-quality data and simple assumptions without the complex modeling of route choice and probabilistic traffic assignment.
However, this study has some drawbacks. The proposed methodology redistributes individual passengers to the updated network considering only the demand derived from the smart card data. It does not take into account passengers who do not use smart cards, pass holders, and potential consumers who do not currently use public transport. This study also assumes that the smart card data do not contain errors. Due to missing records and fare avoidance [31], smart card data can underestimate demand. Therefore, future research considering a methodology that can supplement the fundamental limitations of the AFC system and a methodology that can estimate potential demand other than smart card data is required.

Author Contributions

Writing—review and editing, M.L.; visualization, I.J.; project administration, C.J. All authors have read and agreed to the published version of the manuscript.

Funding

This research was supported by a grant (21NSIP-B135746-05) from the National Spatial Information Research Program funded by the Ministry of Land, Infrastructure and Transport of the Korean government.

Institutional Review Board Statement

Not applicable.

Informed Consent Statement

Not applicable.

Data Availability Statement

Not applicable.

Conflicts of Interest

The authors declare no conflict of interest.

References

  1. Li, T.; Sun, D.; Jing, P.; Yang, K. Smart card data mining of public transport destination: A literature review. Information 2018, 9, 18. [Google Scholar] [CrossRef] [Green Version]
  2. Kieu, L.M.; Bhaskar, A.; Chung, E. A modified density-based scanning algorithm with noise for spatial travel pattern analysis from smart card AFC data. Transp. Res. Part C Emerg. Technol. 2015, 58, 193–207. [Google Scholar] [CrossRef]
  3. Han, G.; Sohn, K. Activity imputation for trip-chains elicited from smart-card data using a continuous hidden Markov model. Transp. Res. Part B Methodol. 2016, 83, 121–135. [Google Scholar] [CrossRef]
  4. Bagchi, M.; White, P.R. The potential of public transport smart card data. Transp. Policy 2005, 125, 464–474. [Google Scholar] [CrossRef]
  5. Pelletier, M.P.; Trépanier, M.; Morency, C. Smart card data use in public transit: A literature review. Transp. Res. Part C Emerg. Technol. 2011, 19, 557–568. [Google Scholar] [CrossRef]
  6. Ma, X.; Wu, Y.J.; Wang, Y.; Chen, F.; Liu, J. Mining smart card data for transit riders’ travel patterns. Transp. Res. Part C Emerg. Technol. 2013, 36, 1–12. [Google Scholar] [CrossRef]
  7. Zhao, J.; Qu, Q.; Zhang, F.; Xu, C.; Liu, S. Spatio-temporal analysis of passenger travel patterns in massive smart card data. IEEE Trans. Intell. Transp. Syst. 2017, 18, 3135–3146. [Google Scholar] [CrossRef]
  8. Agard, B.; Morency, C.; Trépanier, M. Mining public transport user behaviour from smart card data. IFAC Proc. Vol. 2006, 39, 399–404. [Google Scholar] [CrossRef]
  9. Munizaga, M.; Devillaine, F.; Navarrete, C.; Silva, D. Validating travel behavior estimated from smartcard data. Transp. Res. Part C Emerg. Technol. 2014, 44, 70–79. [Google Scholar] [CrossRef]
  10. Ali, A.; Kim, J.; Lee, S. Travel behavior analysis using smart card data. KSCE J. Civ. Eng. 2016, 20, 1532–1539. [Google Scholar] [CrossRef]
  11. Munizaga, M.A.; Palma, C. Estimation of a disaggregate multimodal public transport Origin–Destination matrix from passive smartcard data from Santiago, Chile. Transp. Res. Part C Emerg. Technol. 2012, 24, 9–18. [Google Scholar] [CrossRef]
  12. Alsger, A.A.; Mesbah, M.; Ferreira, L.; Safi, H. Use of smart card fare data to estimate public transport origin–destination matrix. Transp. Res. Rec. 2015, 2535, 88–96. [Google Scholar] [CrossRef]
  13. Tao, S.; Rohde, D.; Corcoran, J. Examining the spatial–temporal dynamics of bus passenger travel behaviour using smart card data and the flow-comap. J. Transp. Geogr. 2014, 41, 21–36. [Google Scholar] [CrossRef]
  14. Kim, M.K.; Kim, S.; Sohn, H.G. Relationship between spatio-temporal travel patterns derived from smart-card data and local environmental characteristics of Seoul, Korea. Sustainability 2018, 10, 787. [Google Scholar] [CrossRef] [Green Version]
  15. Zhao, J.; Zhang, F.; Tu, L.; Xu, C.; Shen, D.; Tian, C.; Li, Z. Estimation of passenger route choice pattern using smart card data for complex metro systems. IEEE Trans. Intell. Transp. Syst. 2016, 18, 790–801. [Google Scholar] [CrossRef]
  16. Anderson, M.K.; Nielsen, O.A.; Prato, C.G. Multimodal route choice models of public transport passengers in the Greater Copenhagen Area. EURO J. Transp. Logist. 2017, 6, 221–245. [Google Scholar] [CrossRef]
  17. Kim, J.; Corcoran, J.; Papamanolis, M. Route choice stickiness of public transport passengers: Measuring habitual bus ridership behaviour using smart card data. Transp. Res. Part C Emerg. Technol. 2017, 83, 146–164. [Google Scholar] [CrossRef]
  18. Cascajo, R.; Garcia-Martinez, A.; Monzon, A. Stated preference survey for estimating passenger transfer penalties: Design and application to Madrid. Eur. Transp. Res. Rev. 2017, 9, 1–11. [Google Scholar] [CrossRef] [Green Version]
  19. Nielsen, O.A. A stochastic transit assignment model considering differences in passengers utility functions. Transp. Res. Part B Methodol. 2000, 34, 377–402. [Google Scholar] [CrossRef]
  20. van Oort, N.; Drost, M.; Brands, T.; Yap, M. Data-driven public transport ridership prediction approach including comfort aspects. In Proceedings of the 13th Conference on Advanced Systems in Public Transport Conference, Rotterdam, The Netherlands, 20 July 2015. [Google Scholar]
  21. van Oort, N.; Brands, T.; de Romph, E. Short-term prediction of ridership on public transport with smart card data. Transp. Res. Rec. 2015, 2535, 105–111. [Google Scholar] [CrossRef]
  22. Xue, R.; Sun, D.J.; Chen, S. Short-term bus passenger demand prediction based on time series model and interactive multiple model approach. Discret. Dyn. Nat. Soc. 2015, 2015, 682390. [Google Scholar] [CrossRef] [Green Version]
  23. Menon, A.K.; Lee, Y. Predicting short-term public transport demand via inhomogeneous Poisson processes. In Proceedings of the 2017 ACM on Conference on Information and Knowledge Management, Singapore, 6–10 November 2017; pp. 2207–2210. [Google Scholar]
  24. Santanam, T.; Trasatti, A.; Van Hentenryck, P.; Zhang, H. Public Transit for Special Events: Ridership Prediction and Train Optimization. arXiv 2021, arXiv:2106.05359. [Google Scholar]
  25. Lawson, C.T.; Muro, A.; Krans, E. Forecasting bus ridership using a “Blended Approach”. Transportation 2021, 48, 617–641. [Google Scholar] [CrossRef] [Green Version]
  26. Patel, Y.; Firat, C.; Childers, T.; Sartipi, M. Ridership Prediction of New Bus Routes at Stop Level by Modelling Socio-economic Data using Supervised Machine Learning Methods. In Proceedings of the Transportation Research Board 100th Annual Meeting, Washington, DC, USA, 5–29 January 2021. [Google Scholar]
  27. Spiess, H.; Florian, M. Optimal strategies: A new assignment model for transit networks. Transp. Res. Part B Methodol. 1989, 23, 83–102. [Google Scholar] [CrossRef]
  28. Andersen, J.L.E.; Landex, A. Catchment areas for public transport. WIT Trans. Built Environ. 2008, 101, 175–184. [Google Scholar]
  29. Delling, D.; Pajor, T.; Werneck, R.F. Round-based public transit routing. Transp. Sci. 2015, 49, 591–604. [Google Scholar] [CrossRef] [Green Version]
  30. Jeon, I.; Nam, H.; Jun, C. A schedule-based public transit routing algorithm for finding K-shortest paths considering transfer penalties. J. Korea Inst. Intell. Transp. Syst. 2018, 17, 72–86. [Google Scholar] [CrossRef]
  31. Barabino, B.; Lai, C.; Olivo, A. Fare evasion in public transport systems: A review of the literature. Public Transp. 2020, 12, 27–88. [Google Scholar] [CrossRef]
Figure 1. An example of a simple network.
Applsci 12 03867 g001
Figure 2. Data tables of a public transport network.
Applsci 12 03867 g002
Figure 3. An example of an updated network: (a) before; (b) after.
Applsci 12 03867 g003
Figure 4. Example of optimal route allocation after adding a new line: (a) before; (b) after.
Applsci 12 03867 g004aApplsci 12 03867 g004b
Figure 5. Map of route of bus No. 1167.
Applsci 12 03867 g005
Figure 6. Map of Ui-Sinseol subway line.
Applsci 12 03867 g006
Figure 7. Matching rate by number of transfers on the route.
Applsci 12 03867 g007
Figure 8. Daily average number of passengers per node: (a) bus No. 1167; (b) Ui-Sinseol subway line.
Applsci 12 03867 g008
Figure 9. Average number of passengers per hour: (a) bus No. 1167; (b) Ui-Sinseol subway line.
Applsci 12 03867 g009
Table 1. Seoul smart card data sample.
Card
ID
Departure
Node
Arrival
Node
Departure
Time
Arrival
Time
Line
Number
Vehicle
ID
Card
Type
110020009:0009:3010001Senior
210020009:1009:4010002Teenager
220030009:4510:0515005Teenager
310020009:1009:4010002Adult
325035009:5010:20200010Adult
Table 2. Prediction errors of two scenarios.
ScenarioDaily Average Ridership per NodeAverage Ridership per Hour
MAERMSEMAERMSE
Bus No. 11678.413.718.622.7
Ui-Sinseol subway line682.61080.3190.8264.1
Publisher’s Note: MDPI stays neutral with regard to jurisdictional claims in published maps and institutional affiliations.

