Article

Traditional Grain-Based vs. Commercial Milk Kefirs, How Different Are They?

1
Bioprocess Engineering, Institute of Biotechnology, Technische Universität Berlin, 13355 Berlin, Germany
2
Institute for Instrumental Analytics and Bioanalytics, Mannheim University of Applied Sciences, 68163 Mannheim, Germany
3
German Rheumatism Research Center Berlin, A Leibniz Institute—DRFZ, Schwiete Laboratory for Microbiota and Inflammation, 10117 Berlin, Germany
4
Chair of Cytometry, Institute of Biotechnology, Technische Universität Berlin, 10623 Berlin, Germany
5
Department of Applied Biochemistry, Institute of Biotechnology, Technische Universität Berlin, 13355 Berlin, Germany
*
Author to whom correspondence should be addressed.
Appl. Sci. 2022, 12(8), 3838; https://doi.org/10.3390/app12083838
Submission received: 22 February 2022 / Revised: 4 April 2022 / Accepted: 6 April 2022 / Published: 11 April 2022
(This article belongs to the Special Issue Novel Research on Microbial Communities in the Food Chain)

Abstract

:
Traditional kefir, which is claimed for health-promoting properties, is made from natural grain-based kefir, while commercial kefirs are made of defined mixtures of microorganisms. Here, approaches are described how to discriminate commercial and traditional kefirs. These two groups of kefirs were characterized by in-depth analysis on the taxonomic and functional level. Cultivation-independent targeted qPCR as well as next-generation sequencing (NGS) proved a completely different microbial composition in traditional and commercial kefirs. While in the traditional kefirs, Lactobacillus kefiranofaciens was the dominant bacterial species, commercial kefirs were dominated by Lactococcus lactis. Volatile organic compounds (VOCs) analysis using headspace-gas chromatography-ion mobility spectrometry also revealed drastic differences between commercial and traditional kefirs; the former built a separate cluster together with yogurt samples. Lactose and galactose concentrations in commercial kefirs were considerably higher than in traditional kefirs, which is important regarding their health properties for people who have specific intolerances. In summary, the analyzed commercial kefirs do not resemble the microbial community and metabolite characteristics of traditional grain-based kefir. Thus, they may deliver different functional effects to the consumers, which remain to be examined in future studies.

1. Introduction

People are becoming increasingly aware of the health benefits of fermented food [1]. The growing awareness of the importance of microorganisms and their metabolites (postbiotics) in disease prevention has led to the launch of many different fermented food products and probiotic supplements, which have been commercialized successfully within recent years to meet the high demand [1].
Kefir is traditionally produced by adding kefir grains to fresh milk. The milk is then fermented and acidified within 24 h on average. Kefir grains consist of a range of microorganisms which belong to lactic acid bacteria (LAB), yeast, and acetic acid bacteria that are attached to a cauliflower-shaped structure composed of polysaccharides and proteins [2]. In the last few years, kefir or the microorganisms of its microbial community have been the subject of many studies reviewed in e.g., [2,3]. However, not a specific microbial composition has been assigned to kefir. For example, Kesmen and Kacmaz (2011) were able to identify Lactococcus (L.) lactis, Leuconostoc (L.) mesenteroides, and Lentilactobacillus (L.) kefiri as prevalent bacteria species with culture-dependent methods, while PCR denaturing gradient gel electrophoresis (DGGE) as a culture-independent method identified L. kefiranofaciens and L. lactis as prevalent [4].
Nutritional and medicinal properties of kefir have been in the focus of many scientific studies for decades [5]. During milk fermentation by kefir grains, many functional compounds like bioactive peptides (e.g., with anti-hypertensive, antioxidative, antiallergenic, antitumor, antimicrobial, anti-inflammatory, and cholesterol-lowering activities), antimicrobial compounds (e.g., organic acids, alcohols, carbon dioxides, and bacteriocins) and heteropolysaccharides (e.g., kefiran) with potential prebiotic activity are formed [6].
Due to the complexity of grains and subsequent limitations on the shelf-life of the product, however, today’s commercial kefirs are produced with artificial microbial mixtures. Kefir is one of the very popular fermented dairy products, and several well-known starter culture producers and many dairy product manufacturers have entered this market [6]. Commercial kefir producers point to the health benefits of traditional grain-based kefir to expand the commercial market [7]. Therefore, it is important to examine whether the commercial products resemble the traditional grain-based kefirs. To answer this question, microbial community analysis (using quantitative PCR (qPCR) and next generation sequencing (NGS) techniques), volatile organic compounds (VOCs) assessment, and targeted metabolite measurement was applied in this study in order to investigate the differences between traditional and commercial kefirs and to evaluate their probiotic capacity.

2. Materials and Methods

2.1. Preparation of Kefir Samples and Commercial Kefirs

The five traditional kefirs (PN1, PN2, PN3, FN, and LS) used in this study were from Berlin, Germany, and have been propagated by three different households. Kefirs FN and LS were originated from PN kefir and were propagated separately for three years. Kefirs PN1, PN2, and PN3 were propagated in one household as different batches for at least three years. For sub-culturing, grains (10% w/v) were inoculated into UHT-sterilized cow milk (1.5% fat, Alnatura, Germany) followed by incubation at 25 °C for 47 ± 1 h [8]. Kefir preparation was performed three times, each time two months apart. Commercial kefirs from three different producers, CK1; Mark Brandenburg (ODW Frischprodukte, Elsterwerda, Germany), CK2; Kalinka Müller (Molkerei Alois Müller, Fischach-Aretsried, Germany) and CK3; Andechser Natur (Andechser Molkerei Scheitz, Andechs, Germany) were purchased from local supermarkets and used for analysis during their shelf-life. In addition, as a reference in VOCs analysis, yogurt samples (CY1; Andechser Natur 1.8% fat, and CY2; Söbbeke Natur (Söbbeke Pauls Biomolkerei, Germany), 1.5% fat) were applied.

2.2. Cultivation-Independent Analysis of Microbial Composition of Kefirs

DNeasy PowerSoil Pro (Qiagen, Hilden, Germany) was used to extract microbial DNA from all kefirs in both grain and beverage fractions after 47 ± 1 h of milk fermentation. To extract DNA from grains, three grams of grains were washed 3 times with pre-sterilized 0.85% NaCl solution each by stirring for 30 min [9]. 0.25 g of sample material were applied to DNA extraction. For extraction of DNA from the beverage part, one mL of commercial kefirs or grain-free traditional kefirs was used to extract the DNA according to the manufacturer. Quality and concentration of extracted gDNA was measured with a NanoDrop ND-1000 spectrophotometer (Peqlab Biotechnologie, Erlangen, Germany). Extracted DNA was applied for the quantification of specific microbial community members using the following techniques:

2.2.1. qPCR

Eleven bacteria and yeast species were quantified in all kefirs by applying qPCR as described previously [9].

2.2.2. NGS

For the identification of all bacterial and all yeast species, the bacterial 16 S gene and the fungal internal transcribed spacer (ITS) regions were analyzed. Barcoded bacterial primers (27 F: AGRGTTYGATYMTGGCTCAG & 1492 R: RGYTACCTTGTTACGACTT) [10] and fungal primers (ITS9 MUNngs: TACACACCGCCCGTCG & ITS4 ngsUni: CCTSCSCTTANTDATATGC) [11] were used for PCR-amplification for SMRTbell® library preparation and sequencing (Pacific Biosciences of California, Inc., Menlo Park, CA, USA). In brief, amplification was performed busing 2x KAPA HiFi HotStart ReadyMix (Roche Applied Science, Penzberg, Germany), 0.375 µM primer, and 1 ng genomic DNA in a volume of 25 µL. After initial denaturation (3 min, 95 °C), 20 cycles of 30 s, 96 °C denaturation, 30 s, 57 °C annealing and 60 s, 72 °C elongation were run (Pacific Biosciences of California, Inc., Menlo Park, CA, USA). Amplicon sizes were determined on a 5200 fragment analyzer using the NGS fragment kit (Agilent Technologies, Santa Clara, CA, USA). Amplicon concentrations were quantified with a Qubit fluorometer (Invitrogen, Waltham, MA, USA). Amplicons were pooled at equimolar concentration and then processed according to the SMRTbell® Library Preparation and Sequencing protocol. After final purification, the library was sequenced on a Sequel IIe instrument (Pacific Biosciences of California, Menlo Park, CA, USA).
For bacterial taxonomy, raw PacBio 16 S circular consensus sequences (CCS) were exported and demultiplexed using lima (https://github.com/PacificBiosciences/barcoding, accessed on 1 February 2022). Data were processed in R (4.1.1, R Core Team 2021) using dada2 [12]. Primers were removed (removePrimers, max.mismatch = 0, orient = TRUE). Sequences were filtered according to quality (filterAndTrim, settings: minQ = 22, minLen = 1000, maxLen = 1600, maxN = 0, rm.phix = FALSE, maxEE = 3). Error rate estimation was performed with the maximum possible number of bases. Data were dereplicated and amplicon sequence variants (ASV) were acquired. Taxonomy annotation was performed using Silva [13] (Nr. 99 v138.1).
For fungal taxonomy, raw Pacbio ITS CCS were imported and processed under QIIME 2 software [14]. Briefly, trimming primers and barcodes was conducted using Cut-adapt. Subsequently, QIIME DADA2 plugin was applied to denoise sequencing reads and acquire ASVs. The representative sequences were assigned to the UNITE 8.3 database (https://unite.ut.ee/, accessed on 01 October 2021) for taxonomic classifications utilizing the feature-classifier plugin [15,16]. ASVs of bacterial sequences which were identified as ‘unassigned’ were excluded.

2.3. Assessment of VOCs by Headspace-Gas Chromatography-Ion Mobility Spectrometry (HS-GC-IMS)

For analysis of VOCs, a prototypic ion mobility spectrometer (IMS, Gesellschaft für Analytische Sensorsysteme mbH (G.A.S. mbH, Dortmund, Germany), was coupled to an Agilent 6890 N gas chromatograph (GC, Agilent Technologies, Palo Alto, CA, USA). The system was equipped with a CombiPal GC autosampler (CTC Analytics, Zwingen, Switzerland) with a headspace (HS) sampling unit and a 2.5 mL gas-tight heatable syringe [17].
For the isolation of VOCs, 0.5 g of 47 ± 1 h fermented traditional kefirs (Section 2.1), commercial kefirs, yogurts, and milk, which served as reference in this experiment, were transferred into a 20 mL HS vial, mixed with 0.5 mL saturated NaCl solution, and sealed with a 2 mm silicon cap. Subsequently, the samples were incubated for 20 min at 75 °C and 750 rpm. Following incubation, 1 mL of HS was acquired at a speed of 350 μL s−1 using a syringe temperature of 80 °C to avoid condensation effects. Before each analysis, the syringe was automatically flushed with a stream of nitrogen for 5 min to avoid cross-contamination. Injection was performed into a split/splitless injector, operated at 150 °C in split mode (split 1:10). Chromatographic separation was performed on an HP-5 capillary column with a 30 m × 0.32 mm × 0.25 μm 5% phenyl-methylpolysiloxane film (Agilent Technologies, Santa Clara, CA, USA, SN: USB345942H). Nitrogen of 99.99% purity was used as carrier gas at an initial column flow of 1.5 mL min−1. The pressure was set constant to 6.7 psi. The GC oven temperature was programmed as follows: the GC oven was preheated to 40 °C and ramped up to 140 °C at 10 °C min−1, which corresponds to 10 min of GC runtime [17,18].
Following separation, the analytes were ionized in the IMS ionization chamber by a 3H ionization source (300 MBq activity). The drift-tube length was 5.3 cm, operated at a constant voltage of 2.5 kV, with a nitrogen flow of 150 mL·min−1. The gas flow was controlled by a mass-flow controller (Voegtlin Instruments, Aesch, Switzerland). The IMS cell was operated in positive-ion mode at a temperature of 120 °C. Each spectrum was the average of six scans obtained using injection pulse widths of 100 μs, sampling frequencies of 228 kHz, and repetition rates of 21 ms. The data were collected using LAV software version 2.2.1 from G.A.S. mbH. The determination of the VOCs was performed in duplicate.
Key compounds were identified through a literature search [19,20] and subsequent confirmation through measurement of reference substances. Stock solutions of reference substances were prepared in LC-MS grade water (HiPerSolv Chromanorm, VWR International, Germany). For semi-quantitative evaluation of each substance detected via HS-GC-IMS measurements, the signals above the plateau of the local minimum were integrated using the ’volume above the minimal area’ command from VOCal software version 0.1.0 from G.A.S. mbH, Germany. The peak volume was subsequently normalized to the preselected GC-IMS peak area. Measurements were conducted using consistent sample concentration and preparation, therefore the peak volume measurements in GC-IMS for a particular substance are comparable across dairy samples (further referred to as abundance). The absolute substance concentrations, however, were not quantified. For visualization of similarities between the peak volume of kefir and yogurt samples, a hierarchically clustered heatmap was generated. Python version 3.9.6 using the ’clustermap’ command from the ‘Seaborn’ library was used. The distance metric applied was ’euclidean’ and the linkage method which was used for calculating the clusters was ’ward’.

2.4. Targeted Metabolite Analysis

The beverages of commercial and grain-based kefirs were analyzed for glucose, galactose, lactose, lactate, acetate, and glycerol concentrations by the Cedex Bio HT Analyzer (Roche Diagnostics International AG, Switzerland) and for lactose concentration with the D-galactose/lactose test kit (Megazyme, Brey, Ireland). Metabolites were quantified at two timepoints, i.e., 23 ± 1 h and 47 ± 1 h. Prior to analysis, samples were centrifuged at 6000× g for 5 min (4 °C) and the cell-free supernatants were used for metabolites analysis. The p values were obtained by unpaired t-tests using the GraphPad QuickCalcs software (https://www.graphpad.com/quickcalcs/ttest1.cfm, accessed on 10 February 2022). The difference was considered significant when a p value was <0.05. The milk that was used for the preparation of traditional kefirs was also used in measurements.

3. Results and Discussion

3.1. Microbial Composition of Kefirs

Since the health benefits of fermented food are directly related to the microbial species that are involved in the fermentation processes [21], it is interesting to compare the microbial composition of traditional and commercial kefir in the first stage. Microbial species are also responsible for the metabolite profiles in the final product. Functional characteristics and organoleptic properties are subject to drastic changes if the grain-based kefir cultures are not used as starter cultures for commercial kefir production [21]. For example, Bourrie et al. (2018) approved that the differences in kefir microbial populations of grain-based kefirs compared to commercial kefir may influence the ability of traditional kefir to positively impact host metabolic health [22].

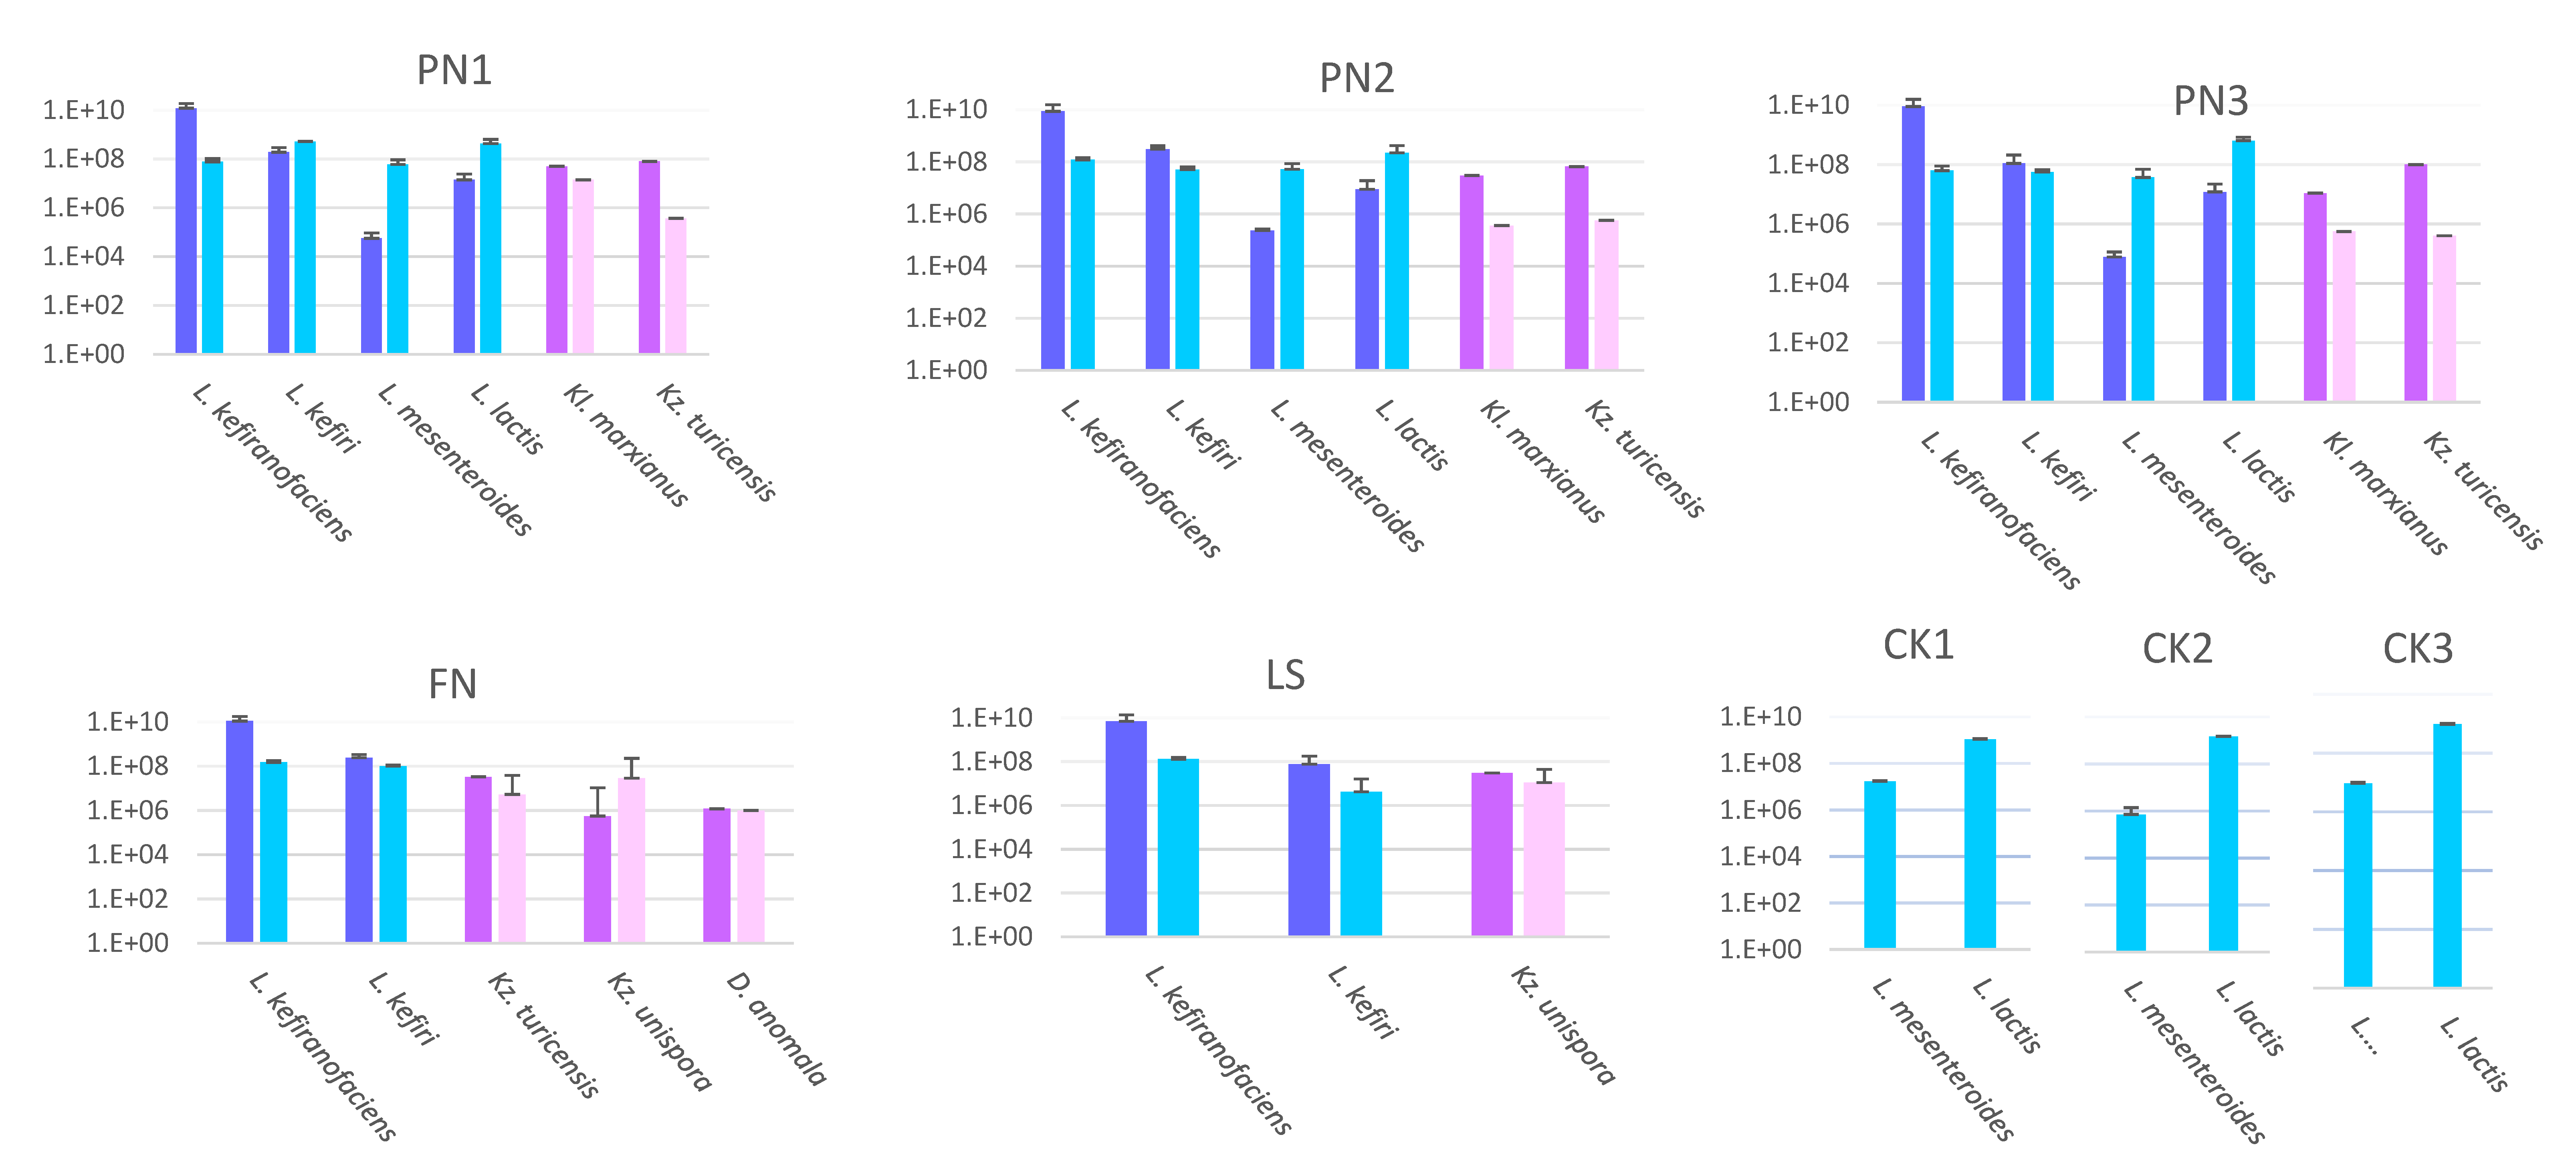
3.1.1. Targeted Quantification Using qPCR

The application of a target-based qPCR method first requires the development of specific primers and probes for defined microorganisms. In our previous work, we selected eleven bacterial and yeast species based on their abundance in the milk kefir environment [8,9], and developed multiplex Taq-man qPCR assays for fast and accurate detection of eleven microorganisms. This method was applied in the current study to compare its efficiency compared to NGS for milk kefir analysis. The results of this quantification for traditional kefirs (in both grain and beverage fractions) after 47 ± 1 h and in commercial kefirs are shown in Figure 1. Based on qPCR results, L. kefiranofaciens and L. kefiri were detected in all traditional kefirs, and not in commercial kefirs. Four different yeasts, Kluyveromyces (Kl.) marxianus, Kazachstania (Kz.) turicensis, Kz. unispora, and Dekkera (D.) anomala, were quantified in traditional kefirs in various combinations, however, they were not detected in commercial kefirs. The microbial composition of the traditional kefirs was slightly different compared to our previous analysis of these traditional kefirs in the work published two years ago [9], while neither Acetobacter (A.) orientalis, A. fabarum, nor Saccharomyces cerevisiae were detected in grain-based kefirs in the present study. This finding reflects the dynamics in microbial composition of traditional kefir [23].

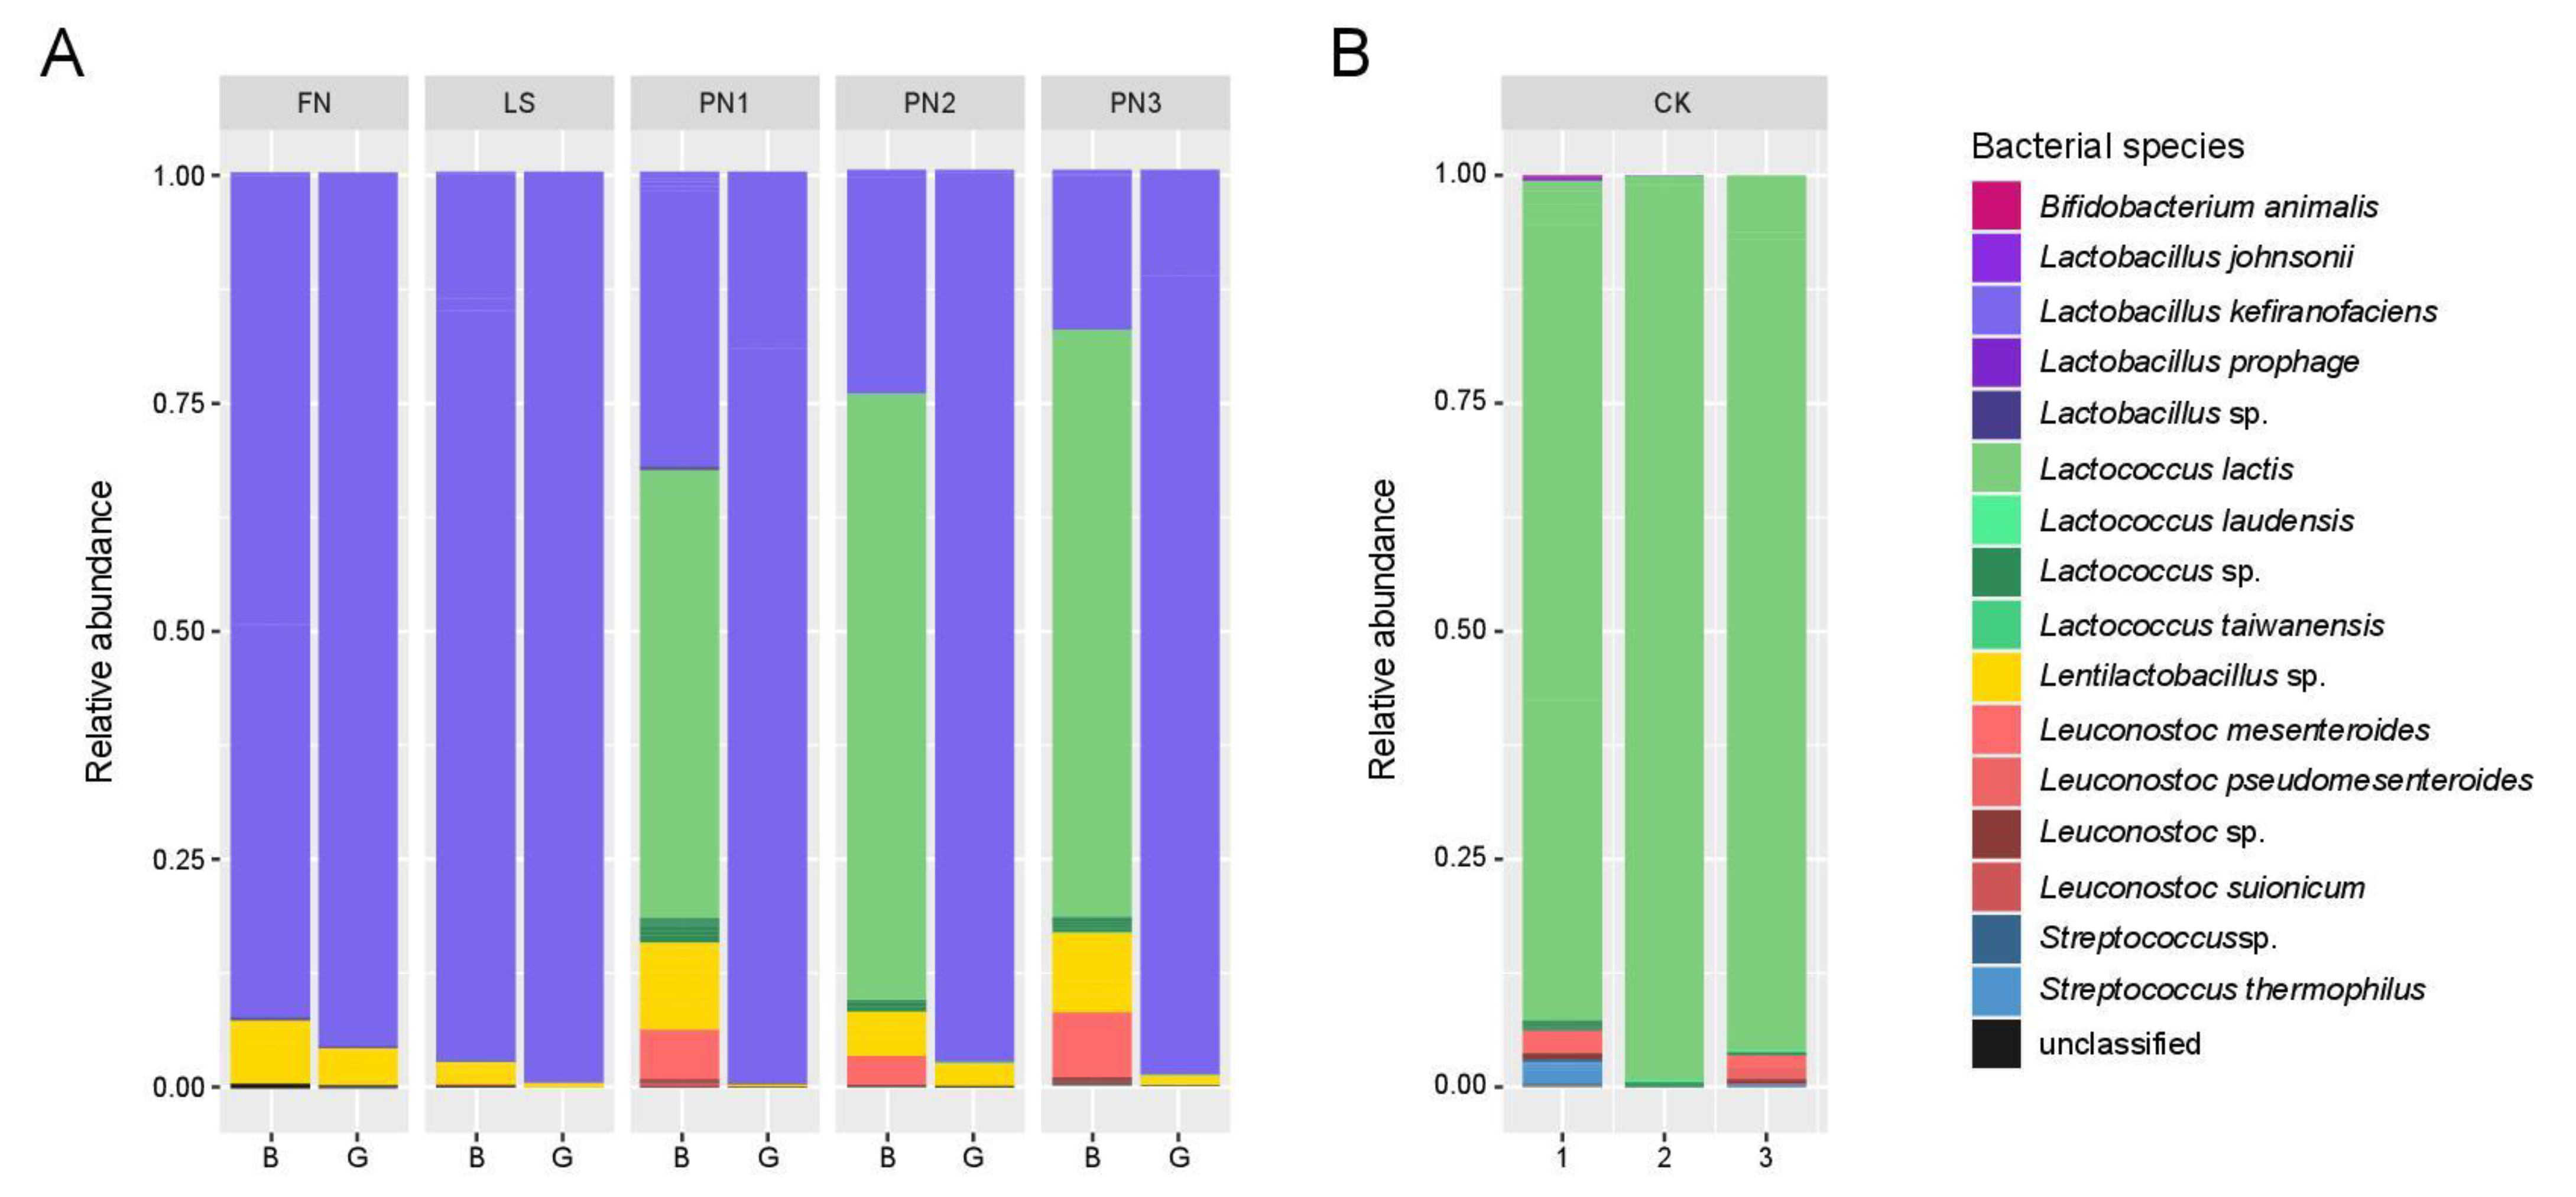
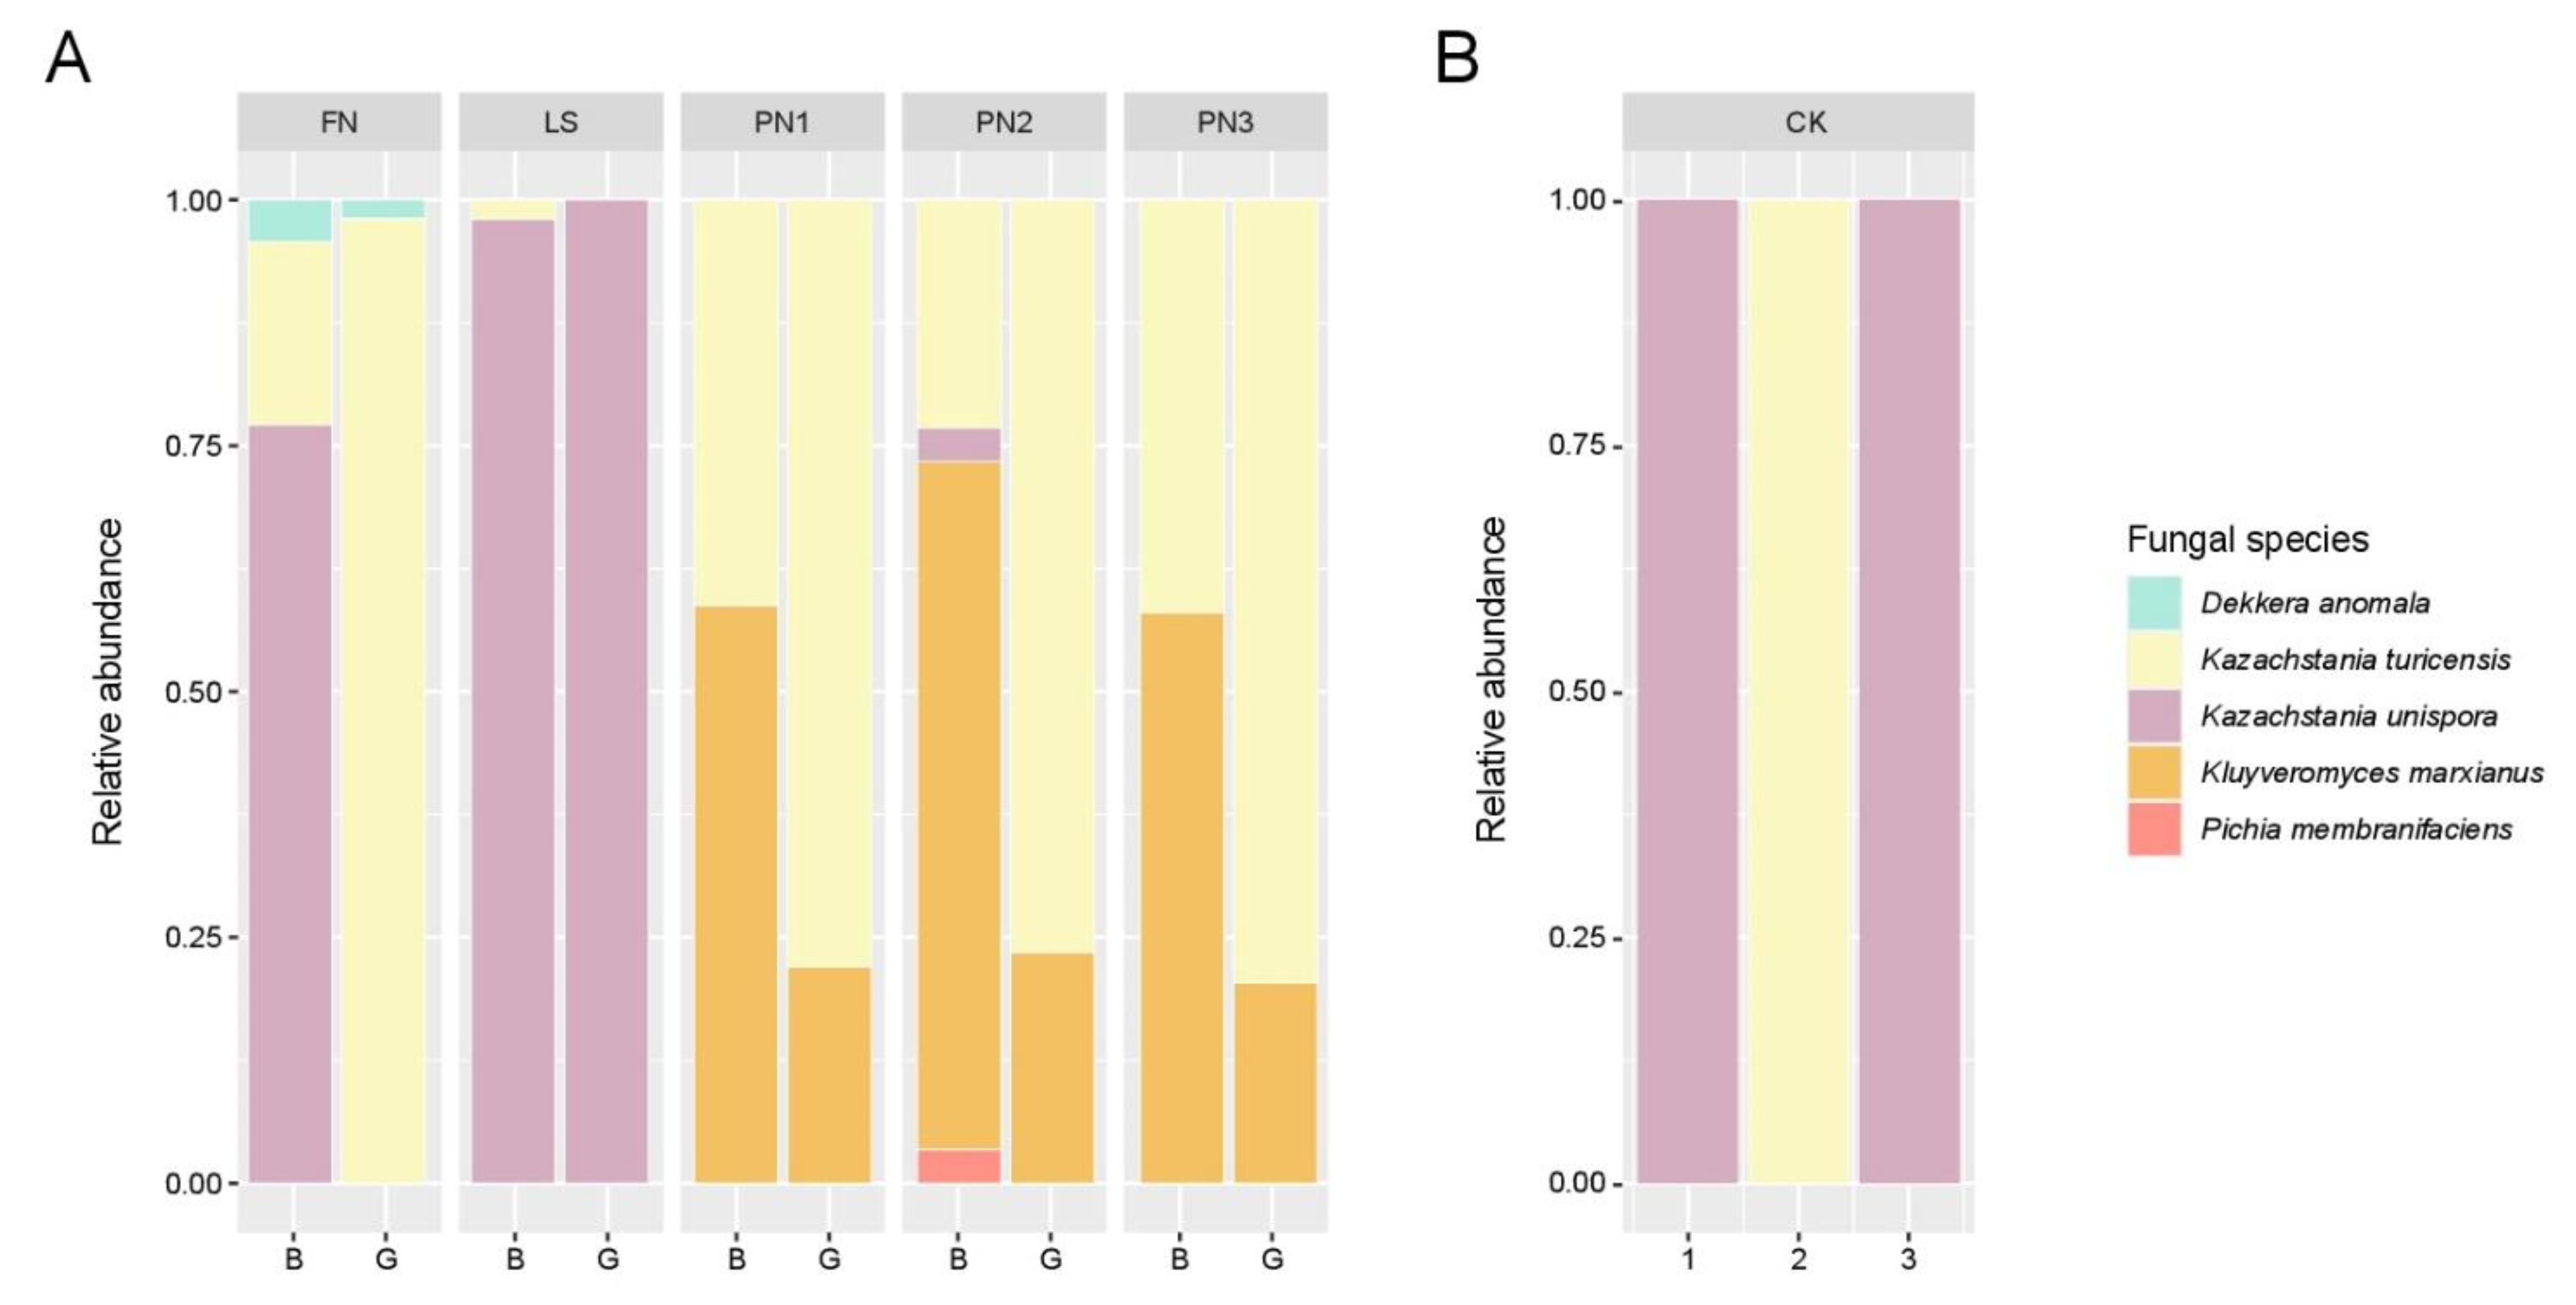
3.1.2. Identification of Microbial Community Using NGS

The current study has captured the whole microbial diversity concerning bacteria and yeast communities in milk kefir samples.
Regarding the bacterial composition, Lactobacillus, specifically L. kefiranofaciens was the most abundant bacterium in all five traditional kefir grains, accompanied by the genus Lentilactobacillus (Figure 2A). In the beverage fraction of traditional kefirs, L. kefiranofaciens also showed the highest relative abundance among bacterial species in kefirs FN and LS, while L. lactis showed the highest relative abundance in kefirs PN1, PN2 and PN3. Unlike the grain-based kefirs, Lactococcus spp. were the dominant bacterial genera in all three commercial kefirs (Figure 2B), besides a lower abundant population of Leuconostoc spp. in kefir CK3 and Leuconostoc spp. and Streptococcus (S.) thermophilus in kefir CK1. Regarding the beverage fraction, a considerable difference in the bacterial population was observed within traditional kefirs. Although the majority of studies have shown the prevalence of L. lactis and L. mesenteroides in kefir beverages [8], the highest abundance of L. kefiranofaciens was surprisingly observed in the beverage fraction of kefirs FN and LS, detected using both targeted qPCR and untargeted NGS.
Taxonomical analysis using PacBio ITS sequencing revealed that traditional and commercial kefirs were dominated by yeasts Kz. turicensis, Kz. unispora and Kl. marxianus (see Figure 3), which was in agreement to our previous findings [9]. Based on PacBio sequencing results, the commercial kefirs were dominated by one single Kazachstania spp. These findings contradicted with previous studies on commercial kefirs [24], which reported higher community diversity in commercial kefirs [24]. Thus, we sought to validate our PacBio sequencing findings by ITS amplicon sequencing (supplementary method 1). Interestingly, the amplicon sequencing results showed a very high overlap for traditional kefirs, but not for the commercial kefirs. In fact, the amplicon sequencing revealed completely different fungal compositions in commercial kefirs. With amplicon sequencing of ITS2 we detected a completely different fungal composition in commercial kefirs, Debaryomyces (D.) spp., with 99.68% sequence identity to D. hansenii using Blastn [25] dominated the commercial kefirs (Figure S1). D. hansenii, which was identified with the highest relative abundance in all commercial kefirs amplicon sequencing (Figure S1) within this study, has also been found by Kazou et al. (2021) in high abundance in a Greek commercial kefir [24]. Cladosporium cladosporioides was another species identified by amplicon sequencing in two commercial kefirs Ck1 and Ck3, and although it was not reported to be identified in sequencing of grain-based kefirs, it was detected only in a kefir sample produced by back sloping [8].
This discrepancy may derive from bias introduced by the sequencing procedures themselves, with DNA extraction, PCR amplification, sequencing, and identifying all contributing to the deviation from the real truth [26]. This bias may become even more pronounced in low biomass communities [27]. Based on our findings, and the results published by others [24], we assume the fungal communities in commercial kefirs have very low abundance. The same study also showed that fungal DNA could be amplified in all commercial samples, but only in 2 out of 4 samples, any yeast could actually be cultivated [24], thereby supporting our hypothesis that the commercial kefirs in this study were low in biomass. This would explain why the differences that were observed in the fungal community of commercial kefirs by sequencing, i.e., Kz. unispora and Kz. turicensis, were not detected using qPCR and amplicon sequencing methods, but were identified using PacBio sequencing.
In general, differences in the microbial compositions between traditional and commercial kefirs, by using two culture-independent methods, were considerable. Such differences have also been shown by Metras et al. (2020) in a study on kefir products of the US market [28], Biçer et al. (2021) [29] and Yegin et al. (2022) [30] in Turkish kefirs. In all these studies, the genera Lactococcus made up the majority of sequences measured in commercial kefirs, which is a common starter culture in dairy products. The other species that were most frequently identified in commercial kefirs were L. mesenteroides and S. thermophilus, which are in agreement with our findings. None of the bacteria L. kefiranofaciens and L. kefiri, which constitute the absolute majority of traditional grain-based kefir cultures, were found in industrially produced kefirs. To the best of our knowledge, there is no publication explaining the criteria for bacteria and yeast selection in commercial kefirs by kefir starter culture producers. Fungal composition is an important discriminating aspect between grain-based and commercial kefirs.
Based on the current data, it can be concluded that the previously developed target-based qPCR technique [9] covers the most important bacterial and fungal species usually found in traditional kefirs and allows a comprehensive identification and quantification. Due to the comparably lower cost of qPCR compared to NGS sequencing, this methodology is the most suitable for further routine lab applications to unravel the composition of traditional kefirs. Also of great advantage is the ability to deliver absolute quantification via qPCR [31]. qPCR only quantifies the targeted species, and thus does not cover other species potentially present, as it was shown for the fungal community in commercial kefirs. The combination of NGS sequencing and qPCR, as performed within this study, thus provides a holistic approach to identify the species composition and facilitate absolute quantification [31].

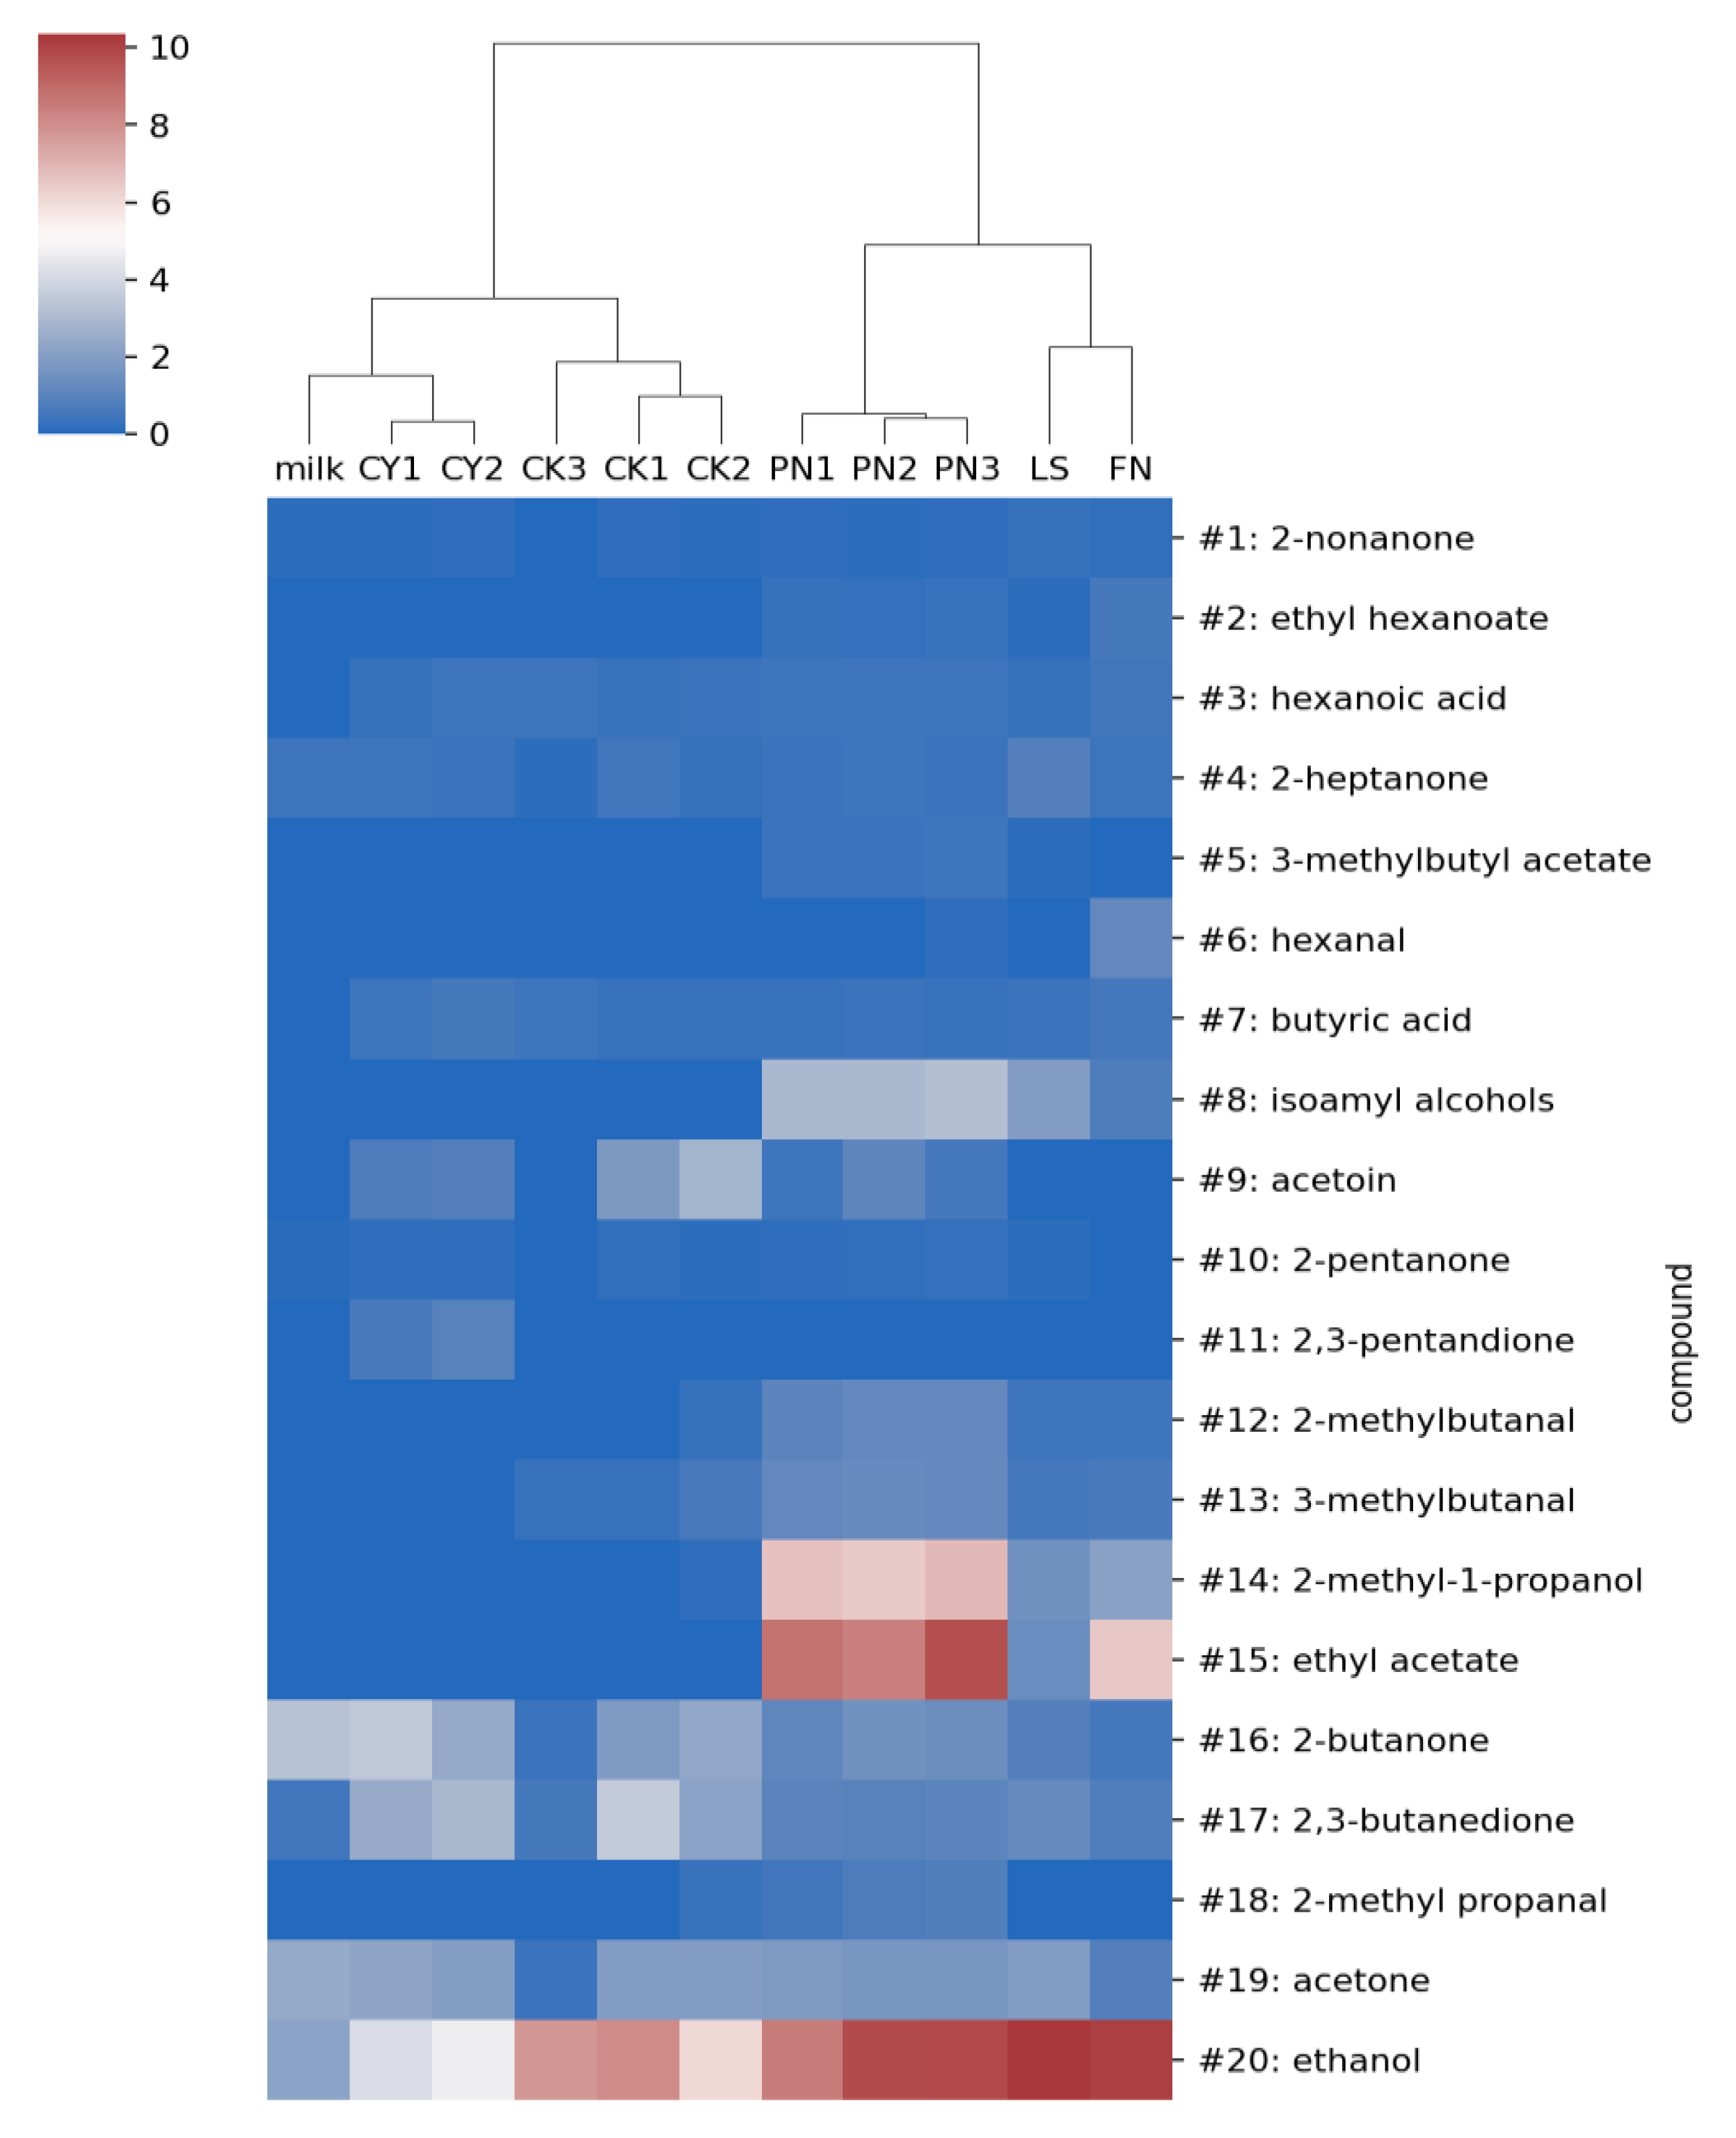
3.2. Identification of VOCs and Clustering of Yogurt and Kefir Samples

VOCs of milk, commercial yogurts (CY1 and CY2), commercial kefirs (CK1, CK2, and CK3), and grain-based traditional kefirs (FN, LS, PN1, PN2, and PN3) were analyzed by HS-GC-IMS. The results of the VOCs profiles are visualized in Figure 4 as a hierarchically clustered heatmap. The clustering algorithm visualizes sample similarities in a cluster dendrogram with the vertical distance corresponding to the similarities between samples. Based on the VOCs, the commercial samples, including milk, yogurts, and commercial kefirs clustered separately from the grain-based traditional kefirs. This unsurprisingly shows that commercial kefirs have a higher similarity to yogurt than to grain-based traditional kefirs. The commercial yogurt-kefir cluster was further divided into two sub-clusters. Here, the commercial yogurts showed higher similarity to milk than to the commercial kefirs, which formed the second sub-cluster. The short distances within the commercial yogurt-kefir sub-clusters suggest a high similarity in the VOCs profiles of the two yogurt samples included in the present study.
The grain-based traditional kefir cluster was further divided into two sub-clusters. Sub-cluster 1 contained all PN kefirs, which show high similarity in their VOCs-profiles, while sub-cluster 2 contained FN and LS. By considering the differences in microbial compositions, it seems reasonable that PN1-PN3 are in a different cluster than the other two traditional kefirs LS and FN. PN1-PN3 have more diverse bacterial and yeast communities, e.g., the heterofermentative bacteria L. mesenteroides and the strong aroma producing yeast Kl. marxianus. FN and LS kefir showed a larger distance to each other than the three PN kefirs from sub-cluster 1, which can be explained by different bacterial and yeast species in these 2 kefirs.
Using a correlation matrix, further sample similarities were investigated. It was noted that not only does CK3 correlate well with CK1 and CK2 with values of 0.898 and 0.833, respectively, but further correlates with the grain-based kefir FN and LS with values of 0.810 and 0.959, respectively.
In milk, mainly five VOCs were found: 2-nonanone (#1), 2-heptanone (#4), 2-butanone (#16), acetone (#19), and ethanol (#20) in decreasing order. As shown in Figure 4, a similar abundance of 2-nonanone, 2-heptanone, and acetone, as observed in milk, were detected in all commercial and grain-based kefirs (FN, LS, PN1, PN2, and PN3). Therefore, it was concluded that these three ketones were not originated from kefir fermentation, but from milk. While commercial yogurt (CY1 and CY2) and commercial kefir CK1 and CK2 also contained a similar abundance of acetone, 2-heptanone, and 2-nonanone as milk, CK3 in contrast contained a very low abundance of these three ketones. The abundance of the fourth ketone, 2-butanone (#16), was highest in milk. Especially in the grain-based kefirs FN, LS, and PN3, the abundance of 2-butanone (#16) was clearly lower than in milk, probably due to an assimilation within the microbial fermentation process. Ketones, which were found in yogurt and kefir, but not (or in significantly smaller concentrations) in milk, are acetoin (#9) and 2-pentanone (#10), as well as the diketones pentane-2,3-dione (#11) and butane-2,3-dione (diacetyl, #17). Acetoin was found in CK1 and CK2 and in smaller abundance in CY1, CY2, PN1, PN2, and PN3. 2-pentanone (#10) was found in commercial yogurt as well as in CK1, CK2, LS, PN1, PN2, and PN3, but was absent in CK3 and FN. The diketone pentane-2,3-dion (#11) was only found in CY1 and CY2 and in smaller abundance in CK2 and FN. The diketone butane-2,3-dione (#11) was found in all kefir samples, with the highest amount in CK1, CK2, as well as CY2.
Three aldehydes were found in this work: 2-methyl propanal (#18), 2-methylbutanal (#12), and 3-methylbutanal (#13). Both methyl butanals (#12 and #13) were previously reported in kefir [19,20]. All three aldehydes were found in PN1, PN2, and PN3. Both methyl butanals (#12 and #13) were also found in the other kefirs, but in lower abundance. In contrast, 2-methyl propanal (#18) was only found in CK2. A fourth aldehyde, hexanal (#6) was mainly found in the FN-kefir and in smaller abundance in PN3. Aldehydes, such as hexanal (#6), are secondary oxidation products that rapidly develop through hydroperoxides, which are primary oxidation products of unsaturated fatty acids [32]. Due to its low odor threshold (approx. 5 ppb), hexanal is easily detected and it is directly related to oxidative off-flavors [33]. Thus, the presence of hexanal (#6) in the FN kefir may be a consequence of secondary lipid oxidation.
Furthermore, various alcohols, which have previously been reported in kefir [19,34], were also quantified in this work: ethanol (#20), isoamyl alcohol (#8), and 2-methyl-1-propanol (#14) [19]. 2-methyl- and 3-methyl-1-butanol have very similar retention times, differentiation is rather difficult, and both compounds are cumulated here (#8). The ethanol abundance detected in CK1, CK2, and CK3 is similar to the abundance found in milk, while all grain-based kefirs showed an increased content of ethanol. Ethanol production in kefir was previously attributed to yeasts [35], but it was also noted that Lactococcus spp. and Lactobacillus spp. possess a low activity of alcohol dehydrogenase, which converts acetaldehyde to ethanol. Isoamyl alcohols (#8) were absent in the commercial samples and most abundant in PN1, PN2 and PN3 containing a high concentration of Kl. marxianus. Kl. lactis was also reported as a producer of both 2- and 3-methylbutanal, which were also detected in higher abundance in PN1-PN3 kefirs [36].
Acids that were detected in the kefir samples are butyric acid (#7) and hexanoic acid (#3). Acetic acid was also tentatively found in all samples, however, the pattern formed by acetic acid in IMS analysis is quite complex. Therefore, a univariate evaluation of acetic acid was not possible. Butyric acid (#7) and hexanoic acid (#3) were found in all yogurt and kefir samples (commercial and grain-based) with a similar abundance. Furthermore, three esters, which were previously reported [19], appear in the grain-based kefirs: ethyl acetate (#15), 3-methylbutyl acetate (#5) and ethyl hexanoate (#2). These esters correspond to alcohols already identified (ethanol and 3-methyl-butanol) with acetic acid and hexanoic acid. Ethyl acetate together with ethyl lactate, benzoic acid, and ethanol were reported as predominant compounds in traditional kefirs [8]. The detection of ethyl hexanoate (#2) in all grain-based kefirs in this test was also reported for L. kefiranofaciens and L. kefiri growth in milk in a recent study [37]. In general, no esters were found in the commercial yogurts and kefirs.
Defining the contribution of individual bacteria and yeast species in synthesizing the various metabolites in complex microbial communities is not an easy task, especially when metabolomic characteristics of different species are highly strain-specific [38]. One approach that has been used so far was to analyze the contribution of different microorganisms by elaboration of defined co-cultures. e.g., two or three different microorganisms [36]. This is, however, not truly representative for complex microbial communities, in which an inter-dependency of different isolates or cross-feeding processes with other species are required for the appearance of certain reactions so that the resulting product is accumulated and becomes detectable.

3.3. Targeted Metabolites Analysis

In addition to the VOCs, relevant metabolites in the kefir beverage were quantified after 23 ± 1 and 47 ± 1 h of fermentation of traditional grain-based kefirs as well as commercial kefirs (Table 1). These metabolites were lactose, the only carbon source in milk, and its mono-saccharide compounds glucose and galactose. Furthermore, we determined the concentration of lactate and acetate as the typical organic acid side products of bacterial fermentation, and glycerol was measured in kefir samples as a growth-related compound of yeast.
As it is seen in Table 1, extensive hydrolysis of lactose is the matter of long fermentation [39]. The lactose concentration of milk used in our study was 47.2 ± 0.3 g·L−1. In kefir PN1, which showed the fastest fermentation, only around one quarter of lactose hydrolyzed after 23 ± 1 h. This concentration decreased further to 9.2 ± 5.4 g·L−1 after 47 ± 1 h of fermentation, which was significantly lower than the concentration in commercial kefirs (p < 0.05). The remaining lactose in traditional kefir FN was still high (37.6 ± 5.3 g·L−1) after 47 ± 1 h, with no significant difference from lactose concentrations in commercial kefirs (p < 0.05). Based on these results, one can conclude that the lactose hydrolysis rate in grain-based traditional kefirs is related to the diversity of microbial composition. Gadaga et al. (2001) [39] showed the different lactose hydrolyzation activity in milk fermented by single or mixed-cultures of L. lactis and Candida kefyr, where the lactose digestion in mixed-culture fermentation is improved. Lactose hydrolyzing yeasts seems to have an important role, as it was seen that the kefir samples PN1-PN3 had the lowest lactose concentration while containing Kl. marxianus.
Glucose is considered as the main energy source for many microorganisms, especially also for those yeasts in kefirs that are not able to consume lactose, like Kazachstania spp. Glucose decreased significantly in all traditional kefirs from 23 ± 1 h to 47 ± 1 h (p > 0.05), which led to increased lactate and acetate concentrations at the same time. Like glucose, the galactose content decreased during the prolonged fermentation. The galactose content was also significantly lower (p < 0.05) than that of commercial kefirs even after shorter fermentation periods, i.e., 23 ± 1 h. A lower concentration of galactose in traditional kefirs is due to the consumption of galactose for polysaccharide synthesis [40]. Galactose accumulation in commercial dairy products has been linked to the application of conventional starter cultures, e.g., L. lactis, S. thermophilus, and L. bulgaricus [41]. A higher galactose concentration can also be due to the presence of only one (L. lactis) or very few species in commercial kefirs. Similar to lactose hydrolyzing activity, it was shown that the application of mixed-cultures compared to mono-cultures leads to lower galactose contents in fermented milk [39].
The organic acid profile of the fermented milks is the result of both anabolic and catabolic processes. Lactic acid is the main end product of the main carbohydrate metabolism in LAB, although quantities of other organic acids such as acetate, butyrate and propionate are produced, especially by heterofermentative LAB. At both time points, 23 ± 1 and 47 ± 1 h, the lactate concentrations were significantly lower (p < 0.05) in traditional kefirs compared to commercial kefirs. This can be explained by the consumption of lactate by yeast species [2]. Lactate concentration in commercial kefir samples was about two times higher than in traditional kefirs and the concentrations were in the range previously reported for commercial kefir [42,43]. Similar to lactate, the concentration of acetate increased over time in traditional kefirs. The amount of acetate in three commercial kefirs was between 584.4 ± 105.6 and 810.1 ± 84.6 mg L−1, which is well in agreement with Grønnevik et al. [42] as well as the amounts that were reported as side product from cultures of L. lactis subsp. Lactis biovar diacetylactis [44].
Glycerol concentration was observed to be significantly higher (p < 0.05) in traditional kefirs compared to commercial kefirs, which indicates considerable activities of yeast species in traditional kefirs. Among them, traditional kefir LS was exceptional, with a significantly lower glycerol concentration, which is probably due to a lower enzyme provision for this conversion by Kz. unispora, though there is no previous report on this yeast regarding to this observation. The average production of glycerol in commercial kefirs was 25.5 ± 5.9 mg L−1, which is in agreement with a previous study [43]. Some yeast species, like Saccharomyces ssp., have been reported to be able to produce glycerol as the main secondary product in their alcoholic fermentation [43]. It has been shown, however, that glycerol production correlates not only merely with species, but also with cell concentration and persistence of the other microbial cultures, e.g., in combination with Saccharomyces ssp. [45]. Consequently, the low concentration of glycerol in LS kefir may also be due to the fact that Kz. unispora was found as the single yeast in this kefir (Figure 3).
In summary, metabolite analysis as conducted in this study can be considered as an interesting tool to discriminate between different kefirs. The concentrations of galactose and lactate are quite different between all commercial and traditional kefirs, however, to be able to select a reliable indicator of differentiation, it is recommended that commercial kefirs shall be analyzed over the product life cycle, from production to the end of shelf life. Changes in certain quality- or community-related metabolites over the course of the product cycle shall be investigated in future studies.

4. Conclusions

In this study, grain-based and commercial milk kefirs were examined for their microbial compositions and metabolites using different techniques. Analysis of bacteria compositions revealed fundamental differences, although L. kefiranofaciens was identified as the dominant bacterial species in the grain fraction of all traditional kefirs, and high number/abundancy in beverage fraction of these kefirs, it was not found in commercial kefirs. Both the targeted qPCR and NGS methods for identifying bacterial and fungal microbiota gave very similar results for the analysis of traditional kefirs, but not for the fungal composition of commercial kefir. Here, the results of qPCR and NGS did disagree in identifying the fungal composition, and completely different fungal composition profiles were identified by using two different NGS methods, which may be due to the low yeast biomass in commercial kefirs. The differences in the microbial composition of traditional and commercial kefirs were also reflected by the VOCs as well as other targeted metabolites. Analysis of VOCs using HS-GC-IMS was another successfully applied tool that enabled the discrimination of commercial and traditional kefirs. Samples from commercial kefirs showed a higher similarity with yogurt samples than with samples from traditional kefirs. Some metabolites’ concentrations, such as the galactose concentration, also revealed differences between these two kefirs. Accordingly, the methods and results of this study provide a good basis for re-evaluating the industrially produced kefir and may urge the industries to apply new combination of bacteria and yeast species as starter cultures for a achieving a higher similarity with traditional kefir.
The results of this study are limited to traditional and commercial kefirs in Germany. Therefore, methods need to be applied to a broader range of kefir samples in upcoming studies. Furthermore, any evaluation of kefirs in a wider time frame might allow the capture of eventual dynamics of the composition of the microbial population in kefir.

Supplementary Materials

The following supporting information can be downloaded at: https://www.mdpi.com/article/10.3390/app12083838/s1, Method 1: Identification of fungal community of kefirs using ITS amplicon sequencing; Figure S1: Diversity of bacterial species in traditional and commercial kefirs analyzed using ITS amplicon sequencing (References [14,46,47,48] are cited in the supplementary materials).

Author Contributions

Conceptualization, F.N., P.N., S.J. and P.W.; methodology, F.N., C.C.C. and J.L.K.; software, F.N., C.C.C., R.R. and G.-U.K.; writing—original draft preparation, F.N., C.C.C., J.K. and J.L.K.; writing—review and editing, P.N., P.W., H.-D.C., S.J., J.L.K. and C.C.C.; project administration, F.N.; funding acquisition, F.N., P.N., S.J., P.W. and H.-D.C. All authors have read and agreed to the published version of the manuscript.

Funding

F.N. was funded during this study by the programs Einstein Junior Scholarships (EJS-2019-488-2) and ProTUTec (20052/TUB) founded by the Einstein Foundation and Technische Universität Berlin, respectively.

Acknowledgments

The authors thank Viola Röhrs for technical assistance with the qPCR machine. We acknowledge support by the German Research Foundation and the Open Access Publication Fund of TU Berlin. H.D.C. is grateful for support by the Rolf Schwiete foundation. We thank Roche CustomBiotech (Mannheim, Germany) for the supply of the Cedex Bio HT Analyzer.

Conflicts of Interest

The authors declare no conflict of interest. The funders had no role in the design of the study; in the collection, analyses, or interpretation of data; in the writing of the manuscript, or in the decision to publish the results.

References

  1. Xiang, H.; Sun-Waterhouse, D.; Waterhouse, G.I.; Cui, C.; Ruan, Z. Fermentation-enabled wellness foods: A fresh perspective. Food Sci. Hum. Wellness 2019, 8, 203–243. [Google Scholar] [CrossRef]
  2. Nejati, F.; Junne, S.; Neubauer, P. A Big World in Small Grain: A Review of Natural Milk Kefir Starters. Microorganisms 2020, 8, 192. [Google Scholar] [CrossRef] [PubMed] [Green Version]
  3. Gao, X.; Li, B. Chemical and microbiological characteristics of kefir grains and their fermented dairy products: A review. Cogent Food Agric. 2016, 2, 1272152. [Google Scholar] [CrossRef]
  4. Kesmen, Z.; Kacmaz, N. Determination of lactic microflora of kefir grains and kefir beverage by using culture-dependent and culture-independent methods. J. Food Sci. 2011, 76, M276–M283. [Google Scholar] [CrossRef]
  5. Kim, D.-H.; Jeong, D.; Kim, H.; Seo, K.-H. Modern perspectives on the health benefits of kefir in next generation sequencing era: Improvement of the host gut microbiota. Crit. Rev. Food Sci. Nutr. 2019, 59, 1782–1793. [Google Scholar] [CrossRef]
  6. Ganatsios, V.; Nigam, P.; Plessas, S.; Terpou, A. Kefir as a Functional Beverage Gaining Momentum towards Its Health Promoting Attributes. Beverages 2021, 7, 48. [Google Scholar] [CrossRef]
  7. Pinto, V.R.A.; Teixeira, C.G.; Lima, T.S.; de Almeida Prata, E.R.B.; Vidigal, M.C.T.R.; Martins, E.; Perrone, Í.T.; de Carvalho, A.F. Health beliefs towards kefir correlate with emotion and attitude: A study using an emoji scale in Brazil. Food Res. Int. 2020, 129, 108833. [Google Scholar] [CrossRef]
  8. Garofalo, C.; Ferrocino, I.; Reale, A.; Sabbatini, R.; Milanović, V.; Alkić-Subašić, M.; Boscaino, F.; Aquilanti, L.; Pasquini, M.; Trombetta, M.F.; et al. Study of kefir drinks produced by backslopping method using kefir grains from Bosnia and Herzegovina: Microbial dynamics and volatilome profile. Food Res. Int. 2020, 137, 109369. [Google Scholar] [CrossRef]
  9. Nejati, F.; Junne, S.; Kurreck, J.; Neubauer, P. Quantification of Major Bacteria and Yeast Species in Kefir Consortia by Multiplex TaqMan qPCR. Front. Microbiol. 2020, 11, 1291. [Google Scholar] [CrossRef]
  10. Klindworth, A.; Pruesse, E.; Schweer, T.; Peplies, J.; Quast, C.; Horn, M.; Glöckner, F.O. Evaluation of general 16S ribosomal RNA gene PCR primers for classical and next-generation sequencing-based diversity studies. Nucleic Acids Res. 2013, 41, e1. [Google Scholar] [CrossRef]
  11. Tedersoo, L.; Lindahl, B. Fungal identification biases in microbiome projects. Environ. Microbiol. Rep. 2016, 8, 774–779. [Google Scholar] [CrossRef] [PubMed]
  12. Callahan, B.J.; McMurdie, P.J.; Rosen, M.J.; Han, A.W.; Johnson, A.J.A.; Holmes, S.P. DADA2: High-resolution sample inference from Illumina amplicon data. Nat. Methods 2016, 13, 581–583. [Google Scholar] [CrossRef] [PubMed] [Green Version]
  13. Quast, C.; Pruesse, E.; Yilmaz, P.; Gerken, J.; Schweer, T.; Yarza, P.; Peplies, J.; Glöckner, F.O. The SILVA ribosomal RNA gene database project: Improved data processing and web-based tools. Nucleic Acids Res. 2013, 41, D590–D596. [Google Scholar] [CrossRef] [PubMed]
  14. Bolyen, E.; Rideout, J.R.; Dillon, M.R.; Bokulich, N.A.; Abnet, C.C.; Al-Ghalith, G.A.; Alexander, H.; Alm, E.J.; Arumugam, M.; Asnicar, F.; et al. Reproducible, interactive, scalable and extensible microbiome data science using QIIME 2. Nat. Biotechnol. 2019, 37, 852–857. [Google Scholar] [CrossRef]
  15. Bokulich, N.A.; Kaehler, B.D.; Rideout, J.R.; Dillon, M.; Bolyen, E.; Knight, R.; Huttley, G.A.; Caporaso, J.G. Optimizing taxonomic classification of marker gene amplicon sequences. Microbiome 2018, 6, e3208v2. [Google Scholar] [CrossRef]
  16. Kõljalg, U.; Larsson, K.-H.; Abarenkov, K.; Nilsson, R.H.; Alexander, I.J.; Eberhardt, U.; Erland, S.; Høiland, K.; Kjøller, R.; Larsson, E.; et al. UNITE: A database providing web-based methods for the molecular identification of ectomycorrhizal fungi. New Phytol. 2005, 166, 1063–1068. [Google Scholar] [CrossRef]
  17. Brendel, R.; Schwolow, S.; Rohn, S.; Weller, P. Volatilomic Profiling of Citrus Juices by Dual-Detection HS-GC-MS-IMS and Machine Learning-An Alternative Authentication Approach. J. Agric. Food Chem. 2021, 69, 1727–1738. [Google Scholar] [CrossRef]
  18. Capitain, C.C.; Nejati, F.; Zischka, M.; Berzak, M.; Junne, S.; Neubauer, P.; Weller, P. Volatilomics-Based Microbiome Evaluation of Fermented Dairy by Prototypic Headspace-Gas Chromatography–High-Temperature Ion Mobility Spectrometry (HS-GC-HTIMS) and Non-Negative Matrix Factorization (NNMF). Metabolites 2022, 12, 299. [Google Scholar] [CrossRef]
  19. Walsh, A.M.; Crispie, F.; Kilcawley, K.; O’Sullivan, O.; O’Sullivan, M.G.; Claesson, M.J.; Cotter, P.D. Microbial Succession and Flavor Production in the Fermented Dairy Beverage Kefir. mSystems 2016, 1, e00052-16. [Google Scholar] [CrossRef] [Green Version]
  20. Wang, H.; Sun, X.; Song, X.; Guo, M. Effects of kefir grains from different origins on proteolysis and volatile profile of goat milk kefir. Food Chem. 2021, 339, 128099. [Google Scholar] [CrossRef]
  21. Bourrie, B.C.T.; Ju, T.; Fouhse, J.M.; Forgie, A.J.; Sergi, C.; Cotter, P.D.; Willing, B.P. Kefir microbial composition is a deciding factor in the physiological impact of kefir in a mouse model of obesity. Br. J. Nutr. 2021, 125, 129–138. [Google Scholar] [CrossRef] [PubMed]
  22. Bourrie, B.C.; Cotter, P.D.; Willing, B.P. Traditional kefir reduces weight gain and improves plasma and liver lipid profiles more successfully than a commercial equivalent in a mouse model of obesity. J. Funct. Foods 2018, 46, 29–37. [Google Scholar] [CrossRef]
  23. de Almeida Brasiel, P.G.; Dutra Medeiros, J.; Barbosa Ferreira Machado, A.; Schuchter Ferreira, M.; Gouveia Peluzio, M.d.C.; Potente Dutra Luquetti, S.C. Microbial community dynamics of fermented kefir beverages changes over time. Int. J. Dairy Technol. 2021, 74, 324–331. [Google Scholar] [CrossRef]
  24. Kazou, M.; Grafakou, A.; Tsakalidou, E.; Georgalaki, M. Zooming Into the Microbiota of Home-Made and Industrial Kefir Produced in Greece Using Classical Microbiological and Amplicon-Based Metagenomics Analyses. Front. Microbiol. 2021, 12, 621069. [Google Scholar] [CrossRef]
  25. Zhang, Z.; Schwartz, S.; Wagner, L.; Miller, W. A greedy algorithm for aligning DNA sequences. J. Comput. Biol. 2000, 7, 203–214. [Google Scholar] [CrossRef]
  26. Mclaren, M.R.; Willis, A.D.; Callahan, B.J. Consistent and correctable bias in metagenomic sequencing experiments. eLife 2019, 8, e46923. [Google Scholar] [CrossRef]
  27. Karstens, L.; Asquith, M.; Davin, S.; Fair, D.; Gregory, W.T.; Wolfe, A.J.; Braun, J.; McWeeney, S. Controlling for Contaminants in Low-Biomass 16S rRNA Gene Sequencing Experiments. mSystems 2019, 4, e00290-19. [Google Scholar] [CrossRef] [Green Version]
  28. Metras, B.N.; Holle, M.J.; Parker, V.J.; Miller, M.J.; Swanson, K.S. Assessment of commercial companion animal kefir products for label accuracy of microbial composition and quantity. J. Anim. Sci. 2020, 98, skaa301. [Google Scholar] [CrossRef]
  29. Biçer, Y.; Telli, A.E.; Sönmez, G.; Turkal, G.; Telli, N.; Uçar, G. Comparison of commercial and traditional kefir microbiota using metagenomic analysis. Int. J. Dairy Technol. 2021, 74, 528–534. [Google Scholar] [CrossRef]
  30. Yegin, Z.; Yurt, M.N.Z.; Tasbasi, B.B.; Acar, E.E.; Altunbas, O.; Ucak, S.; Ozalp, V.C.; Sudagidan, M. Determination of bacterial community structure of Turkish kefir beverages via metagenomic approach. Int. Dairy J. 2022, 129, 105337. [Google Scholar] [CrossRef]
  31. Jian, C.; Luukkonen, P.; Yki-Järvinen, H.; Salonen, A.; Korpela, K. Quantitative PCR provides a simple and accessible method for quantitative microbiota profiling. PLoS ONE 2020, 15, e0227285. [Google Scholar] [CrossRef] [PubMed] [Green Version]
  32. García-Llatas, G.; Lagarda, M.J.; Romero, F.; Abellán, P.; Farré, R. A headspace solid-phase microextraction method of use in monitoring hexanal and pentane during storage: Application to liquid infant foods and powdered infant formulas. Food Chem. 2007, 101, 1078–1086. [Google Scholar] [CrossRef] [Green Version]
  33. Buttery, R.G.; Turnbaugh, J.G.; Ling, L.C. Contribution of volatiles to rice aroma. J. Agric. Food Chem. 1988, 36, 1006–1009. [Google Scholar] [CrossRef]
  34. Dertli, E.; Çon, A.H. Microbial diversity of traditional kefir grains and their role on kefir aroma. LWT—Food Sci. Technol. 2017, 85, 151–157. [Google Scholar] [CrossRef]
  35. Beshkova, D.M.; Simova, E.D.; Frengova, G.I.; Simov, Z.I.; Dimitrov, Z. Production of volatile aroma compounds by kefir starter cultures. Int. Dairy J. 2003, 13, 529–535. [Google Scholar] [CrossRef]
  36. Álvarez-Martín, P.; Flórez, A.B.; Hernández-Barranco, A.; Mayo, B. Interaction between dairy yeasts and lactic acid bacteria strains during milk fermentation. Food Control 2008, 19, 62–70. [Google Scholar] [CrossRef]
  37. Duran, F.E.; Özdemir, N.; Güneşer, O.; Kök-Taş, T. Prominent strains of kefir grains in the formation of volatile compound profile in milk medium; the role of Lactobacillus kefiranofaciens subsp. kefiranofaciens, Lentilactobacillus kefiri and Lentilactobacillus parakefiri. Eur. Food Res. Technol. 2022, 248, 975–989. [Google Scholar] [CrossRef]
  38. Beltrán-Barrientos, L.M.; Garcia, H.S.; Reyes-Díaz, R.; Estrada-Montoya, M.C.; Torres-Llanez, M.J.; Hernández-Mendoza, A.; González-Córdova, A.F.; Vallejo-Cordoba, B. Cooperation between Lactococcus lactis NRRL B-50571 and NRRL B-50572 for Aroma Formation in Fermented Milk. Foods 2019, 8, 645. [Google Scholar] [CrossRef] [Green Version]
  39. Gadaga, T. Growth characteristics of Candida kefyr and two strains of Lactococcus lactis subsp. lactis isolated from Zimbabwean naturally fermented milk. Int. J. Food Microbiol. 2001, 70, 11–19. [Google Scholar]
  40. Zajšek, K.; Goršek, A.; Kolar, M. Cultivating conditions effects on kefiran production by the mixed culture of lactic acid bacteria imbedded within kefir grains. Food Chem. 2013, 139, 970–977. [Google Scholar] [CrossRef]
  41. Wu, Q.; Cheung, C.K.; Shah, N.P. Towards galactose accumulation in dairy foods fermented by conventional starter cultures: Challenges and strategies. Trends Food Sci. Technol. 2015, 41, 24–36. [Google Scholar] [CrossRef]
  42. Grønnevik, H.; Falstad, M.; Narvhus, J.A. Microbiological and chemical properties of Norwegian kefir during storage. Int. Dairy J. 2011, 21, 601–606. [Google Scholar] [CrossRef]
  43. Delgado-Fernández, P.; Corzo, N.; Lizasoain, S.; Olano, A.; Moreno, F.J. Fermentative properties of starter culture during manufacture of kefir with new prebiotics derived from lactulose. Int. Dairy J. 2019, 93, 22–29. [Google Scholar] [CrossRef] [Green Version]
  44. Verhue, W.M.; Tjan, F.S.B. Study of the Citrate Metabolism of Lactococcus lactis subsp. lactis Biovar Diacetylactis by Means of 13C Nuclear Magnetic Resonance. Appl. Environ. Microbiol. 1991, 57, 3371–3377. [Google Scholar]
  45. Comitini, F.; Gobbi, M.; Domizio, P.; Romani, C.; Lencioni, L.; Mannazzu, I.; Ciani, M. Selected non-Saccharomyces wine yeasts in controlled multistarter fermentations with Saccharomyces cerevisiae. Food Microbiol. 2011, 28, 873–882. [Google Scholar] [CrossRef] [PubMed]
  46. Vancov, T.; Keen, B. Amplification of soil fungal community DNA using the ITS86F and ITS4 primers. FEMS Microbiol. Lett. 2009, 296, 91–96. [Google Scholar] [CrossRef] [PubMed] [Green Version]
  47. Shi, Y.; Cheng, Y.; Wang, Y.; Zhang, G.; Gao, R.; Xiang, C.; Feng, J.; Lou, D.; Liu, Y. Investigation of the fungal community structures of imported wheat using high-throughput sequencing technology. PLoS ONE 2017, 12, e0171894. [Google Scholar] [CrossRef]
  48. Abarenkov, K.; Henrik Nilsson, R.; Larsson, K.H.; Alexander, I.J.; Eberhardt, U.; Erland, S.; Høiland, K.; Kjøller, R.; Larsson, E.; Pennanen, T.; et al. The UNITE database for molecular identification of fungi--recent updates and future perspectives. New Phytol. 2010, 186, 281–285. [Google Scholar] [CrossRef]
Figure 1. Counts of major bacteria and yeast species per unit of beverage (mL) or grain (g) fraction of five traditional kefirs after 47 ± 1 h of fermentation and three commercial kefirs (CK1, CK2,CK3) using qPCR. Bacteria in grain, Bacteria in beverage, Yeast in grain, and Yeast in beverage fractions, respectively. Bars represent mean ± standard deviation (n = 3).
Applsci 12 03838 g001
Figure 2. Diversity of bacterial species in (A), traditional kefirs FN, LS, PN1, PN2, PN3 in grains (G) and beverages (B) after 47 ± 1 h of fermentation and (B), commercial kefirs (CK1 = Brandenburg, CK2 = Müller, CK3 = Andechser Natur).
Applsci 12 03838 g002
Figure 3. Diversity of fungal species in (A), traditional kefirs FN, LS, PN1, PN2, PN3 in grains (G) and beverages (B) after 47 ± 1 h of fermentation and (B), commercial kefirs (CK1 = Brandenburg, CK2 = Müller, CK3 = Andechser Natur).
Applsci 12 03838 g003
Figure 4. Hierarchical cluster analysis for VOCs analysis of commercial yogurt (CY1 and CY2), commercial kefirs (CK1, CK2, and CK3) and grain-based kefirs (LS, FN, PN1, PN2, and PN3), showing the peak volume (abundance) of each substance. The grain-based kefir was analyzed after 47 ± 1 h of fermentation.
Applsci 12 03838 g004
Table 1. Concentration of targeted metabolites in commercial kefirs and beverage fraction of traditional kefirs after 23 ± 1 and 47 ± 1 h of fermentation.
SampleFermen-Tation Time (h)Lactose
(g L−1)
Glucose
(mg L−1)
Galactose
(mg L−1)
Lactate
(g L−1)
Acetate
(mg L−1)
Glycerol
(mg L−1)
PN123 ± 133.6 ± 5.7 ab133.3 ± 82.6 ab149.3 ± 58.0 bc1.7 ± 1.1 c328.4 ± 60.5 c297.7±58.4 b
47 ± 19.2 ± 5.4 c25.1 ± 3.6 a23.2 ± 8.7 d3.2 ± 0.1 b778.8 ± 68.8 a682.2±95.7 c
PN223 ± 137.2 ± 2.0 a197.2 ± 52.8 b266.3 ± 35.5 b1.7 ± 0.3 c459.5 ± 29.8 b232.0±30.0 b
47 ± 115.3 ± 3.4 c29.6 ± 0.5 a21.8 ± 10.2 d3.9 ± 0.4 b944.5 ± 15.2 a538.1±76.1 c
PN323 ± 137.6 ± 2.8 a176.5 ± 74.0 b368.8 ± 112.5 b1.2 ± 0.2 c300.2 ± 21.8 c253.9±20.1 b
47 ± 114.1 ± 1.7 c27.0 ± 4.2 a12.6 ± 1.7 d3.3 ± 0.6 b846.9 ± 58.2 a639.4±37.2 c
FN23 ± 140.3 ± 2.0 a203.5 ± 76.9 b228.7 ± 61.4 b1.3 ± 0.1 c372.8 ± 82.3 bc191.0±56.9 b
47 ± 137.6 ± 5.3 a52.2 ± 36.0 a33.2 ± 21.2 d3.3 ± 0.4 b720.7 ± 101.3 a186.4±45.6 b
LS23 ± 137.4 ± 2.4 a120.0 ± 54.2 ab61.0 ± 32.5 cd1.7 ± 0.3 c326.5 ± 108.6 c22.2±6.0 a
47 ± 130.8 ± 0.5 b26.0 ± 1.6 a11.7 ± 1.1 d4.8 ± 0.1 b613.7 ± 68.9 a19.7±4.7 a
CK144.7 ± 7.433.2 ± 0.8664.1 ± 12.87.0 ± 0.7745.6 ± 44.028.0 ± 1.6
CK242.0 ± 2.723.0 ± 0.9352.8 ± 44.27.1 ± 1.2584.4 ± 105.623.3 ± 1.2
CK339.8 ± 3.079.5 ± 15.5799.4 ± 19.57.6 ± 0.8810.1 ± 84.625.2 ± 5.9
CK-average42.2 ± 4.3 a45.1 ± 5.9 a605.7 ± 25.5 a7.3 ± 0.9 a713.3 ± 84.2 a25.5 ± 5.9 a
Milk *47.2 ± 0.398.2 ± 2.9<TEST RNG #<TEST RNG<TEST RNG<TEST RNG
Values (mean ± SD, n = 3) in the same column followed by different superscript letters (a, b, …) indicate significant differences (p < 0.05) between traditional kefirs and the mean value of three commercial kefirs for the same metabolite. * Milk values were not included in statistical analysis of commercial and tradional kefirs. # Lower than the detection limit of the corresponding method
Publisher’s Note: MDPI stays neutral with regard to jurisdictional claims in published maps and institutional affiliations.

