Abstract
The aim of this study was to determine the morphogeometric patterns of the interforaminal region from cone beam computed tomography (CBCT) scans of individuals with total mandibular edentulism. CBCT images were obtained from 40 patients with total edentulism who are older (12 men and 28 women; average age of 69.5 ± 9.4 years) and who wore a non-implant-supported, lower, removable, total prosthesis. We conducted a two-dimensional (2D) morphogeometric analysis of the Digital Imaging and Communication in Medicine (DICOM) files from the CBCT scans, and five equidistant cross sections were planned. For the three-dimensional (3D) morphogeometric analysis, standard triangular language (STL) files were obtained after segmentation of the interforaminal mandibular region, and four anatomical landmarks and their respective curves were digitized. The patterns among the shapes were determined using principal component analysis (PCA) on MorphoJ software (version 1.07a). The results of the 2D morphogeometric analyses for PCA of the interforaminal mandibular paramedian region were PC1 or elongated drop shape, 54.78%; PC2 or wineskin shape, 17.65%; PC3 or pear shape, 11.77%; and PC4 or eggplant shape, 5.71%, and those for PCA of the symphyseal region were PC1 or elongated drop shape, 62.13%; PC2 or ovoid shape, 11.64%; PC3 or triangular shape, 9.71%; and PC4 or tuber shape, 4.96%. The results of the 3D morphogeometric analyses for the interforaminal hemimandibular region were PC1, 59.83%; PC2, 10.39%; PC3, 7.67%; and PC4, 5.09%. This study provides relevant information for future clinical guidelines on prosthetics and implants, in addition to proposing the use of new technologies that support diagnosis and treatment in patients with edentulism.
1. Introduction
Edentulism is defined as complete loss of the entire dentition [1]. Anatomically, edentulous jaws and maxilla are characterized by loss of the alveolar process [2]. A series of classifications that describe the morphology and severity of bone resorption of the edentulous ridges have been documented in the literature.
In 1963, Atwood used a micrograph technique to describe a series of changes in shape and height that the residual ridge undergoes [3]. In general, changes in the shape of the alveolar process follow a predictable pattern. The loss of teeth invariably leads to residual alveolar ridge atrophy; this process has been described as irreversible, chronic, progressive, and cumulative [4,5]. With the use of conventional morphometry, in 1985, bone defects at the edentulous site were characterized into five classes on the basis of the volume of the remaining bone in comparison with its height [6]. Then, in 1988, a classification of edentulous jaws was developed on the basis of a randomized cross-sectional study of 300 dry skulls. It was stated that, while the shapes of the basal processes of the mandible and the maxilla remained relatively stable, the changes in the shape of the alveolar processes were significant in the vertical and horizontal axes, in both the anterior and posterior mandibular regions [7].
In the 21st century, a new study observed the natural course of edentulism using cadaveric material from medieval settlements to analyze the morphology of the residual ridge through conventional radiographs [8]. The authors of this new study found similar findings to the results of the aforementioned study when using the classification of bone atrophy described by Atwood, Cawood, and Howell [3,7].
Considering the multiple classifications of mandibular bone morphology that have been developed through conventional morphometric methods [3,4,5,6,7,8,9,10], the anatomy of the interforaminal mandibular region has not yet been fully described. Due to the growing interest in the mandibular interforaminal region generated using endosseous implants [11,12], the analysis of variations in the mandibular interforaminal morphology is of special importance, because it allows for the identification of potential risks or contraindications for surgery, especially the installation of implants in this particular region [13].
The most common surgical errors are related to poor positioning or angulation of the implant, with subsequent aesthetic and biomechanical damage [14]. To avoid accidents and complications, correct pre-surgical planning is essential. The use of cross-sectional imaging, specifically CBCT, is recommended for planning implant placement [14].
CBCT is the latest, cost-effective and accurate in vivo imaging technique that provides localization of relevant anatomical structures such as the mandibular incisive canal, lingual foramen, and mental nerve prior to the dental procedure, since it is recognized that surgical trauma is possible [15,16]. Thus, implant-related injuries represent a risk of damaging neurovascular structures, particularly considering that they can cause sensorineural disturbance and pain [14,16]. Besides, CBCT allows clinicians to create and visualize the final result in a three-dimensional manner before starting the treatment in the interforaminal region of the mandible, and to analyze multiple treatment scenarios until the optimal treatment plan is adopted [17,18].
A better understanding of this anatomical region will facilitate planning of implant support prosthesis, protocols of bone drilling, and regenerative therapies. Therefore, the aim of this pilot study was to determine the morphogeometric patterns of the interforaminal mandibular region from cone beam computed tomography (CBCT) scans in individuals with total mandibular edentulism.
2. Materials and Methods
2.1. Sample Selection
A descriptive pilot study was carried out for a finite population from a total of 40 CBCT scans of patients with mandibular edentulism treated between 2016 and 2021 at the Dental School of Universidad de La Frontera, Temuco, Chile. A total of 12 men and 28 women were analyzed, with an average age of 69.5 ± 9.4 years and an age range of 44–86 years. Images were captured with the Pax Zenith CBCT (Vatech, Yogin, Korea, 2011) at 90 kV and 120 mA, 12 × 9 cm field of view (FOV), and voxel size of 0.2 mm for 24 s. The patients’ scans were saved in DICOM format and collected retrospectively.
The inclusion criteria were as follows: adults with total mandibular edentulism; male or female with controlled systemic diseases; and users of a non-implant-supported, lower, removable, total prosthesis for at least 6 months. The exclusion criteria were as follows: adult patients with uncontrolled systemic diseases, prolonged treatment with immunosuppressive drugs or bisphosphonates, maxillofacial trauma, syndromic disorders of the maxillomandibular region, failed therapy of dental implants in the anterior region of the mandible, scans with radiographic noise, and treatment with guided bone regeneration in the anterior region of the mandible. From this library of DICOM files obtained from the CBCT images, we performed a morphogeometric analysis. This study was approved by the Scientific Ethics Committee of the Universidad de La Frontera, Temuco, Chile (Certificate No. 129_20, Folio Number 108/20).
2.2. Reliability and Reproducibility of the Measurements
The intra-observer reliability and reproducibility were assessed by calculating the intraclass correlation coefficient (ICC). From a subsample of 12 DICOM files, two calibrated researchers performed the 2D and 3D measurements, with an interval of 1 week between each analysis. The coordinates obtained were transferred to a Microsoft® Office 365 Excel spreadsheet (Microsoft Corp) and then exported to IBM® SPSS® Statistics software, version 25.0 (IBM Corp., Chicago, IL, USA), for statistical evaluation.
2.3. 2D Dataset Digitization
Cross sections of the interforaminal mandibular region from the CBCT images of the sample were obtained using the Blue Sky Plan, version 4.8.41 (Blue Sky Bio®, Libertyville, IL, USA), visualization and planning software. In the axial plane, 4 interforaminal paramedian cross sections were generated and standardized from the symphysis at an equidistance of 8 mm, obtaining 200 sections. The total captures were indexed in a separate thin-plate spline (TPS) file for interforaminal paramedian cross sections and symphyseal cross sections, using tpsUtil software, version 1.78 [19]. In tpsDig2 software, version 2.31 [20], the curves were manually digitized clockwise, starting with the highest point of the alveolar ridge on the lingual side and ending at the highest point at the buccal level. Each contour obtained was resampled with 35 equidistant points (Figure 1).
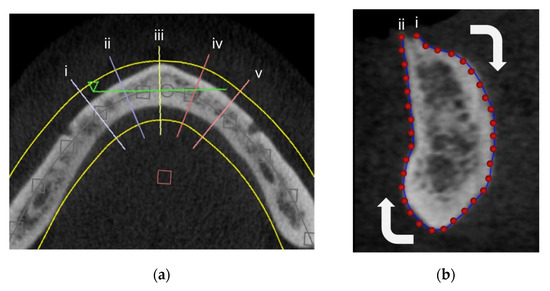
Figure 1.
Two-dimensional digitization. (a) Interforaminal cross sections in the axial view for (i,ii,iv,v) paramedian sections and (iii) a symphysis section. (b) Curve digitization in tpsDig: (i) starting point and (ii) end point.
2.4. 2D Morphogeometric Analysis
The XY coordinates stored in the TPS files of the 160 interforaminal mandibular paramedian cross sections and 40 symphyseal cross sections were independently analyzed using MorphoJ software, version 1.07a [21]. A Procrustes fit and a subsequent PCA were carried out in order to group the morphogeometric patterns obtained.
2.5. 3D Dataset Digitization
For the 3D digitization of the mandibular interforaminal region, segmentation of the bone tissue in the anterior mandibular region from the DICOM files was carried out, establishing a value in greyscale of 750, allowing for the generation of 3D models in standard triangular language (STL) format of all bone tissue with adequate resolution. From the 3D models, we generated 80 hemimandibles; the right hemimandible was inverted. Reference landmarks (Table 1) and curves with sliding semi-landmarks were digitized using 3D Slicer software, version 4.11 [22], considering the following sequence (Figure 2):

Table 1.
Reference landmarks.
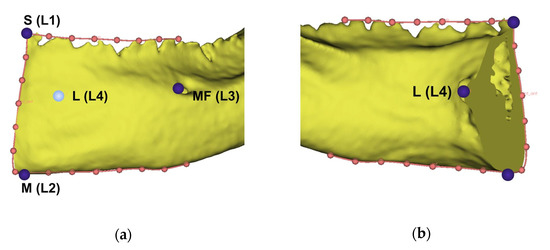
Figure 2.
Three-dimensional landmarks and curves digitized on the interforaminal hemimandibular region. (a) Buccal view; (b) lingual view.
The upper curve was digitized on the alveolar ridge, starting at the highest point in the symphysis (L1) and ending in a parallel point at the level of the posterior margin of the mental foramen. Subsequently, a curve was delimited at the basal level, between the menton (L2) and a parallel point at the level of the posterior margin of the mental foramen. An anterior curve at the level of the symphysis was outlined between landmarks 1 and 2. All curves were resampled at 8 equidistant points, and the coincident points of the curves were not included. Finally, the mental foramen (L3) and a medial point between mental spines (L4) were digitized.
2.6. 3D Morphogeometric Analysis
The XYZ coordinates obtained from the landmarks and curves with sliding semi-landmarks were indexed in a TPS file and were subsequently analyzed using the MorphoJ software, version 1.07a. A Procrustes fit and PCA were performed in order to obtain the morphogeometric patterns. Procrustes fit is defined as the average of the shapes of all of the individuals analyzed, with the variables corrected for translation, rotation, and scale of the analyzed data set [23].
3. Results
This study included 40 CBCT scans of patients from whom we analyzed 160 interforaminal mandibular paramedian and 40 mandibular symphyseal cross sections for the 2D morphogeometric analysis. For the 3D morphogeometric analysis, 80 hemimandibles were used.
The intra-observer reliability and reproducibility were obtained via the ICC. For 2D and 3D coordinate digitization, a high concordance was shown between the two operators (2D: 0.998 and 3D: 0.999).
For the first part of the 2D morphogeometric analysis, the PCA of the cross sections of the mandibular interforaminal region, excluding the symphysis region, identified four principal components (PCs), wherein four PCs explained approximately 84% of the cumulative variance. The shape variations are presented in Figure 3. PC1 explained 54.78% of the total variance, followed by PC2 (17.65%), PC3 (11.77%), and, finally, PC4 (5.71%).
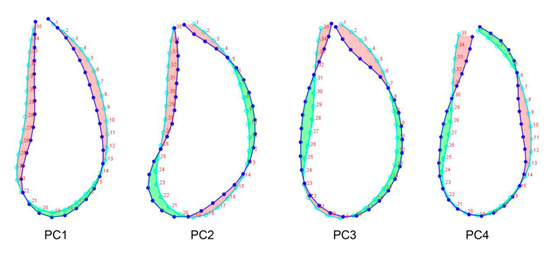
Figure 3.
Principal components of the cross-sections of the mandibular interforaminal region. Light blue line: Procrustes fit, blue line: PCs. Red area: atrophy; Green area: protrusion. A parallel line to point 11 was drawn to divide the cross section into a suprabasal and basal zone.
In general, all PCs revealed different resorption patterns of the cortical bone that defines the interforaminal mandibular region, in comparison with Procrustes fit.
PC1 or elongated drop shape is described as homogeneous bone resorption along the buccal and lingual bone plates of the alveolar process and the basal zone. This resorption pattern was thinner than the Procrustes fit.
PC2 or wineskin shape is described as more marked bone resorption of the buccal plate from the suprabasal area, with a reabsorption pattern that resembles a slight protrusion of the buccal basal area.
PC3 or pear shape is described as a marked sharpening of the crestal area and widening of the basal zone.
PC4 or eggplant shape is described as buccal ridge atrophy and a resorption pattern that resembles a lingual protrusion; in the suprabasal area, a lingual atrophy and buccal protrusion were observed, keeping basal area constant.
The second part of the 2D morphogeometric analysis was performed in the cross sections of the symphysis region. In this analysis, four PCs were identified, representing approximately 83% of the cumulative variance. PC1 explained 62.13% of the total variance, followed by PC2 (11.64%), PC3 (9.71%), and PC4 (4.96%). The patterns among the shapes are shown in Figure 4.
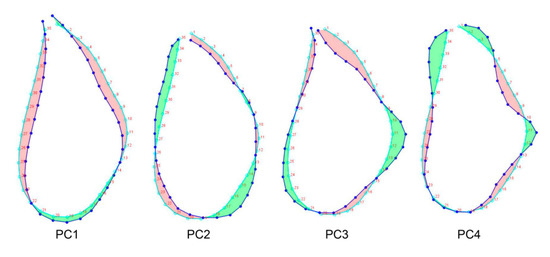
Figure 4.
Principal components of the cross-sections of the symphysis region. Light blue line: Procrustes fit, Blue line: PCs. Red area: atrophy; Green area: protrusion.
PC1 or elongated drop shape is described as a suprabasal atrophy and a wider base.
PC2 or ovoid shape is described as an ovoid shape with a slight protrusion in the buccal plate in the suprabasal area. The basal area presented atrophy of the buccal zone and a wider lingual area.
PC3 or triangular shape is described as a sharpening of the crestal area of the alveolar process and a wider basal zone with a tendency for lingual protrusion.
PC4 or tuber shape is described as a wider crestal area than the Procrustes fit with a lingual protrusion of the suprabasal area, keeping the basal area constant.
For 3D morphogeometric analysis, the PCA of the mandibular interforaminal region identified four PCs, shown in Figure 5, wherein they represent about 83% of the cumulative variance. PC1 explained 59.83% of the total variation, followed by PC2 (10.39%), PC3 (7.67%), and PC4 (5.09%).
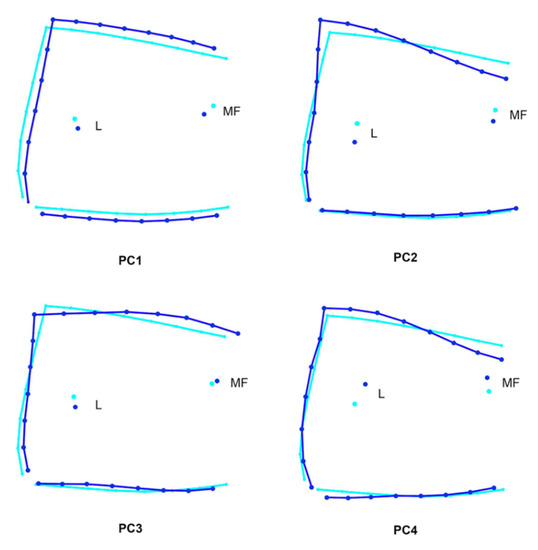
Figure 5.
Three-dimensional morphogeometric analysis. Principal components of the interforaminal hemimandible region from a lateral view. Light blue line: procrustes fit; blue line: PCs.
PC1 is described as greater atrophy of the buccal bone plate. The basal line was observed to be inferior to the Procrustes fit, while in the crestal line, a smaller atrophy was observed. The L and MF landmarks were observed as being lower than the Procrustes fit.
PC 2 is described as minor atrophy of the buccal bone plate. The basal line remained constant. The crestal line was oblique and ascending. The L and MF landmarks were observed as being lower than the Procrustes fit.
PC3: The buccal bone plate as well as the basal and crestal lines remained constant. The L landmark was located lower than the Procrustes fit, and the MF landmark was above the Procrustes fit.
PC4: The buccal bone plate as well as the basal line remained constant. The crestal line was oblique and ascending. The L and MF landmarks were observed as being higher than the Procrustes fit.
4. Discussion
The present study reported the use of different digital tools in a precise workflow to determine the morphogeometric patterns of the interforaminal mandibular region from CBCT scans. Precision is important in allowing for correct identification of the location and demarcation of anatomical landmarks for export and correct processing of coordinates in geometric morphometry methodologies [24]. In addition, clinically, the landmarks used in this study were based on anatomical references of relevance in routine implant surgery of the mandibular interforaminal region. This study has clinical importance in the development of surgical and prosthetic procedures in the field of oral implantology.
Similar research has been conducted on the interforaminal mandibular region through standardized measurements with the aim of determining the remaining bone availability, relevant anatomical structures in relation to dental implant surgeries, and possible complications [12,13,24,25,26,27]. On this regard, a recent study evaluated the bone quantity and quality of this anatomical region by directly performing measurements in CBCT scans but, different to what was done in our study, these results were based in dentated patients [28]. However, geometric morphometry from CBCT scans has rarely been used. The digitization protocol used in this study standardizes data acquisition through the use of a single acquisition source of CBCT images, a lower number of type 1 landmarks, and curves with sliding semi-landmarks. This data acquisition protocol ensures the standardization and precision of the process, unlike other capture and measurement protocols that have been described in the literature that could lead to wrong conclusions [29,30]. In addition, the methodology in the present pilot study was not critical in terms of the number of landmarks used in 3D morphogeometric analysis. In this context, we digitized four landmarks that depended on the availability according to the CBCT images’ FOV, in comparison with other research that used a relatively higher number of landmarks [30,31,32,33,34].
From a clinical point of view, the use of CBCT scans in dental implant planning in the interforaminal mandibular region is an advantage because these devices reduce radiation exposure in the image capture while maintaining an adequate voxel resolution and accurate measurements [35,36]. This type of routine clinical imaging used in dentistry is also presented as a tool to perform studies that analyze variations in maxillo-mandibular bone morphology in a descriptive and qualitative manner, potentially facilitating clinical decision making. All of these features lead to the best surgical and prosthetic treatment for the benefit of patients. Our study, which describes the bone morphology of this region, is presented as a complement to recent publications that have qualitatively analyzed this region in edentulous patients through CBCT scans [37].
In the 2D analysis of the paramedian cross sections, variations were observed in the basal and suprabasal zones on the four PCs. In addition, the most frequently found reabsorption pattern was PC1 or the elongated drop shape, which presented a sharpening of the crestal area of the alveolar process, similar to PC3 or the triangular shape. On the basis of these findings, we suggest that bone grafting procedures or installation of narrow implants could be planned for PC1 or PC3. In the symphysis area, we found four morphogeometric patterns, with the elongated drop shape or PC1 being the most frequently observed. Our analysis suggests that the area of the symphysis maintains a bone availability that would allow for the insertion of standard diameter dental implants. Moreover, it is noteworthy that, in the 2D analysis of the symphysis and paramedian cross sections, all patterns of bone resorption presented some degree of bone atrophy in the crestal, suprabasal, and basal areas, involving the buccal and lingual bone plates. In this sense, it is important to consider the PC1 and PC4 (elongated drop and eggplant shapes, respectively) in the paramedian cross sections as well as PC1 (elongated drop shape) in symphysis, showing slight concavity produced by the resorption of the lingual bone plate in the interforaminal mandibular region, which could increase the risk of perforation during bone implant drilling. This surgical complication can lead to extensive bleeding from the sublingual vessels during implant site preparation [12].
Three-dimensional geometric morphometry using principal component analysis has been performed to study the morphological variations in cadaveric mandibles [32]. Subsequently, the same authors found that conventional morphometry and geometric morphometry quantifying morphological variations in the mandible were consistent in terms of morphological variability among the dentate, partially edentate, and totally edentate groups [33]. In contrast, we applied a similar methodology but only in edentulous patients during routine dental examination in order to evaluate if the patient is an optimal candidate for receiving an implant-assisted prosthesis. The 3D results showed that PC1 or the elongated drop shape resorbs less bone vertically between the crestal area and basal line in relation to Procrustes fit of the hemimandibular region from a lateral view. Moreover, PC1 was the most frequently found shape. In this context, the bone crest regularization technique is often used for the installation of dental implants in the interforaminal mandibular region.
Our methodology used a reproducible digital workflow to perform a morphogeometric analysis in a group of patients with total mandibular edentulism. We were able to determine 2D and 3D morphogeometric patterns of the interforaminal mandibular morphology that can serve as future implant and prosthetic orientation guidelines.
5. Conclusions
Therefore, the comprehensive CBCT examination and simple classification of the interforaminal mandibular morphology proposed in this study could facilitate treatment planning and the determination of a safe 3D position for correct implant installation. For future research, we suggest increasing the number of patients included in the CBTC scan analyses. Also, we propose that future investigations analyze both shape and quality of the interforaminal mandibular morphology as a whole in order to bring up new classifications that take both parameters into consideration.
Author Contributions
Conceptualization: V.B., P.A.-M. and L.A.; research, methodology, and supervision: L.A., P.A.-M., C.S.-L. and V.B.; patient enrollment and CBTC collection: L.A.; original draft: L.A., P.A.-M., C.S.-L. and V.B.; image and photo work: P.A.-M.; composition: L.A., P.A.-M., C.S.-L. and V.B.; writing—review and editing: L.A., P.A.-M., C.S.-L. and V.B. All authors have read and agreed to the published version of the manuscript.
Funding
This research did not receive any specific grants from funding agencies in the public, commercial, or non-profit sectors.
Institutional Review Board Statement
This study was conducted in accordance with the Declaration of Helsinki, and the ethical approval of the study was granted by the Ethics Committee of the Universidad de La Frontera, Folio Number 108/20.
Informed Consent Statement
Informed consent was obtained from all subjects involved in the study.
Data Availability Statement
Datasets used to create the reported results are available at https://gitlab.com/cidic-ufro/edentulous-morphometrics accessed on 7 April 2022.
Acknowledgments
We appreciate the Implant Clinic of the School of Dentistry, Universidad de La Frontera, Temuco, Chile, for their collaboration. Moreover, we thank Pablo Navarro for collaborating on the interpretation of the statistical analysis.
Conflicts of Interest
No relevant potential conflict of interest are reported for this article.
References
- The Glossary of Prosthodontic Terms: Ninth Edition. J. Prosthet. Dent. 2017, 117, e1–e105. [CrossRef] [Green Version]
- Lindhe, J.; Lang, N.P.; Berglundh, T.; Giannobile, W.V.; Sanz, M. Clinical Periodontology and Implant Dentistry, 6th ed.; Wiley-Blackwell: Hoboken, NJ, USA, 2015; pp. 1–1480. [Google Scholar]
- Atwood, D.A. Postextraction changes in the adult mandible as illustrated by microradiographs of midsagittal sections and serial cephalometric roentgenograms. J. Prosthet. Dent. 1963, 13, 810–824. [Google Scholar] [CrossRef]
- Atwood, D.A.; Coy, W.A. Clinical, cephalometric, and densitometric study of reduction of residual ridges. J. Prosthet. Dent. 1971, 26, 280–295. [Google Scholar] [CrossRef]
- Atwood, D.A. Reduction of residual ridges: A major oral disease entity. J. Prosthet. Dent. 1971, 26, 266–279. [Google Scholar] [CrossRef]
- Lekholm, U. Patient selection and preparation. In Tissue-Integrated Prosthesis: Osseointegration in Clinical Dentistry; Quintessence Publishing Co. Inc.: Chicago, IL, USA, 1985; pp. 199–211. [Google Scholar]
- Cawood, J.I.; Howell, R.A. A classification of the edentulous jaws. Int. J. Oral. Maxillofac. Surg. 1988, 17, 232–236. [Google Scholar] [CrossRef]
- Reich, K.M.; Huber, C.D.; Lippnig, W.R.; Ulm, C.; Watzek, G.; Tangl, S. Atrophy of the residual alveolar ridge following tooth loss in an historical population. Oral. Dis. 2011, 17, 33–44. [Google Scholar] [CrossRef] [PubMed] [Green Version]
- Seibert, J.S. Reconstruction of deformed, partially edentulous ridges, using full thickness onlay grafts. Part I. Technique and wound healing. Compend. Contin. Educ. Dent. 1983, 4, 437–453. [Google Scholar] [PubMed]
- Misch, C.E.; Judy, K.W. Classification of partially edentulous arches for implant dentistry. Int. J. Oral. Implantol. 1987, 4, 7–13. [Google Scholar]
- Cordaro, M.; Donno, S.; Ausenda, F.; Cordaro, L. Influence of Bone Anatomy on Implant Placement Procedures in Edentulous Arches of Elderly Individuals: A Cross-Sectional Study on Computed Tomography Images. Int. J. Oral. Maxillofac. Implants 2020, 35, 995–1004. [Google Scholar] [CrossRef]
- Kusum, C.K.; Mody, P.V.; Indrajeet, D.N.; Rao, S.K.; Wankhade, B.G. Interforaminal hemorrhage during anterior mandibular implant placement: An overview. Dent. Res. J. (Isfahan) 2015, 12, 291–300. [Google Scholar] [CrossRef]
- Quirynen, M.; Mraiwa, N.; van Steenberghe, D.; Jacobs, R. Morphology and dimensions of the mandibular jaw bone in the interforaminal region in patients requiring implants in the distal areas. Clin. Oral. Implants Res. 2003, 14, 280–285. [Google Scholar] [CrossRef] [PubMed]
- Gaêta-Araujo, H.; Oliveira-Santos, N.; Mancini, A.X.M.; Oliveira, M.L.; Oliveira-Santos, C. Retrospective Assessment of Dental Implant-Related Perforations of Relevant Anatomical Structures and Inadequate Spacing between Implants/Teeth Using Cone-Beam Computed Tomography. Clin. Oral. Investig. 2020, 24, 3281–3288. [Google Scholar] [CrossRef] [PubMed]
- Mashyakhy, M.; Mostafa, A.; Abeery, A.; Sairafi, Z.; Hakami, N.; Alroomy, R.; Chohan, H.; Abu-Melha, A. Structural Features of the Mental Foramen in a Saudi Subpopulation: A Retrospective CBCT Study. Biomed Res. Int. 2021, 2021, 1–7. [Google Scholar] [CrossRef] [PubMed]
- Sener, E.; Onem, E.; Akar, G.C.; Govsa, F.; Ozer, M.A.; Pinar, Y.; Mert, A.; Baksi Sen, B.G. Anatomical Landmarks of Mandibular Interforaminal Region Related to Dental Implant Placement with 3D CBCT: Comparison between Edentulous and Dental Mandibles. Surg. Radiol. Anat. 2018, 40, 615–623. [Google Scholar] [CrossRef] [PubMed]
- Zhang, S.; Jiang, B.; Shi, H. Jawbone Segmentation with Trabecular Bone Preservation from Cone Beam CT Images. Appl. Sci. 2022, 12, 1556. [Google Scholar] [CrossRef]
- Worthington, P.; Rubenstein, J.; Hatcher, D.C. The Role of Cone-Beam Computed Tomography in the Planning and Placement of Implants. J. Am. Dent. Assoc. 2010, 141, 19S–24S. [Google Scholar] [CrossRef] [PubMed]
- Rohlf, F.J. tpsUtil; Version 1.78; Department of Ecology and Evolution, Stony Brook University: New York, NY, USA, 2019. [Google Scholar]
- Rohlf, F.J. tpsDig2; Version 2.31; Department of Ecology and Evolution, Stony Brook University: New York, NY, USA, 2017. [Google Scholar]
- Klingenberg, C.P. MorphoJ: An integrated software package for geometric morphometrics. Mol. Ecol. Resour. 2011, 11, 353–357. [Google Scholar] [CrossRef]
- Fedorov, A.; Beichel, R.; Kalpathy-Cramer, J.; Finet, J.; Fillion-Robin, J.C.; Pujol, S.; Bauer, C.; Jennings, D.; Fennessy, F.; Sonka, M.; et al. 3D Slicer as an image computing platform for the Quantitative Imaging Network. Magn. Reson. Imaging 2012, 30, 1323–1341. [Google Scholar] [CrossRef] [Green Version]
- Kendall, D.G. The diffusion of shape. Adv. Appl. Prob. 1977, 9, 428–430. [Google Scholar] [CrossRef]
- Parnia, F.; Moslehifard, E.; Hafezeqoran, A.; Mahboub, F.; Mojaver-Kahnamoui, H. Characteristics of anatomical landmarks in the mandibular interforaminal region: A cone-beam computed tomography study. Med. Oral. Patol. Oral. Cir. Bucal. 2012, 17, e420–e425. [Google Scholar] [CrossRef] [Green Version]
- Bulut, D.G.; Köse, E. Available bone morphology and status of neural structures in the mandibular interforaminal region: Three-dimensional analysis of anatomical structures. Surg. Radiol. Anat. 2018, 40, 1243–1252. [Google Scholar] [CrossRef] [PubMed]
- Wright, R.A.; Bidra, A.S.; Kuo, C.L. An analysis of anterior mandibular anatomy by using cone beam computed tomography: A study of 225 mandibular images. J. Prosthet. Dent. 2020, 123, 595–601. [Google Scholar] [CrossRef] [PubMed]
- Fouda, S.M.; Ellakany, P.; Madi, M.; Zakaria, O.; Al-Harbi, F.A.; El Tantawi, M. Do Morphological Changes in the Anterior Mandibular Region Interfere with Standard Implant Placement? A Cone Beam Computed Tomographic Cross-Sectional Study. Sci. World J. 2020, 2020, 1–7. [Google Scholar] [CrossRef]
- Safi, Y.; Amid, R.; Kadkhodazadeh, M.; Mortazavi, H.; Sharifi, M.P.; Gandomi, S. Bone quality and quantity of the mandibular symphyseal region in autogenous bone grafting using cone-beam computed tomography: A cross-sectional study. Head Face Med. 2021, 17, 26. [Google Scholar] [CrossRef]
- Cardini, A. Less tautology, more biology? A comment on “high-density” morphometrics. Zoomorphology 2020, 139, 513–529. [Google Scholar] [CrossRef]
- Evin, A.; Bonhomme, V.; Claude, J. Optimizing digitalization effort in morphometrics. Biol. Methods Protoc. 2020, 5, 1–10. [Google Scholar] [CrossRef]
- Varga, V.; Raith, S.; Loberg, C.; Modabber, A.; Bartella, A.K.; Holzle, F.; Fischer, H.; Steiner, T. Classification of the level of mandibular atrophy—A computer-assisted study based on 500 CT scans. J. Craniomaxillofac. Surg. 2017, 45, 2061–2067. [Google Scholar] [CrossRef]
- Guevara Perez, S.V.; De la Rosa Castolo, G.; Thollon, L.; Behr, M. A 3D characterization method of geometric variation in edentulous mandibles. Morphologie 2018, 102, 255–262. [Google Scholar] [CrossRef]
- Guevara Perez, S.V.; Behr, M.; Thollon, L. Exploratory study of the three-dimensional morphological variation of the jaw associated to teeth loss. J. Stomatol. Oral. Maxillofac. Surg. 2019, 120, 523–528. [Google Scholar] [CrossRef]
- Vallabh, R.; Zhang, J.; Fernandez, J.; Dimitroulis, G.; Ackland, D.C. The morphology of the human mandible: A computational modelling study. Biomech. Model. Mechanobiol. 2020, 19, 1187–1202. [Google Scholar] [CrossRef]
- Jacobs, R.; Salmon, B.; Codari, M.; Hassan, B.; Bornstein, M.M. Cone beam computed tomography in implant dentistry: Recommendations for clinical use. BMC Oral. Health 2018, 18, 1–16. [Google Scholar] [CrossRef] [PubMed] [Green Version]
- Hartshorne, J. Essential guidelines for using cone beam computed tomography (CBCT) in implant dentistry. Part 3: Radiation dose, risks, safety, ethical and medico-legal considerations. Int. Dent. Afr. Ed. 2018, 8, 26–34. [Google Scholar]
- Safi, Y.; Amid, R.; Vasegh, Z.; Ahsaie, M.G. A New Classification of Anterior Mandible Edentulous Ridge Based on Cone Beam Computed Tomography. J. Long-Term Eff. Med. Implants 2021, 31, 21–31. [Google Scholar] [CrossRef] [PubMed]
Publisher’s Note: MDPI stays neutral with regard to jurisdictional claims in published maps and institutional affiliations. |
© 2022 by the authors. Licensee MDPI, Basel, Switzerland. This article is an open access article distributed under the terms and conditions of the Creative Commons Attribution (CC BY) license (https://creativecommons.org/licenses/by/4.0/).