Article

A Probabilistic Framework for Robustness Quantification of Precast Concrete Frames under Seismic Loading

1
Key Laboratory of Concrete and Prestressed Concrete Structures of the Ministry of Education, Southeast University, Nanjing 211189, China
2
National and Local Joint Engineering Research Center for Intelligent Construction and Maintenance, Southeast University, Nanjing 211189, China
*
Author to whom correspondence should be addressed.
Appl. Sci. 2022, 12(8), 3814; https://doi.org/10.3390/app12083814
Submission received: 13 March 2022 / Revised: 8 April 2022 / Accepted: 9 April 2022 / Published: 10 April 2022
(This article belongs to the Special Issue Seismic Performance Assessment for Structures)

Abstract

:
Structural robustness is the property of a structure to resist accidental events such as explosions, impacts and earthquakes. In the design field of structural engineering, structural robustness has attained unprecedented significance in the present design environment. This paper presents a probabilistic framework for the robustness quantification of precast concrete frames under seismic loading. After the essences of structural robustness and the philosophy of robustness quantification are examined, the probabilistic framework is developed by investigating the relationship between the failure of structural components and the failure of structural systems. Its process consists of the identification of the relationship, the uncertainty characterization, the reliability and the robustness indices formulations. The proposed probabilistic framework is demonstrated to be feasible and effective in quantifying the robustness of precast concrete frame structures by employing an example illustration.

1. Introduction

Infrastructures have played a significant role in the development of science and technology in the last decades. With prosperous developments in structural engineering, however, more and more issues arise with respect to structural safety. One piece of evidence is that structural failure accidents appear in the media from time to time. In many situations, it is the structural failure or collapse due to accidental events such as collisions, explosions, vandalism and/or human errors that leads to catastrophic consequences. Some examples of such structural failures or collapses include the event of Ronan Point Building (London 1968), the Oklahoma City bombing event (Oklahoma 1995), the notorious attack on the New York World Trade Center towers (New York 2001), the I-35W Mississippi River bridge collapse (Minnesota 2007) and the collapse of the former iconic landmark of the Tehran skyline in Iran—the Plasco Building (Tehran 2017). It is found that all these incidents share some similarities: the structure undergoes progressive collapse when a structural element fails, resulting in the failure of adjoining structural elements, which in turn causes further structural failure. In other words, the collapse is a chain reaction type of initial failure which follows damage to a relatively small portion of a structure, i.e., disproportionate collapse [1]. More specifically, for example, the Ronan Point Building collapse was due to a natural gas explosion that resulted in the loss of a load-bearing wall on the 18th floor and the I-35W Mississippi River bridge collapse was due to a too-thin gusset plate ripped along a line of rivets.
The catastrophic damages and losses suffered during these events have served to strongly precipitate the interest in structural safety robustness. For example, after the investigations of the Ronan Point Building collapse, it is believed that the flank walls falling away left the above floors unsupported and caused the progressive collapse of the southeast corner of the building. As no other such collapse had occurred worldwide at that time, the partial collapse of the Ronan Point Building led to major changes in building regulations with the term “disproportionate collapse” embodied for the first time. Since then, structural robustness, a property that makes buildings not suffer disproportionate collapse including progressive collapse, has gained much research attention and become one of the major design criteria. Structural robustness has therefore attained an unprecedented significance in today’s design environment. In recent years efforts have been focused by many researchers and associations toward the understanding of structural robustness and promoting the robustness design in national and international regulations. An up-to-date comprehensive review regarding structural robustness is given by Adam et al. [2] and some guidelines are provided by, e.g., JCSS [3] and Canisius [4]. In the review, the issue of structural robustness is screened within several aspects including the conceptual definitions, the bibliometric details, the evolution of codes and design recommendations, the quantification of robustness, the assessment of the risk due to progressive collapse, the present investigations on robustness by means of experimental test and numerical modelling, and the research needs in the future.
The quantification of structural robustness usually is associated with the determination of the scope of structure, the structural modelling and analysis, the selection of the robustness index, and the calculation and evaluation of structural robustness. To properly understand the influence of structural performances on structural robustness, widely used methods related to structural modelling and analysis, e.g., analytical method, pushdown and pushover methods can be adopted [5,6,7]. Furthermore, the results of other research work, e.g., those related to shear–flexural interaction [8,9] will also be very helpful to improve the modelling accuracy and thereafter the accuracy of the robustness in the process of structural robustness assessment.
In recent decades, it has been believed that in comparison with the cast-in-place conventional concrete structures, the precast concrete structures have many favourable advantages in terms of, e.g., quality control, construction speed, environmental pollution and cost-efficiency. Therefore, the precast concrete structures have been extensively adopted in many countries such as the United States [10], New Zealand [11], Japan [12] and China [13]. In order to develop well-accepted precast concrete structural systems and to better understand the performances of the corresponding systems, researchers have paid much effort to investigate the performances of the precast concrete structures from the perspective of experimental tests [14,15,16,17,18], numerical simulations [19,20,21,22,23] and from the viewpoint of both experimental and numerical investigations [24,25].
Despite a lot of work having been performed in both structural robustness and precast concrete structures, there are still some research gaps regarding these aspects. On the one hand, the recent research attention on the field of structural robustness has been mainly devoted to two fields of interest, namely at the one side fundamental definitions, principles and the quantification by robustness measures and on the other side structural measures for increasing robustness and the associated structural modelling of such measures. Much more research effort should be focused on combining and optimizing these two fields of research related to structural robustness. One way to combine these two fields is to develop some robustness quantification frameworks to investigate the feasibilities of available robustness measures and the effectiveness of measures to increase robustness. On the other hand, the current research on the safety of the precast concrete structures in a global way, i.e., the robustness with respect to progressive collapse is still unclear. As mentioned in Adam et al. [2], precast concrete structures are becoming more frequent in critical infrastructures and public buildings such as hospitals, the understanding of robustness regarding precast concrete structures is in high demand and the framework to quantify the robustness of precast concrete structures is desirable.
The aim of this paper is to develop a framework of robustness quantification for precast concrete frames under seismic loading in a probabilistic way. The goal of the work is to cover a wide range of the key issues in the field of robustness quantification and to propose a probabilistic robustness quantification framework with good usability. It is believed that the easy-to-use framework will facilitate the designers to understand the effect of structural measures on structural robustness and is helpful to shorten the gap between the research results and design practices. By an insight into the essences and philosophy, the interpretation of structural robustness is presented first. Then the framework is constructed in a probabilistic way by investigating the relationship between the failure of structural components and the failure of the structural systems. Further, an illustrative example is provided step by step to show the procedures and the effectiveness of the proposed framework.

2. The Methodologies for Robustness Quantification

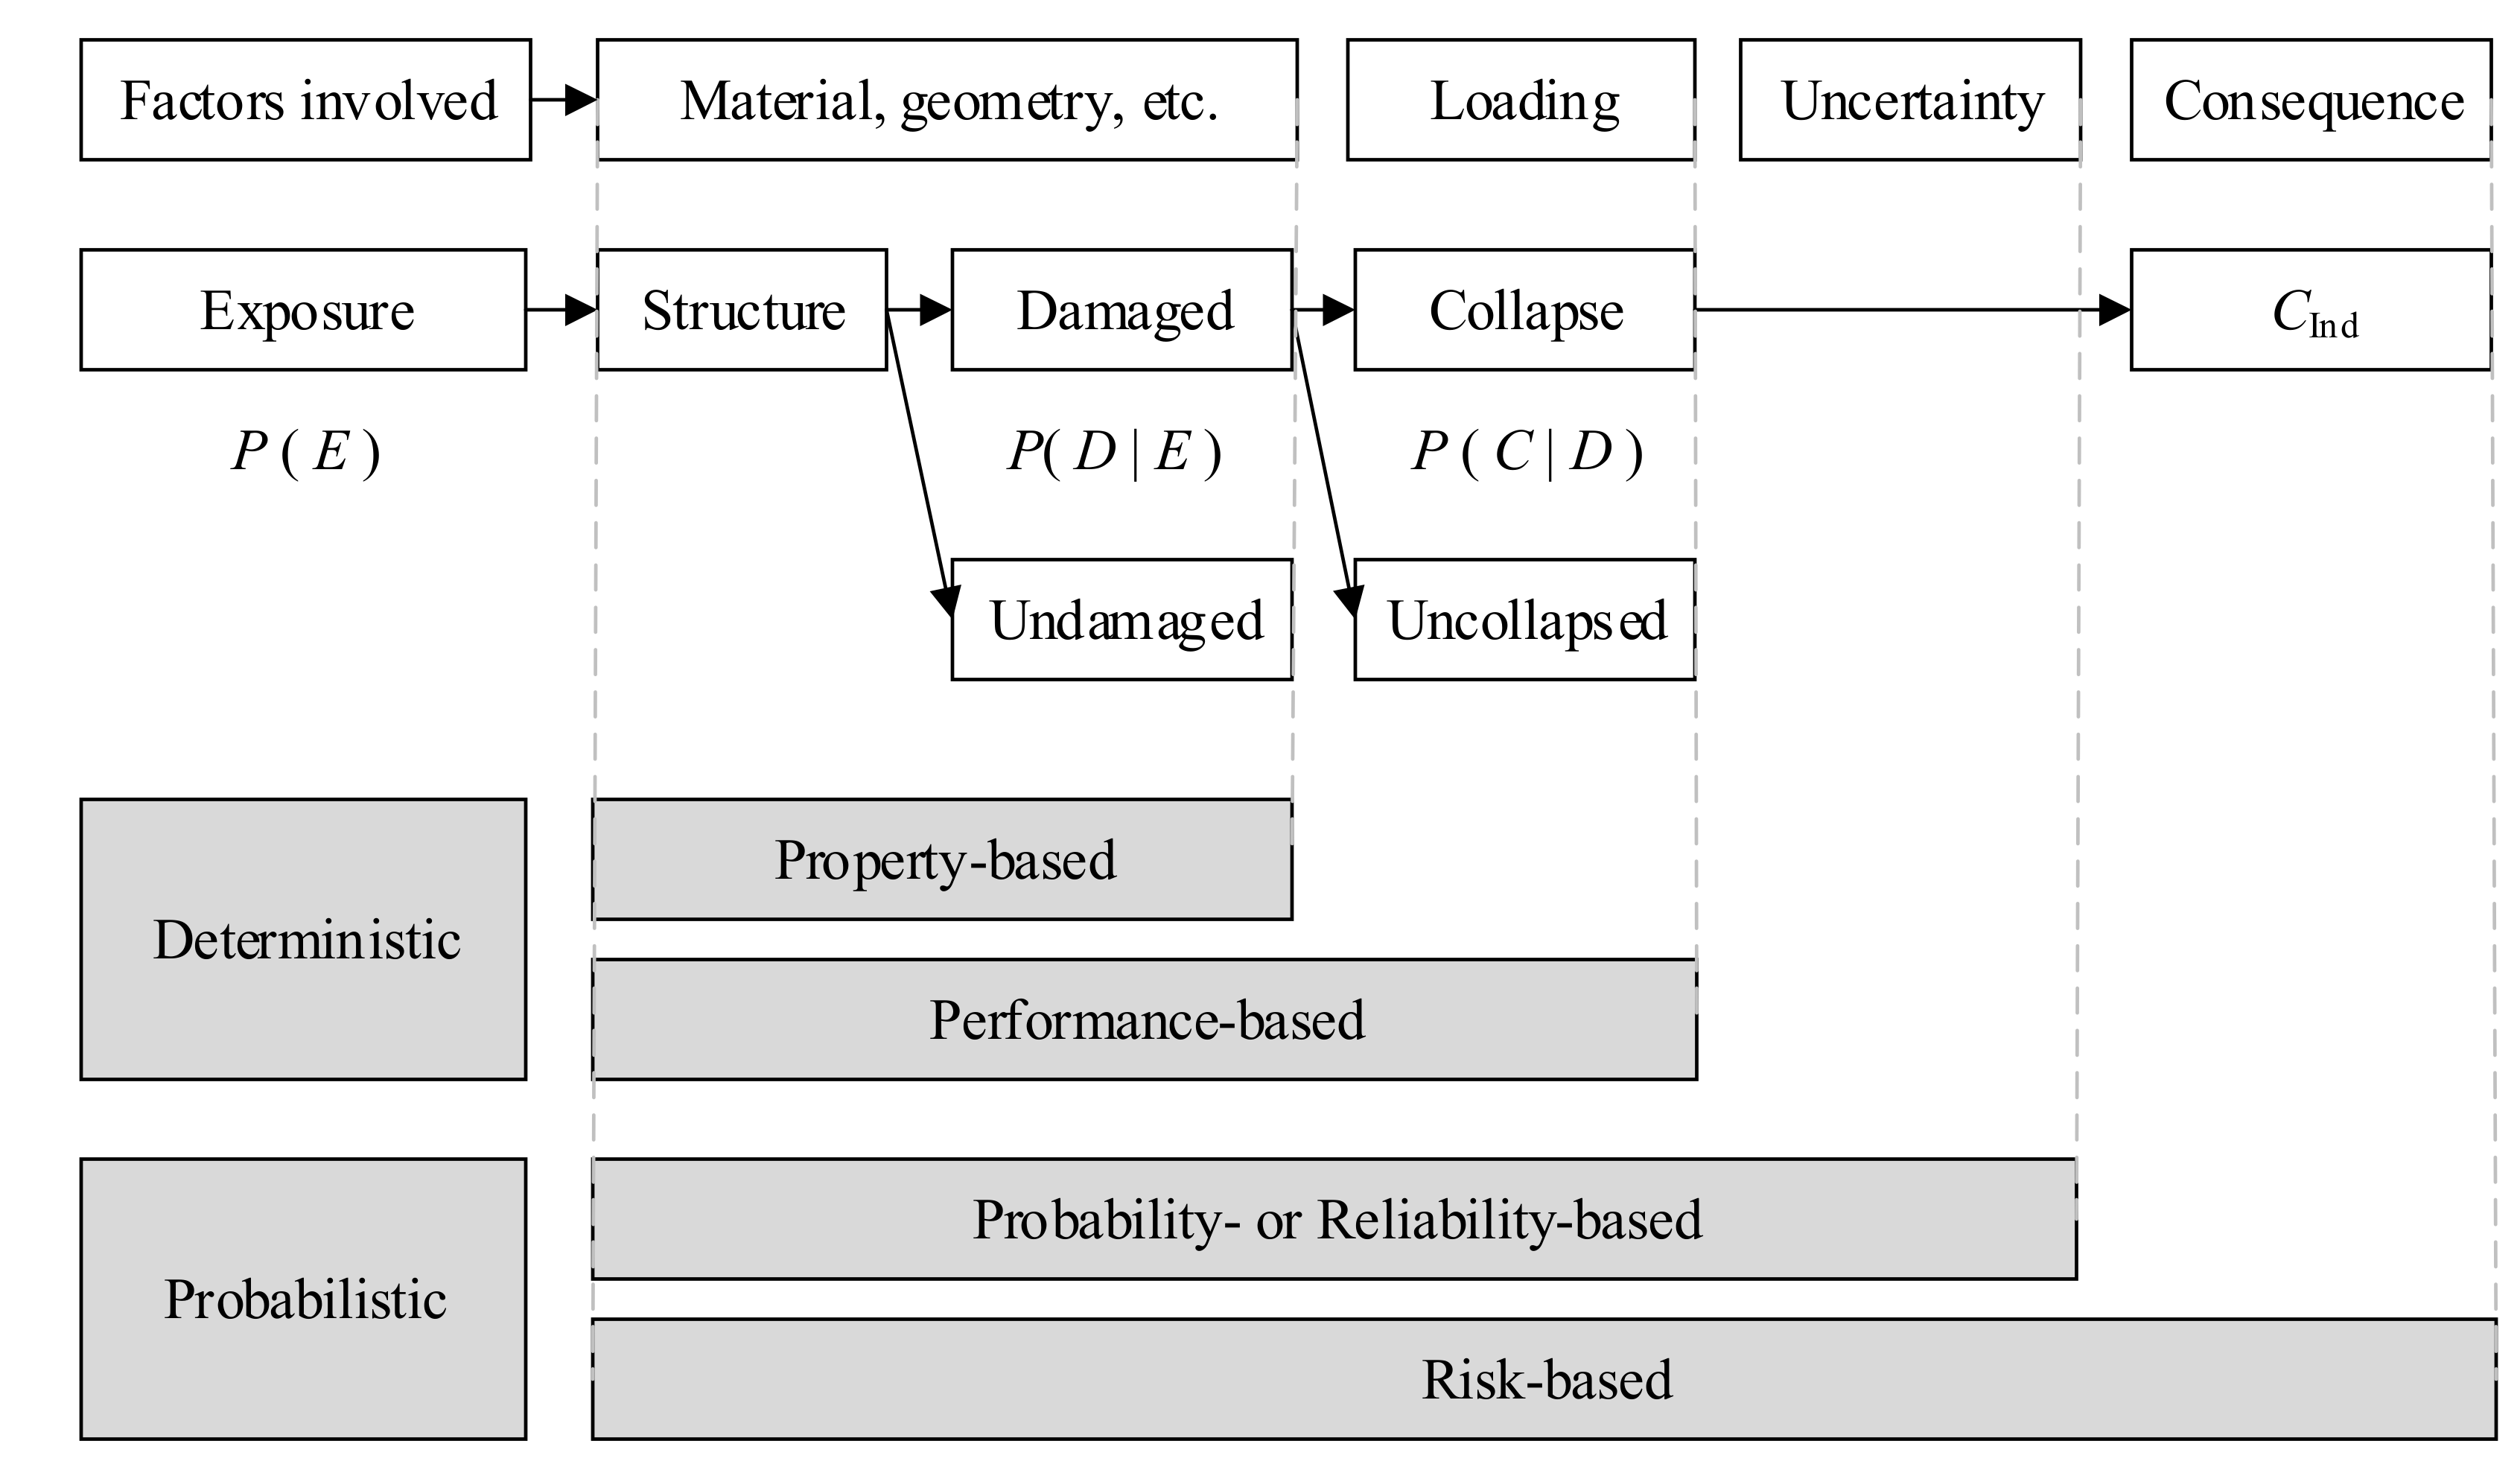
2.1. Essence of Structural Robustness

Similar to in other disciplines, robustness, as one of the fundamental terms for civil engineering, is extensively used in codes and literature [4]. However, as mentioned in Adam et al. [2] and Baker et al. [26], the meaning of robustness is often unclear and there is no consensus with respect to neither the definition nor the measure of structural robustness in its application within civil engineering. Therefore, structural robustness is often an issue of controversy and is frequently used as a synonym for stability, ductility, reserve strength capacity, redundancy or as an opposite of vulnerability, sensitivity and fragility. Although in the majority of literature no consensus is found with respect to neither the definition nor the measure of the concept of robustness, agreement on the essentials or the context of robustness in codes (e.g., Eurocode EN 1990 [27]) has been already reached:
  • Accidental event: structural robustness refers to the capacity of the considered structure to resist accidental events such as explosion, impacts, earthquakes and so on.
  • Local damage: the structure subjected to the specified accidental event is partially damaged. The damage due to the event is restricted to a small portion (with respect to volume or area) of the structure and the degree of the damage is seen to be proportionate to the accidental event. The damage is often referred to as local (or direct) damage (or failure or consequence) and a notional central column removal scenario is the most frequently adopted damage scenario.
  • Disproportionality: a structure of adequate robustness will not suffer from disproportionate damage which may be the direct failure or collapse (i.e., the local damage) due to the accidental event or the indirect/progressive failure or collapse triggered by the local damage.

2.2. Philosophy of Robustness Quantification

To illustrate how the structural robustness quantification can be performed, it is first considered how a structure can be analysed or assessed. When a structure is to be designed, the characteristics of the structure such as geometries, selected materials and boundaries are determined. Based on these characteristics the (internal) structural properties regarding the structure itself such as the slenderness and the axial/bending stiffness can be obtained. If the (external) environments such as attributes of loading (e.g., magnitude, direction or distribution) are considered, then the structural performances (or responses) such as load-bearing capacity, the displacement and the stored energy can be calculated. Furthermore, probabilistic properties such as the failure probability or reliability of the structure will be known if the uncertainties of the basic variables are taken into account. Moreover, in case damage occurs due to accidental events posed on the structure, the structural properties, structural performances and probabilistic properties can be assessed again for the damaged structure; structural risk analysis with respect to the original structure can also be conducted when the consequences due to the accidental events are considered.
As mentioned, it is generally accepted that the process of robustness quantification comprises the identification and modelling of exposures, the formulation and calculation of damages and the assessment of the disproportionality. Therefore, the event tree used, e.g., in Baker et al. [26] can be adopted as a tool to analyse the framework of robustness quantification. Based on this tool, the classification of the methodologies for robustness quantification is realized by exploring the complexity of the analysis method, as shown in Figure 1. Specifically, the methodologies can be classified into four categories by performing different analyses or assessments for a structure:
  • Structural-property-based: given an accidental exposure, the considered structure might be damaged. The possibility of damage is only related to the (internal) structural properties (the simplest case is related to the load-bearing capacity). If the structure is damaged, the loss directly due to the exposure initiation (e.g., a loss of a column) is seen as the direct consequence. In this case, the robustness quantification is structural-property-based.
  • Structural-performance-based: consider that in practice the structure is subjected to (external) loadings such as self-weight and wind load, then damage in the structure is possible to trigger a follow-up failure or collapse of the whole structure. Note that the loss from the follow-up failure or collapse (e.g., the monetary value of the structure, fatalities due to collapse, etc.) is seen as the indirect consequence. In this case, the probability of collapse is calculated conditionally on the damage initiation as well as the sustained loadings on the structure before the damage occurs, and the afterwards robustness quantification is seen as structural-performance-based.
  • Probability- or reliability-based: if the uncertainties corresponding to the internal and external characteristics are taken into account, the probability of damage or collapse can be obtained and then either a property-based or a performance-based methodology is updated to be probability- or reliability-based.
  • Risk-based: if a methodology is to compare the changes of direct and indirect risks based on consequences, then this methodology is seen as a risk-based approach.
Figure 1. Classification of robustness methodologies.
Applsci 12 03814 g001
Except for the classification mentioned above, the methodologies can also be classified into deterministic and probabilistic ones by considering whether or not the effect of uncertainties is involved, as shown in Figure 1. Note that some researchers also proposed generalized/generic forms into which the robustness measures based on, e.g., structural properties and/or structural performances can be fitted.
According to the essences of robustness, it is found that the keyword of robustness is ‘disproportionality’ with respect to damage and hence the key to quantifying robustness is to quantify the disproportionality of damage. Therefore, to correctly and accurately quantify robustness it is necessary to quantify the damage due to the original cause and the total damage if ‘damage’ is broadly interpreted (unfortunately ‘damage’ is not explicitly defined in available literature). Under this definition, a structure that is damaged or even collapses because of the initiation of an event (e.g., a gas explosion or a powerful earthquake) is still robust if no severe disproportionality is found.
On the one side, the robustness quantification can be performed by a comparison of the structure between its intact and damaged states because the comparison provides sufficient information about the damaged state. When the disproportionality of the total damage to the initial damage due to the original cause is properly quantified in one way or another, then the structural robustness can be properly assessed. Broadly speaking, such a comparison forms the basis of the current property-based, performance-based, as well as probability- or reliability-based, robustness indicators. Furthermore, the quantification and assessment of the robustness of a structure can also be carried out between its damaged state and its final state of interest. Then the disproportionality of damage is interpreted as the disproportionality (e.g., the indirect consequence to the direct consequence). This comparison forms the basis of the risk-based robustness indicator. For decision makers, each robustness indicator provides useful information within the context of the indicator. A decision with respect to robustness may be understood as a committed allocation of aspects from different robustness indicators.

2.3. Robustness Index Selection

An insight into the available robustness indices shows that most of the structural property-based and performance-based robustness indices are deterministic ones. For example, the stiffness matrix based robustness index proposed by Biondini and Restelli [28], some of the redundancy-based robustness indices proposed by Frangopol and Curley [29], and the energy-based robustness index proposed by Starossek and Haberland [30] are all deterministic because only the structural configurations (including geometries, material properties etc.), as shown in Figure 1. When robustness quantification is performed with respect to precast concrete structures under seismic loading, however, the stochastic characteristics of the earthquake motions should not be ignored. Therefore, in this work, the deterministic robustness indices are not adopted.
When quantifying structural robustness within a risk-based methodology, it is necessary to quantify the direct and indirect consequences before and after the local damage (e.g., the central column removal scenario). It is worth emphasizing that the quantification of consequences is rather subjective and for the same situation, the consequence quantification may vary from person to person. This is because in the estimation of consequences, even if the structure and its context are given, the consequence estimation is still uncertain as it is associated with quantifiable and unquantifiable constitutes [31,32]. Therefore, to minimize the complexities the risk-based robustness index is also ignored in this paper and only the probability- or reliability-based robustness indices are provided herein. The inclusion of all robustness indices is not the scope of this work and the readers are suggested to refer to, e.g., Adam et al. [2] when of interest.
In order to account for the random nature, Frangopol and Curley [27] and Fu and Frangopol [33] proposed some probabilistic measures related to structural redundancy, RI, defined by
R I = P f ( damaged ) P f ( intact ) P f ( intact )
in which Pf(damaged) is the probability of failure for a damaged structural system and Pf(intact) is the probability of failure of an intact structural system. This redundancy index provides a measure of the robustness of a structural system. The index takes values between 0 and infinity, with smaller values indicating larger robustness.
They also considered the following redundancy related factor βR defined by
β R = β intact β intact β damaged
in which βintact and βdamaged are, respectively, the reliability indices of the intact and damaged system. The system is very robust if the probabilistic redundant index is close to infinity and the system is not robust if the probabilistic redundancy index is close to 1.
Lind [34] proposed several quantitative measures of system vulnerability and damage tolerance as robustness indicators. According to the author, vulnerability and damage tolerance are considered reciprocals. Take the vulnerability V of a system for example, which is defined as
V = P ( r d , S ) P ( r 0 , S )
where r0, rd are the resistances of the undamaged system and the damaged system, respectively; P(r, S) denotes the probability of failure of the system in a state r with respect to the loading S. The vulnerability of a system can be used to quantify the robustness of the system. The value of V varies from 1 when the damage has a null impact on the system (robust) and to infinity when it has a huge impact on the system (non-robust).

3. The Robustness Quantification Framework for Precast Concrete Frames under Seismic Loading

As indicated by the robustness indices mentioned above, the key to the robustness quantification with respect to precast concrete frames is to assess the failure probabilities of the considered intact and damaged structural systems. Unlike the assessment of the failure probability of a single structural component (e.g., a beam, column or slab), the calculation of a structural system is neither direct nor easy. For a structural system, the limit state function (or the failure criterion) is associated with the failure sequence of its structural components. In this section, a framework to quantify the robustness of precast concrete frames under seismic loading is developed by decomposing the system reliability problem into a component reliability problem employing the beta-unzipping method. Note that in the framework the notional central column removal scenario is seen as a given priority and the development process of the local damage due to the accidental event is out of the scope of this study.

3.1. Failure Criterion and the Beta-Unzipping Method

Structural collapse can be chosen as a basis for defining the failure of a structural system. Then it should be determined which phenomenon, i.e., failure criterion is appropriate as an indicator of structural collapse. Difficulties in quantitatively determining a failure criterion arise from the fact that the meaning of the collapse of an entire structure is unclear. It is well known that the failure of a member can be defined as its incapability to sustain the external loads to which it is subjected. On the one hand, it is well accepted that a column fails when it cannot resist the sustaining loads. For a frame structure consisting of beams, columns and slabs, it is also clear a column failure might lead to failure of its adjacent beams and slabs and the loads sustained by the failed column will be resisted by other members. If the other components cannot sustain the loads, then the structure collapses. On the other hand, a beam failure could be seen as a local failure and does not necessarily trigger the failure of the structure. Therefore, for frame structures, it is of significance to define the system failure and clarify the relationships between the system failure and the failures of structural components.
Approximately, a linear relationship between the internal forces and the external loads can be assumed for structural members when static analysis is performed with respect to the structure. At this point, the failure probabilities of the structural members can be evaluated from the applied loads and resistance statistics using various reliability analysis methods (e.g., the widely used first-order reliability method). Almost all real structures are statically indeterminate and therefore, failure of a structural component results in a redistribution of the internal forces and the structure might survive due to the existence of several possible load paths. The (complete) failure or collapse of a structural system normally occurs after the failure of several structural components. These several members fail progressively, and their failures form a failure sequence. Such a failure sequence among structural members can be considered a failure mode of the structure. In this situation, the entire structure can be viewed as a series system in which each system component can be viewed as a parallel subsystem. Each of the system components in series represents a failure mode (i.e., a failure sequence) of the entire structure, while the components in the parallel subsystem represent those failure events of the structural elements that constitute the specific failure sequence. After evaluating the failure probability of the first member in the sequence, the member is removed (in case of brittle failure) or replaced by forces and/or moments (in case of ductile failure) equal to that at the failure of the member. The damaged structure can be analysed again and the corresponding failure probability of each member can be evaluated. Then the joint probability of the failure of two members can also be evaluated. This progressive procedure can be continued until a mechanism level is reached. The failure probability of the structure is the probability of the union of the failure events of each failure mode. In principle, the procedure mentioned above can be used to estimate the system reliability. However, the number of failure modes for even a simplified real structure (e.g., a two-bay three-storey plane frame) is extremely large, thus making the analysis time-consuming. Alternatively, to obtain a reasonable estimate of the system reliability methods such as the branch-and-bound method and the beta-unzipping method can be adopted [35]. These methods are based on consideration of only the most critical paths and are briefly described in the following.
The main characteristic of the branch-and-bound method is the procedure for the identification of the failure sequences which are the most probable to occur and the evaluation of upper and lower bounds for each failure sequence. At each step, the failure sequences whose probability of occurrence are lower than a fraction of the failure probability of the most likely to occur path are disregarded. Although this method considers all critical failure sequences and is rigorous for system reliability analysis, it is not adopted herein because the computational effort required for the analysis of a real structure is generally high [35].
In the beta-unzipping method, the system failure probability can be estimated at different approximation levels by choosing different numbers of members considered in each failure sequence. The system failure probability is obtained at the nth level if n elements are considered. The n elements are linked to form a parallel subsystem and then all the parallel subsystems are linked to form a series system. The system failure probability is the failure probability of the series system. For instance, the system failure probability at zero level is defined as the maximum of the probabilities of failure of all structural members. In each step of the progressive procedure, only members with failure probabilities higher than a certain level (determined by the user) are considered. The beta-unzipping method is adopted in this work by considering the fact that the user has control over the accuracy and the required computational effort by discarding unimportant failure paths and limiting the level of the analysis.
As indicated in [35], in the beta-unzipping method at zero level each element is considered isolated from the other elements and the interaction between the elements is not taken into account. To estimate the failure probability of a structural system more satisfactorily, the beta-unzipping method can be used at level 1, where the possibility of failure of any significant failure element is accounted for by modelling the system as a series system. The failure probability of this system is estimated based on the failure probability of each element and the correlations between these elements. For accuracy purposes, the system failure probability can be estimated using the beta-unzipping method at high levels but in general analysis beyond level 3 is of minor necessity [35]. Note that it is not the objective of this paper to accurately quantify the failure probability of structural systems. Therefore, the beta-unzipping modelling at level 1 is adopted in balancing the considerations of simplicity and accuracy.
The Monte Carlo simulation technique is used to calculate the failure probability of the considered structural system. More specifically, the limit state function of each structural element is first obtained by structural analyses. The considered random variables (including variables of material properties, load properties as well as geometrical properties) are then sampled and the failure probability of each structural element is obtained according to the corresponding limit state function. Then the correlation coefficient between every two elements can be evaluated with the limit state function of each element. Furthermore, the failure probability of the elements and the correlations between these elements are used to calculate the failure probability of the system using the beta-unzipping method at level 1.

3.2. Failure Element and Limit State Function

In a concrete frame structure, the basic structural elements are beams and columns. As mentioned above, each structural element is possible to fail in the structural analysis. The term failure element refers to any failed beam or column of the considered frame. When a precast concrete frame structure is subjected to permanent loads, imposed live loads and seismic loads, each section of a structural element is possibly subjected to a bending moment, a shear force and an axial force.
For columns, each column is usually subjected to compression or the interaction of bending moment and axial force, and the failure of a column is determined by the state of its section. Hence the limit state for a column section is governed by the interaction curve of the column: the column does not fail if the couple of the moment and axial force is located within the interaction curve of the column; otherwise, the column fails. The failure of columns due to shear in the case of vertical loadings is generally neglected since the shear force for each column is relatively small compared to the corresponding shear resistance. However, the shear force for each column under seismic loadings is significant and might result in large horizontal displacements and thereafter the collapse of the upper story sitting on the corresponding lower floors. In this case, the failure event of the considered column due to shear can be linked to that due to the combination of the moment and axial force, which forms a new failure event, i.e., a series system with two failure events.
For beams, each beam is commonly subjected to bending moments and shear forces at its ends and to a negligible axial force. Theoretically, bending failure or shear failure might occur in each beam section. In most cases, the shear failure is not allowed to occur before the flexural failure in normal design cases. Therefore, only the bending failures are considered for beams while shear failures are ignored by assuming adequate shear design. Note that in case shear failures and failures due to the interaction of bending moments and axial forces (e.g., when prestressing is applied to precast beam members) should be considered, all the possible failure events should be linked together to form a series failure event for the considered beam.
Mathematically, the limit state of a structural element (a beam or a column) can be defined as follows [35]:
G i = R i j = 1 m a i j q j j = 1 m b i j P j
where Gi is the safety margin of the ith (i = 1, 2, 3, … n) structural element; Ri is the resistance of the ith structural element; aij (or bij) is the load effect coefficient for the ith element due to the jth (j = 1, 2, 3, … m) external distributional load qj (or pointed load Pj); i and j are reference numbers of the structural component and the distributed and pointed loads, respectively; and m and n denote the total numbers of the distributed and pointed loads and the structural components, respectively.

3.3. Uncertainty Characterization and Failure Probability

Based on the limit state function of each structural element, the failure probability of each element can be obtained using widely adopted methods, e.g., the first-order reliability method or simulation techniques. During the calculation of the failure probability of each element, properties of concrete, steel reinforcement as well as external loads are probabilistically modelled as random variables, as shown in Table 1.
According to JCSS [36], the permanent load is modelled as a normally distributed variable with its mean value equal to its specified value and the coefficient of variation (c.o.v) equal to 0.05. For the variable load, a reference year of 50 years is adopted here. Consequently, the variable load is modelled by a Gumbel distribution with a mean value of 0.6 times the specified value and a c.o.v value equal to 0.35. The seismic load can be simplified to be the equivalent static load imposed on the centerline of the beams. Based on the findings in Gao and Bao [37], the seismic load can be modelled as a Gumbel variable with the mean equal to the standard value and a coefficient value of 0.30.
According to Holicky and Sykora [38], the concrete strength might have an influence on the reliability of concrete structures and can be modelled as a lognormally distributed variable with a mean value equal to two times the standard deviation beyond the specified strength, and the c.o.v ranging from 0.10 to 0.18. It is well known that the concrete modulus is related to its strength and a relationship between them can be adopted from Eurocode 2 [39]. The concrete modulus is assumed to be lognormally distributed with its mean value related to its specified strength and its c.o.v equal to 0.15. The ultimate concrete compressive strain is assumed to be a lognormal variable with a specified value equal to its mean and the c.o.v equal to 0.15. Regarding the properties of steel reinforcement, the yield strength is assumed to be lognormally distributed. According to JCSS [36], the mean value of the yield strength of steel is the addition of its characteristic value and two times its standard deviation and the standard deviation is fixed as 30 MPa.
Note that generally the geometrical properties including the width, depth and length of structural elements are treated as deterministic variables as their variability is small compared to the corresponding specified values. However, the variation of the concrete cover of reinforcing bars is found to be significant [38]. In this case, a bounded beta distribution seems to be the most suitable model to model the uncertainty in this case. More specifically, a lower bound of zero, a mean equal to the nominal value of the concrete cover and an upper bound of three times the mean can be adopted.
With statistics of all basic variables at hand, the failure probability of each element can be calculated. It is worth noting that during the process of robustness quantification the accidental situation is adopted for the combination of load actions. The partial factor for actions due to permanent loads and seismic loads is 1.0; the partial factor for actions due to variable loads is 0.5. In the calculation of the equivalent static shear forces due to seismic loads, the severe earthquake situation should be adopted. Note that the variation of the modulus of elasticity of concrete leads to the variation of the stiffness of the frame. However, in case the same value of the modulus of elasticity of concrete is applied to all structural members, the load effect coefficients (aij and bij in Equation (4)) can be guaranteed to be constant.
With the failure probabilities of all structural elements, the failure probability of the corresponding structural system can be calculated according to the beta-unzipping method at level 1. According to the beta-unzipping method at level 1, the critical elements with reliability index β [ β min , β min + Δ β ] are selected to constitute a series system. Δβ is a prescribed positive number determined by the user. As suggested in [35], a value of 3.00 can be an option for Δβ. When the Monte Carlo simulation technique is used for the calculation of the failure probabilities, it is often the case that the computation is extremely time-consuming for some elements with high safety margins. Since the failure probabilities of these elements do not greatly contribute to the system failure probability, it is not necessary to calculate them accurately and the estimation with an upper bound is acceptable. In the selection of critical elements, these elements with low failure probability contributions are ignored. Therefore, the value for Δβ is not fixed in this work but changes from case to case. According to the beta-unzipping method and level 1, the selected critical elements form a series system.
For a series system including n elements, the failure event and the failure probability of the ith (i = 1, 2, 3 …, n) element are, respectively, denoted as Fi and P(Fi). Then the failure probability of this system is expressed as:
P f = P ( F 1 F 2 F n )
To obtain a good estimate of the system failure probability, the Ditlevsen bounds [35] can be used:
P f i = 1 n P ( F i ) i = 2 n max r < i P ( F i F r ) P f P ( F 1 ) + i = 2 n max P ( F i ) r = 1 i 1 P ( F i F r ) , 0
The calculation of the Ditlevsen bounds requires an estimate of the probability of the intersection of Fi and Fr, i.e., P ( F i F r ) . In case all the variables in the limit state function, i.e., Equation (4) of the ith element are normally distributed (if not, for example, the Rackwitz–Fiessler algorithm [40] can be applied), the probability of the intersection is given by:
P ( F i F r ) = β i β r 1 2 π 1 ρ i , r 2 e 1 2 ( 1 ρ i , r 2 ) ( β i 2 + β r 2 2 ρ β i β r )
with
ρ i , r = j = 1 m a i j a r j Var [ q j ] σ G i σ G r
where σ G i and σ G r are the standard deviation of the safety margin of the ith and rth element, respectively. Since the random variables in the limit state functions are (transformed to be) normally distributed, the standard deviation of the safety margin of the ith element is:
σ G i = j = 1 m a i j 2 Var [ q j ]
According to Equations (4) and (8), the calculation of the coefficient of correlation for beam members can be performed. To calculate the correlation coefficients connected to column members accurately, the best way is to formulate the limit state function of a column member with respect to both the axial force and the bending moment. However, in this case, the calculation becomes extremely complex. Therefore, for simplicity and conservativeness purposes, in this study the coefficient of correlation is calculated as follows: the correlation coefficients corresponding to the limit state functions with respect to the axial force, bending moment and shear force are calculated separately. Then for the purpose of conservativeness, the largest coefficient of correlation is then chosen for the subsequent calculation procedures of the estimate of system failure probability.

3.4. Robustness Quantification

When the failure probability of a precast concrete structural system can be calculated, the failure probabilities of the considered intact and damaged structures can be obtained following the same procedures, as shown in Figure 2. Specifically, the main procedures are as follows:
(1)
Collect the necessary basic inputs for robustness quantification, including geometric and material properties, boundary conditions, building class, site class, seismic design category and so on;
(2)
With the basic inputs at hand, perform structural analysis and determine the resistances (Ri), load effect coefficients (aij, bij) of structural element i subjected to the distributed and pointed loads (qj, Pj);
(3)
Set up the limit state function of element i;
(4)
By considering the main sources of uncertainties, calculate the failure probability P(Fi) of element i using reliability analysis methods (e.g., the first-order reliability method) or simulation techniques;
(5)
Calculate the failure probability Pf of the structure using the beta-unzipping method at level 1;
(6)
Repeat procedures (2)–(5) to obtain the failure probabilities Pf(intact) and Pf(damaged) of the intact and damaged structures;
(7)
Quantify the structural robustness by adopting the redundancy and vulnerability-based robustness indices based on Equations (1)–(3) accordingly.
Figure 2. Calculation procedures within the robustness quantification framework.
Applsci 12 03814 g002
In the development of the proposed robustness quantification framework, two main assumptions are used: (1) the failure of a structure is directly related to the sequential failures of structural elements; and (2) the structural internal forces are approximately believed to be linearly related to the external loads (i.e., the limit state function shown in Equation (4)). Based on these assumptions, the beta-unzipping method is used to facilitate the calculation of the failure probability of the structure of interest. The first assumption shows that the proposed framework can be directly used to quantify the structural robustness of frame structures since sequential failure mechanisms among frame beams and columns are theoretically and experimentally found in frame structures. The framework is also applicable for other various structures if such structures can be explicitly simplified to be structures composed of discrete components (e.g., frame-wall structures, truss structures and timber structures). The other assumption describes the scope of the structural behaviours that can be considered in the process of robustness quantification. Obviously, elastic behaviours for all structures can be considered. In case the nonlinear effects are under consideration, the framework can also be adopted because approximately the analysis of a specific nonlinear state of interest can also be viewed as an elastic analysis. In this case, the load effect coefficients in Equation (4) are calculated separately. With respect to the failure modes of structural components, all kinds of failure modes including the flexural, shear, compression (or tensile) failure modes can be considered in the framework.
The limitation of the proposed framework lies mainly in two ways: on the one hand, the robustness is quantified in an approximate way by which the nonlinear effects in concrete structures cannot be fully considered; on the other hand, it is difficult to explicitly consider the coupling effect of axial force, bending moment and shear force because the consideration of such effect would highly increase the complexity of the calculation of the correlation coefficients between structural components. Therefore, the robustness quantification framework proposed in this work is recommended for those designers who need to evaluate the structural safety of the designed structure from the viewpoint of robustness because the proposed framework herein is theoretically rigorous, easy to use and generally applicable in most situations.

4. Robustness Quantification of a Precast Concrete Frame: An Illustration Example

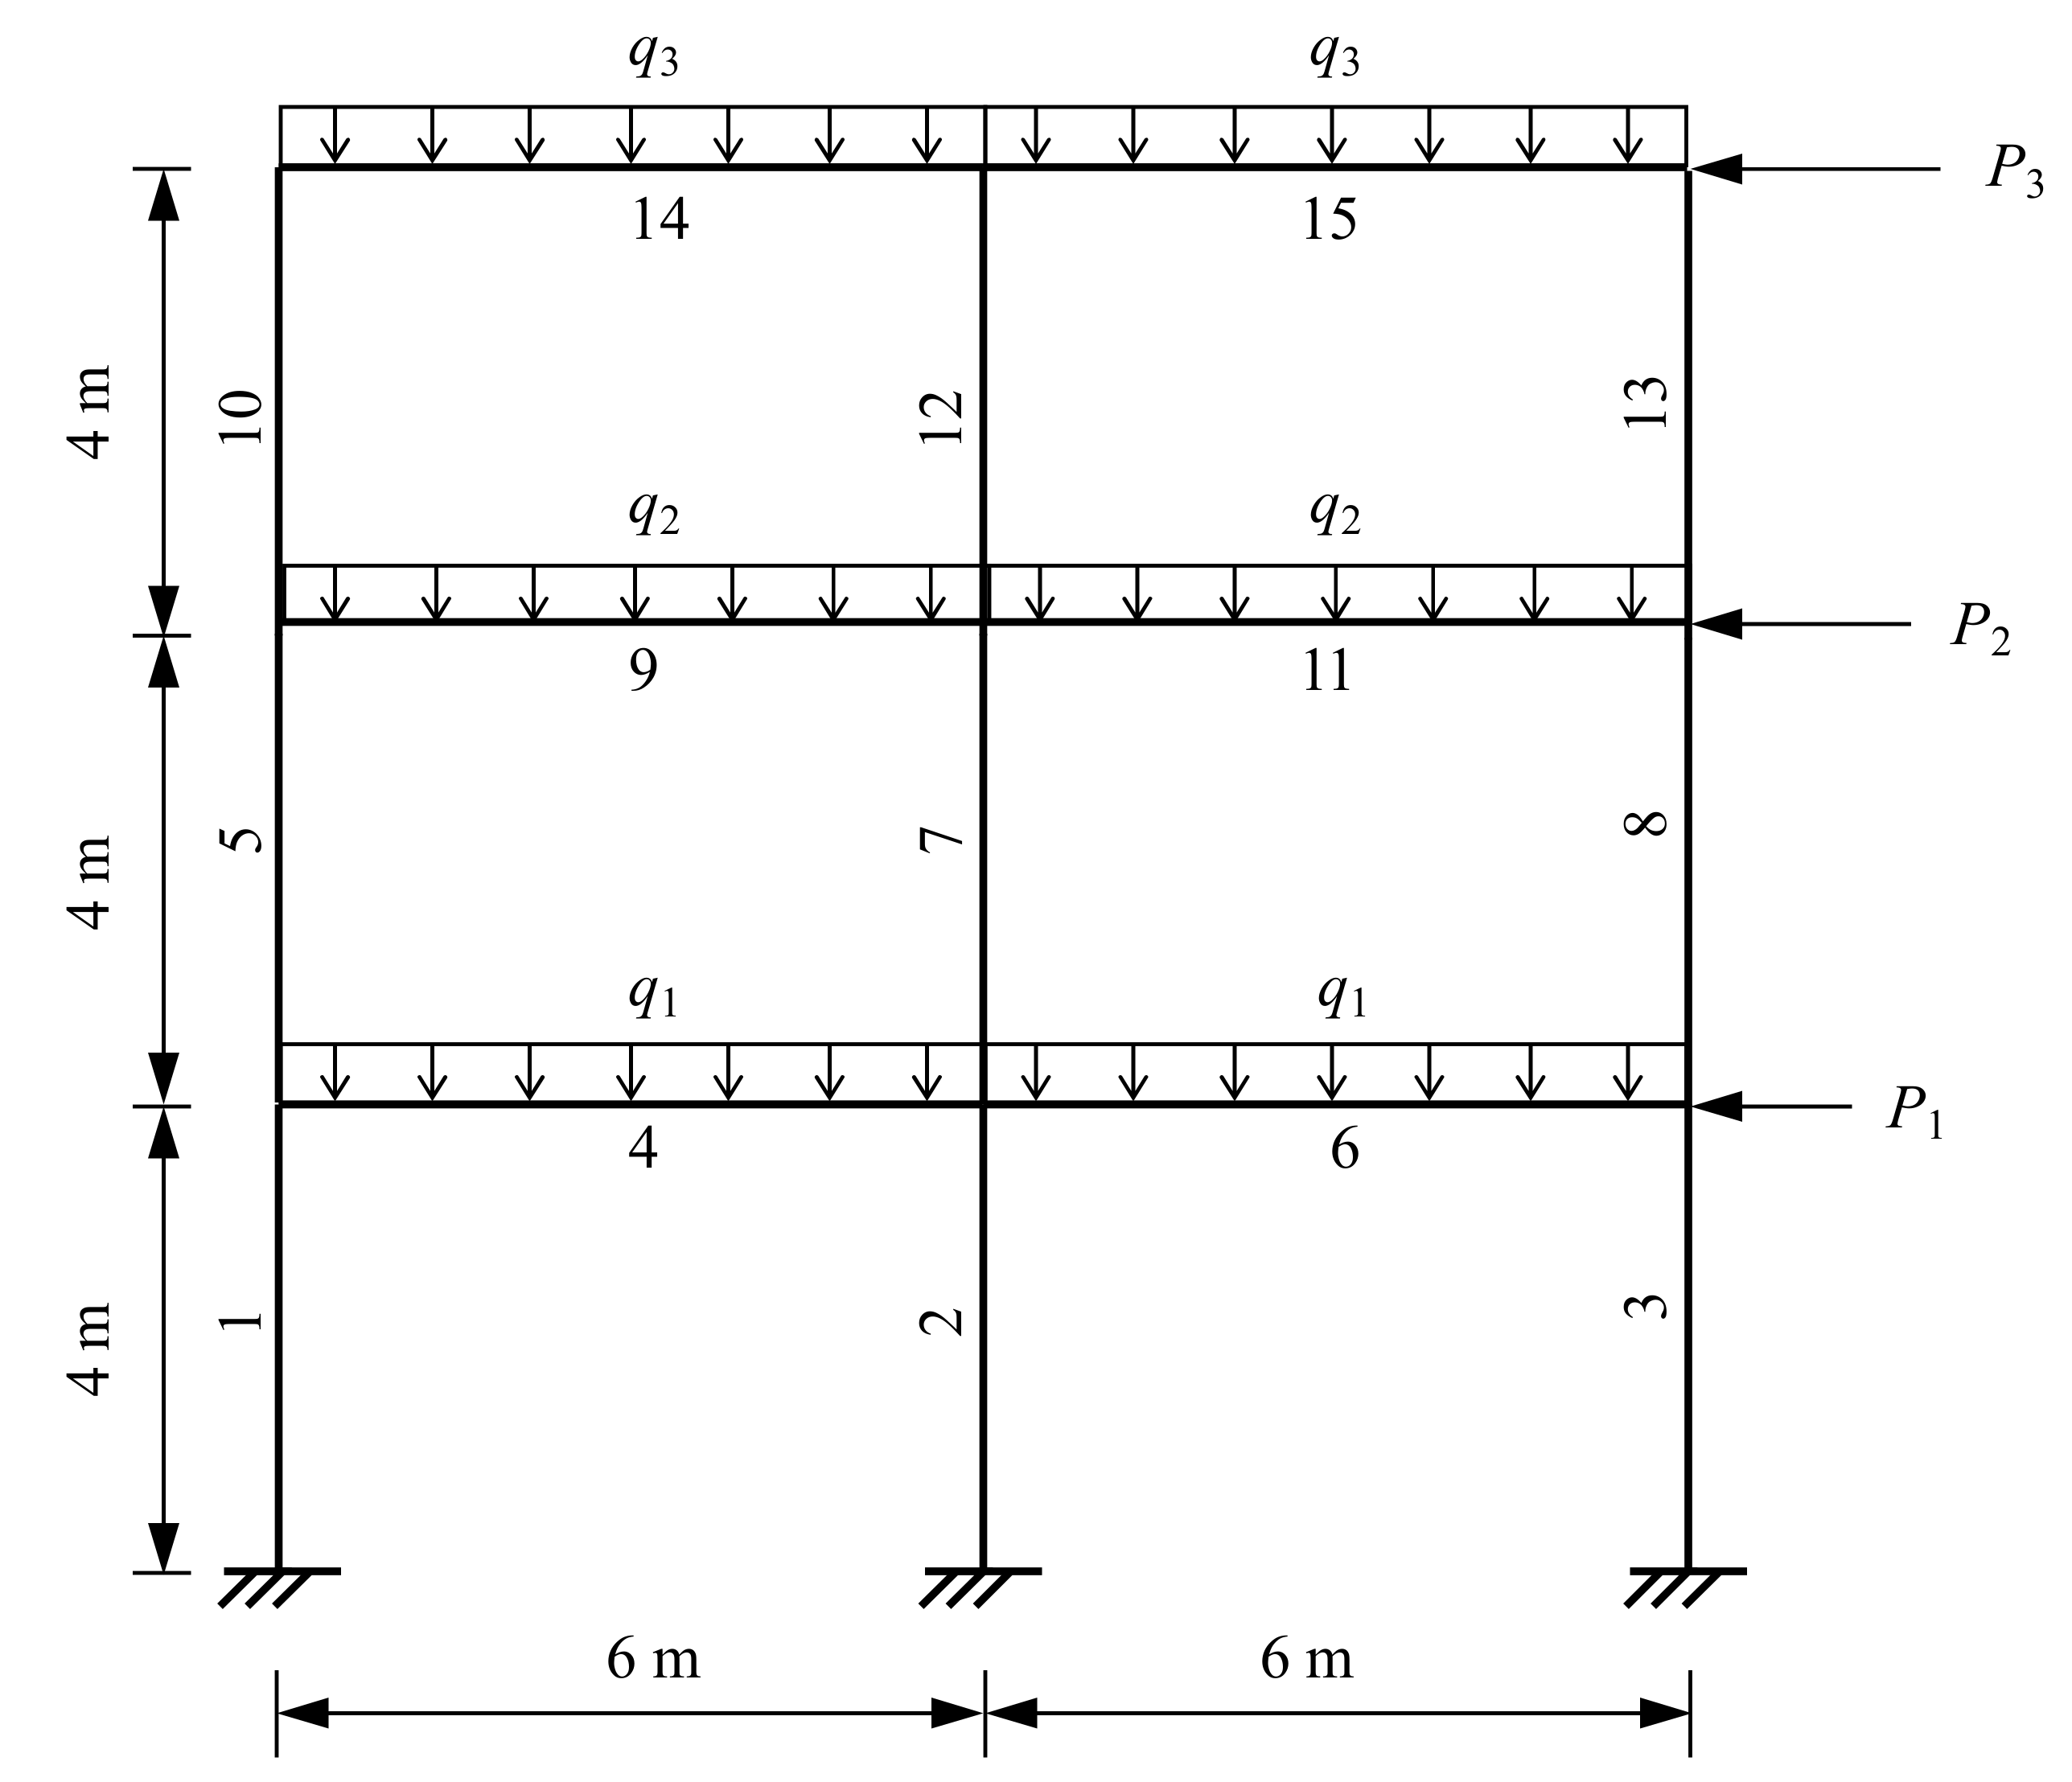
4.1. Problem Description

The framework described above is applied herein by an illustration example. As pointed out previously, the presented framework is versatile and can be adapted to quantify the robustness of various structures. For illustration purposes, however, a simple but effective example is favourable to show how to use the framework step by step. Therefore, a three-storey two-dimensional precast concrete frame is considered. The layout of the structure and the numbering of each component are shown in Figure 3. The bay length of the frame is 6 m wide and the height of each storey is 4 m.
This two-dimensional concrete frame could be viewed as part of a three-dimensional office building. The building is deemed to be a monolithic precast concrete structure designed according to the Chinese technical specification [41] and is constructed using precast concrete elements such as beams, columns and slabs. The beam-to-column connection type used in [17] is adopted herein. The numbering of each element is denoted in Figure 3. The thickness of the precast slabs for all floors is 120 mm. The thickness of the dividing walls supported by beams is 200 mm. For description purposes, the distribution loads (permanent and imposed live loads) and the pointed loads (equivalent static seismic loads) are denoted as q and P, respectively. All the loads acting on the 1st, 2nd and 3rd storeys are denoted with subscripts 1, 2 and 3, respectively, as shown in Figure 3.

4.2. Structural Design of the Precast Concrete Frame

In the design process, the permanent action includes the self-weight of the structural members as well as the office facilities. According to the Chinese technical specification for precast concrete structures [41], the normal density of reinforced concrete components is taken as 25 kN/m3 and the design-oriented standard value of the imposed load for office buildings is taken as 2.0 kN/m2. The characteristic values of the permanent and imposed loads acting on the primary beam members are calculated as 31.75 kN/m and 12 kN/m for the 1st and 2nd floors, and 19.75 kN/m and 6.9 kN/m for the 3rd floor, respectively. The well-known equivalent static force analysis is performed to obtain the earthquake lateral loads and the maximum seismic coefficient used to evaluate the equivalent static seismic loads is 0.08. All the permanent and imposed loads, as well as the earthquake lateral loads, are considered and combined in the design process. The partial factors used in the load combination are 1.2, 0.6 and 1.3 for the permanent, imposed and seismic loads, respectively.
All the primary beams are assumed to have a cross-section of 250 mm × 400 mm and all the columns have a cross-section of 400 mm × 400 mm. In the design process, steel bars with a characteristic yield stress of 500 MPa and type C40 concrete are adopted. A concrete cover of 35 mm for all sections is assumed. The frame is designed according to the characteristic values of the considered materials and load actions. Each beam is designed with a section reinforced by eight ϕ 20 steel bars throughout the member length and stirrups (ϕ 10) at 150 mm spacing; each column is designed with a section reinforced by twelve ϕ 22 steel bars and shares the same stirrup configurations with beams.

4.3. Reliability Index and Robustness Index

With the stochastic properties from the resistance side and from the load side (Table 1), the failure probability of each element can be obtained according to Equation (4). Specifically, the resistance of each beam or column element is calculated by sectional analysis and the load effect coefficients are obtained by static analysis [42], followed by the failure probability of each element based on the first-order reliability method. In the sectional analysis, each section is subdivided into discrete layers to consider the differences in the constitutional model between the precast concrete and the cast-in-place concrete. Note that the nonlinear effect of concrete is implicitly considered in the sectional analysis. A beam or column element is deemed to fail when its ultimate strength reaches the applied load effects and the strain hardening effects of concrete members are ignored for simplicity purposes. With the failure probabilities of all beams and columns available, the system reliability of the frame can be calculated following the beta-unzipping method at level 1. All the analyses and calculations are performed using software Python. Before the calculation of the reliability indices needed for robustness quantification, the system failure probability of the frame under the design loading conditions is first calculated. This failure probability is 4.24 × 10⁻⁴ (β = 3.34) showing that the precast frame is well designed.
Then the failure probability of the intact and damaged frames under the severe earthquake condition is examined. The failure probability of each failure element is given in Table 2. As mentioned above, a notional central column removal scenario is assumed to define the damaged state of the considered frame. Specifically, it is assumed column No. 2 is removed from the frame in this illustration example.
For the intact precast concrete frame, the contribution of those elements with failure probabilities smaller than 1 × 10⁻³ to the system failure probability can be neglected and other elements can be seen as critical elements ((Δβ = 1.33). Note that theoretically all the failure elements should be considered for accuracy purposes. However, the inclusion of elements with relatively low failure probabilities will sharply increase the computational costs. The neglection of these failure elements normally results in a good balance between simplicity and accuracy. In this example, these elements are shown in Figure 4, in which the failure elements are ascending ordered with respect to reliability index. Figure 4 shows that among all the elements, elements No. 4, No. 6, No. 7, No. 9, No. 11, No. 2 and No. 12 are more vulnerable elements with their reliability indices smaller than 2.0.
Based on Equations (8) and (9), the correlation coefficient matrix with respect to the failure elements for the intact structure is obtained, as shown in Table 3. It can be seen from Table 3 that the beam elements (especially adjacent beam elements) are usually highly correlated. For example, the correlation coefficient between Beams No. 4 and No. 9 in the same bay is 0.895 and the correlation coefficient for the adjacent Beams No. 4 and No. 6 on the first floor is as high as 0.933.
Then based on Table 2 and Equation (6) the failure reliability of the intact system is derived as:
Pf(intact) = 1.91 × 10⁻¹
The reliability of this system is:
β intact = Φ 1 ( P f ( intact ) ) = 0.87
Similarly, all the structural elements except Element 15 are selected as critical elements (Δβ = 2.10) for the precast frame in a damaged state. Therefore, the series system can be represented by the system shown in Figure 5. Figure 5 shows that elements No. 4, No. 9, No. 1 and No. 7 are the most vulnerable elements with their reliability indices smaller than 1.0 or even negative. This is because the removal of the central column No. 2 triggers a load distribution among the rest of the structural elements and as expected such distribution has a significant influence on those elements adjacent to the removed column.
In this case, the correlation coefficient matrix with respect to the failure elements for the damaged structure is obtained, as shown in Table 4. As the findings in Table 3, the correlation coefficients for beam elements are normally higher than that for column elements or that between beam and column elements.
Further, the failure probability, as well as the reliability of the damaged system, is calculated as:
Pf(damaged) = 7.42 × 10⁻¹
β damaged = Φ 1 ( P f ( damaged ) ) = 0.65
When the failure probabilities of the intact and damaged precast concrete frame are obtained, the quantification of the robustness indices for the precast concrete frame can be proceeded according to Equations (1)–(3):
R I = P f ( damaged ) P f ( intact ) P f ( intact ) = 2.88
β R = β intact β intact β damaged = 0.57
V = P ( r d , S ) P ( r 0 , S ) = 3.88
According to the definition of the redundancy-based robustness index RI in Equation (1), a value close to zero indicates absolute robust and a value approaching infinity indicates absolute non-robust. In the case of the prescribed precast concrete frame herein, the value of RI is 2.88 which is relatively small when compared with infinity or compared with the RI values found in other studies using the same calculation philosophy [42]. Similar results are found when the reliability-based robustness index βR and the vulnerability-based robustness index V are analysed. Therefore, the results of indices RI, βR and V indicate that the prescribed precast concrete frame is relatively robust. It is worth noting that, for these three robustness indices, there are still no standard values with respect to robustness indices to clearly identify whether a structure is robust or non-robust. This is because the probabilistic robustness indices are very sensitive to the sources of structural and non-structural variations including the structure type, the loading combinations, the used materials as well as methods used for structural analysis and mathematical calculations. More efforts are still needed for the scientific communities to reach a consensus on how to determine such standard values by further research.

5. Conclusions and Remarks

In this paper, the essences of structural robustness, the philosophy of robustness quantification as well as some robustness indices, i.e., the robustness quantification methodologies are given. Then a probabilistic framework for robustness quantification of precast concrete frames under seismic loading is developed. According to the findings above, the following conclusions can be drawn.
The proposed probabilistic robustness quantification framework is demonstrated to be feasible and effective by employing an example illustration. It is believed that the proposed framework in this work is theoretically rigorous, easy to use and generally applicable in most situations. It could be a good practical tool for those designers who need to evaluate structural safety from the viewpoint of robustness. The proposed framework shows a good balance between simplicity and accuracy and therefore indicates its limitations of failing to fully account for the nonlinear effects in concrete structures and the coupling effect of axial force, bending moment and shear force.
The illustration example demonstrates that the framework provides clear and useful information about the procedures to quantify structural robustness under a column removal scenario for precast concrete frame structures. In the example, flexural failure is assumed for beams and the failures due to axial force, bending moment and shear force are under consideration for column components. To quantify structural robustness in a probabilistic manner, the failure probability of the considered precast frame structure in the intact and the damaged states needs to be properly assessed, and the beta-unzipping method at level 1 used in this work proved to be effective. The redundancy (or vulnerability) based robustness indices (RI, βR and V) can be used to quantify the robustness of precast frames as they have the advantage of quantifying the difference between the intact and the damaged states of the structure. However, the interpretation of the results of these robustness indices should be careful because the judgement system of robustness is still not fully developed and deserves further attention.
For simplicity purposes, the strength-based limit state function is considered in the formulation of the framework. This treatment applies to both the precast and cast-in-place conventional concrete structures since the strength performances of the precast concrete components are believed to be comparable to that of the conventional concrete structures. In case the limit state function is based on other indicators, e.g., displacement or energy dissipation, the differences between precast concrete structures and cast-in-place concrete structures should be taken into consideration.
The analyses with respect to robustness quantification in this work are related to a specific damage situation (i.e., a central column removal scenario) in a simple frame with specific configurations. The associated results might only hold within the example and should be treated with care. In the given example, only the regular flexural capacity in beam components is taken into account and other favourable effects due to, e.g., the membrane actions in slabs and beams [42], as well as the hardening effect in steel reinforcements are not considered. The influences due to these effects on robustness quantification are of interest and deserve more investigation in the future.

Author Contributions

Y.Z.: Conceptualization, Methodology, Supervision, Writing—Original Draft, Review and Editing; Y.H.: Data Curation, Writing—Original Draft; Z.S.: Writing—Review and Supervision. All authors have read and agreed to the published version of the manuscript.

Funding

This research was funded by the Natural Science Foundation Program of Jiangsu Province (BK20180393) and the National Natural Science Foundation of China (Grant No. 52008089 and 52178120).

Institutional Review Board Statement

Not applicable.

Informed Consent Statement

Not applicable.

Data Availability Statement

Not applicable.

Acknowledgments

The authors would like to acknowledge the financial support from the Natural Science Foundation Program of Jiangsu Province (BK20180393) and the National Natural Science Foundation of China (Grant No. 52008089 and 52178120).

Conflicts of Interest

The authors declare no conflict of interest.

References

  1. Ellingwood, B.R.; Leyendecker, E.V. Approaches for design against progressive collapse. J. Struct. Div. 1978, 104, 413–423. [Google Scholar] [CrossRef]
  2. Adam, J.M.; Parisi, F.; Sagaseta, J.; Lu, X. Research and practice on progressive collapse and robustness of building structures in the 21st century. Eng. Struct. 2018, 173, 122–149. [Google Scholar] [CrossRef]
  3. JCSS—The Joint Committee on Structural Safety. Risk Assessment in Engineering Principles, System Representation & Risk Criteria; JCSS: Lausanne, Switzerland, 2008. [Google Scholar]
  4. Canisius, T. Structural Robustness Design for Practising Engineers—COST Action TU0601; Robustness of Structures; European Cooperation in Science and Technology: Lausanne, Switzerland, 2011. [Google Scholar]
  5. Khandelwal, K.; El-Tawil, S. Pushdown resistance as a measure of robustness in progressive collapse analysis. Eng. Struct. 2011, 33, 2653–2661. [Google Scholar] [CrossRef]
  6. Ahmadi, H.R.; Mahdavi, N.; Bayat, M. Applying adaptive pushover analysis to estimate incremental dynamic analysis curve. J. Earthq. Tsunami 2020, 14, 2050016. [Google Scholar] [CrossRef]
  7. Shafigh, A.; Ahmadi, H.R.; Bayat, M. Seismic investigation of cyclic pushover method for regular reinforced concrete bridge. Struct. Eng. Mech. Int’l J. 2021, 78, 41–52. [Google Scholar]
  8. Sae-Long, W.; Limkatanyu, S.; Panedpojaman, P.; Prachasaree, W.; Damrongwiriyanupap, N.; Kwon, M.; Hansapinyo, C. Nonlinear winkler-based frame element with inclusion of shear-flexure interaction effect for analysis of non-ductile RC members on foundation. J. Appl. Comput. Mech. 2021, 7, 148–164. [Google Scholar]
  9. Limkatanyu, S.; Sae-Long, W.; Damrongwiriyanupap, N.; Imjai, T.; Chaimahawan, P.; Sukontasukkul, P. Shear-flexure Interaction Frame Model on Kerr-type Foundation for Analysis of Non-ductile RC Members on Foundation. J. Appl. Comput. Mech. 2022, 8, 1076–1090. [Google Scholar]
  10. Khoo, J.H.; Li, B.; Yip, W.K. Tests on precast concrete frames with connections constructed away from column faces. ACI Struct. J. 2006, 103, 18–27. [Google Scholar]
  11. Park, R. Seismic design and construction of precast concrete buildings in New Zealand. PCI J. 2002, 47, 60–75. [Google Scholar] [CrossRef]
  12. Shiohara, H.; Watanabe, F. The Japan PRESS precast concrete connection design. In Proceedings of the 12th WCEE, Auckland, New Zealand, 30 January–4 February 2000; pp. 1–8. [Google Scholar]
  13. Chen, S.C.; Yan, W.M.; Gao, J. Experimental investigation on the seismic performance of large-scale interior beam-column joints with composite slab. Adv. Struct. Eng. 2012, 15, 1227–1237. [Google Scholar] [CrossRef]
  14. Park, R.; Bull, D.K. Seismic resistance of frames incorporating precast prestressed concrete beam shells. PCI J. 1986, 31, 54–93. [Google Scholar]
  15. Cheok, G.S.; Lew, H. Performance of precast concrete beam-to-column connections subject to cyclic loading. PCI J. 1991, 36, 56–67. [Google Scholar] [CrossRef]
  16. Xue, W.C.; Yang, X.L. Seismic tests of precast concrete, moment-resisting frames and connections. PCI J. 2010, 55, 102–121. [Google Scholar] [CrossRef]
  17. Guan, D.; Guo, Z.; Xiao, Q.; Zheng, Y. Experimental study of a new beam-to-column connection for precast concrete frames under reversal cyclic loading. Adv. Struct. Eng. 2016, 19, 529–545. [Google Scholar] [CrossRef]
  18. Wang, C.; Liu YZheng, X.; Wu, J. Experimental investigation of a precast concrete connection with all-steel bamboo-shaped energy dissipaters. Eng. Struct. 2019, 178, 298–308. [Google Scholar] [CrossRef]
  19. Pampanin, S.; Priestley, M.N.; Sritharan, S. Analytical modelling of the seismic behaviour of precast concrete frames designed with ductile connections. J. Earthq. Eng. 2001, 5, 329–367. [Google Scholar] [CrossRef]
  20. De La Fuente, A.; Aguado, A.; Molins, C.; Armengou, J. Numerical model for the analysis up to failure of precast concrete sections. Comput. Struct. 2012, 106, 105–114. [Google Scholar] [CrossRef]
  21. Feng, D.C.; Wu, G.; Lu, Y. Finite element modelling approach for precast reinforced concrete beam-to-column connections under cyclic loading. Eng. Struct. 2018, 174, 49–66. [Google Scholar] [CrossRef] [Green Version]
  22. Feng, D.C.; Wang, Z.; Wu, G. Progressive collapse performance analysis of precast reinforced concrete structures. Struct. Des. Tall Spec. Build. 2019, 28, e1588. [Google Scholar] [CrossRef]
  23. Feng, D.C.; Xie, S.C.; Deng, W.N.; Ding, Z.D. Probabilistic failure analysis of reinforced concrete beam-column sub-assemblage under column removal scenario. Eng. Fail. Anal. 2019, 100, 381–392. [Google Scholar] [CrossRef]
  24. Yekrangnia, M.; Taheri, A.; Zahrai, S.M. Experimental and numerical evaluation of proposed precast concrete connections. Struct. Concr. 2016, 17, 959–971. [Google Scholar] [CrossRef]
  25. Brunesi, E.; Nascimbene, R. Experimental and numerical investigation of the seismic response of precast wall connections. Bull. Earthq. Eng. 2017, 15, 5511–5550. [Google Scholar] [CrossRef]
  26. Baker, J.W.; Schubert, M.; Faber, M.H. On the assessment of robustness. Struct. Saf. 2008, 30, 253–267. [Google Scholar] [CrossRef]
  27. CEN (Comité Européen de Normalisation). EN 1990; Eurocode 0: Basis of Structural Design; European Committee for Standardization: Brussels, Belgium, 2002. [Google Scholar]
  28. Biondini, F.; Restelli, S. Damage propagation and structural robustness. In Proceedings of the International Symposium on Life-Cycle Civil Engineering (IALCCE’08), Lake Como, Italy, 11–14 June 2008; pp. 131–136. [Google Scholar]
  29. Frangopol, D.M.; Curley, J.P. Effects of damage and redundancy on structural reliability. J. Struct. Eng. 1987, 113, 1533–1549. [Google Scholar] [CrossRef]
  30. Starossek, U.; Haberland, M. Approaches to measures of structural robustness. Struct. Infrastruct. Eng. 2011, 7, 625–631. [Google Scholar] [CrossRef]
  31. Kanda, J. Normalized failure cost as a measure of a structure importance. Nucl. Eng. Des. 1996, 160, 299–305. [Google Scholar] [CrossRef]
  32. Faber, M.H.; Kübler, O.; Fontana, M.; Knobloch, M. Failure Consequences and Reliability Acceptance Criteria for Exceptional Building Structures; Verlag der Fachvereine Hochschulverlag: Zurich, Switzerland, 2004. [Google Scholar]
  33. Fu, G.; Frangopol, D.M. Balancing weight, system reliability and redundancy in a multiobjective optimization framework. Struct. Saf. 1990, 7, 165–175. [Google Scholar] [CrossRef]
  34. Lind, N.C. A measure of vulnerability and damage tolerance. Reliab. Eng. Syst. Saf. 1995, 48, 1–6. [Google Scholar] [CrossRef]
  35. Thoft-Christensen, P.; Murotsu, Y. Application of Structural Systems Reliability Theory; Springer: Berlin/Heidelberg, Germany, 1986. [Google Scholar]
  36. JCSS—The Joint Committee on Structural Safety. Probabilistic Model Code; Joint Committee on Structural Safety: Lausanne, Switzerland, 2001. [Google Scholar]
  37. Gao, X.; Bao, A. Probabilistic model and its statistical parameters for seismic load. Earthq. Eng. Eng. Vib. 1985, 5, 13–22. [Google Scholar]
  38. Holický, M.; Sýkora, M. Stochastic models in analysis of structural reliability. In Proceedings of the International Symposium on Stochastic Models in Reliability Engineering, Life Sciences and Operation Management, Beer Sheva, Israel, 8–11 February 2010; pp. 8–11. [Google Scholar]
  39. CEN (Comité Européen de Normalisation). EN 1992-1-1; Eurocode 2: Design of Concrete Structures—Part 1-1: General Rules and Rules for Buildings; European Committee for Standardization: Brussels, Belgium, 2004. [Google Scholar]
  40. Rackwitz, R.; Flessler, B. Structural reliability under combined random load sequences. Comput. Struct. 1978, 9, 489–494. [Google Scholar] [CrossRef]
  41. JGJ 1-2014; Technical Specification for Precast Concrete Structure. The Ministry of Housing and Urban-Rural Development, Architecture & Building Press: Beijing, China, 2014.
  42. Zeng, Y.; Botte, W.; Caspeele, R. Reliability analysis of FRP strengthened RC beams considering compressive membrane action. Constr. Build. Mater. 2018, 169, 473–488. [Google Scholar] [CrossRef]
Figure 3. Skeleton of the considered precast concrete frame: geometry, applied loads and numbering of structural elements.
Applsci 12 03814 g003
Figure 4. The series system representing the intact precast concrete frame.
Applsci 12 03814 g004
Figure 5. The series system representing the damaged precast concrete frame.
Applsci 12 03814 g005
Table 1. Uncertainty characterization of random variables.
XDescriptionDistribution TypeMean μXstd., σX
GPermanent loadNormalspecified0.05μX
QVariable load (50 year)Gumbel0.6 Qk0.35μX
FEquivalent static shear forceGumbel1.0 Fk0.3 μX
asConcrete coverBeta *specified10 mm
fckConcrete strengthLognormalfck + 2 σ0.15μX
EcConcrete modulus of elasticityLognormal22[(fck + 8)/10]0.30.15μX
εcuConcrete ultimate compressive strainLognormalspecified0.15μX
fySteel yield strengthLognormalfyk + 2 σ30 MPa
* Lower bound a = 0; upper bound, b = 3μX.
Table 2. Failure probability of structural elements.
ElementFailure ProbabilityReliability Index
IntactDamagedIntactDamaged
Beam No. 48.55 × 10−26.25 × 10−11.37−0.32
Beam No. 67.51 × 10−21.61 × 10−21.442.14
Beam No. 95.14 × 10−25.63 × 10−11.63−0.16
Beam No. 114.57 × 10−22.37 × 10−21.691.98
Beam No. 141.25 × 10−47.44 × 10−23.661.44
Beam No. 154.17 × 10−51.29 × 10−33.933.01
Column No. 13.48 × 10−32.53 × 10−12.700.67
Column No. 24.28 × 10⁻²N/A1.72N/A
Column No. 37.38 × 10−39.52 × 10−22.441.31
Column No. 52.14 × 10−23.74 × 10−22.021.78
Column No. 76.19 × 10−21.75 × 10−11.540.93
Column No. 81.55 × 10−21.66 × 10−22.162.13
Column No. 108.72 × 10−31.01 × 10−12.381.27
Column No. 122.89 × 10−24.42 × 10−21.901.70
Column No. 133.82 × 10−31.39 × 10−22.672.20
Table 3. The correlation coefficient matrix for the intact structure.
i/j46791121258103131
ρij =41.0000.9330.4660.8950.8870.4420.3050.4760.4040.3000.2860.2840.425
60.9331.0000.4620.8870.8780.4380.3020.4720.4000.2970.2810.2810.423
70.4660.4621.0000.4460.4430.4330.2800.4550.4540.2640.3250.2730.351
90.8950.8870.4461.0000.9280.4030.3810.4500.3670.3730.2390.3510.374
110.8870.8780.4430.9281.0000.4000.3780.4470.3630.3700.2380.3490.371
20.4420.4380.4330.4030.4001.0000.2520.4140.4100.2390.3880.2460.393
120.3050.3020.2800.3810.3780.2521.0000.2300.2160.4430.1790.4440.186
50.4760.4720.4550.4500.4470.4140.2301.0000.4360.2180.3070.2250.342
80.4040.4000.4540.3670.3630.4100.2160.4361.0000.2030.3110.2140.329
100.3000.2970.2640.3730.3700.2390.4430.2180.2031.0000.1690.4150.178
30.2860.2810.3250.2390.2380.3880.1790.3070.3110.1691.0000.1780.349
130.2840.2810.2730.3510.3490.2460.4440.2250.2140.4150.1781.0000.182
10.4250.4230.3510.3740.3710.3930.1860.3420.3290.1780.3490.1821.000
Table 4. The correlation coefficient matrix for the damaged structure.
i/j491710314125118613
ρij =41.0000.9000.5030.4630.4050.3610.7780.3970.478−0.8120.376−0.8610.340
90.9001.0000.4540.4340.4450.3140.8560.4350.450−0.8130.334−0.8080.366
10.5030.4541.0000.4340.3310.4350.3850.3380.407−0.4180.377−0.4670.306
70.4630.4340.4341.0000.3650.4300.3630.3940.448−0.4350.446−0.4660.371
100.4050.4450.3310.3651.0000.3000.4420.4340.335−0.3860.288−0.3530.368
30.3610.3140.4350.4300.3001.0000.2540.3380.376−0.3260.397−0.3770.336
140.7780.8560.3850.3630.4420.2541.0000.4310.369−0.7450.257−0.6820.356
120.3970.4350.3380.3940.4340.3380.4311.0000.341−0.4380.329−0.3960.436
50.4780.4500.4070.4480.3350.3760.3690.3411.000−0.4050.411−0.4430.304
11−0.812−0.813−0.418−0.435−0.386−0.326−0.745−0.438−0.4051.000−0.3630.898−0.421
80.3760.3340.3770.4460.2880.3970.2570.3290.411−0.3631.000−0.4000.331
6−0.861−0.808−0.467−0.466−0.353−0.377−0.682−0.396−0.4430.898−0.4001.000−0.383
130.3400.3660.3060.3710.3680.3360.3560.4360.304−0.4210.331−0.3831.000
Publisher’s Note: MDPI stays neutral with regard to jurisdictional claims in published maps and institutional affiliations.

