
A New Vehicle Dataset in the City of Los Angeles for V2X and Machine Learning Applications


Abstract
:1. Introduction
2. Literature Review
2.1. Related Work
2.2. Limitations of the Related Works
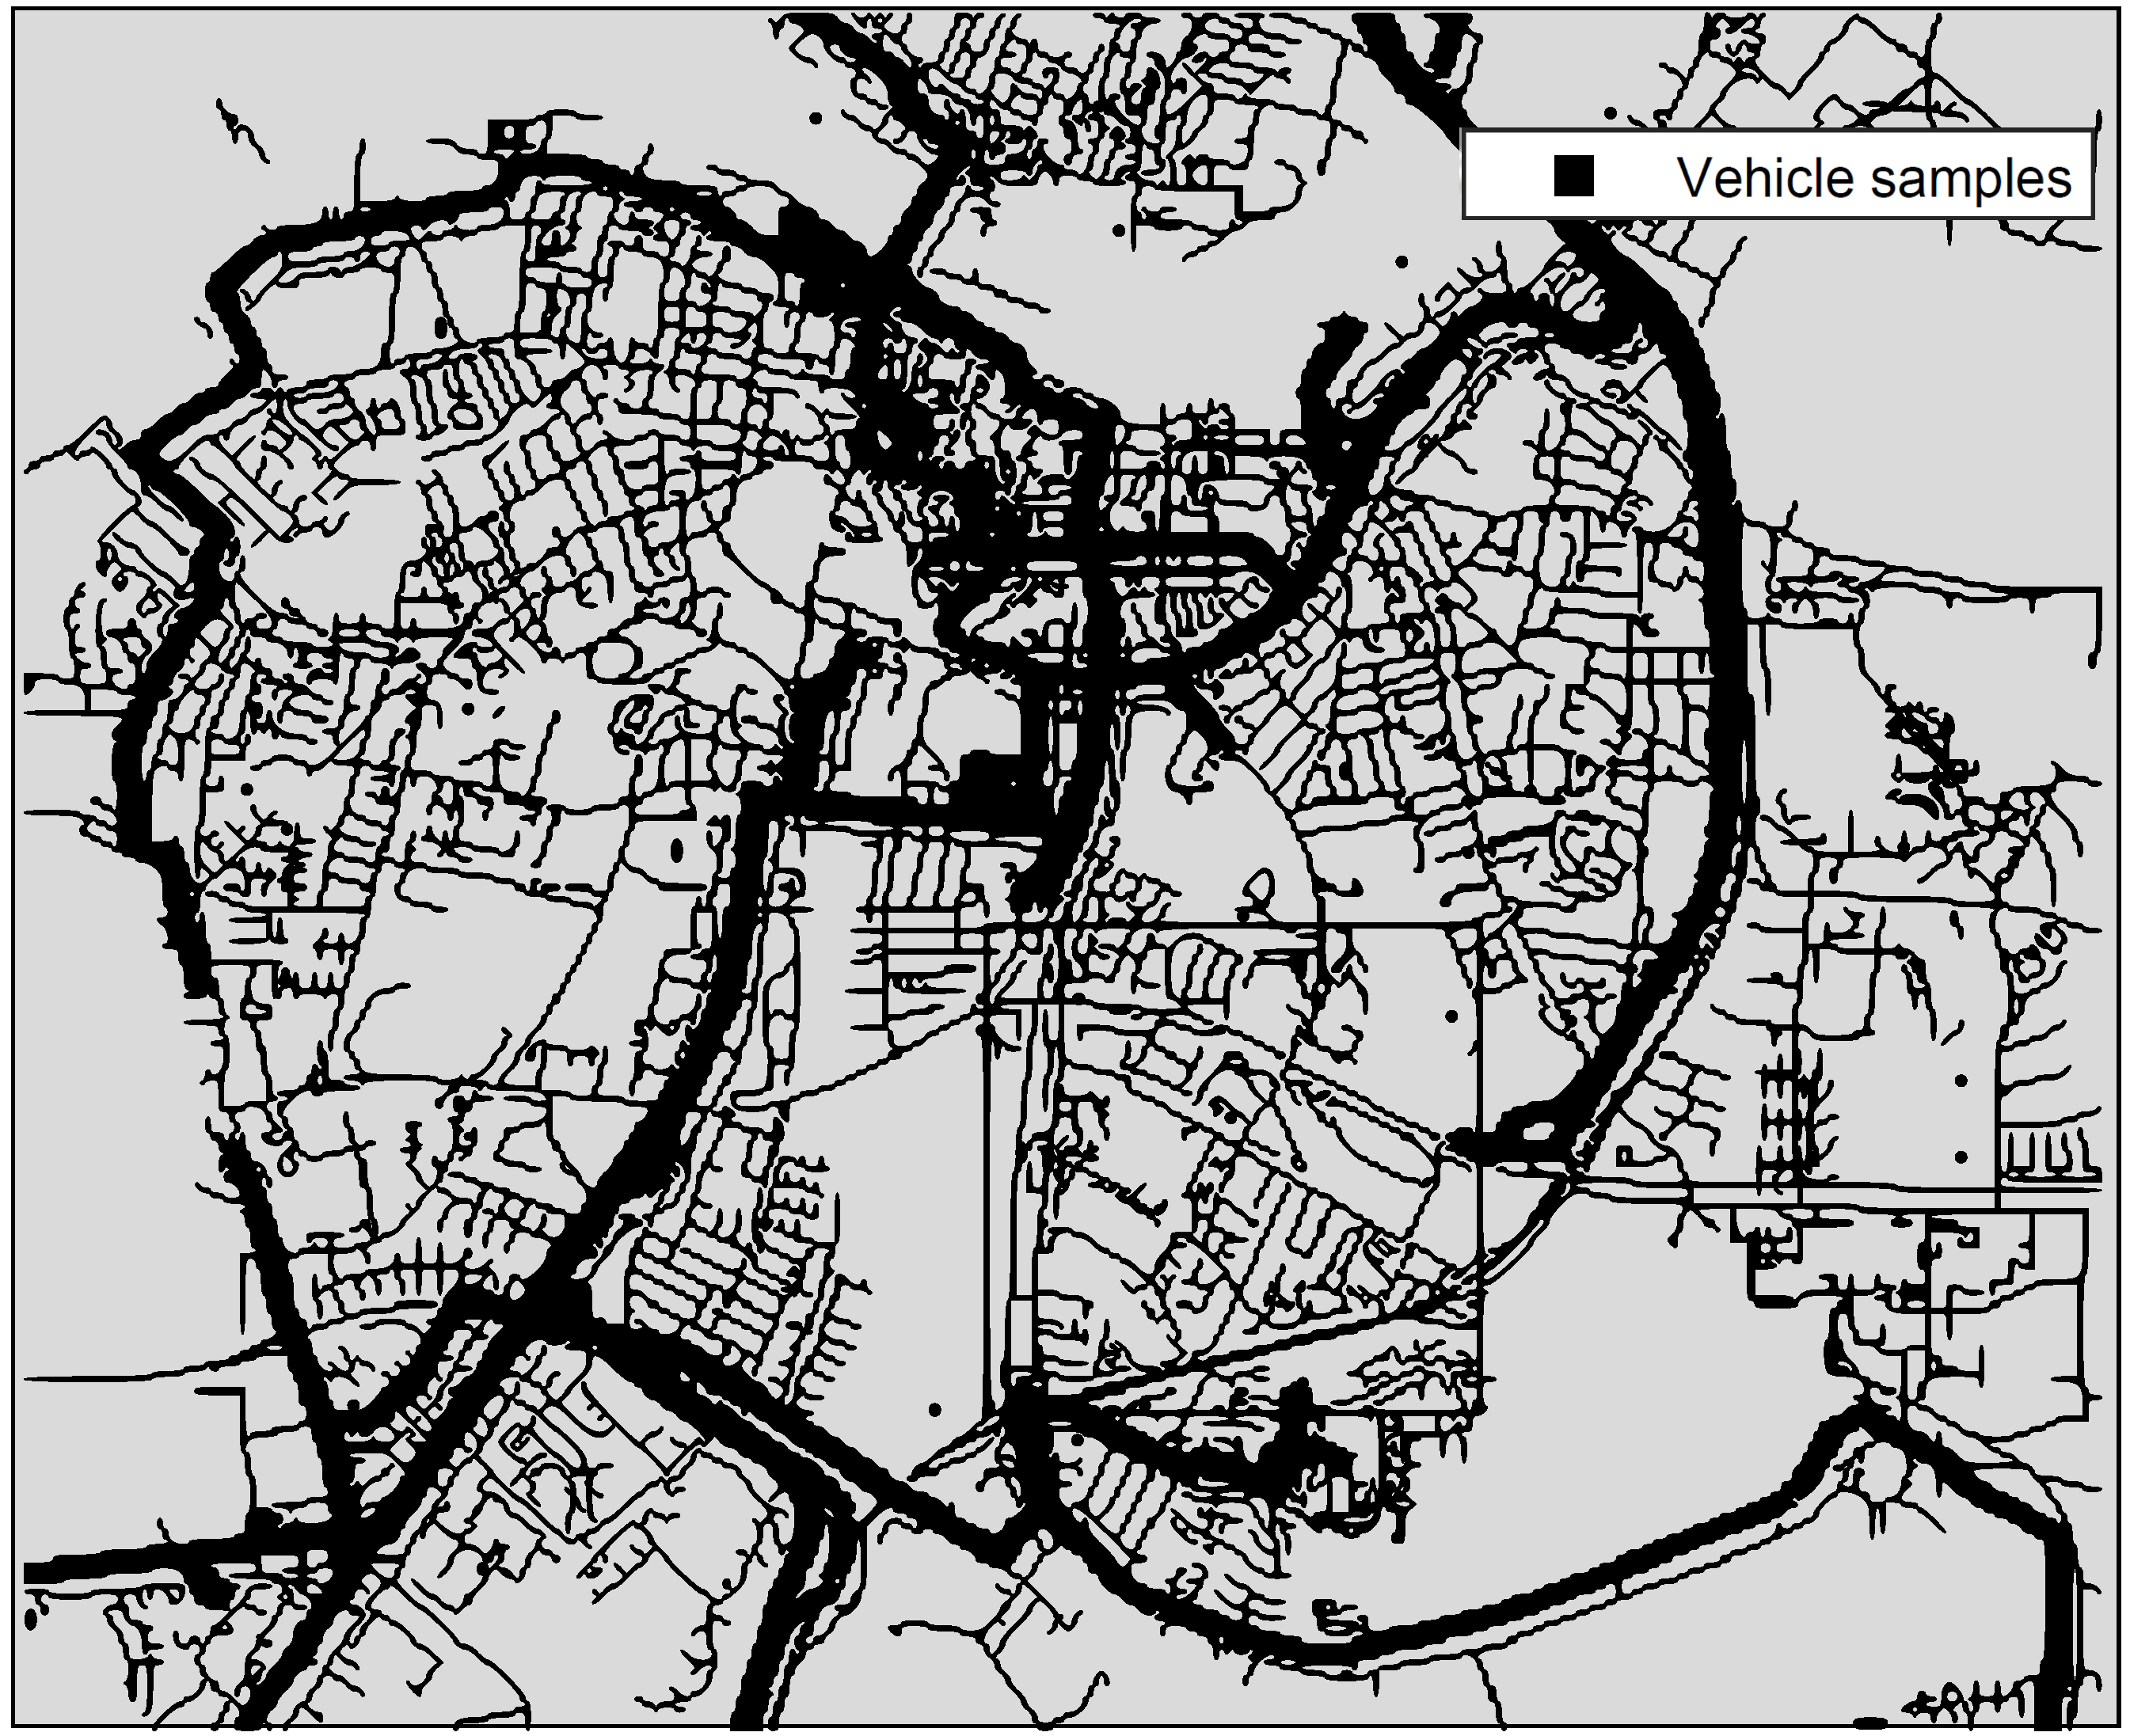
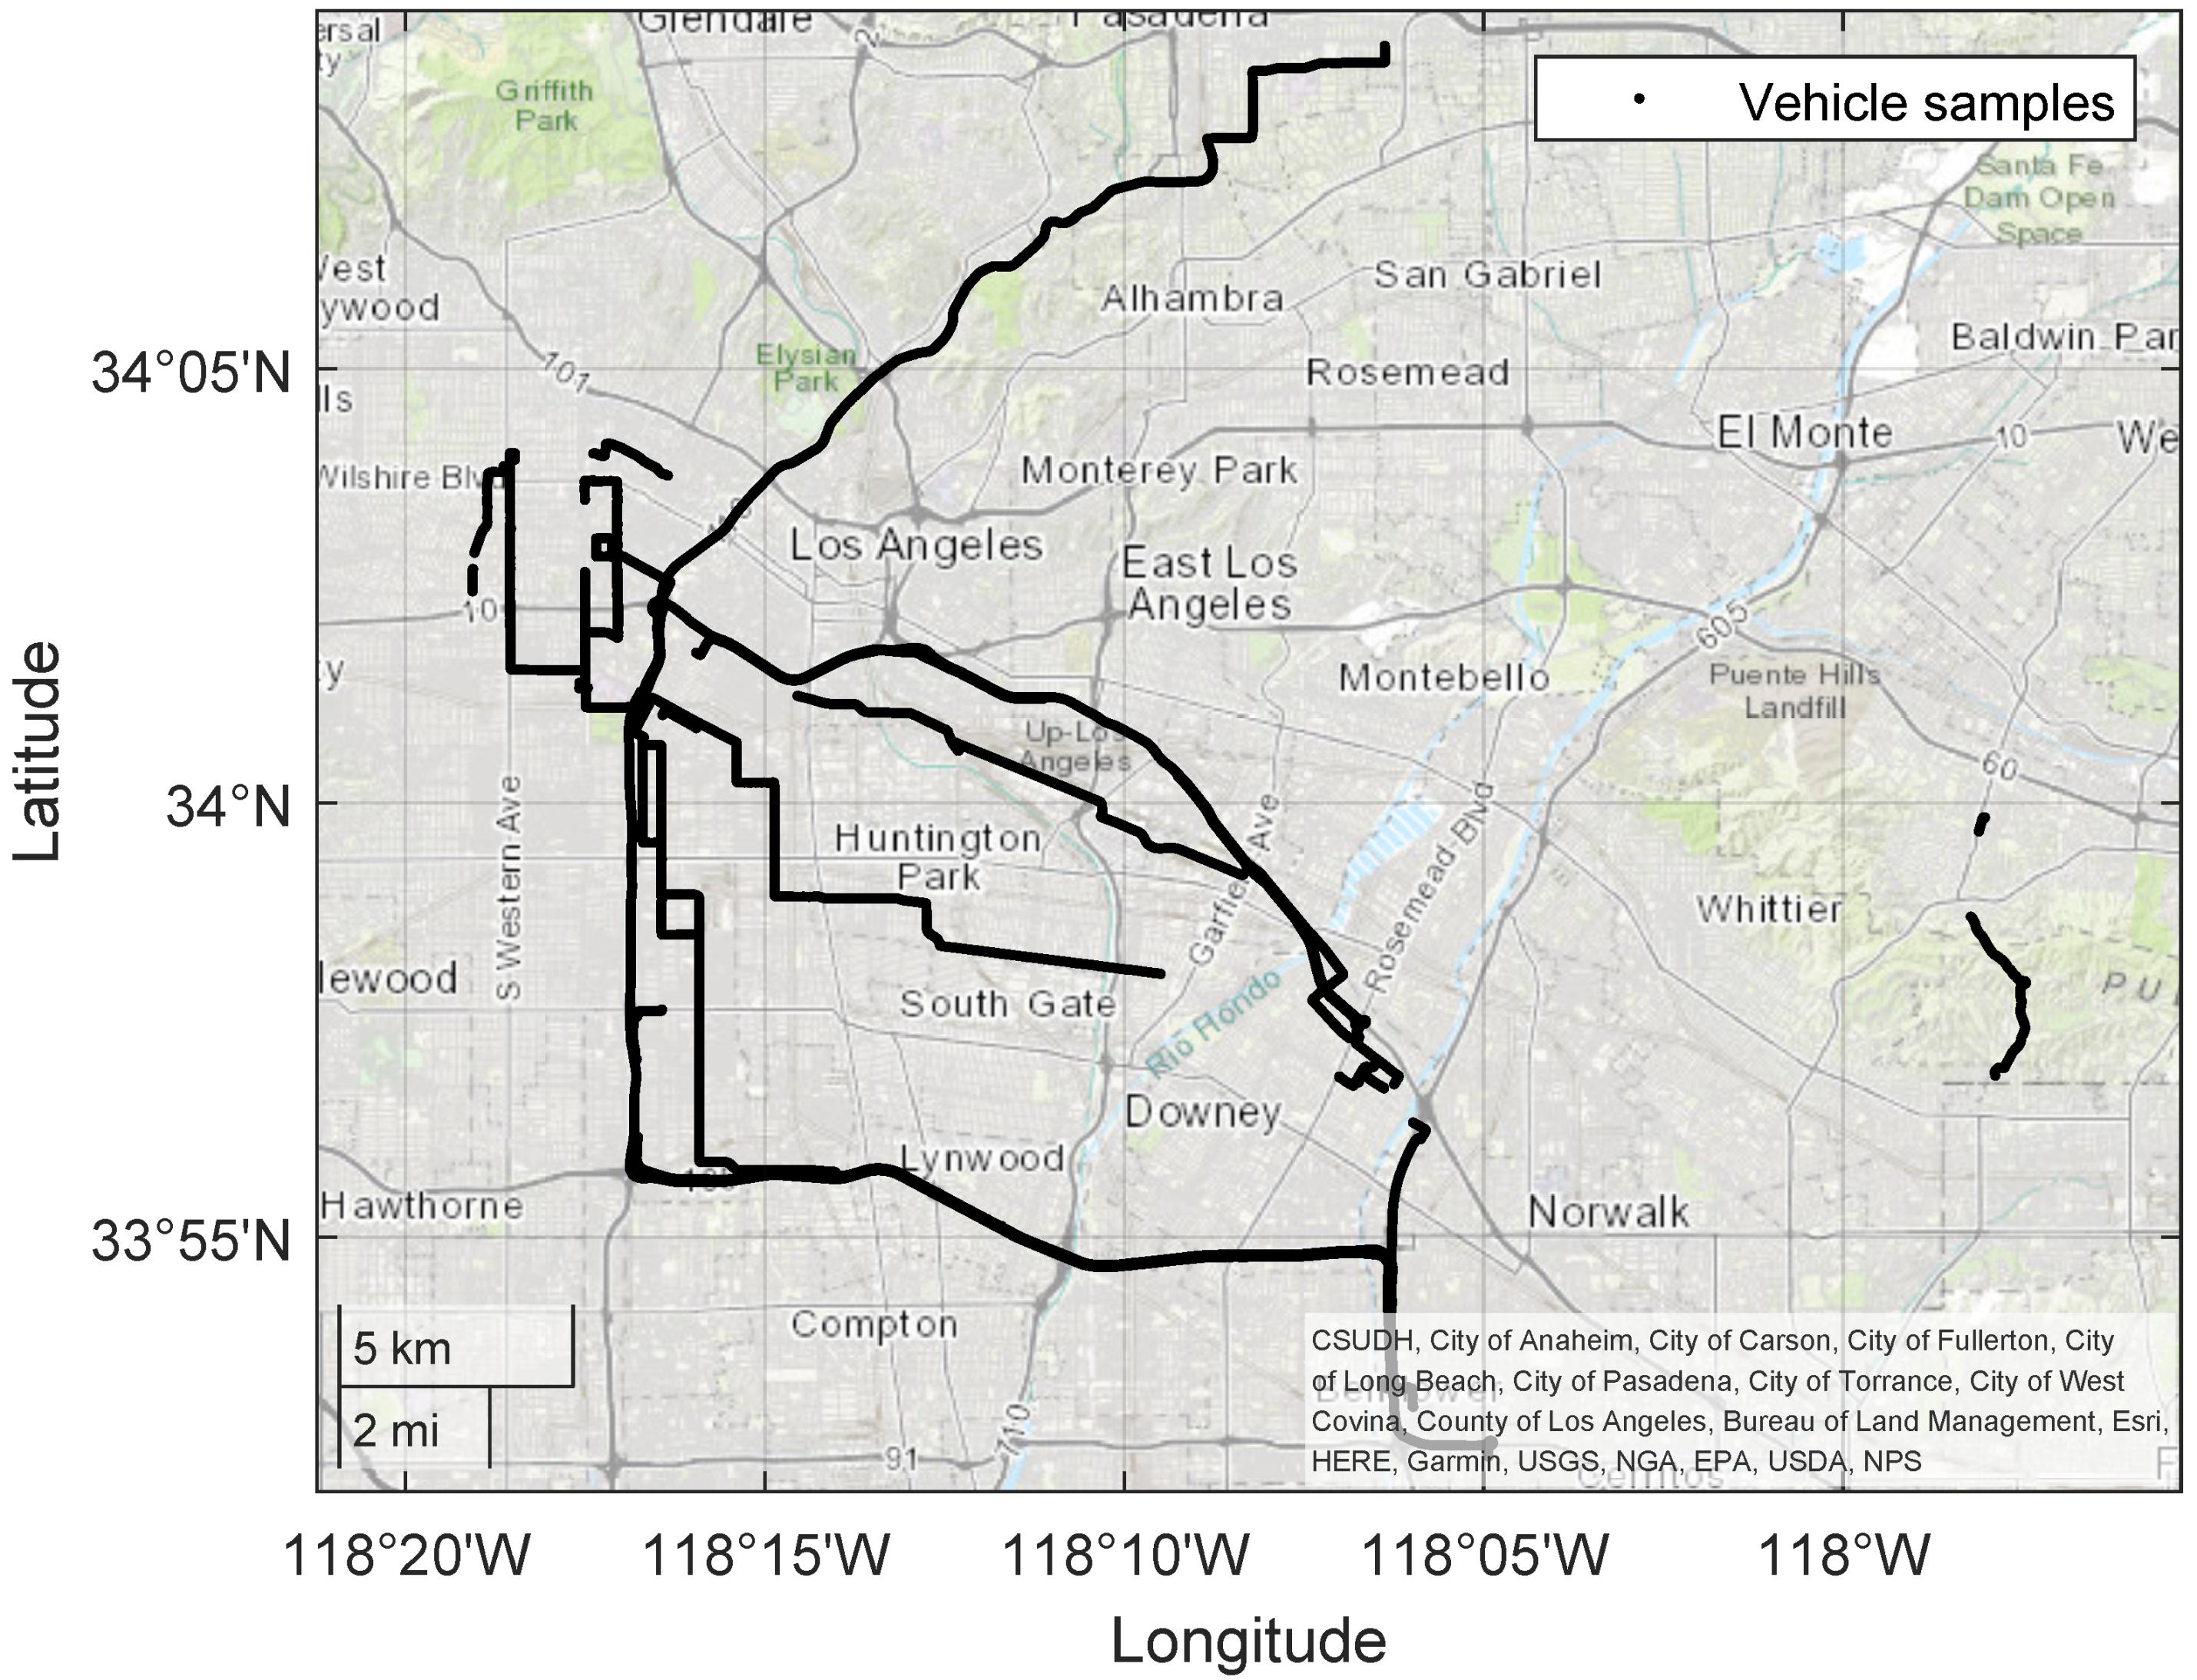
- Most of the vehicle samples are located on freeways, such as Harbor, Passadena, and Santa Ana, as shown in Figure 4. The distribution of vehicle samples should not focus on a particular type of street.
- The geographical distance between two consecutive samples is large around 20 m, as shown in Figure 7. A large space between samples is undesirable when applying machine learning techniques.
- The driving time for collecting the LA vehicle dataset was long (around 22 h).
- The recording process of the dataset required considerable effort, equipment, and tools (i.e, five types of sensors, MediaQ platform, smartphone, and a vehicle smartphone holder).
- The database includes samples that are not moving (i.e., vehicles with a speed of 0 km/h).
- The long time and huge effort required to record vehicle dataset samples.
- The need for equipment in the vehicle during the collecting process, such as GPS receivers, computers, and smartphones.
- The accuracy of the resulting samples is not guaranteed and it may deviate from the road on which the vehicles moved.
- Difficulty in updating and adding new samples to the resulting dataset, whereas, after some years, changes may occur to the streets on which the data were collected.
3. The Proposed Vehicle Dataset
3.1. Dataset Generation Method
- Phase 1: Creating Driving Routes: This phase was implemented through Google Maps. It includes three steps:
- –
- Step 1: Creating a new map of the city of Los Angeles.
- –
- Step 2: Adding driving routes for all the selected streets (15 streets in this study).
- –
- Step 3: Exporting a Keyhole Markup Language (KMZ) file for each driving route. An example of the contents of a KMZ file is shown in Figure 9.
- Phase 2: Generating the Vehicle Dataset: This phase was performed using the MATLAB simulator. This phase has three steps:
- –
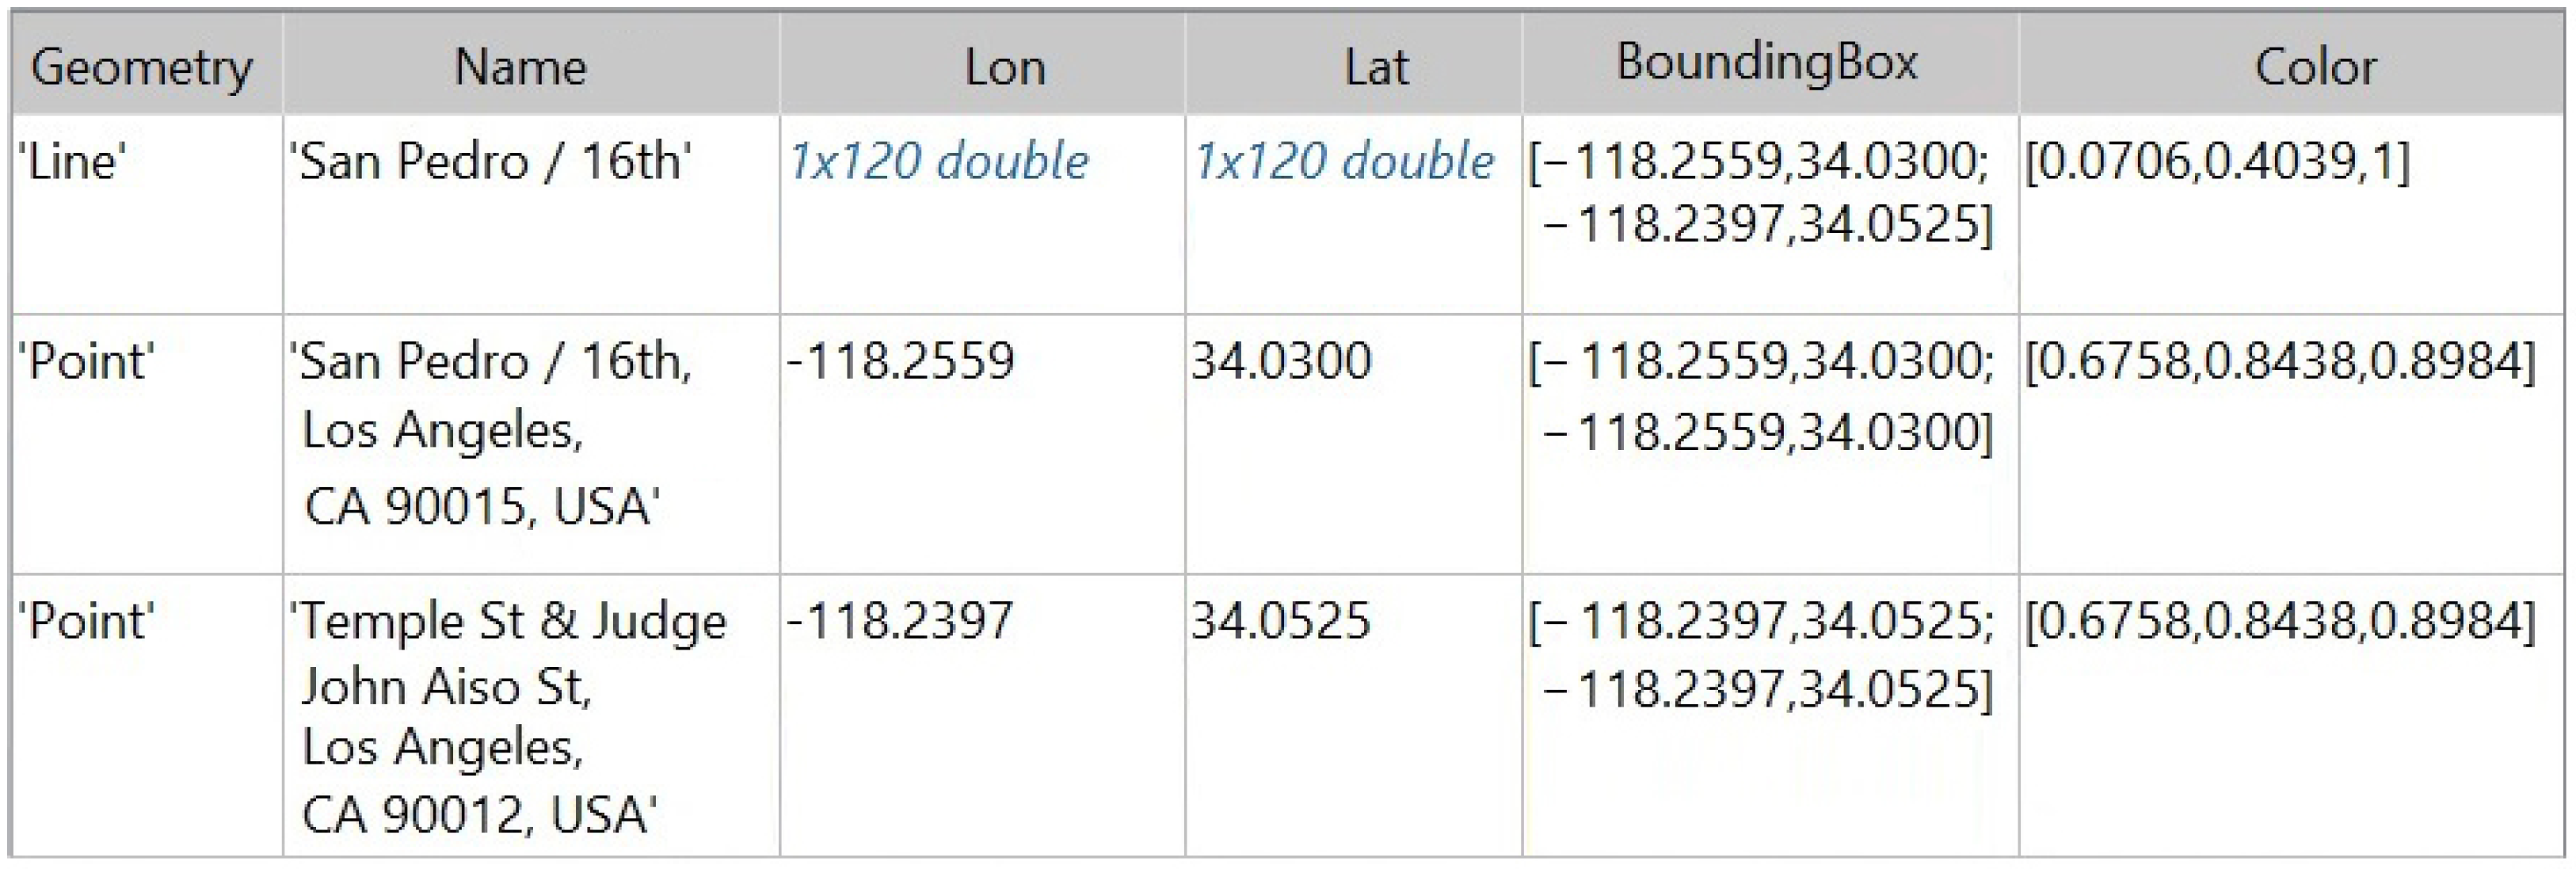
- Step 1: Reading the KMZ files and converting them into structure objects.
- –
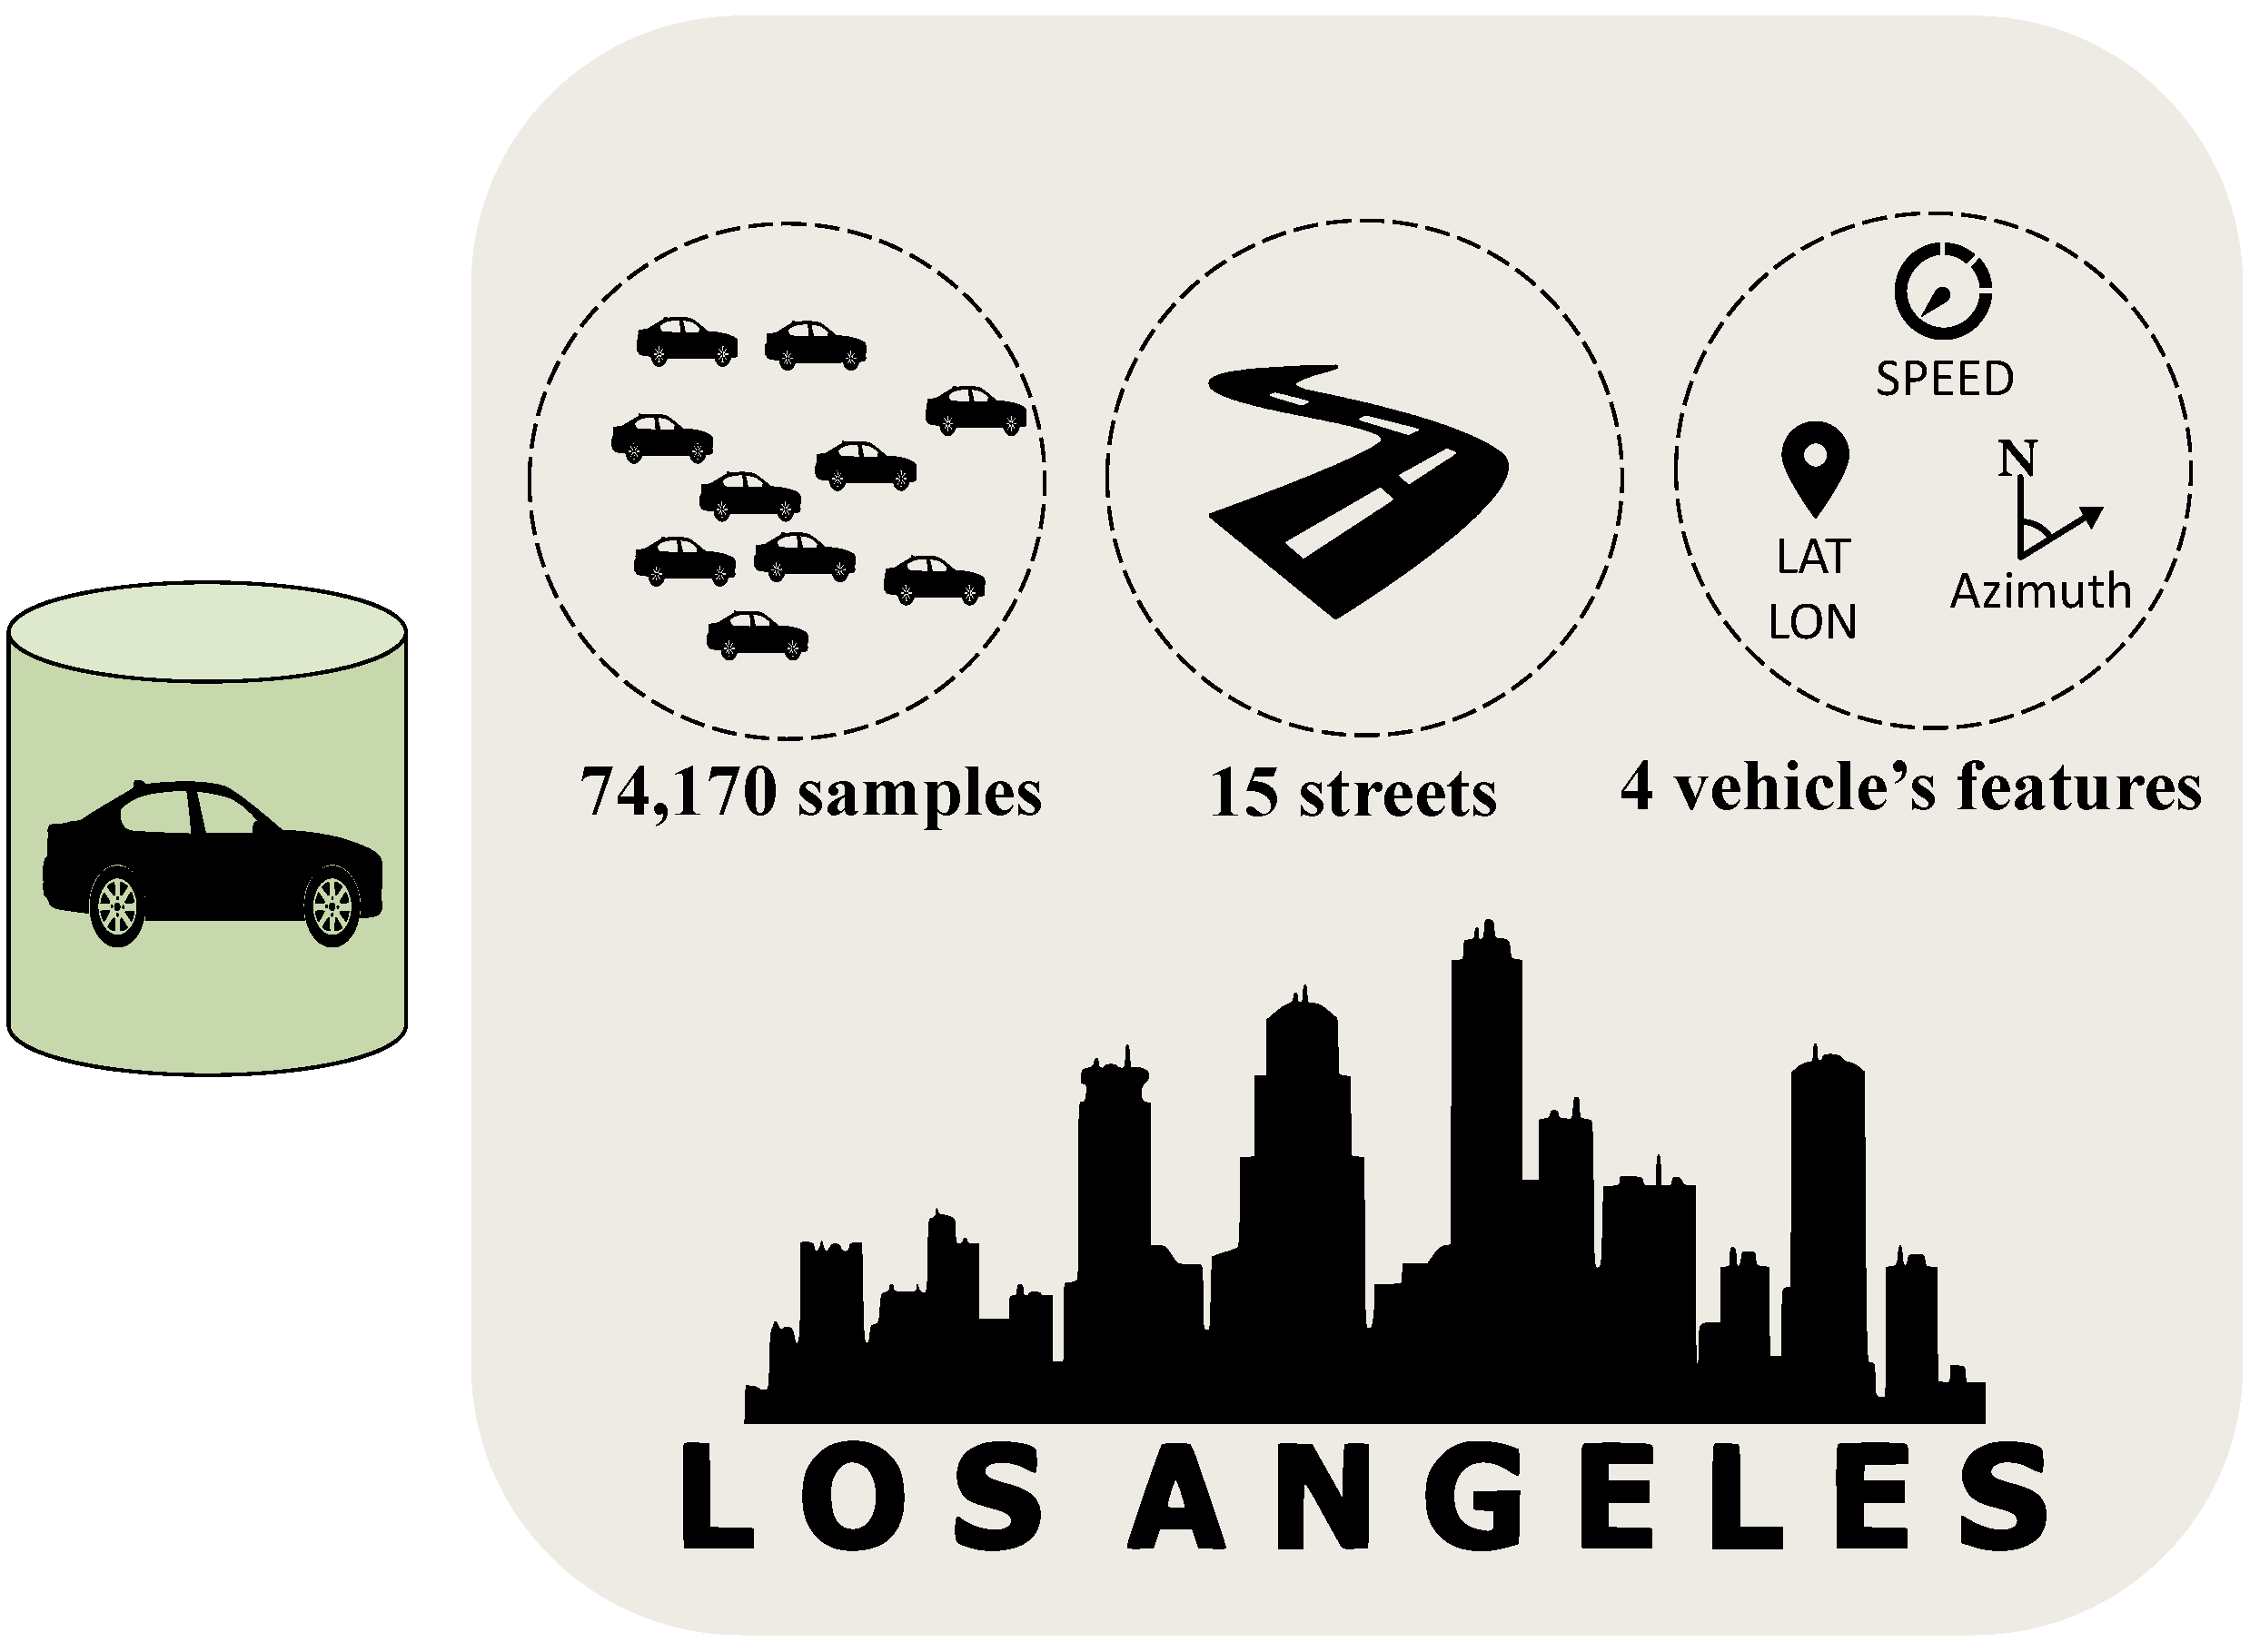
- Step 2: Generating extra vehicle samples so that the distance between two samples is small (0.25 m in this study). For each vehicle sample, four features were assigned: (1) latitude coordinate, (2) longitude coordinate, (3) vehicle speed, and (4) vehicle azimuth. The speeds were generated randomly in the range from 10 to 40 km per hour (km/h).
- –
- Step 3: Exporting the proposed VehDS-LA as a comma-separated values (CSV) file.
3.2. LA Vehicle Dataset Characteristics
3.3. The Advantages of the Proposed Dataset
- Generating the database does not require a long time, as in the related works, where it took days and months.
- The accuracy of the positions of vehicle samples which were produced based on Google Maps and the MATLAB simulator. It was verified that the samples are located on the LA streets without any deviation.
- There is no need to install special equipment and devices in the vehicle, such as a GPS receiver, small computer, or smartphone.
- The number of dataset samples is large and each sample has four features, which are the most important features of a vehicle for traffic simulation purposes.
- The method of generating the proposed VehDS-LA dataset introduces a general mechanism that can be followed in generating new databases in any region of the world on the basis of Google Maps.
3.4. The Uses of the VehDS-LA Dataset
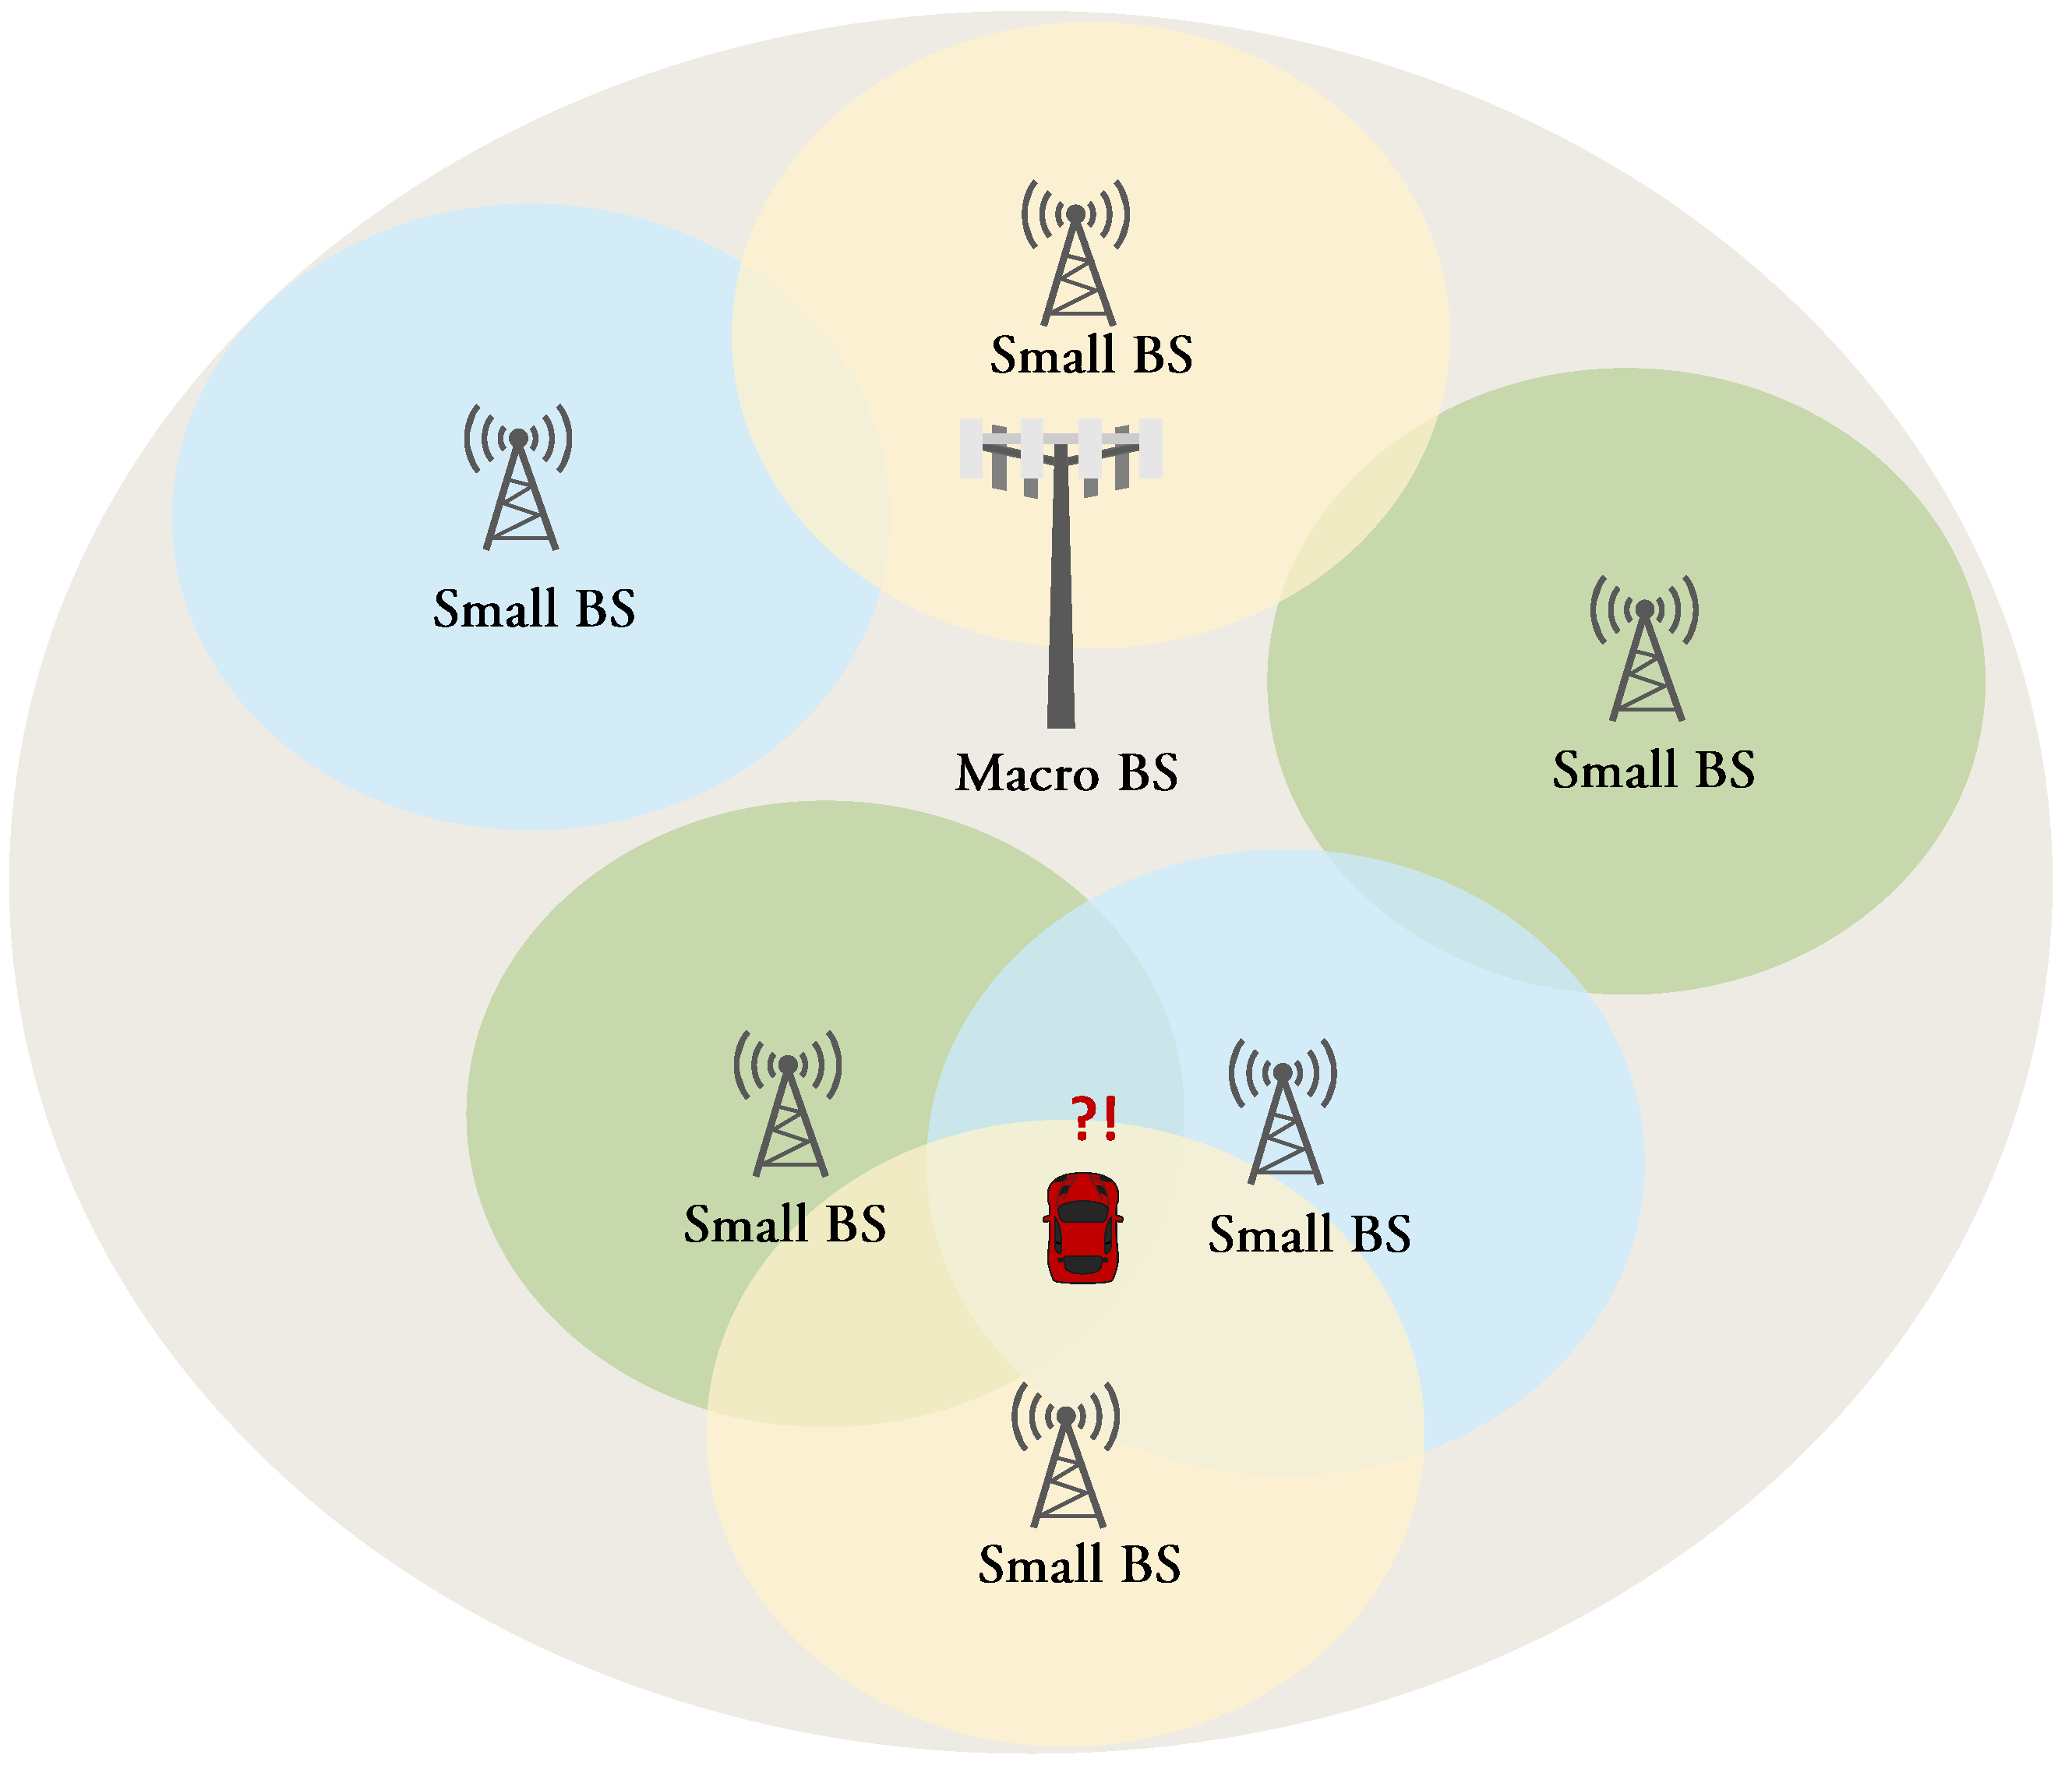
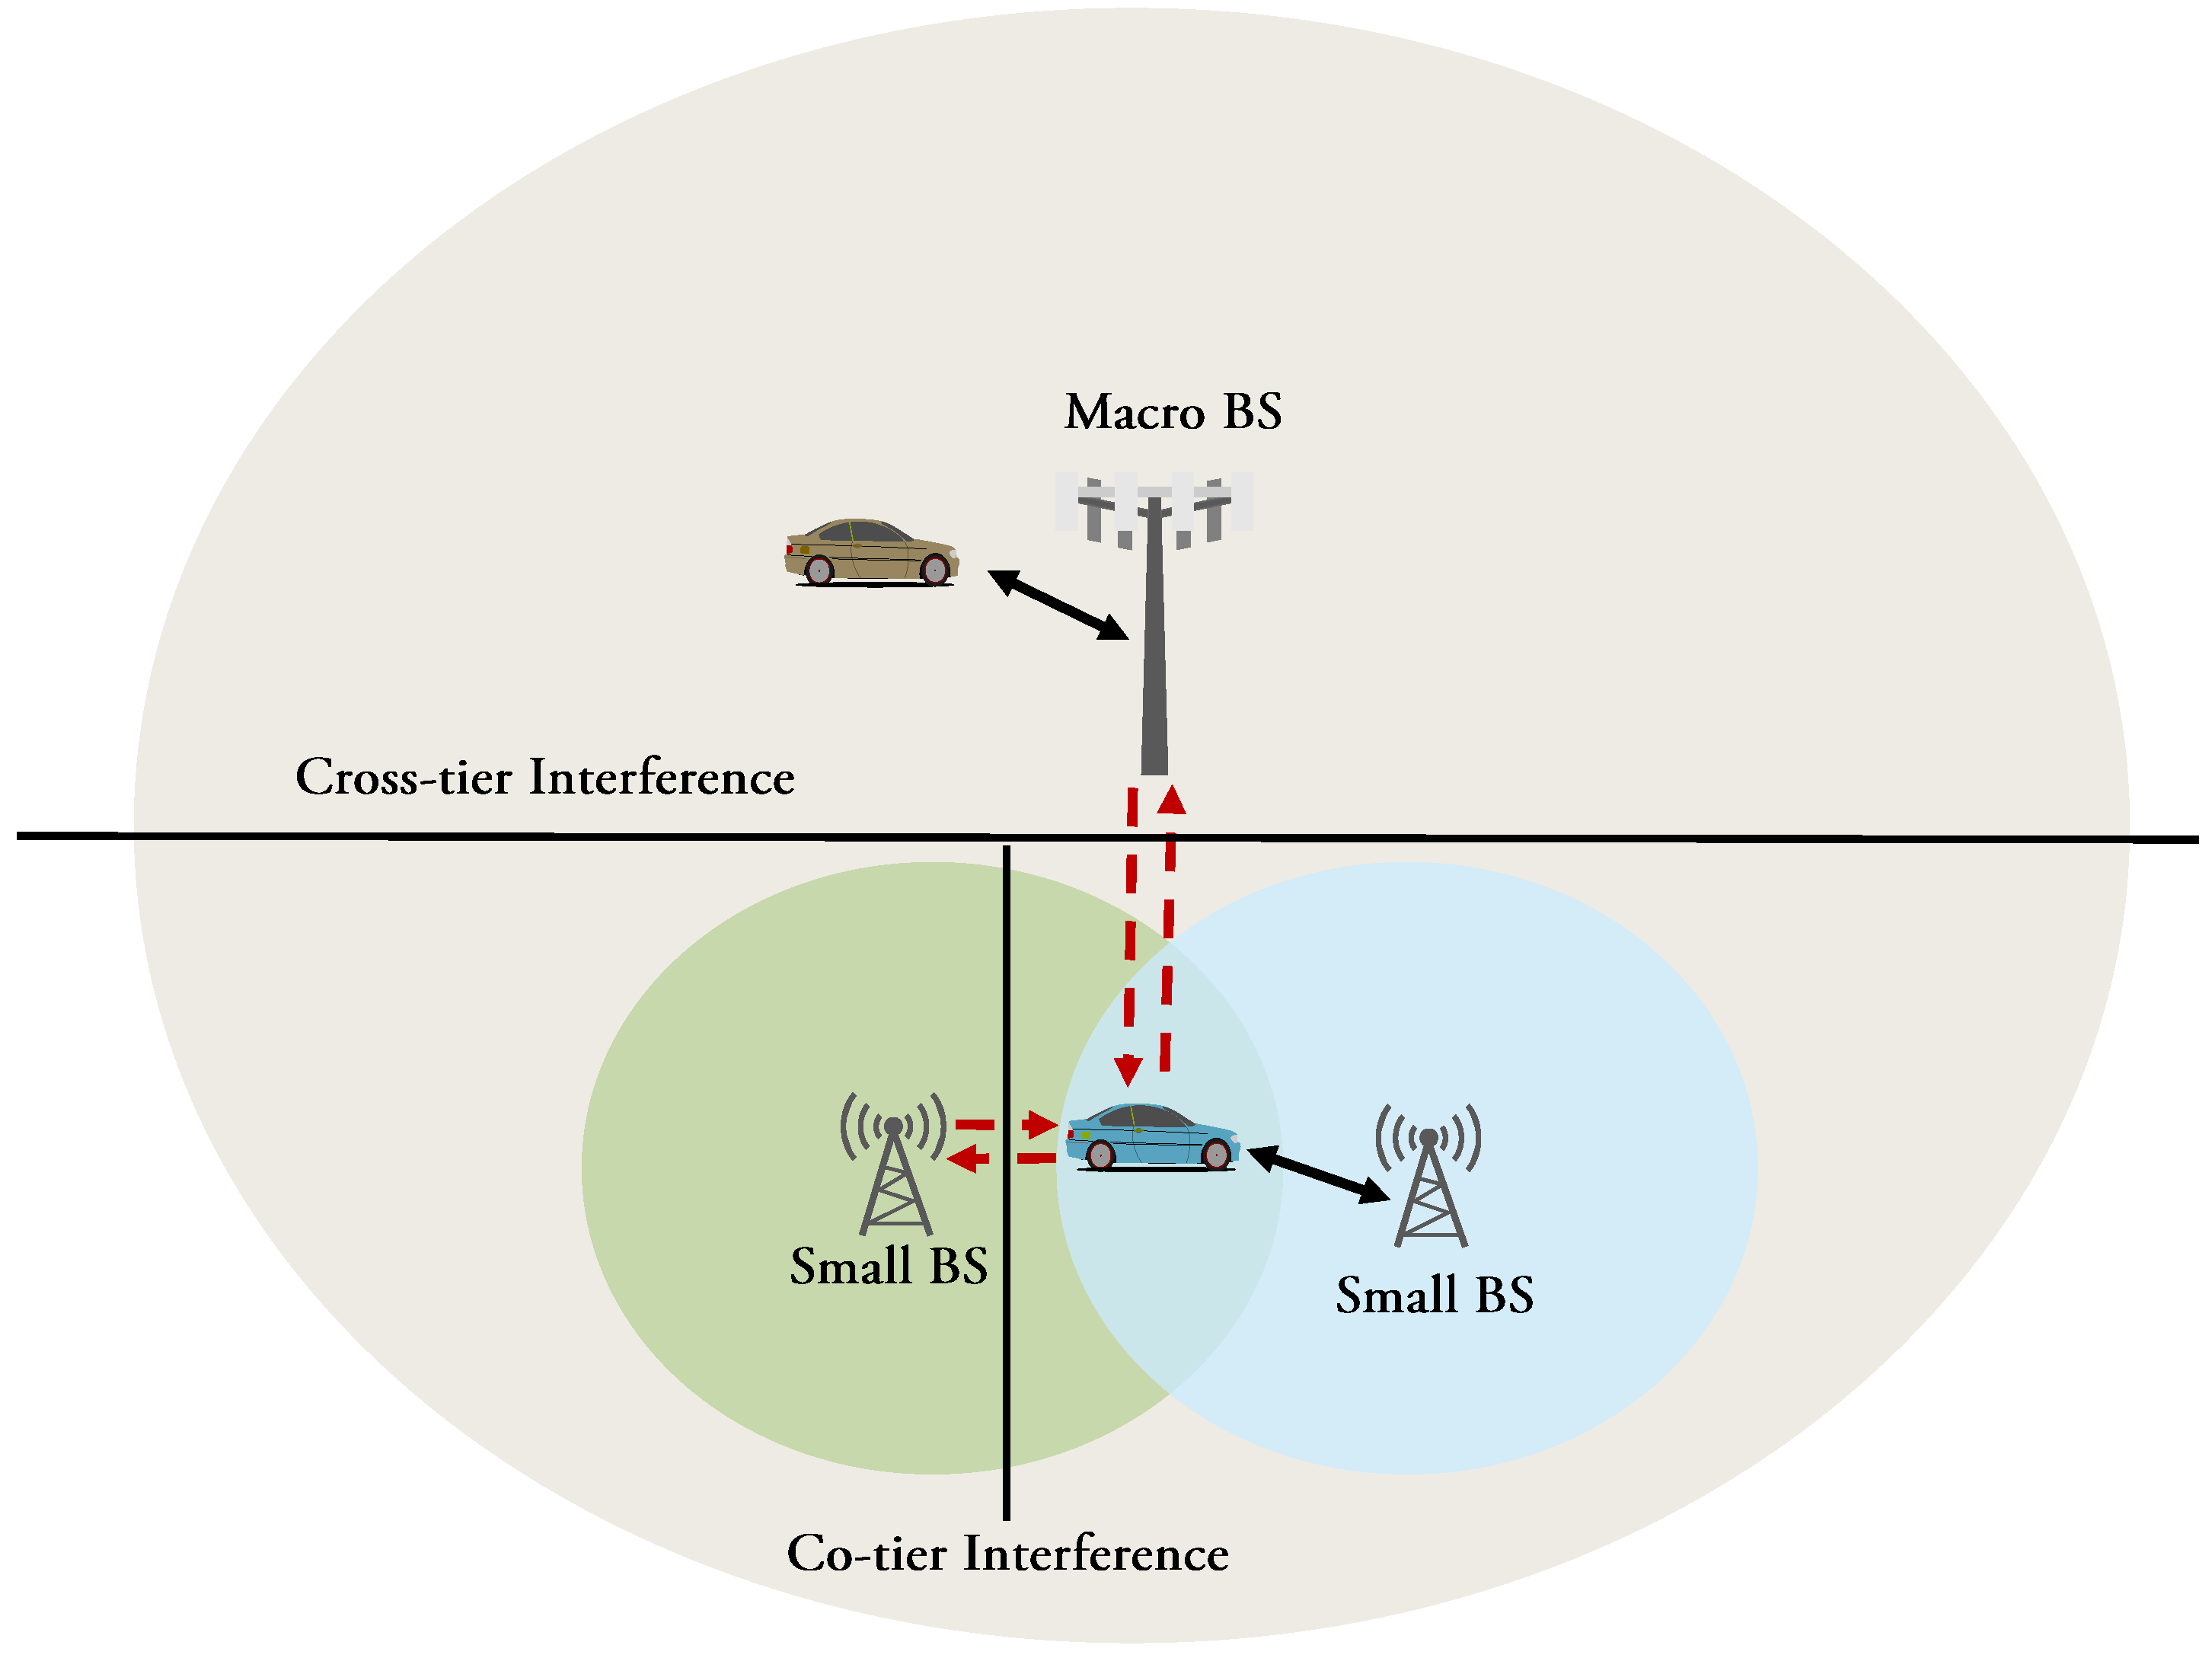
- 5G network studies: A heterogeneous ultra-dense network is a 5G-enabling technology that consists of a high density of small cells in addition to the legacy Long-Term Evolution (LTE) macro cells. HUDN aims to meet the requirements of increased capacity, low latency, and distributed traffic load with low installation cost [23,29]. The major issues associated with 5G HUDNs are cell selection, interference mitigation, and resource allocation [30]. Cell selection refers to the process of choosing the serving base station to which a vehicle will connect. The conventional approach of selecting cells is based on the received signal strength indicator (RSSI) value. In fact, this approach is inefficient in 5G HUDNs due to the existence of a large number of cells with different distribution and sizes [31]. Figure 13 shows the cell selection issue in an HUDN, where a red vehicle should select a serving cell, and RSSI values are not enough.HUDNs suffer from two types of interference: co-tier and cross-tier interference. Co-tier interference occurs between homogeneous cells, while cross-tier interference happens between heterogeneous cells [32], as shown in Figure 14. The proposed VehDS-LA dataset can be used in studies related to 5G HUDNs.
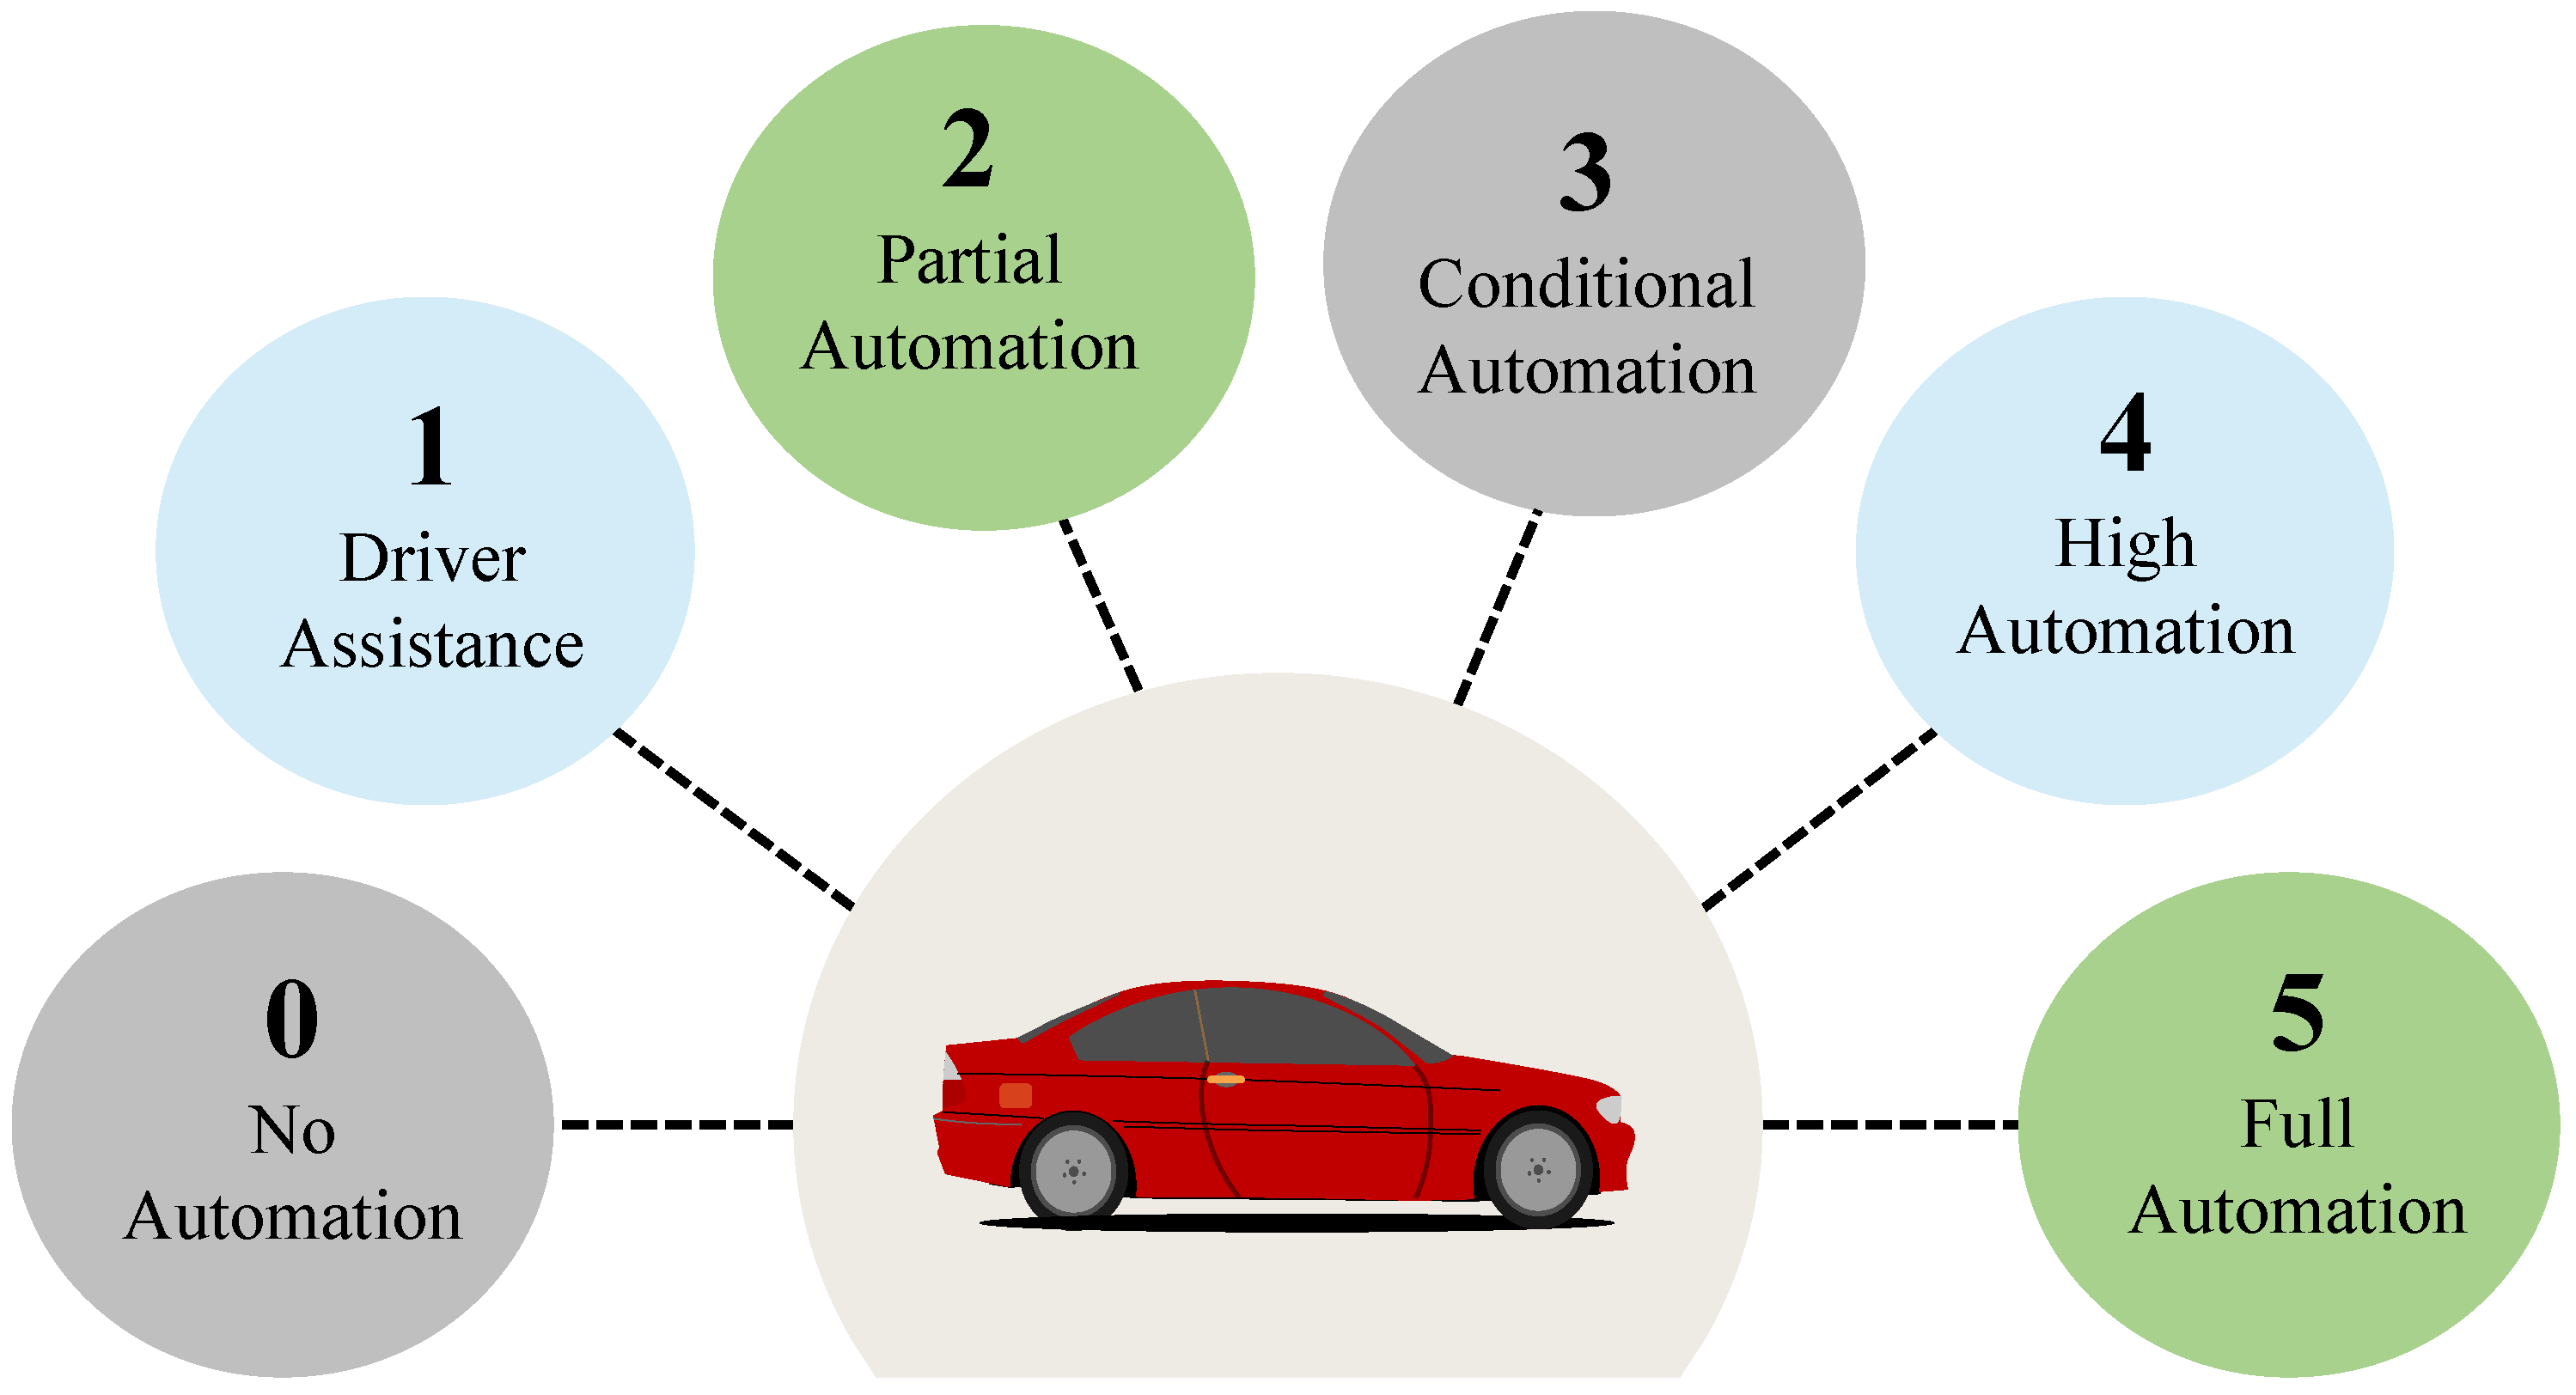
- Automation and driverless vehicles studies: Nowadays, vehicle automation is becoming a solution that is used to provide road safety and to prevent accidents [33]. The Society of Automotive Engineers (SAE) defines six levels of vehicle automation, as illustrated in Figure 15. The first three levels, i.e., levels 0 to 2, require driver attention. On the other hand, levels 3 to 4 give part of the responsibility for driving and monitoring roads to the vehicle itself, while level 5 provides full automation of vehicles [34]. Thus, the proposed dataset includes the essential vehicle features, i.e., geographical latitude and longitude coordinates, azimuths, and speeds of vehicle samples, which can be used in research related to vehicle automation.
- ML-based vehicle mobility studies: ML techniques provide remarkable opportunities in several fields, including transportation [35]. A good machine learning model needs a large number of samples to train the ML model [36]. Recent works that focus on vehicle movement issues, including [2,37], relied on solving research problems using machine learning algorithms, such as artificial neural networks (ANN) and support vector machine (SVM), Naive Bayes (NB), and Tree-based techniques. Figure 16 represents the process of building a machine learning model that is based on supervised learning to solve a vehicle mobility issue. The building process passes through many phases: data cleaning, data labeling, data dividing, ML model training, and ML model testing [2].
- –
- Data cleaning: In this phase, data that will not be used to solve the research problem are removed [38].
- –
- Data Labeling: This refers to the process of tagging vehicle samples so that the ML model can learn from it [39].
- –
- Data Dividing: This refers to splitting the dataset into two parts: training and testing sets. The dataset is usually divided into 80:20 or 70:30 ratios [40].
- –
- ML Model Training: The training set is used train the ML model.
- –
- ML Model Testing: The test set is used to evaluate the performance of the trained ML model.
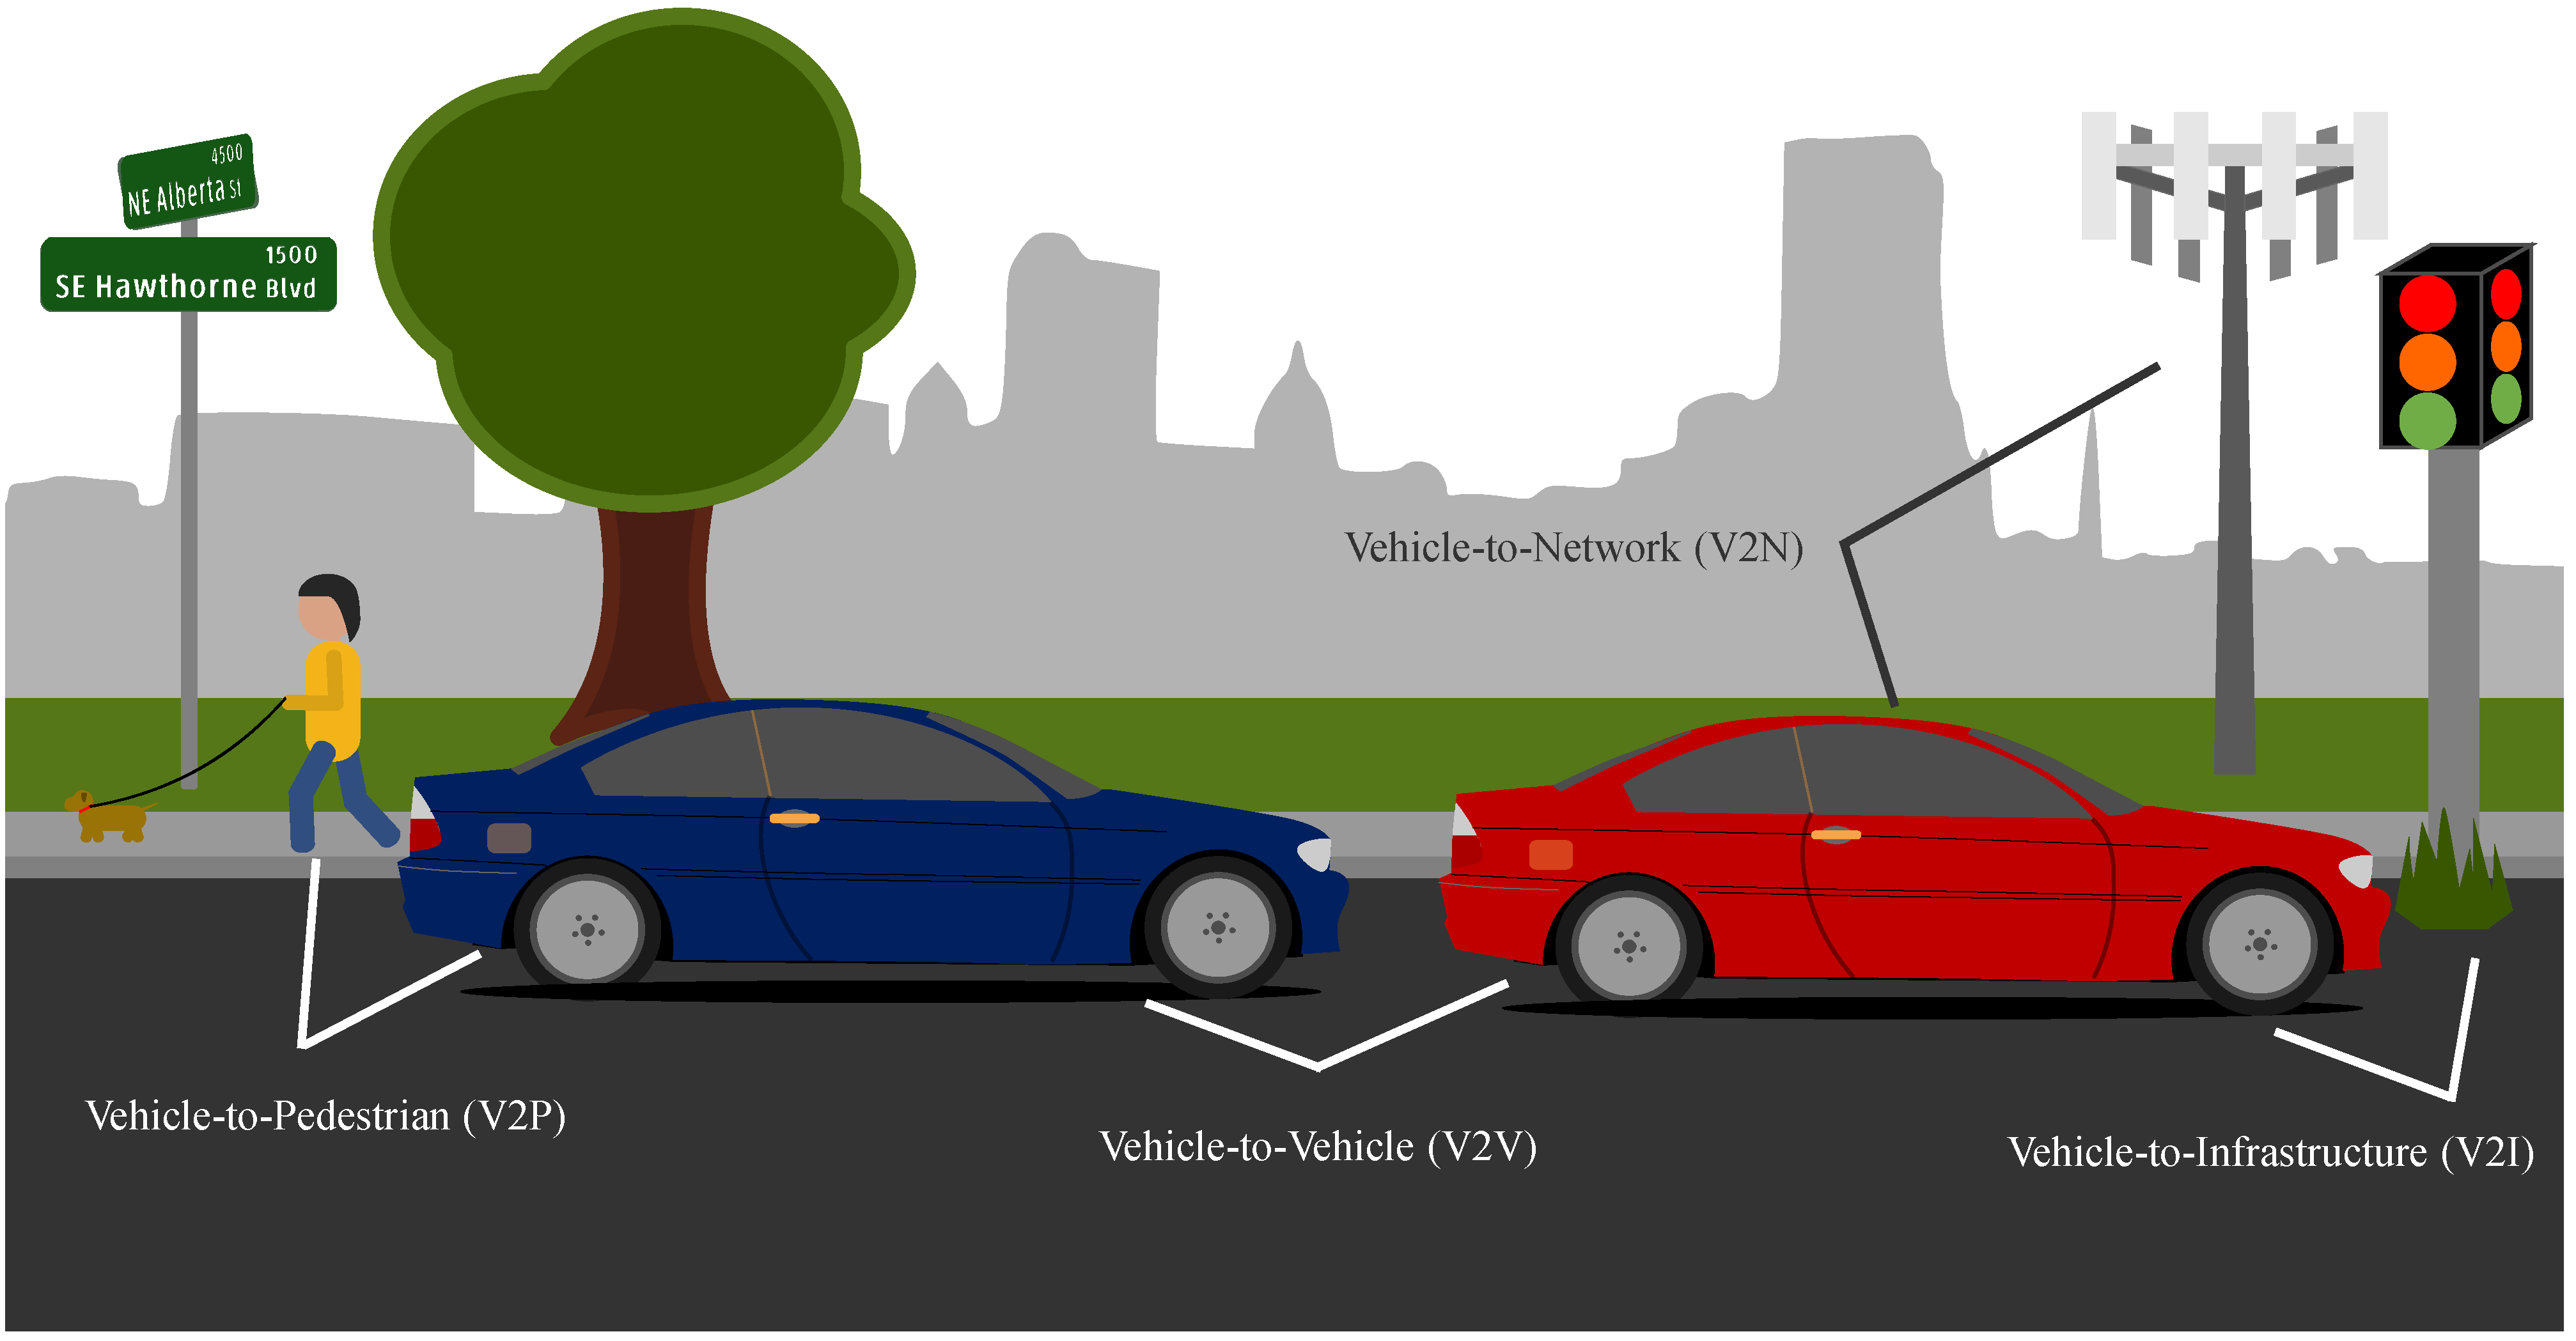
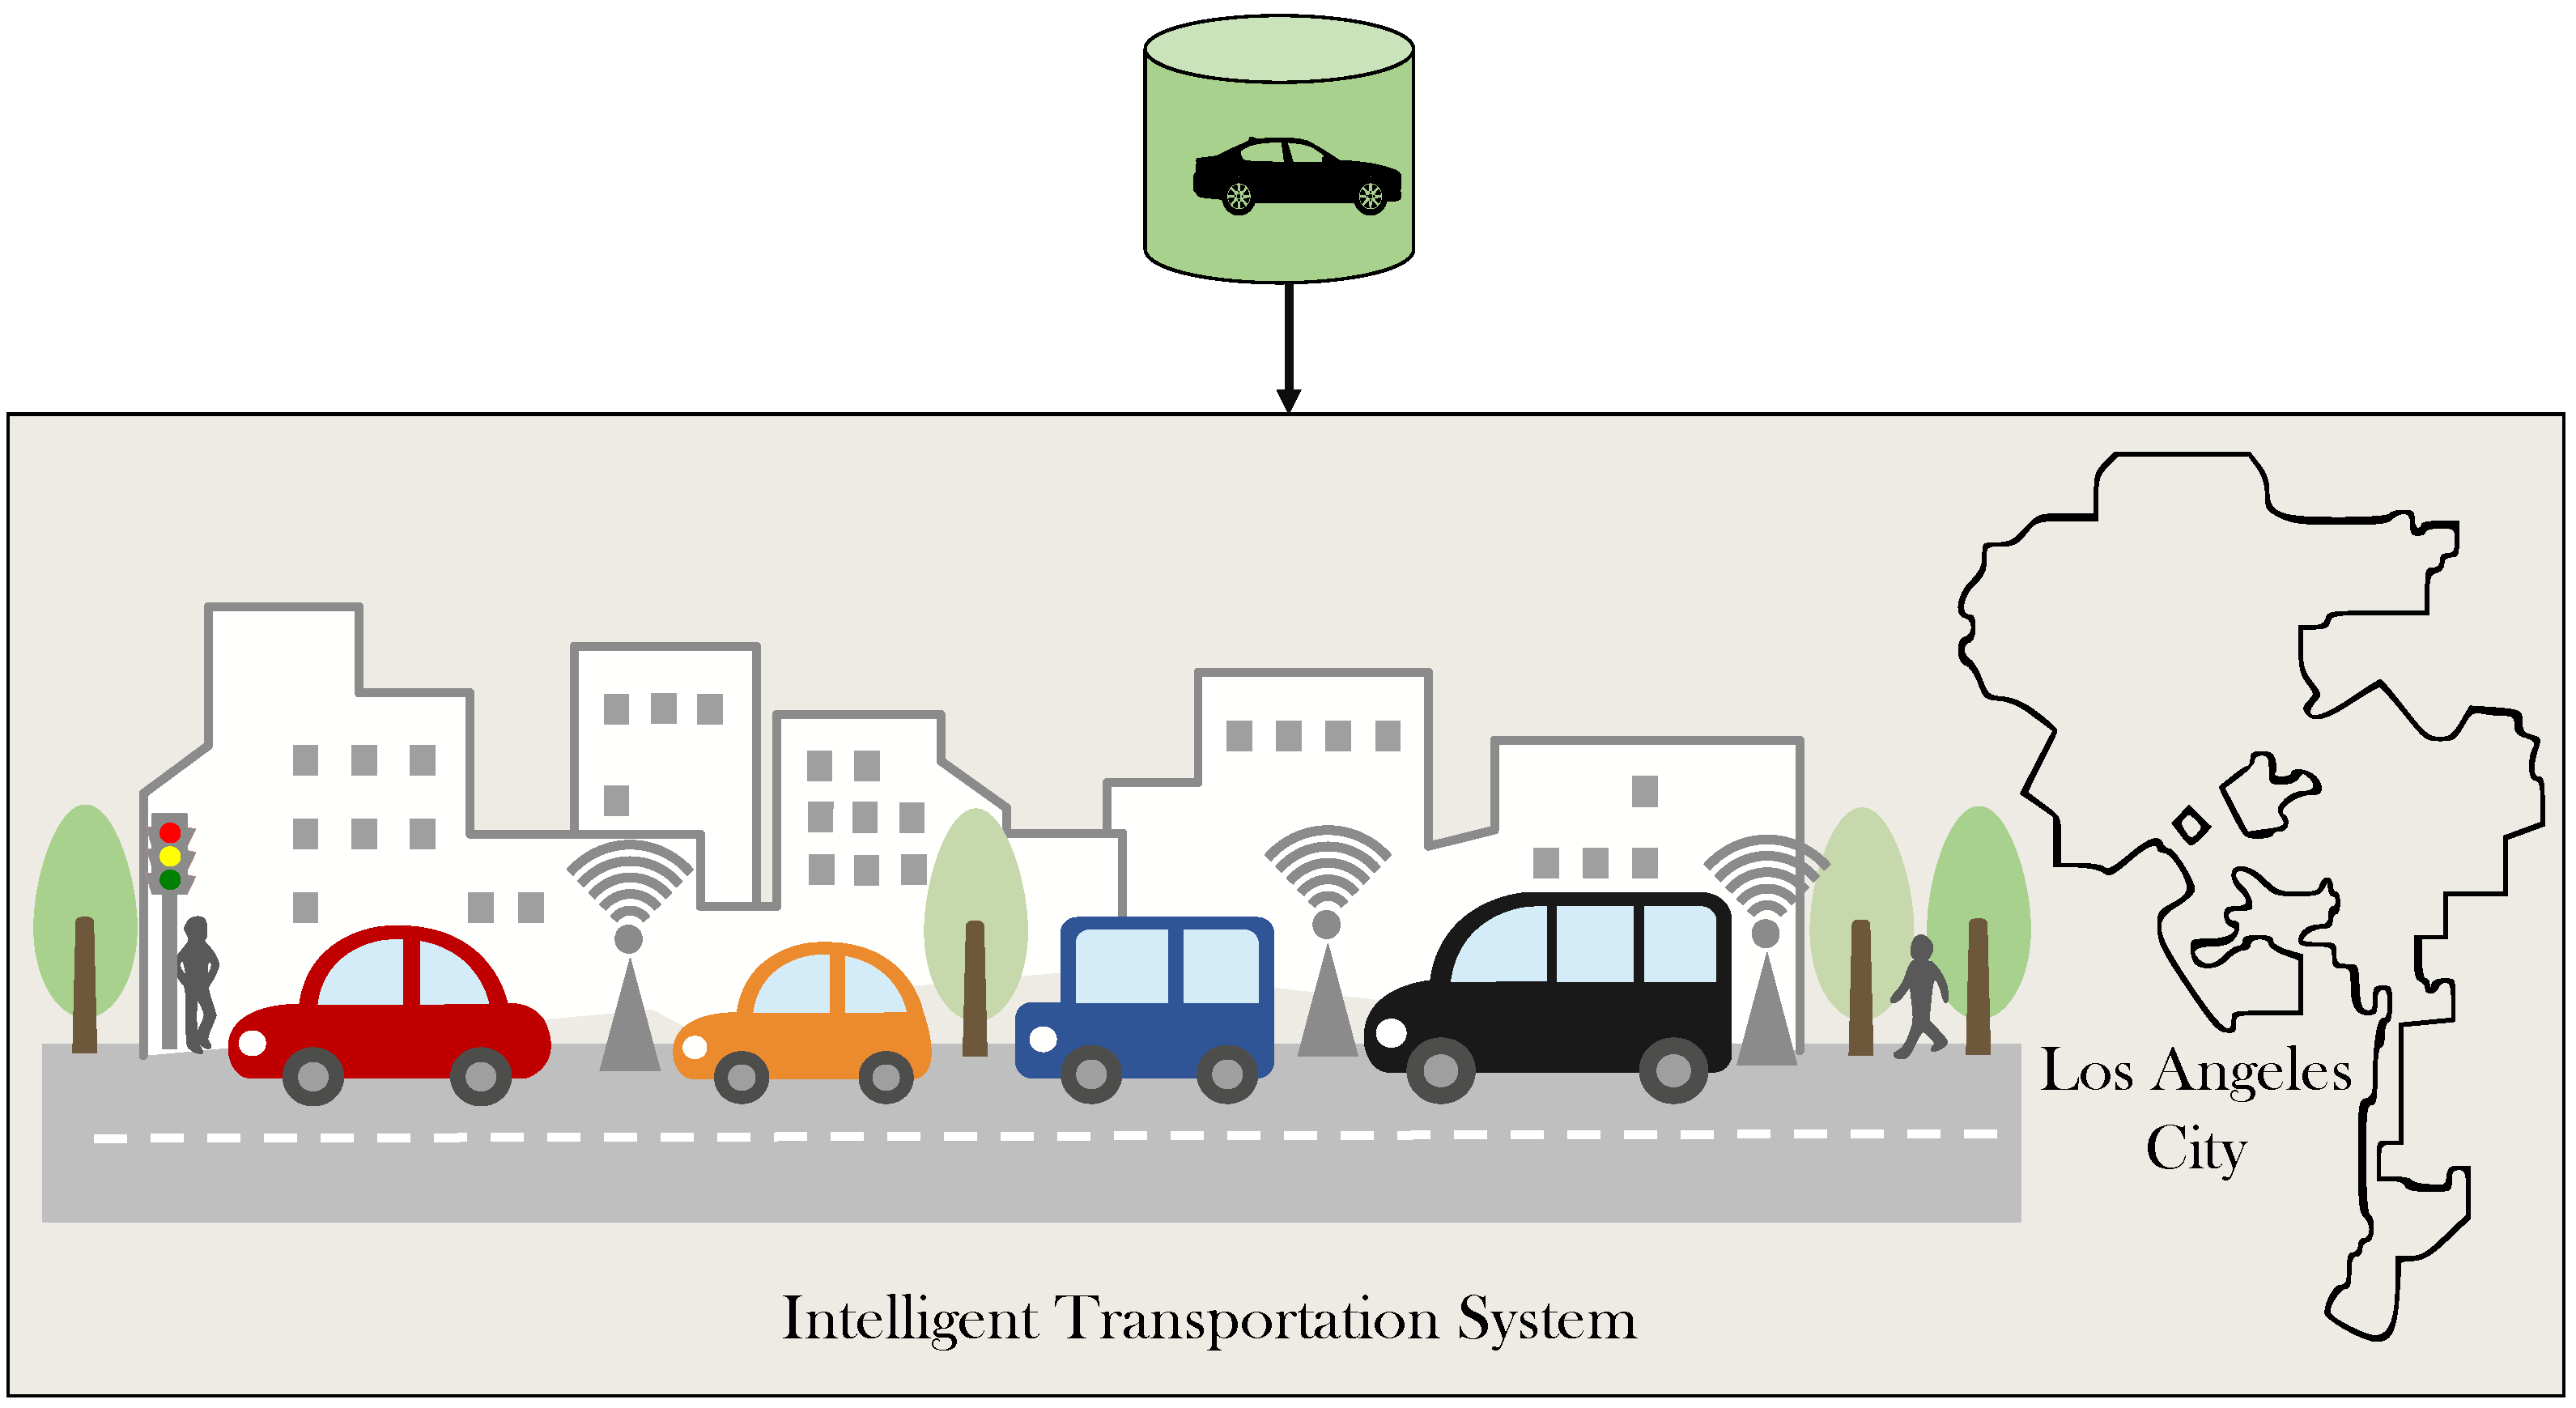
Research that is based on solving vehicle mobility problems using ML algorithms can utilize the proposed database. It provides a sufficient number of vehicle samples, i.e., 74,170 samples, that can be used for ML model training and testing. Moreover, the accuracy of the locations of vehicle samples was verified without any deviation. - Intelligent transportation system studies in the LA smart city: Smart city and intelligent transportation system are recently developed concepts [41]. The term ITS is defined as a comprehensive system that consists of vehicles and transportation infrastructure and it performs communication, controlling, and information processing in smart cities to facilitate their environmental sustainability [42,43]. The proposed VehDS-LA can be used for studies related to ITS in the downtown of the city of Los Angeles, as shown in Figure 17. Our VehDS-LA includes information of vehicle samples in terms of their real-world geographical locations, as well as the vehicles’ movement-related information in terms of directions and speeds based on the infrastructure of LA streets. Therefore, studies related to vehicle-to-vehicle, vehicle-to-pedestrian, and vehicle-to-network communications in LA city can utilize the vehicles information stored in our proposed dataset.
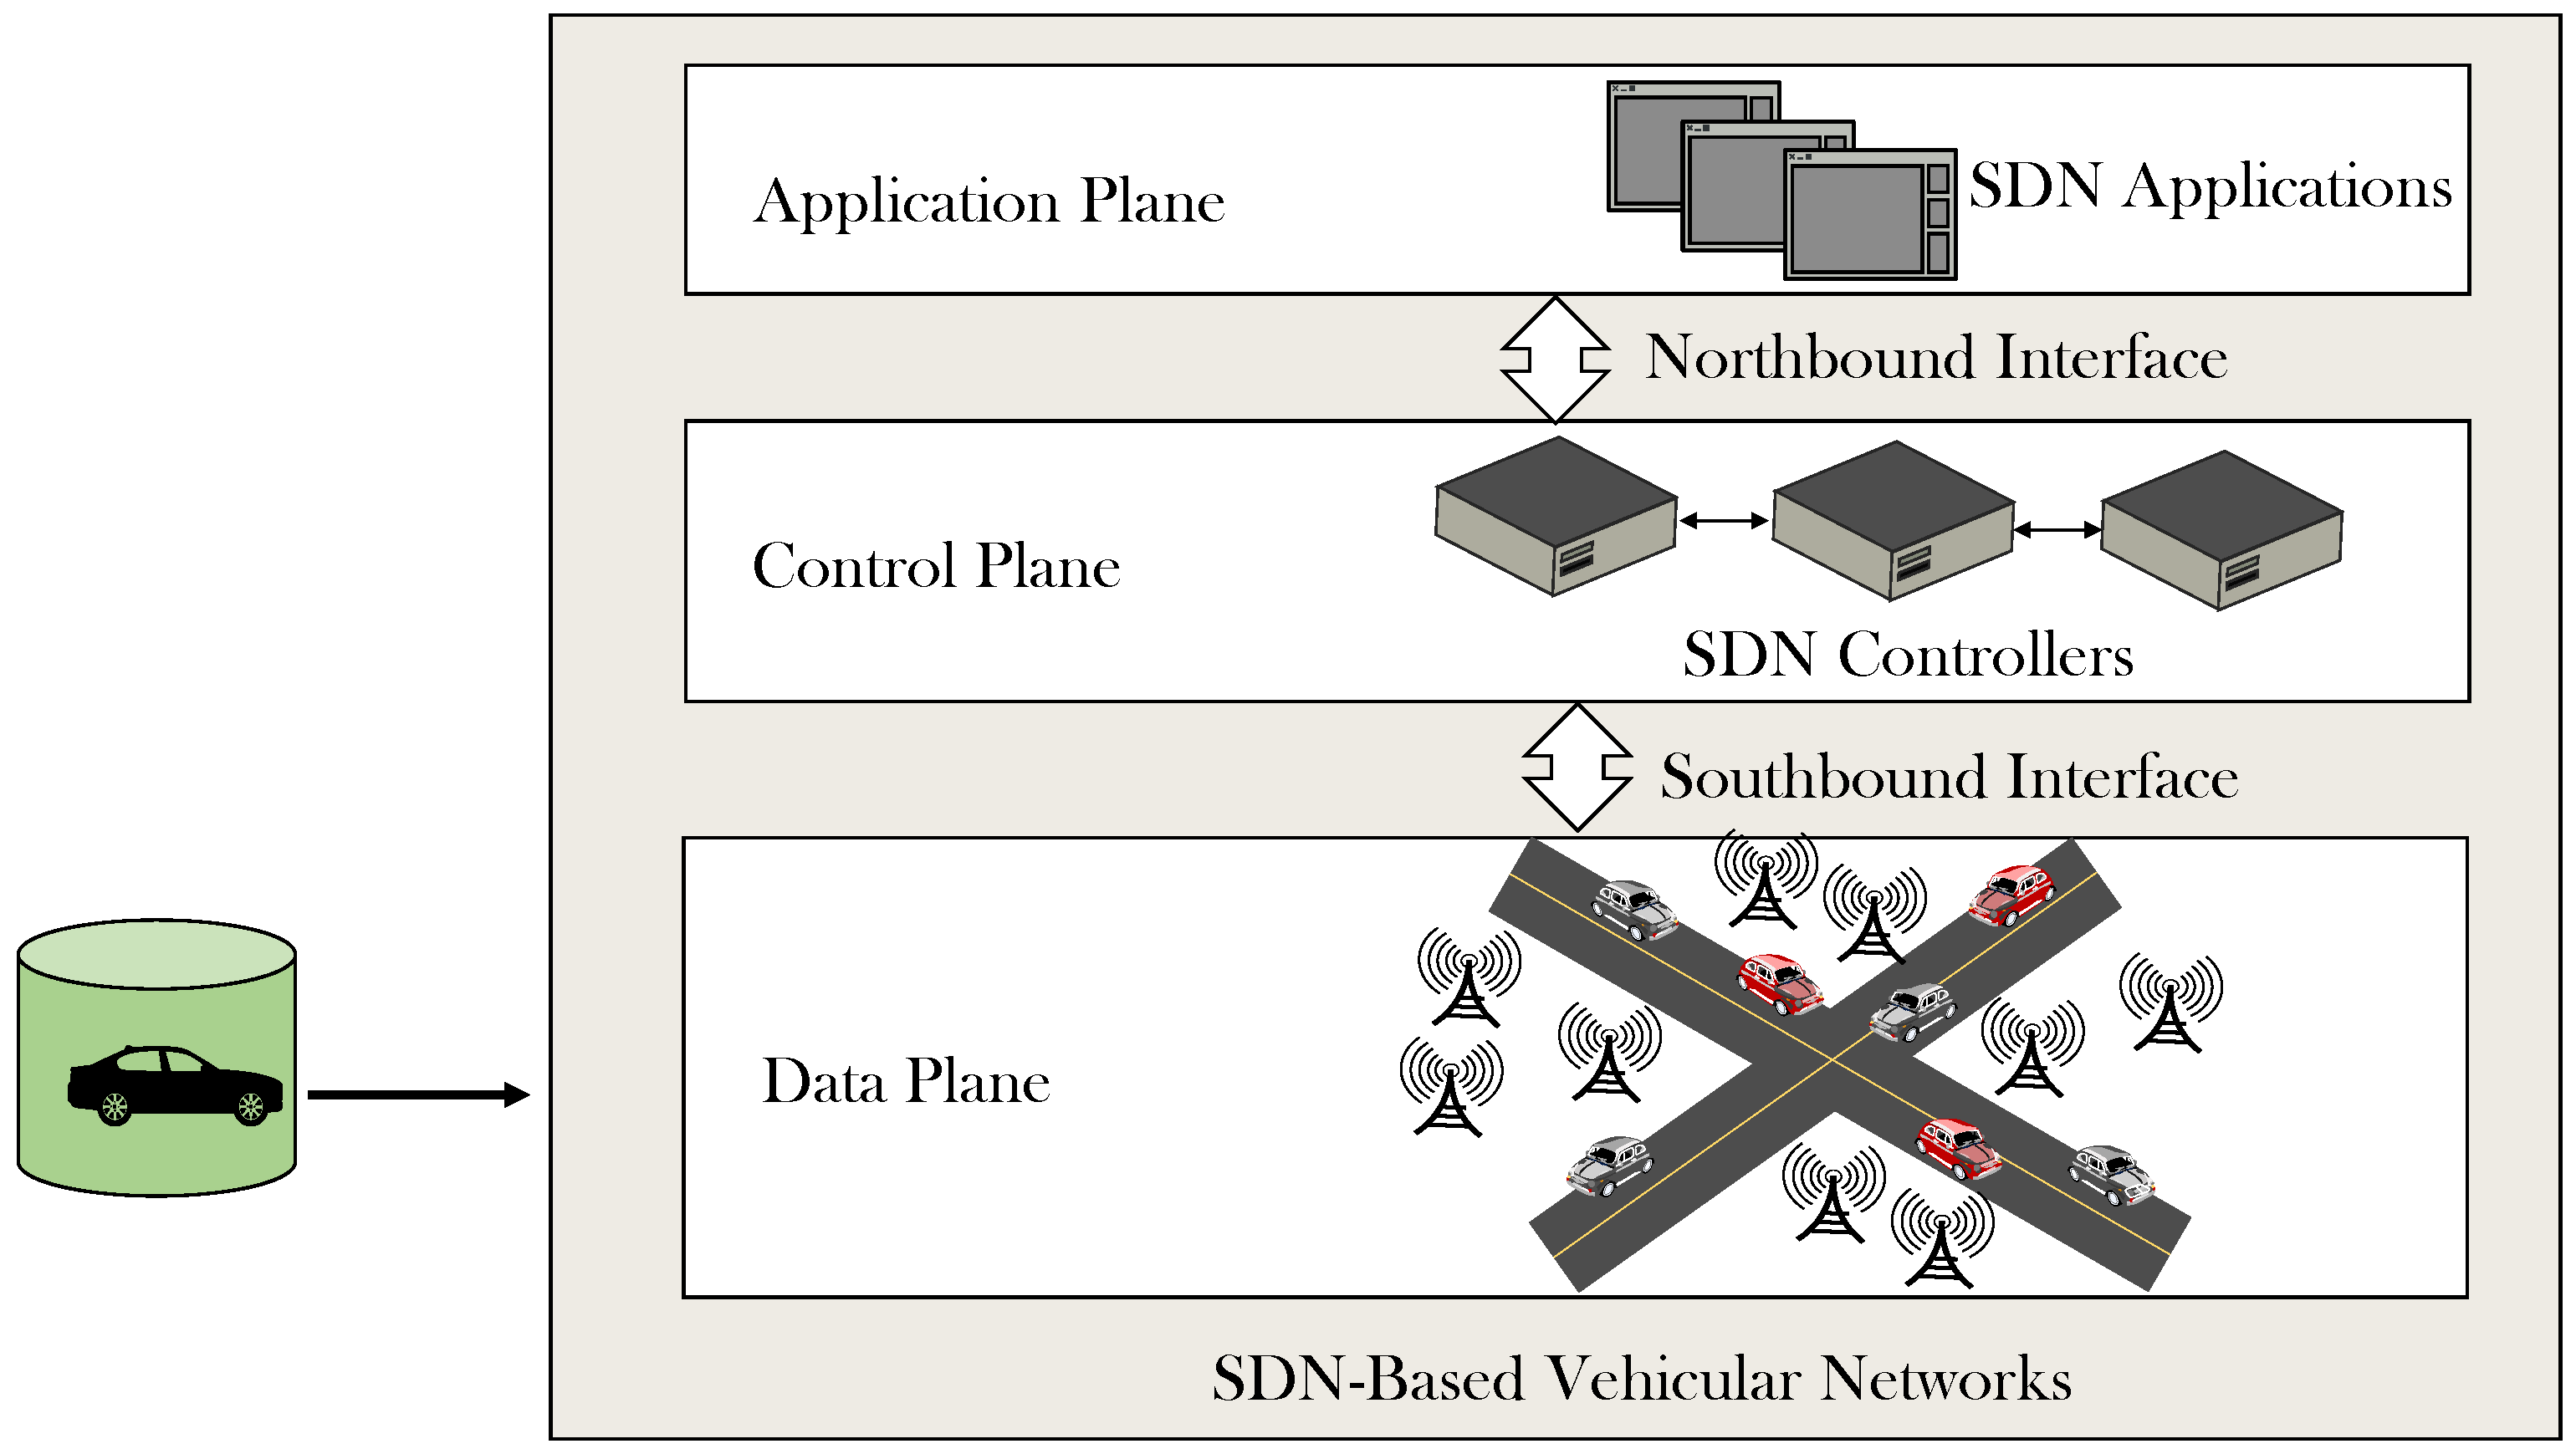
- SDN-based vehicular networks studies: Software-defined networking is one of the most recent network architectures that aims to facilitate the network management task and to enhance the utilization of network resources in an efficient way [44,45]. The architecture of SDN is made up of three components, which are data plane, control plane, and application plane [46]. The data plane comprises network devices that are responsible for forwarding data [47]. The control plane is made up of a set of SDN controller(s) to control and manage operations of the whole network [48]. The application plane consists of end user applications that interact with SDN controller(s) to perform specific tasks [49,50]. Southbound interface is used to perform the communication between the data and control planes based on a standardized protocol [51]. Northbound interface is utilized to establish the communication between the control and application planes [48]. Figure 18 shows the architecture of SDN-based vehicular networks, where vehicle samples of our proposed VehDS-LA can be utilized to construct a vehicular network. The studies that are focused on SDN-based vehicular networks can benefit from our proposed dataset in performing vehicle mobility management and supervision tasks by SDN, where realistic vehicle location coordinates and movement-related information exist.
3.5. Ethical Issues
4. Using the Proposed VehDS-LA to Perform Cell Selection in 5G Networks
5. Conclusions and Future Work
Author Contributions
Funding
Institutional Review Board Statement
Informed Consent Statement
Data Availability Statement
Conflicts of Interest
Abbreviations
| Abbreviation | Meaning |
| 3GPP | 3rd-Generation Partnership Project |
| 5G | Fifth Generation |
| AI | Artificial Intelligence |
| ANN | Artificial Neural Networks |
| BSs | Base Stations |
| CSV | Comma-Separated Values |
| GPS | Global Positioning System |
| HO | Handover |
| IoT | Internet of Things |
| IoV | Internet of Vehicles |
| ITS | Intelligent Transportation System |
| KMZ | Keyhole Markup Language |
| LA | Los Angeles |
| ML | Machine learning |
| NB | Naive Bayes |
| SAE | Society of Automotive Engineers |
| SDN | Software-Defined Networking |
| SVM | Support Vector Machine |
| UGL | Ultra GPS Logger |
| UTM | Universal Transverse Mercator |
| V2I | Vehicle-to-Infrastructure |
| V2N | Vehicle-to-Network |
| V2P | Vehicle-to-Pedestrian |
| V2V | Vehicle-to-Vehicle |
| V2X | Vehicle-to-Everything |
| VehDS-LA | Vehicle Dataset in the city of LA |
References
- Hassan, N.; Yau, K.L.A.; Wu, C. Edge Computing in 5G: A Review. IEEE Access 2019, 7, 127276–127289. [Google Scholar] [CrossRef]
- Alablani, I.A.; Arafah, M.A. Enhancing 5G small cell selection: A neural network and IoV-based approach. Sensors 2021, 21, 6361. [Google Scholar] [CrossRef] [PubMed]
- Alablani, I.; Alenazi, M. Performance Evaluation of Sensor Deployment Strategies in WSNs Towards IoT. In Proceedings of the 2019 IEEE/ACS 16th International Conference on Computer Systems and Applications (AICCSA), Abu Dhabi, United Arab Emirates, 3–7 November 2019; pp. 1–8. [Google Scholar] [CrossRef]
- Rehman, G.U.; Ghani, A.; Zubair, M.; Naqvi, S.H.A.; Singh, D.; Muhammad, S. IPS: Incentive and Punishment Scheme for Omitting Selfishness in the Internet of Vehicles (Iov). IEEE Access 2019, 7, 109026–109037. [Google Scholar] [CrossRef]
- Fabian, P.; Rachedi, A.; Guéguen, C. Selection of relays based on the classification of mobility-type and localized network metrics in the Internet of Vehicles. Trans. Emerg. Telecommun. Technol. 2021, 32, e4246. [Google Scholar] [CrossRef]
- Chen, S.; Hu, J.; Shi, Y.; Peng, Y.; Fang, J.; Zhao, R.; Zhao, L. Vehicle-to-Everything (V2X) Services Supported by LTE-Based Systems and 5G. IEEE Commun. Stand. Mag. 2017, 1, 70–76. [Google Scholar] [CrossRef]
- Raza, N.; Jabbar, S.; Han, J.; Han, K. Social vehicle-to-everything (V2X) communication model for intelligent transportation systems based on 5G scenario. In Proceedings of the 2nd International Conference on Future Networks and Distributed Systems, Amman, Jordan, 26–27 June 2018; pp. 1–8. [Google Scholar]
- Sirohi, D.; Kumar, N.; Rana, P.S. Convolutional neural networks for 5G-enabled intelligent transportation system: A systematic review. Comput. Commun. 2020, 153, 459–498. [Google Scholar] [CrossRef]
- Liu, H.; Lang, B. Machine learning and deep learning methods for intrusion detection systems: A survey. Appl. Sci. 2019, 9, 4396. [Google Scholar] [CrossRef] [Green Version]
- Alablani, I.A.; Arafah, M.A. An SDN/ML-Based Adaptive Cell Selection Approach for HetNets: A Real-World Case Study in London, UK. IEEE Access 2021, 9, 166932–166950. [Google Scholar] [CrossRef]
- Ziolkowski, P.; Niedostatkiewicz, M. Machine learning techniques in concrete mix design. Materials 2019, 12, 1256. [Google Scholar] [CrossRef] [Green Version]
- Alzahrani, T.; Al-Bander, B.; Al-Nuaimy, W. Deep Learning Models for Automatic Makeup Detection. AI 2021, 2, 497–511. [Google Scholar] [CrossRef]
- Modi, B.; Jethva, H. Reinforcement Learning with Neural Networks: A Survey. In Proceedings of First International Conference on Information and Communication Technology for Intelligent Systems: Volume 1; Springer: Berlin/Heidelberg, Germany, 2016; pp. 467–475. [Google Scholar]
- Li, J.; Horiguchi, Y.; Sawaragi, T. Counterfactual inference to predict causal knowledge graph for relational transfer learning by assimilating expert knowledge–Relational feature transfer learning algorithm. Adv. Eng. Inform. 2022, 51, 101516. [Google Scholar] [CrossRef]
- Alablani, I.; Alenazi, M. EDTD-SC: An IoT sensor deployment strategy for smart cities. Sensors 2020, 20, 7191. [Google Scholar] [CrossRef] [PubMed]
- Shaaban, K.; Adalbi, M.A. Smart City Transportation System in Developing Countries: The Case of Lusail City, Qatar. In Proceedings of the International Conference on Applied Human Factors and Ergonomics, New York, NY, USA, 25–29 July 2021; Springer: Berlin/Heidelberg, Germany, 2021; pp. 445–452. [Google Scholar]
- Gohar, A.; Nencioni, G. The Role of 5G Technologies in a Smart City: The Case for Intelligent Transportation System. Sustainability 2021, 13, 5188. [Google Scholar] [CrossRef]
- Silva, B.N.; Khan, M.; Han, K. Towards sustainable smart cities: A review of trends, architectures, components, and open challenges in smart cities. Sustain. Cities Soc. 2018, 38, 697–713. [Google Scholar] [CrossRef]
- Ortega-Fernández, A.; Martín-Rojas, R.; García-Morales, V.J. Artificial intelligence in the urban environment: Smart cities as models for developing innovation and sustainability. Sustainability 2020, 12, 7860. [Google Scholar] [CrossRef]
- Sharma, P.; Rajput, S. Perspectives of smart cities: Introduction and overview. In Sustainable Smart Cities in India; Springer: Berlin/Heidelberg, Germany, 2017; pp. 1–13. [Google Scholar]
- Ye, X.; Duan, L.; Peng, Q. Spatiotemporal Prediction of Theft Risk with Deep Inception-Residual Networks. Smart Cities 2021, 4, 204–216. [Google Scholar] [CrossRef]
- Pincetl, S.; Graham, R.; Murphy, S.; Sivaraman, D. Analysis of high-resolution utility data for understanding energy use in urban systems: The case of Los Angeles, California. J. Ind. Ecol. 2016, 20, 166–178. [Google Scholar] [CrossRef]
- Alablani, I.A.; Arafah, M.A. Applying a Dwell Time-Based 5G V2X Cell Selection Strategy in the City of Los Angeles, California. IEEE Access 2021, 9, 153909–153925. [Google Scholar] [CrossRef]
- Lin, T.; Rodríguez, L.F.; Davis, S.; Khanna, M.; Shastri, Y.; Grift, T.; Long, S.; Ting, K. Biomass feedstock preprocessing and long-distance transportation logistics. Gcb Bioenergy 2016, 8, 160–170. [Google Scholar] [CrossRef]
- Talen, E.; Anselin, L. City cents: Tracking the spatial imprint of urban public expenditures. Cities 2021, 108, 102962. [Google Scholar] [CrossRef]
- Jensen, C.; Lahrmann, H.; Pakalnis, S.; Runge, J. The Infati Data. arXiv 2004, arXiv:cs/0410001. Available online: https://arxiv.org/abs/cs/0410001 (accessed on 3 January 2022).
- Alzyout, M.S.; Alsmirat, M.A. Performance of design options of automated ARIMA model construction for dynamic vehicle GPS location prediction. Simul. Model. Pract. Theory 2020, 104, 102148. [Google Scholar] [CrossRef]
- Cho, W.; Kim, S.H. Multimedia Sensor Dataset for the Analysis of Vehicle Movement. In Proceedings of the 8th ACM on Multimedia Systems Conference, MMSys’17, Taipei, Taiwan, 20–23 June 2017; Association for Computing Machinery: New York, NY, USA, 2017; pp. 175–180. [Google Scholar] [CrossRef]
- Zhang, Y.; Xiong, L.; Yu, J. Deep Learning Based User Association in Heterogeneous Wireless Networks. IEEE Access 2020, 8, 197439–197447. [Google Scholar] [CrossRef]
- Alam, M.J.; El-Saleh, A.A.; Tan, C.K.; Ku, I.; Lee, Y.L.; Chuah, T.C. Improved Joint Cell Association and Interference Mitigation for LTE-A Heterogeneous Networks. In Proceedings of the 2018 IEEE 4th International Symposium on Telecommunication Technologies (ISTT), Bangi, Malaysia, 26–28 November 2018; pp. 1–4. [Google Scholar] [CrossRef]
- Alablani, I.A.; Arafah, M.A. An Adaptive Cell Selection Scheme for 5G Heterogeneous Ultra-Dense Networks. IEEE Access 2021, 9, 64224–64240. [Google Scholar] [CrossRef]
- Ezhilarasi, S.; Bhuvaneswari, P. Modified RRP scheme for interference management in OFDMA based heterogeneous networks. Wirel. Netw. 2021, 27, 5105–5124. [Google Scholar] [CrossRef]
- van Hoek, R.; Ploeg, J.; Nijmeijer, H. Cooperative Driving of Automated Vehicles Using B-Splines for Trajectory Planning. IEEE Trans. Intell. Veh. 2021, 6, 594–604. [Google Scholar] [CrossRef]
- Schneble, C.O.; Shaw, D.M. Driver’s views on driverless vehicles: Public perspectives on defining and using autonomous cars. Transp. Res. Interdiscip. Perspect. 2021, 11, 100446. [Google Scholar] [CrossRef]
- Akyuz, E.; Cicek, K.; Celik, M. A Comparative research of machine learning impact to future of maritime transportation. Procedia Comput. Sci. 2019, 158, 275–280. [Google Scholar] [CrossRef]
- Wang, J.; Zhu, H.; Liu, J.; Li, H.; Han, Y.; Zhou, R.; Zhang, Y. The application of computer vision to visual prosthesis. Artif. Organs 2021, 45, 1141–1154. [Google Scholar] [CrossRef]
- Siddique, A.; Afanasyev, I. Deep Learning-based Trajectory Estimation of Vehicles in Crowded and Crossroad Scenarios. In Proceedings of the 2021 28th Conference of Open Innovations Association (FRUCT), Moscow, Russia, 27–29 January 2021; pp. 413–423. [Google Scholar] [CrossRef]
- Liu, Y.; Zhao, T.; Ju, W.; Shi, S. Materials discovery and design using machine learning. J. Mater. 2017, 3, 159–177. [Google Scholar] [CrossRef]
- Escobar, C.A.; Chakraborty, D.; McGovern, M.; Macias, D.; Morales-Menendez, R. Quality 4.0—Green, Black and Master Black Belt Curricula. Procedia Manuf. 2021, 53, 748–759. [Google Scholar] [CrossRef]
- Cao, R.; Sun, L. Design and Practice of Machine Learning Course Based on CDIO and Student Behavior Data. In Proceedings of the 2020 15th International Conference on Computer Science Education (ICCSE), Delft, The Netherlands, 18–22 August 2020; pp. 553–556. [Google Scholar] [CrossRef]
- Raut, C.M.; Devane, S.R. Intelligent transportation system for smartcity using VANET. In Proceedings of the 2017 International Conference on Communication and Signal Processing (ICCSP), Tamilnadu, India, 6–9 April 2017; pp. 1602–1605. [Google Scholar] [CrossRef]
- Riaz, M.T.; Aaqib, S.M.; Ahmad, S.; Amin, S.; Ali, H.; Husnain, S.; Riaz, S. The Intelligent Transportation Systems with Advanced Technology of Sensor and Network. In Proceedings of the 2021 International Conference on Computing, Electronic and Electrical Engineering (ICE Cube), Quetta, Pakistan, 26–27 October 2021; pp. 1–6. [Google Scholar] [CrossRef]
- Guerrero-Ibáñez, J.; Zeadally, S.; Contreras-Castillo, J. Sensor technologies for intelligent transportation systems. Sensors 2018, 18, 1212. [Google Scholar] [CrossRef] [PubMed] [Green Version]
- Alsaeedi, M.; Mohamad, M.M.; Al-Roubaiey, A.A. Toward adaptive and scalable OpenFlow-SDN flow control: A survey. IEEE Access 2019, 7, 107346–107379. [Google Scholar] [CrossRef]
- Mekki, T.; Jabri, I.; Rachedi, A.; Chaari, L. Software-defined networking in vehicular networks: A survey. Trans. Emerg. Telecommun. Technol. 2021, e4265. [Google Scholar] [CrossRef]
- Gupta, V.; Kaur, K.; Kaur, S. Network programmability using software defined networking. In Proceedings of the 2016 3rd International Conference on Computing for Sustainable Global Development (INDIACom), New Delhi, India, 16–18 March 2016; pp. 1170–1173. [Google Scholar]
- Hussein, A.; Elhajj, I.H.; Chehab, A.; Kayssi, A. SDN security plane: An architecture for resilient security services. In Proceedings of the 2016 IEEE International Conference on Cloud Engineering Workshop (IC2EW), Berlin, Germany, 4–8 April 2016; pp. 54–59. [Google Scholar]
- Natanzi, S.B.H.; Majma, M.R. Secure northbound interface for SDN applications with NTRU public key infrastructure. In Proceedings of the 2017 IEEE 4th International Conference on Knowledge-Based Engineering and Innovation (KBEI), Tehran, Iran, 22 December 2017; pp. 0452–0458. [Google Scholar] [CrossRef]
- Nkosi, M.; Lysko, A.; Ravhuanzwo, L.; Nandeni, T.; Engelberencht, A. Classification of SDN distributed controller approaches: A brief overview. In Proceedings of the 2016 International Conference on Advances in Computing and Communication Engineering (ICACCE), Durban, South Africa, 28–29 November 2016; pp. 342–344. [Google Scholar] [CrossRef]
- Susilo, B.; Sari, R.F. Intrusion Detection in Software Defined Network Using Deep Learning Approach. In Proceedings of the 2021 IEEE 11th Annual Computing and Communication Workshop and Conference (CCWC), Las Vegas, NV, USA, 27–30 January 2021; pp. 0807–0812. [Google Scholar] [CrossRef]
- de Almeida Amazonas, J.R.; Santos-Boada, G.; Ricciardi, S.; Solé-Pareta, J. Technical challenges and deployment perspectives of SDN based elastic optical networks. In Proceedings of the 2016 IEEE 18th International Conference on Transparent Optical Networks (ICTON), Trento, Italy, 10–14 July 2016; pp. 1–5. [Google Scholar]
- Github.com. Vehicle-Dataset-in-Los-Angeles. Available online: https://github.com/Ibtihal-Alablani/Vehicle-Dataset-in-Los-Angeles (accessed on 7 January 2022).
- data.lacity.org. Small Cell Locations. Available online: https://data.lacity.org/City-Infrastructure-Service-Requests/Small-Cell-Locations/3nrm-mq6k (accessed on 22 February 2022).
- V16.1.0, G.T.; 3rd Generation Partnership Project; Technical Specification Group Radio Access Network; Study on Channel Model for Frequencies from 0.5 to 100 GHz (Release 16). 3GPP. 2019. Available online: https://www.3gpp.org/ftp//Specs/archive/38_series/38.901/38901-g10.zip (accessed on 7 January 2022).
- Alhammadi, A.; Roslee, M.; Alias, M.Y.; Shayea, I.; Alquhali, A. Velocity-aware handover self-optimization management for next generation networks. Appl. Sci. 2020, 10, 1354. [Google Scholar] [CrossRef] [Green Version]
- Ahmad, R.; Sundararajan, E.A.; Othman, N.E.; Ismail, M. Efficient handover in LTE-A by using mobility pattern history and user trajectory prediction. Arab. J. Sci. Eng. 2018, 43, 2995–3009. [Google Scholar] [CrossRef]


| Field Name | Description | Values |
|---|---|---|
| ‘STREET_NAME’ | Name of LA street where vehicle is located. | ‘San Pedro St’, ‘S Hill St’, ‘N Hill St’, ‘Flower St’, ‘S Hope St’, ‘E Olympic Bivd’, ‘E 3rd St’, ‘W 3rd St’, ‘E 6th St’, ‘W 6th St’, ‘E 9th St’, ‘W 9th St’, ‘James M Wood Blvd’, ‘S Los Angeles St’, ‘N Los Angeles St’ |
| ‘LAT’ | Latitude coordinate of vehicle. | [34.03 to 34.056] |
| ‘LON’ | Longitude coordinate of vehicle. | [−118.27 to −118.24] |
| ‘AZIMUTH’ | Angle between vehicle direction and north in degrees. | [0 to 342.74] |
| ‘KSPEED’ | Speed of vehicle in km/h. | [10 to 40] |
| Simulation Parameters | Values |
|---|---|
| Transmit power (dBm) | 30 |
| Path loss model (dB) | 3GPP UMi Model |
| Carrier frequency (GHz) | 28 |
| Number of 5G small BSs | 198 |
| Small BS height (meters) | 10 |
| Small cell radius (meters) | 600 |
| RSSI threshold (dBm) | −90 |
| Handover delay (ms) | 50 [55] |
| Simulation time (sec) | 500 |
Publisher’s Note: MDPI stays neutral with regard to jurisdictional claims in published maps and institutional affiliations. |
© 2022 by the authors. Licensee MDPI, Basel, Switzerland. This article is an open access article distributed under the terms and conditions of the Creative Commons Attribution (CC BY) license (https://creativecommons.org/licenses/by/4.0/).
Share and Cite
Alablani, I.A.; Arafah, M.A. A New Vehicle Dataset in the City of Los Angeles for V2X and Machine Learning Applications. Appl. Sci. 2022, 12, 3751. https://doi.org/10.3390/app12083751
Alablani IA, Arafah MA. A New Vehicle Dataset in the City of Los Angeles for V2X and Machine Learning Applications. Applied Sciences. 2022; 12(8):3751. https://doi.org/10.3390/app12083751
Chicago/Turabian StyleAlablani, Ibtihal Ahmed, and Mohammed Amer Arafah. 2022. "A New Vehicle Dataset in the City of Los Angeles for V2X and Machine Learning Applications" Applied Sciences 12, no. 8: 3751. https://doi.org/10.3390/app12083751
APA StyleAlablani, I. A., & Arafah, M. A. (2022). A New Vehicle Dataset in the City of Los Angeles for V2X and Machine Learning Applications. Applied Sciences, 12(8), 3751. https://doi.org/10.3390/app12083751