Article

High-Temperature Behavior, Oxygen Transport Properties, and Electrochemical Performance of Cu-Substituted Nd1.6Ca0.4NiO4+δ Electrode Materials

1
Laboratory of Solid Oxide Fuel Cells, Institute of High Temperature Electrochemistry, Ural Branch of the Russian Academy of Sciences, 620137 Yekaterinburg, Russia
2
Department of Chemical Materials Science, Institute of Natural Sciences and Mathematics, Ural Federal University, 620002 Yekaterinburg, Russia
3
Department of Physical and Inorganic Chemistry, Institute of Natural Sciences and Mathematics, Ural Federal University, 620002 Yekaterinburg, Russia
4
Synchrotron Radiation Facility SKIF, Boreskov Institute of Catalysis, Siberian Branch of the Russian Academy of Sciences, 630559 Novosibirsk, Russia
5
Department of Physics, Novosibirsk State University, 630090 Novosibirsk, Russia
6
Federal Research Center Boreskov, Institute of Catalysis, Siberian Branch of the Russian Academy of Sciences, 630090 Novosibirsk, Russia
7
Frank Laboratory of Neutron Physics, Joint Institute for Nuclear Research, 141980 Dubna, Russia
8
Faculty of Natural and Engineering Sciences, Dubna State University, 141980 Dubna, Russia
9
Institute of Metallurgy, Ural Branch of the Russian Academy of Sciences, 620016 Yekaterinburg, Russia
10
Department of Physical Technologies and Devices for Quality Control, Institute of Physics and Technology, Ural Federal University, 620002 Yekaterinburg, Russia
11
Department of Natural Sciences, Novosibirsk State University, 630090 Novosibirsk, Russia
12
Department of Environmental Economics, Institute of Economics and Management, Ural Federal University, 620002 Yekaterinburg, Russia
*
Author to whom correspondence should be addressed.
Appl. Sci. 2022, 12(8), 3747; https://doi.org/10.3390/app12083747
Submission received: 17 March 2022 / Revised: 1 April 2022 / Accepted: 3 April 2022 / Published: 8 April 2022

Abstract

:

Featured Application

Extended experimental data obtained in the framework of this study on the structure, high-temperature behavior, oxygen diffusion, and electrode performance of the Nd1.6Ca0.4Ni1−yCuyO4+δ materials are a solid base for their future practical application as air electrodes, membranes for oxygen production and catalytic membranes. Developed air electrodes can be used in the intermediate temperature solid oxide fuel cells and other electrochemical devices based on feasible oxygen-ion and proton-conducting solid-state electrolytes.

Abstract

In this study, Nd1.6Ca0.4Ni1−yCuyO4+δ-based electrode materials for intermediate temperature solid oxide fuel cells (IT-SOFCs) are investigated. Materials of the series (y = 0–0.4) are obtained by pyrolysis of glycerol-nitrate compositions. The study of crystal structure and high-temperature stability in air and under low oxygen partial pressure atmospheres are performed using high-resolution neutron and in situ X-ray powder diffraction. All the samples under the study assume a structure with Bmab sp.gr. below 350 °C and with I4/mmm sp.gr. above 500 °C. A transition in the volume thermal expansion coefficient values from 7.8–9.3 to 9.1–12.0 × 10⁻⁶, K−1 is observed at approximately 400 °C in air and 500 °C in helium.The oxygen self-diffusion coefficient values, obtained using isotope exchange, monotonically decrease with the Cu content increasing, while concentration dependence of the charge carriers goes through the maximum at x = 0.2. The Nd1.6Ca0.4Ni0.8Cu0.2O4+δ electrode materialdemonstrates chemical compatibility and superior electrochemical performance in the symmetrical cells with Ce0.8Sm0.2O1.9, BaCe0.8Sm0.2O3−δ, BaCe0.8Gd0.19Cu0.1O3−δ and BaCe0.5Zr0.3Y0.1Yb0.1O3−δ solid electrolytes, potentially for application in IT-SOFCs.

Graphical Abstract

1. Introduction

Sustainable energy is currently one of the fastest growing areas in the field of applied scientific research [1]. The priority tasks for modern energy harvesting and producing technologies include searching for available renewable energy resources in different climate zones of the world [1,2], developing new ways to produce clean energy, such as hydrogen energy [3], solar energy [4], geothermal energy [5], wind energy [6], and bioenergy [7,8], and designing power devices with insitu direct conversion of the various types of energy into electricity in order to lower energy losses [9,10,11].
Solid oxide fuel cells (SOFCs) are well-known devices used for the direct conversion of chemical reaction energy to electric power [12,13,14]. The advantages of SOFCs include the minimal content of noble metals required for their components [15] and their compactness and fuel flexibility [16]. Among the disadvantages of the traditional SOFCs when operating at high working temperatures (900 °C and higher) are the significant chemical interaction between the SOFC’s functional layers and the rapid aging of the materials [17], with consequential fast deterioration in the cells’ power characteristics [18]. However, attempts to reduce the operating temperatures have led to a drastic increase in ohmic losses related to the temperature-activated nature of the solid-state electrolyte conductivity. This facilitated the search for electrolytes capable of operating effectively in the intermediate temperature range, such as, for example, oxygen-ion-conducting electrolytes based on CeO2 and Bi2O3 [19,20], Sr, Mg-doped LaGaO3 [21], and proton-conducting BaCe(Zr)O3 electrolytes [22,23]. The most pronounced factors contributing to the IT-SOFC performance deterioration are the slow kinetics of the oxygenreductionreaction (ORR) and the increase in the area-specific resistance (ASR) of the electrodes. A possible solution to the problem of the increase in polarization resistance is through the application of materials that are capable of extending the ORR from the triple-phase boundaries at the cathode/electrolyte interface to the electrode volume, namely, oxides with mixed oxygen-ionelectron conductivity (MIECs) [24] and oxides with proton-electron conductivity (PECs) [25,26].
Among the MIECs, complex oxides with the Ruddlesden-Popper (R-P) structure are widely considered to be prospective cathode materials for IT-SOFCs [27], including the first order R-P phases with a general formula of Ln2NiO4+δ (Ln = La, Nd, Pr) [28]. It is worth noting that, in the above-mentioned series, Nd2NiO4+δ is characterized by having high phase stability [29] and the lowest level of chemical interaction with the Ce0.9Gd0.1O1.95 [30] and YSZ [31] electrolytes. The obtained data on the partial substitution of lanthanide cations by Ca2+ cations in the Ln2NiO4+δ (Ln = La, Nd) series showed a general trend for the total conductivity to increase [31,32]. Nevertheless, oxygen over-stoichiometry, oxygen surface exchange and diffusion kinetics, and the electrochemical performance of the La2−xCaxNiO4+δ [32,33,34] and Nd2−xCaxNiO4+δ [31,32,35,36,37] electrodes were suppressed with Ca-substitution. However, in the case of the Nd-containing electrodes, the suppression was less pronounced than that for the La-containing electrodes. For instance, according to data reported in [33], the polarization resistance values for the La2NiO4.17 and La1.7Ca0.3NiO4.06 electrodes on the Ce0.8Sm0.2O1.9 electrolyte substrates were equal to 0.73 and 4.01 Ω cm2 at 700 °C, correspondingly. The minimal polarization resistance for the Nd2NiO4+δ electrode was equal to 0.51 Ω cm2 at 700 °C, while for the Nd1.7Ca0.3NiO4+δ electrode, it reached the minimal value at 0.71 Ω cm2 at 700 °C in air according to [36]. As an alternative, the utilization of a LaNi0.6Fe0.4O3−δ (LNF) collector layer, developed in [36,37], provided a superior electrochemical performance of Ca-substituted Nd2NiO4+δ on the Ce0.8Sm0.2O1.9 electrolyte substrate. The optimum characteristic obtained for the Nd1.6Ca0.4NiO4.08 electrode, with a functional layer sintered at 1200 °C, was equal to 0.37 Ω cm2 at 700 °C, in comparison with the value of 0.71 Ω cm2 at 700 °C for the non-substituted Nd2NiO4+δ.
Sadykov et al. [32] reported the values of oxygen surface exchange constant (kex) as being equal to ~10−4 cm s−1 at 700 °C for Ln2NiO4+δ and ~10−5 cm s−1 for La1.7Ca0.3NiO4.06. The values of the effective activation energy (Ea,k) were equal to 100–115 kJ mol−1 for Ln2NiO4+δ and 120–130 kJ mol−1 for Ln2−xCaxNiO4+δ. Data presented in [32] demonstrated a decrease in the surface oxygen reactivity with Ca-doping, a feature that was explained by the difficulties in the surface exchange process owing to the steric factors and lower oxygen coverage due to the carbonates forming on the active sites of the surface enriched with Ca. The trend for the oxygen diffusion mobility to decrease with Ca substitution was explained by the reduction in the highly mobile interstitial oxygen content, which hampered the cooperative mechanism of oxygen migration involving oxygen in both the interstitial and regular positions [31,32].
The substitutions of Ni cations with Cu in Ln2NiO4+δ (Ln = La [38,39,40]; Ln = Nd [41,42]; Ln = Pr, Nd [43]) and the simultaneous substitution of Ln with Ca and Ni with Cu (Ln = La [44,45,46,47,48]; Ln = Nd [49]) had an effect on the level of oxygen over-stoichiometry [43,49], the transport properties [39,40,41,42,44,47,49], and the electrochemical activity [39,40,41,44,45,46,48] of the Cu-doped Ln2NiO4+δ compounds. According to Aguadero et al. [39], La2Ni1−xCuxO4+δ/8YSZ samples at x = 0.0; 0.2; 0.6 gave the ASR values of 3.7 Ω cm2 at 850 °C. Tarutin et al. [40] reported the polarization resistance (Rp) value for the La2Ni0.8Cu0.2O4+δ/BaCe0.5Zr0.3Dy0.2O3–δ cell as equal to 0.17 Ω cm2 at 700 °C. The La1.7Ca0.3Ni0.7Cu0.3O4+δ electrode in [44] exhibited a maximum conductivity value of 150–160 S cm−1 and a minimal polarization resistance of 1.45 Ω cm2 at 650 °C, minimal in the series, whereas a Ni-YSZ/YSZ/La1.7Ca0.3Ni0.75Cu0.25O4−δ cell, tested in [45], showed the power density of 0.71 W cm−2 at 750 °C using H2 and air as the fuel and oxidant, respectively. Muang et al. [46] developed a single cell with a La1.7Ca0.3Ni0.75Cu0.25O4−δ cathode, a gadolinium doped ceria (GDC) electrolyte, and a NiO-GDC anode, demonstrating a maximum power density of 0.75 W cm−2 and the total polarization resistance Rp < 0.1 Ω cm2 at 700 °C. In our recent study [48], we observed the minimal Rp value in the La1.7Ca0.3Ni1−xCuxO4−δ series at x = 0.4, while in the La2Ni1−xCuxO4+δ, it was found at x = 0.2 [40]. The polarization resistance of the electrodes in the Nd2Ni1−xCuxO4+δ series showed a minimum at x = 0.2 [41]. All these studies demonstrate that the effect of Cu doping on polarization resistance is complicated, and the observed phenomena may be associated with such properties as electrical conductivity, excess oxygen content, oxygen transport properties, and crystal structure changes with doping. Recently, we presented a study of the synthesis features and structural, thermo-mechanical, and electrical properties of electrode materials in the Nd1.6Ca0.4Ni1−yCuyO4−δ series [49]. However, the influence of Cu substitution on the high-temperature behavior, the oxygen transport properties, and, finally, the performance of the related electrode, all of which are critical for the practical application of these materials, were not investigated. Thus, the focus of this study was concentrated in this direction, and the above-mentioned properties were investigated using advanced methods such as high-resolution neutron and in situ X-ray powder diffraction, isotope exchange, and impedance spectroscopy with analysis of the distribution of the relaxation times (DRT) to identify the electrode processes and select the electrode with superior properties for the cells with Ce0.8Sm0.2O1.9, BaCe0.80Sm0.19Cu0.10O3−δ, BaCe0.8Gd0.19Cu0.1O3−δ, and BaCe0.5Zr0.3Y0.1Yb0.1O3−δ solid electrolytes, potentially for application in the IT range.

2. Materials and Methods

2.1. Synthesis of the Electrode Materials and Their Standard Characterization

Materials of the Nd1.6Ca0.4Ni1−yCuyO4+δ series (y = 0.0–0.4), denoted as NCNCO00–NCNCO04, were obtained using the glycerol–nitrate combustion method. CaCO3 (99.9 wt.%), Nd2O3 (99.4 wt.%), and CuO (99 wt.%) (Reakhim, Moscow, Russia), Ni(CH3COO)2∙4H2O (99.9 wt.%) (Sigma-Aldrich, St. Louis, MO, USA) were used as starting reagents. The Nd2O3, CaCO3, and CuO powders were preliminarily calcinated in air to remove adsorbed water and gases at 1100 °C (12 h), 500 °C (3 h), and 400 °C (3 h), respectively. The required amount of Nd2O3, CaCO3, and CuO, calculated as follows:
0.4CaCO3 + 0.8Nd2O3 + (1 − y)Ni(CH3COO)2∙4H2O + yCuO + O2→ Nd1.6Ca0.4Ni1−yCuyO4 + CO2 + H2O,
was dissolved in a diluted nitric acid (65%) (Vekton, St. Petersburg, Russia), and then Ni(CH3COO)2∙4H2O, dissolved in distilled water, was added and thoroughly mixed. Glycerol (Vekton, St. Petersburg, Russia), serving as a chelating agent and an organic fuel, was added in a stoichiometric amount defined by the combustion reaction:
14HNO3 + 5C3H8O3 = 7N2 + 15CO2 + 27H2O.
The resulting mixture, placed in a heat-resistant glass vessel, was heated under constant stirring up to 340 °C on the electric plate until evaporation and spontaneous combustion. The obtained NCNCO00–NCNCO04 powders were sequentially annealed in air using a PKO-1,4-100 furnace (UralElektropech’, Yekaterinburg, Russia) at temperatures of 1000 °C (12 h, one time) and 1100 °C (12 h, repeatedly),with a heating/cooling rate of 200 °C h−1 and with intermediate grindings in ethanol in an agate mortar with a pestle for 1 h. The total annealing time of the samples reached 60 h. After the final synthesis step, the powders were ground with the addition of ethanol in an agate mortar with a pestle for 2 h.
The standard characterization of the prepared powders was performed using the Brunauer–Emmett–Teller (BET) method and an XRDanalysis. The specific surface area, SBET, of the NCNCO00–NCNCO04 powders was determined using a META SORBI N 4.1 analyzer (Moscow, Russia). The powder XRD data were collected in air at room temperature using a Shimadzu XRD-7000 diffractometer with a graphite monochromator in the CuKα1 radiation in the 2θ angle range of 20–80° with a step of 0.02° and a counting time of 5 s at each point. The parameters of the NCNCO00–NCNCO04 crystal structure were refined using FullProf Suite software [50]. The results of the standard characterization are represented in Table S1 in the supplementary materials.
The electrode materials for the electrode collector layers LaNi0.6Fe0.4O3 (LNF) and La0.6Sr0.4MnO3 (LSM) were synthesized via a two-step ceramic technology, as described elsewhere [51,52]. The unit cell parameters and SBET for the collector materials are given in Table S1.

2.2. Synthesis of the Electrolite Materials and Preparation of Dense Electrolyte Substrates for the Electrochemical Studies. Chemical Electrode/Electrolyte Compatibility Studies

The electrolyte materials, chosen for the study in contact with the developed electrode materials, were obtained and characterized in the framework of our previous studies using the following synthesis techniques, described elsewhere: Ce0.8Sm0.2O1.9 (SDC) by a solid-state reaction method [53]; BaCe0.80Sm0.19Cu0.10O3−δ (BCSCuO) [54], BaCe0.80Gd0.19Cu0.10O3−δ (BCGCuO) [55], and BaCe0.5Zr0.3Y0.1Yb0.1O3−δ (BCZYYbO) [56] by a citrate–nitrate combustion method. The electrolytes’ unit cell parameters are given in Table S2. The obtained powders were shaped into disks using semi-dry pressing at 10 MPa with the addition of a polyvinyl butyral binder and then sintered at 1600 °C for 5 h (SDC) and 1450 °C (BCSCuO, BCGCuO, BCZYYbO) for 5 h in air using a Nabertherm LHTCT 01/16 furnace (Lilienthal, Germany) with a heating/cooling rate of 150 °C h−1. The sintered substrates were polished using a diamond 60/40 instrument down to 1 mm in thickness. The relative density of the sintered electrolyte substrates, calculated from their weight and dimensions, was no less than 95%.
To study the compatibility of the potential cathode materials NCNCO02 with the electrolyte materials of SDC, BCSCuO, BCGCuO, and BCZYYbO, the related electrode/electrolyte powders were mixed in a weight ratio of 1:1 and thoroughly mixed in an agate mortar with the addition of ethanol. The resulting mixtures were sequentially annealed at temperatures of 900, 1000, and 1100 °C for 15 h at each stage. After each annealing step, the phase composition of the mixtures was analyzed using XRD.

2.3. High-Resolution Neutron Diffraction and In-Situ XRD of the Electrode Powders

Ex-situ high-resolution neutron powder diffraction experiments were performed at the Frank Laboratory of Neutron Physics of the Joint Institute for Nuclear Research (Dubna, Russia) using a high-resolution Fourier diffractometer (HRFD) realized at the IBR-2 pulsed reactor, as described in [57,58]. HRDF is a time-of-flight (TOF) diffractometer with a fast Fourier chopper, which allows one to measure diffraction patterns with d-spacing resolution Δd/d ≈ 0.0015 at d = 2 Å. The NPD TOF patterns for the NCNCO01, NCNCO03, and NCNCO04 samples were collected for 2 h at 50 °C under the following conditions:
(1)
as-synthesized samples, in static air;
(2)
samples after heating in static air to 500 °C, annealing at this temperature for 2 h and cooling down to 50 °C with a heating/cooling rate of 300 °C h−1, in static air;
(3)
samples after (2), in a vacuum (10−6 bar);
(4)
samples after heating in a vacuum to 500 °C, annealing at this temperature for 2 h, heating to 800 °C annealing for 2 h, and cooling down to 50 °C, with a heating/cooling rate of 300 °C h−1.
The NCNCO00–NCNCO02 samples were studied by an in-situ synchrotron XRD (SXRD) at a High Precision Diffractometry II station at the synchrotron radiation facility of the VEPP-3 storage ring (Siberian Synchrotron and Terahertz Radiation Centre, Novosibirsk, Russia) [59]. The station diffractometer was equipped with a position-sensitive parallax-free linear OD-3M detector [60] with a working range of approximately 30° and a 2θ resolution of approximately 0.01°. The exposure time was 60 s per frame. The radiation wavelength of 0.10102 nm was established using a flat Si (220) crystal. The radiation wavelength of 0.16405 nm was set by a single reflection of the incoming white synchrotron radiation beam from a Ge (111) crystal. Samples were heated/cooled at a rate of 600 °C h−1 first in a synthetic air flow (20 vol.% O2/80 vol.% He) and then in the He flow in the temperature range of 30–700 °C using an XRK 900 reactor chamber (Anton Paar, Graz, Austria). The rate of the gas flow was 100 SCCM.
The NCNCO03 and NCNCO04 samples were studied by an insitu XRD using a Bruker D8 Advance diffractometer (Karlsruhe, Germany) equipped with a Lynxeye linear detector. The diffraction patterns were obtained in a θ/2θ configuration using Ni-filtered CuKα radiation (λ = 0.15418 nm). Diffraction patterns during stepwise heating/cooling in the temperature range of 30–700 °C (every 100 °C after temperature 100 °C, a heating/cooling rate of 600 °C h−1) were collected in a 2θ range of 53–60° with a step of 0.02° and a counting time of 3 s at each point using an XRK 900 reactor chamber, first, in static air, and then, in a 100 SCCM He flow. The phases were identified using a powder diffraction database, PDF-4+. The unit cell parameters were determined using a GSAS-II software package [61].

2.4. X-ray Photoelectron Spectroscopy Studies

X-ray photoelectron spectroscopy (XPS) study was performed on the compact electrode material samples of 8 mm in diameter, prepared by a semi-dry pressing with a polyvinyl butyral binder at 6 Mpa, followed by sintering at 1450 °C for 5 h. The samples were polished using a diamond disk 60/40, cleaned in an ultrasound bath, etched at 1100 °C for 10 h with a heating/cooling rate of 100°/h. The XPS study was carried out using a Multiprob electron spectrometer (Omicron, Berlin, Germany) with an electron analyzer EA125. An X-ray source of exciting radiation with a magnesium anode of 165 W was used. The spectral data acquisition was made with a step of 0.1 eV, holding time of 7.5 s, and passing energy of 20 eV. The accuracy of determining the position of peaks was 0.1 eV. The analysis of the spectral data was performed using XPS Peak 4.1 software. The procedure and calculation details are given in [32].

2.5. Oxygen Mobility Studies

Oxygen mobility was studied by a temperature-programmed isotope exchange of oxygen (TPIE) with C18O2 in a flow reactor. Ground samples of the electrode powders (fraction 0.25–0.5 mm) were loaded into a tube quartz reactor (inner diameter of 3 mm). The sample weight was 50 mg. All samples were pre-treated at 700 °C for 30 min in the 99 vol.% He/1 vol.% O2 flow (a flow rate of 25SCCM). Treatment was performed in the temperature range of 50–800 °C with a temperature heating rate of 300 °C/h in the 99 vol.% He/1 vol.% C18O2 flow (a flow rate of 25SCCM). Outlet gas mixture was analyzed by an SRS 200 mass spectrometer (Stanford Research Systems, Sunnyvale, CA, USA) using UGA software. Temperature dependencies of mole fractions of 18O atoms (α) and C16O18O molecules (f16–18) were analyzed to calculate the oxygen tracer diffusion coefficients (D*) using mathematical modeling [62].

2.6. Electrode Fabrication and Electrochemical Studies

The electrode slurries for the electrode’s functional layers were prepared by mixing the NCNCO00–NCNCO04 electrode powders with ethanol and a 5 wt.% alcohol solution of the polyvinyl butyral binder in an agate mortar for 1 h. The electrode layers were deposited on the polished electrolyte substrates by brushing with a thickness of 20–30 μm and a relative deposition density of 7–10 mg cm−2. The layers were sintered at different temperatures in the range of 900–1000 °C for 2 h in order to establish the optimal sintering conditions. In the case of the two-layered structure, the current collectors with the composition of LNF + 3 wt.% CuO or LSM + 2 wt.% CuO were deposited with a thickness of 20–30 μm over the sintered functional layer and sintered at 900 °C for 2 h and at 950 °C for 2 h, respectively. The CuO-modified LNF and LSM collectors were developed earlier and successfully applied to the different electrodes to ensure stable current collection [31,33,51,52]. The microstructure of the electrodes was explored using an electron microscope, Tescan Vega 4 (Tescan, Kohoutovice, Czech Republic). The error of the particle size calculation was equal to 3%.
The electrode performance was studied by an impedance spectroscopy method using an electrochemical station comprising a 1260 Solartron impedance analyzer and a 1287 Solartronpotentiostat/galvanostat (Ametek, West Sussex, UK). The measurements were carried out in a frequency range of 0.01 Hz–500 KHz with an applied AC signal amplitude of 30 mV, 30 points per decade. The samples were placed into the measurement cell between the platinum current collecting grids (mesh size of 0.1 × 0.1 cm) connected to the measuring station via the two-electrode four-cable scheme. The EIS spectra were collected in humidified air (a flow rate of 25 SCCM) in the temperature range of 600–850 °C with a step of 50° and an equilibration time of 30 min before measurements. Each measurement was finalized by recording the total dc cell resistance (Rdc). The spectra obtained were fitted using Z-View2 software and pyDRTtools. The measurement error was estimated as ~3%.

3. Results and Discussion

3.1. High-Resolution Neutron Powder Diffraction

3.1.1. NCNCO01

Table 1 contains the results of the structure refinement obtained for the NCNCO01 sample by TOF NPD. Refinement profiles are presented in Figures S1–S4. At 50 °C, all the samples under study before and after the temperature treatment had a structure with a Bmab sp.gr. (№ 64), which is common for nearly stoichiometric (regarding oxygen) R-P phases [28]. Atom coordinates calculated for the structure within this sp.gr. are: Nd/Ca (0, y, z); Ni/Cu(0,0,0); O1 (0.25, 0.25, z); O2 (0, y, z); O3 (0.25, 0.25, z) [63,64]. The NCNCO01 sample, after the synthesis, possessed an oxygen composition close to the stoichiometric sample [49]. Thus, no interstitial oxygen was expected for this composition. This is because both Ca-doping at the rare-earth site and Cu-doping at the Ni site lead to a decrease in the overall amount of oxygen, and it is reasonable that the first candidate to leave the structure is weakly bound interstitial oxygen [33,37,49,65]. Moreover, owing to the tendency of Cu cations to form structures with square-planar coordination [47], one can expect oxygen deficiency at the expense of the apical oxygen, particularly for the compositions with higher copper content.
After the temperature treatment in air, oxygen stoichiometry in the sample remained the same; however, the structure refinement led to non-zero occupancies for the interstitial oxygen sites (O3) and, simultaneously, occupancy of the apical oxygen sites (O2) decreased. It has been established in a number of studies that oxygen migration in R-P phases occurs by the interstitialcy (push–pull) mechanism through the apical and interstitial oxygen sites [66,67,68]. That is why a rearrangement of oxygen between these two sites is expected, as it leads to a different canting of the oxygen octahedrons that may be favorable for relaxing the microstrains occurring in the R-P phases due to a difference in the thickness between the rock-salt and perovskites layers in the ab plane [28]. As follows from the structural refinement results, a change in the canting of the oxygen octahedrons leads to a change in the position of the Nd/Ca atom and to an increase in the U parameter of the Nd/Ca site, as well as to a decrease in the U parameter of the Ni/Cu site. Moreover, one can see a small increase in the c lattice parameter value, which correlates with the amount of interstitial oxygen in R-P phases [69].
Figure 1 illustrates the above-mentioned structural changes for the NCNCO01 sample after the high-temperature treatment in static air.

3.1.2. NCNCO03

Table 2 contains the results of the structure refinement obtained for the NCNCO03 sample by TOF NPD. Refinement profiles are presented in Figures S5–S8. The oxygen content in the NCNCO03 sample after synthesis is hypo-stoichiometric, which is expected based on an increased content of copper in the composition. After heating in air, the same results as for the NCNCO01 sample can be seen, namely, the appearance of the oxygen interstitials at the expense of oxygen atoms from the apical site.
The structural refinement of the NCNCO03 sample after the temperature treatment in a vacuum was not stable. The U parameter of the Ni/Cu site had to be fixed to the same value as it was before the treatment. Otherwise, the U parameter of the Ni/Cu site went to zero and occupancy of the oxygen apical site went to unity, which obviously shouldnot have happened in a vacuum after the treatment in air. However, after heating in a vacuum, the oxygen content in the NCNCO03 sample remained the same, and other structural parameters were close to those obtained before the temperature treatment. The structure of the as-synthesized NCNCO03 sample and the NCNCO03 sample after the high-temperature treatment in static air is shown in Figure S9a,b, respectively.

3.1.3. NCNCO04

Table 3 presents the results of the structure refinement obtained for the NCNCO04 sample in air by TOF NPD. Refinement profiles are presented in Figures S10 and S11. The NCNCO04 sample after the synthesis was even more hypo-stoichiometric than the NCNCO03 sample, mostly having oxygen vacancies at the apical oxygen site. After heating in air oxygen, the sample’s oxygen stoichiometry remained the same within an error. Overall, the structure of the NCNCO04 sample was stable and high oxygen mobility in it was not expected. Figure S9c illustrates the structure of the NCNCO04 sample after the high-temperature treatment in static air.

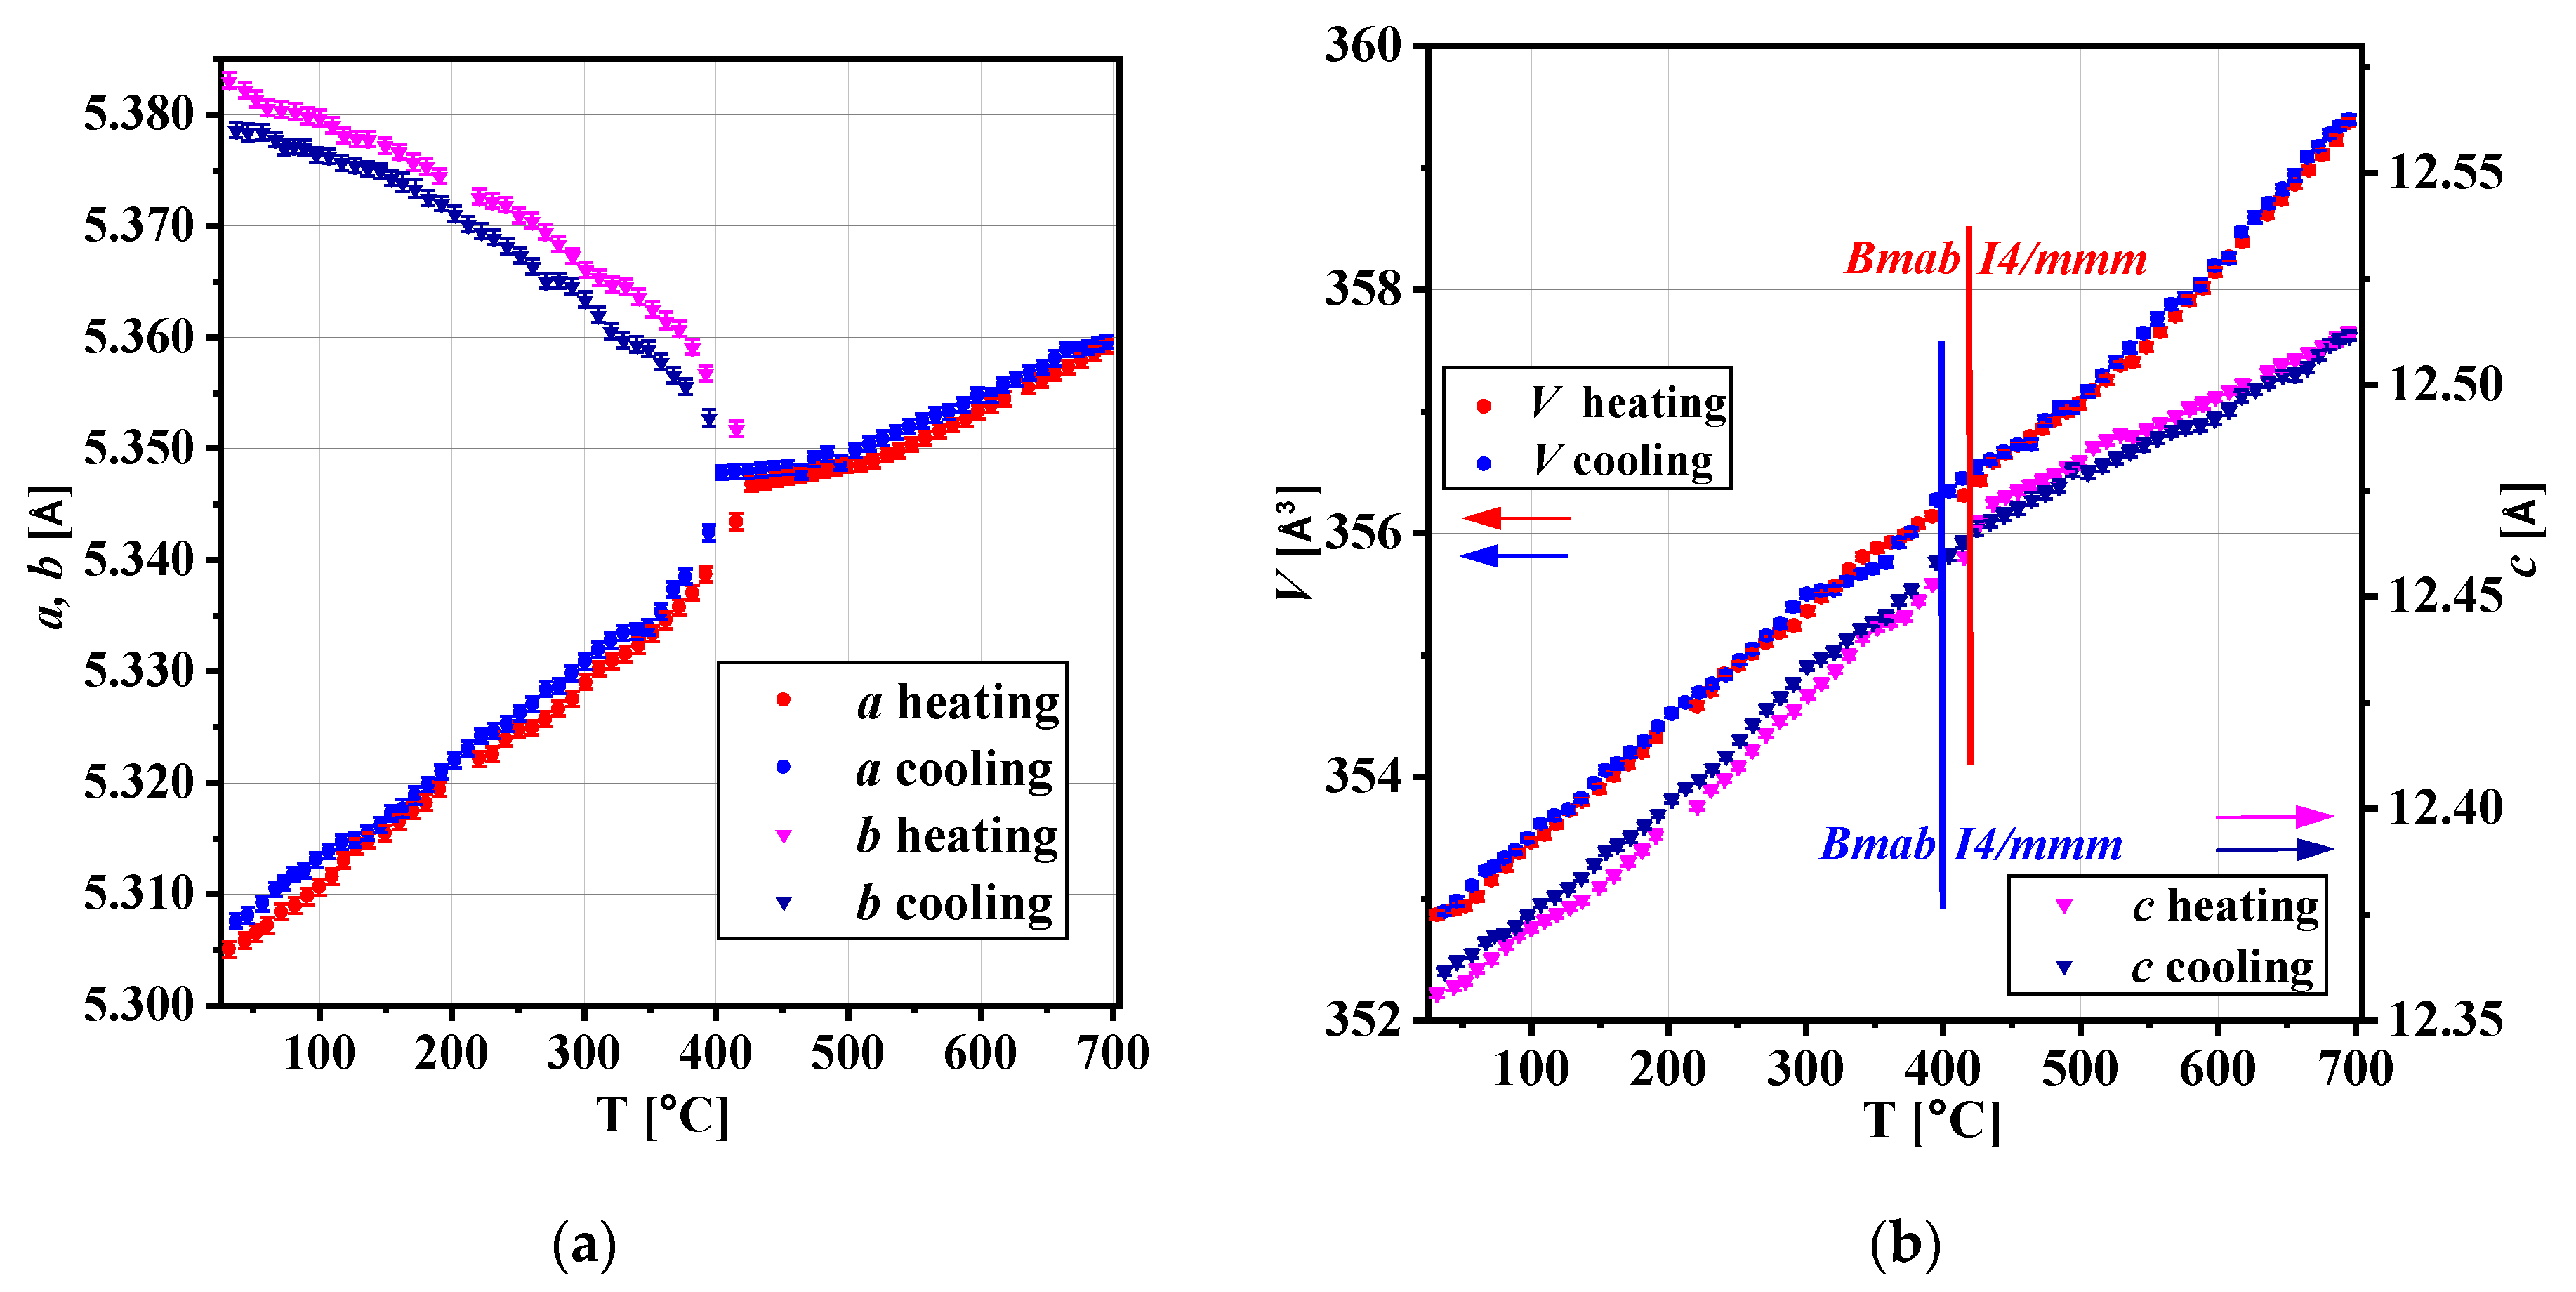
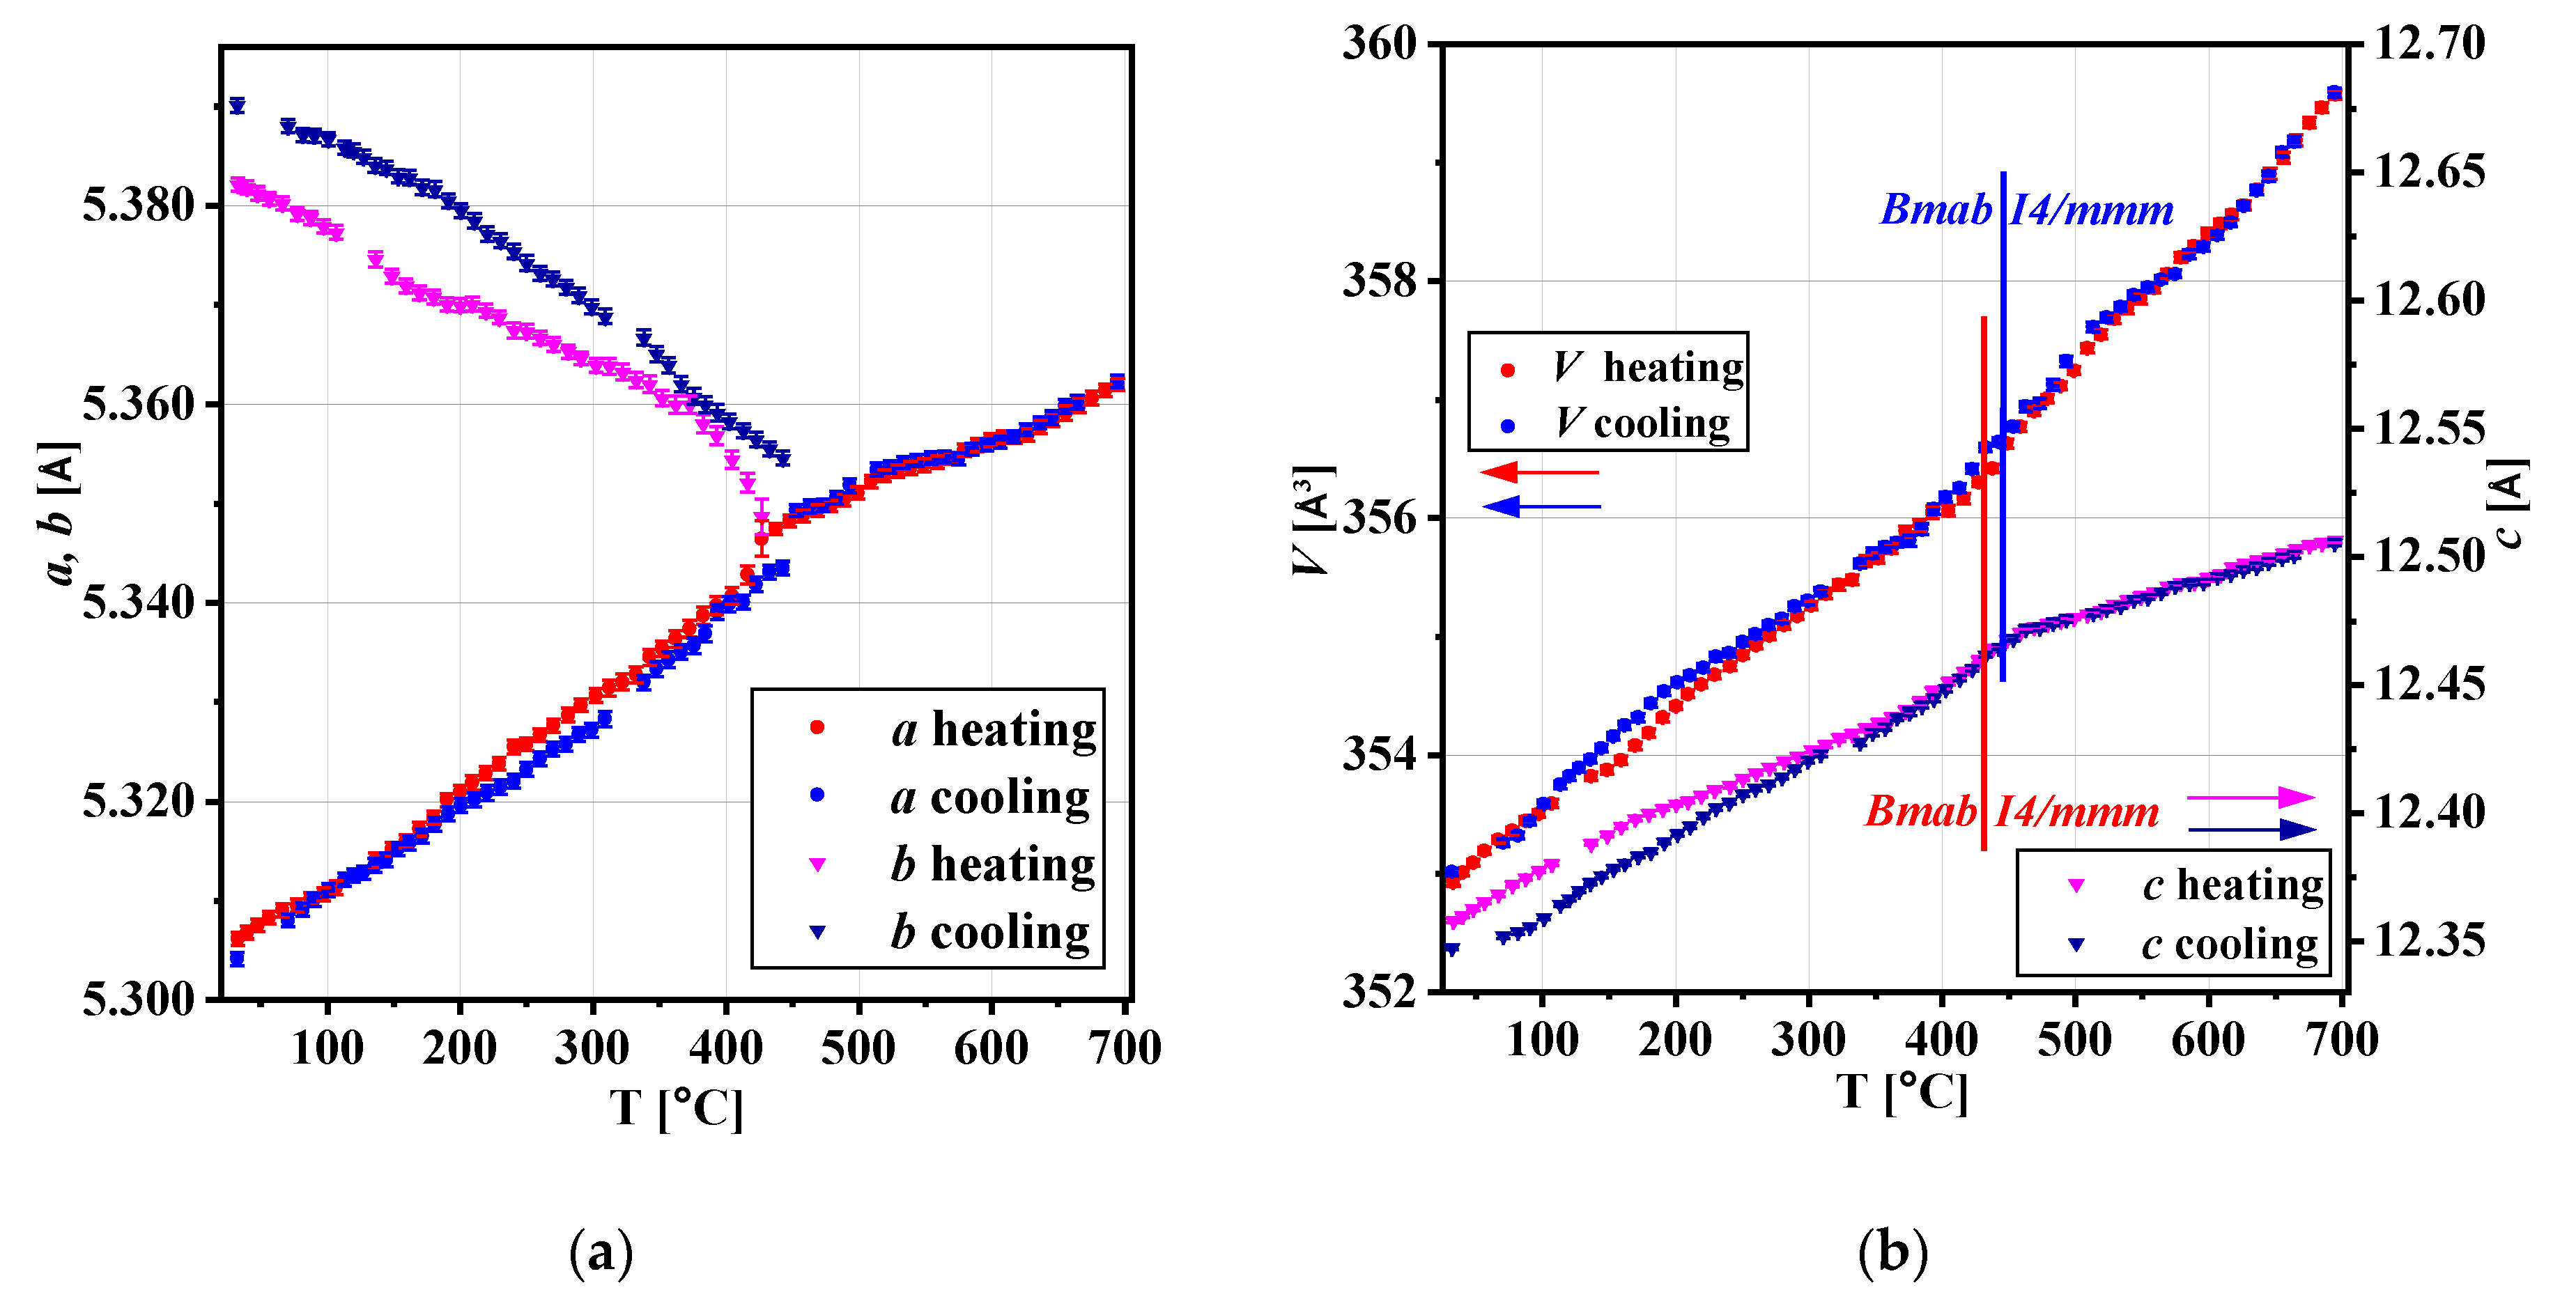
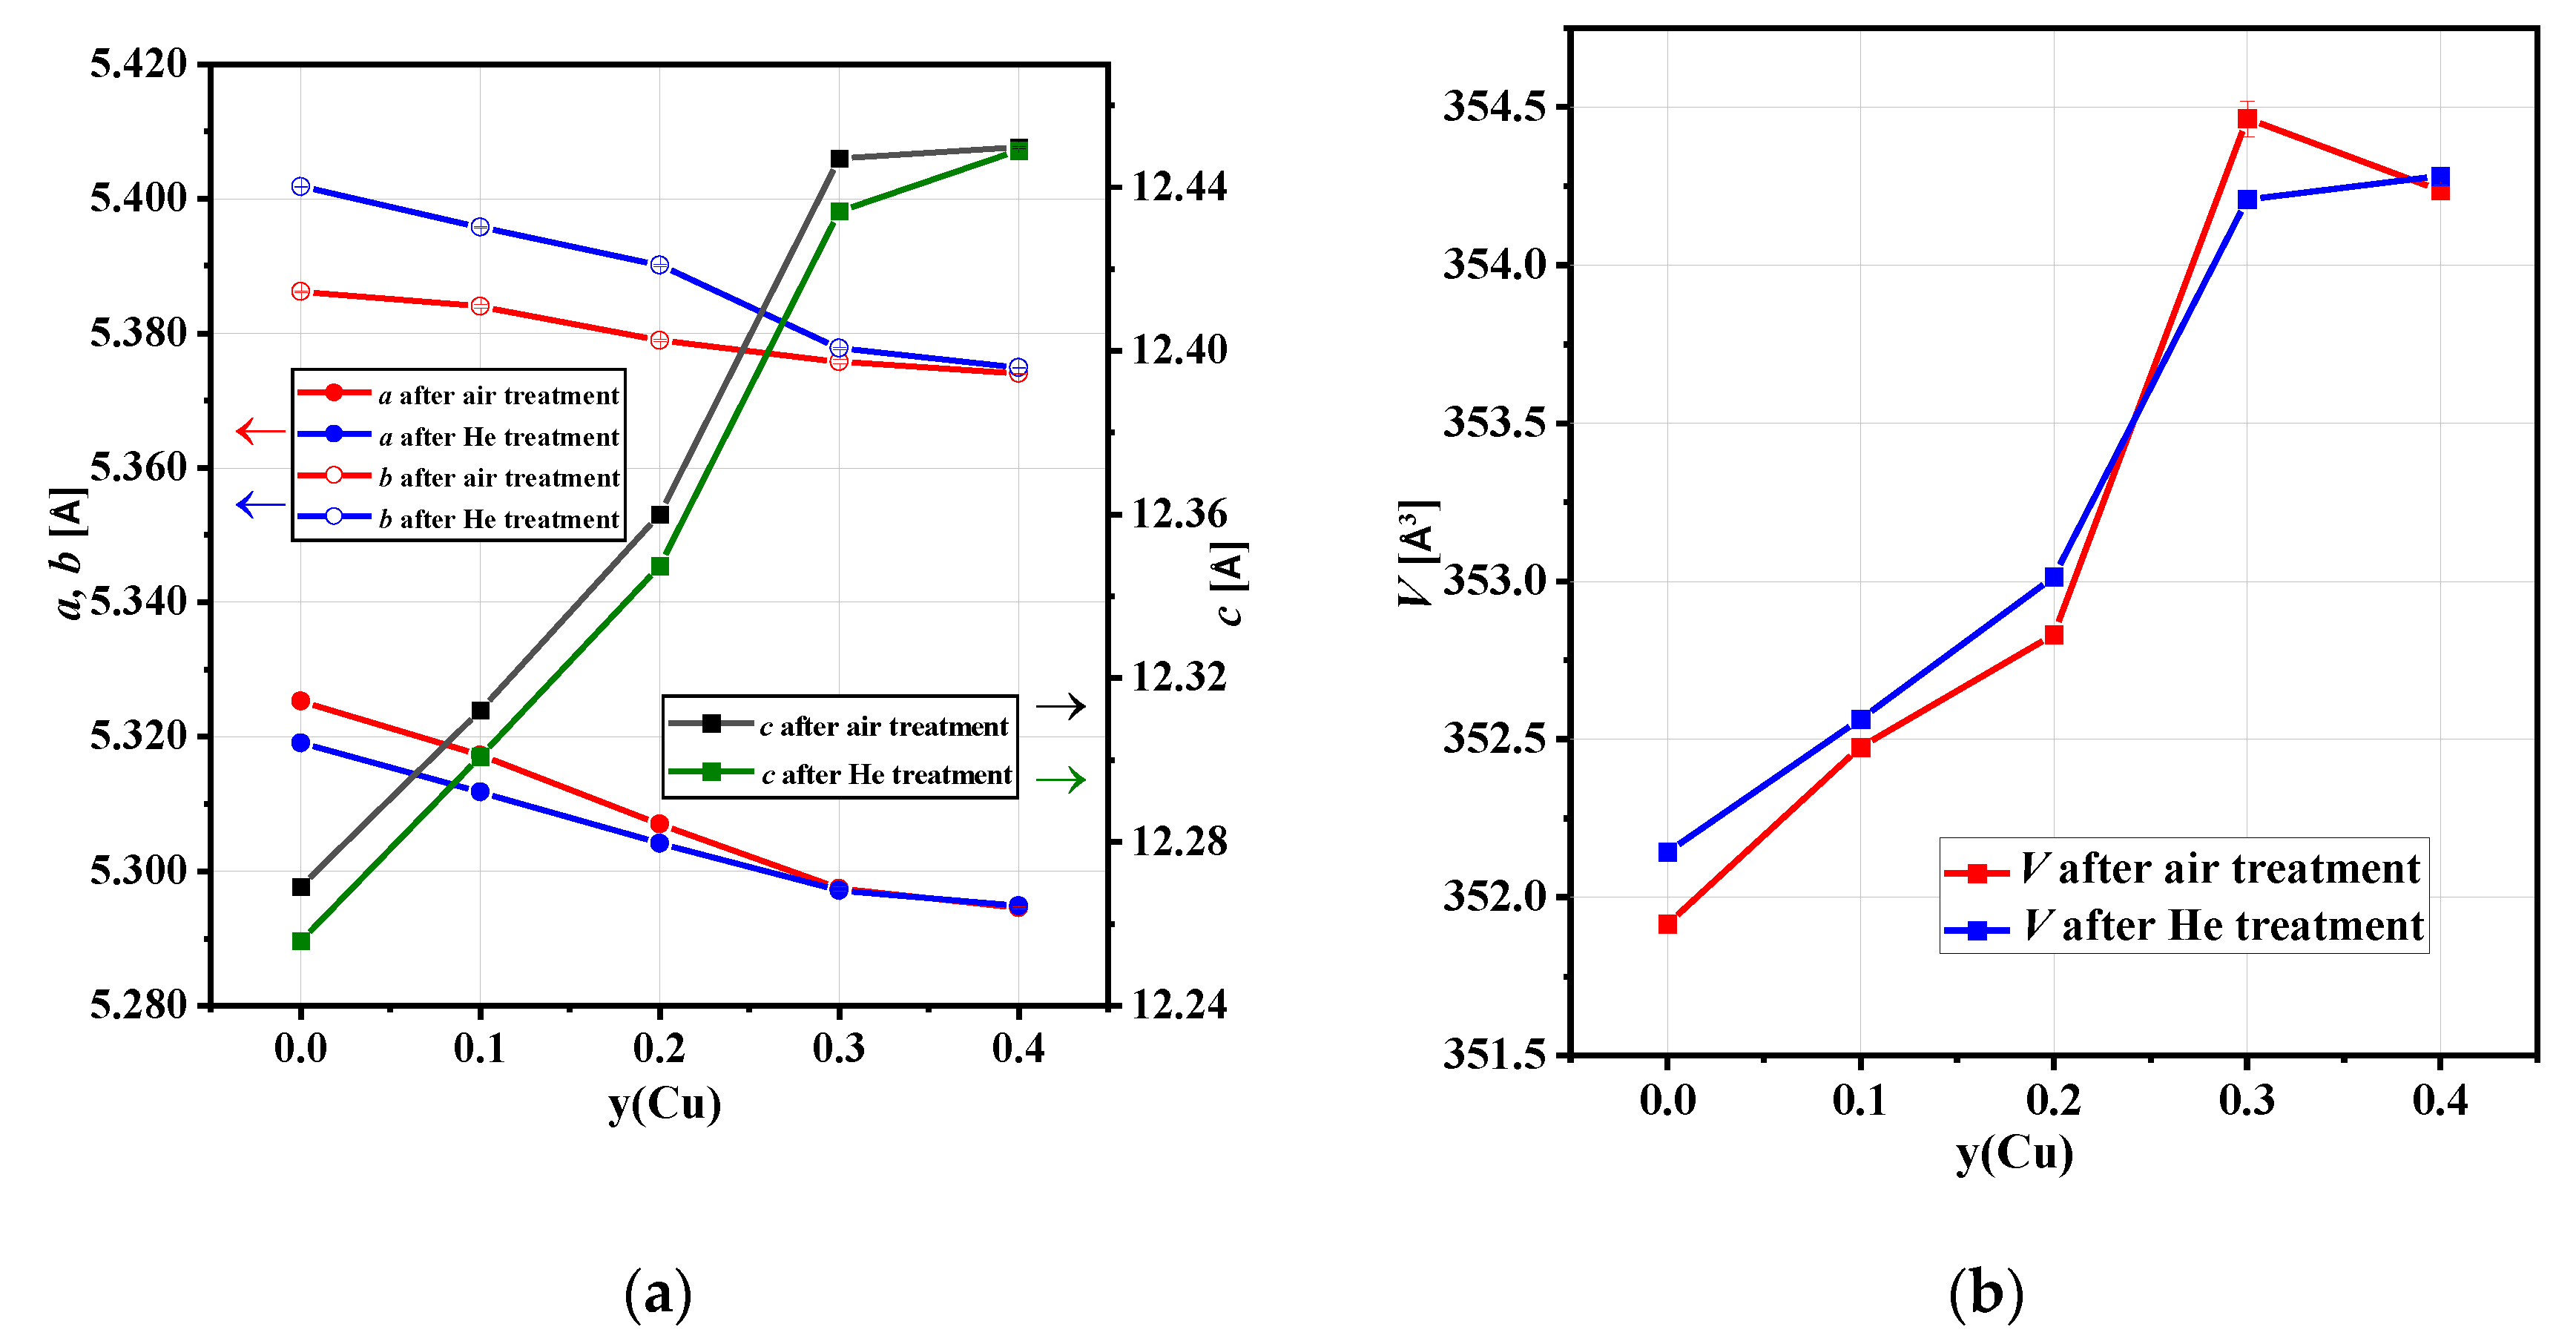
3.2. In-Situ XRD Studies of the Electrode Materials

Initial RT (room temperature) lattice parameters and the unit cell volume of the as-synthesized samples are presented in Figure 2a,b, respectively. With increasing the copper content, there was a gradual decrease in the a and b parameters. The exception was the value of the b parameter for the NCNCO01 sample, which was higher than that for the NCNCO00 sample. This fact might be explained by an unequilibrated state of the sample after the synthesis. Such adecrease in the a and b parameters is assumed to be caused by a smaller ionic radius of Cu cations compared to the Ni cations in the structure. Considering the oxygen content of these samples, probed by neutron diffraction, being close to stoichiometric, there should be a prevalence of Ni(II) cations in the samples (e.g., 60% for the NCNCO01 sample and more for the compositions with increased copper content), the ionic radius of which, in octahedral coordination, is 0.69 Å [71]. Ionic radius in the octahedral coordination of Cu(I) is 0.77 Å, and Cu(II) is 0.73 Å [71], which is larger than that of Ni(II). Hence, we can suggest that Cu cations have a smaller coordination number in the structure (most likely close to IV: Cu(I) is 0.6 Å, Cu(II) is 0.57 Å [71]).
The c lattice parameter, on the contrary, increased with increasing the copper content. This shows elongation of the oxygen octahedrons in the c direction, in agreement with the tendency of Cu ions to form a square-plane coordination, and further confirms our suggestion. Moreover, the neutron diffraction experiments showed the presence of oxygen vacancies mostly in the apical sites for the compositions with high copper content. This can explain the non-linear behavior of the c parameter for the NCNCO03 and NCNCO04 samples in relation to the c parameter of the NCNCO00–NCNCO02 samples.
The unit cell volume initially increased (being higher for NCNCO01 than for NCNCO02) and then remained almost the same for the NCNCO03 and NCNCO04 samples. This might suggest reaching the solubility limit in this series. These results agree well with those obtained in [49], where the solubility limit in the Nd1.6Ca0.4Ni1−yCuyO4+δ series was established to be equal to y = 0.35.
Figure 3a,b and Figure 4a,b show the change in the lattice parameters and the unit cell volume of the NCNCO02 sample when heating first in the synthetic air flow and then in the He flow. The dependencies for other samples are presented in the supplementary materials (Figures S12–S19). Upon heating in both atmospheres, there was a decrease of orthorhombic strain that manifested itself in a gradual increase in the a parameter value and a simultaneous decrease in the b parameter value. Merging the a and b parameters due to a phase transition from a Bmab (№ 69) structure to anI4/mmm (№ 139) structure took place at slightly different temperatures for the different samples and gas atmospheres. This transition was reversible upon cooling, but the temperature of the transition was lower in air and, conversely, was higher in He (Table 4). It should be noted that anI4/mmm sp.gr. is a common space group for a relaxed high-temperature state of the first order R-P phases [28]. This transition can be associated with the release of the structure strain at high temperatures, which, at lower temperatures, is compensated by the canting of the oxygen octahedrons and, hence, is characterized by orthorhombic distortions. Additionally, the strain can be compensated by the incorporation of the interstitial oxygen, the amount of which decreases with increasing copper content. Hence, the temperature of the transition varies depending on the amount of interstitial oxygen. A lesser amount of interstitial oxygen should increase the temperature of the transition, and that is what was observed in the experiments: in a helium atmosphere, after the release of the interstitial oxygen (for the NCNCO00–NCNCO02 samples), the temperature of the phase transition increased compared to those for the air-treated samples (Table 4). Interestingly, there was nostrong correlation between the temperatures of the phase transition and the copper content. Kinetic factors may have influenced the temperature of the phase transition in each particular experiment. Furthermore, it is problematic to deduce the exact moment of the phase transition from the XRD data (i.e., at what moment exactly the a and b parameters merge). Hence, the temperature of the transition for any particular case may be ±30 °C from the temperatures stated in Table 4.
The values of the volumetric thermal expansion coefficients are presented in Table 4. There were at least two distinct linear regions on the volume cell temperature dependencies in both air and helium atmospheres. These two regions corresponded to the orthorhombic and tetragonal phases of the samples and were seen as a slight slope increase when sp.gr. changed to I4/mmm and returned to the original one upon cooling after the phase transition into Bmab sp.gr. Hence, the VTEC values of the orthorhombic phase were lower than those of the tetragonal phase, which can be explained by a compensating change in the a and b lattice parameters upon changing the temperature for this syngony. Copper doping lowers VTEC at y(Cu) = 0.1; however, further doping (y(Cu) = 0.2) slightly increases it. Overall, the VTEC value in the range (8–10) × 10−6 K−1 are close to the TEC values of the commonly used electrolytes for the intermediate-temperature SOFCs [20,21,22]. The phase transition does not cause a significant volume jump, and an increase in VTEC is not as high as those registered in the dilatometric studies in [49]. According to the dilatometric data, a transition in the linear thermal expansion coefficient values from 5.6–7.1 to 11.4–14.8 × 10⁻⁶ K−1 was observed at approximately 400 °C in air. The difference between the data on thermal expansion obtained by different methods is caused by the anisotropy of the layered R-P structure [28].
Figure 5 shows the concentration dependencies of the lattice parameters and the unit cell volume for all the samples after the treatment in the different gas atmospheres. The general trend is the same: the a and b parameters gradually decrease with increasing copper content; the c parameter and the unit cell volume steadily increase for the samples with low copper content (for the NCNCO01 and NCNCO02 samples) and then sharply increase for the NCNCO03 and NCNCO04 samples. The difference between the same lattice parameters after the treatment in different gas atmospheres reflects a change in the oxygen stoichiometry and/or in the structure, namely, the re-distribution of oxygen, as was shown by NPD. A representative value in this sense is an orthorhombic distortion (Table 4), which shows a degree of the difference between the a and b parameters. Regarding this, from the point of decreasing the strain in the structure, orthorhombic distortion is lower in the presence of the interstitial oxygen (the NCNCO00–NCNCO02 samples after the air treatment) and higher when there is a small amount or absence of it (the NCNCO00–NCNCO02 samples after the He treatment and the NCNCO03 and NCNCO04 samples).

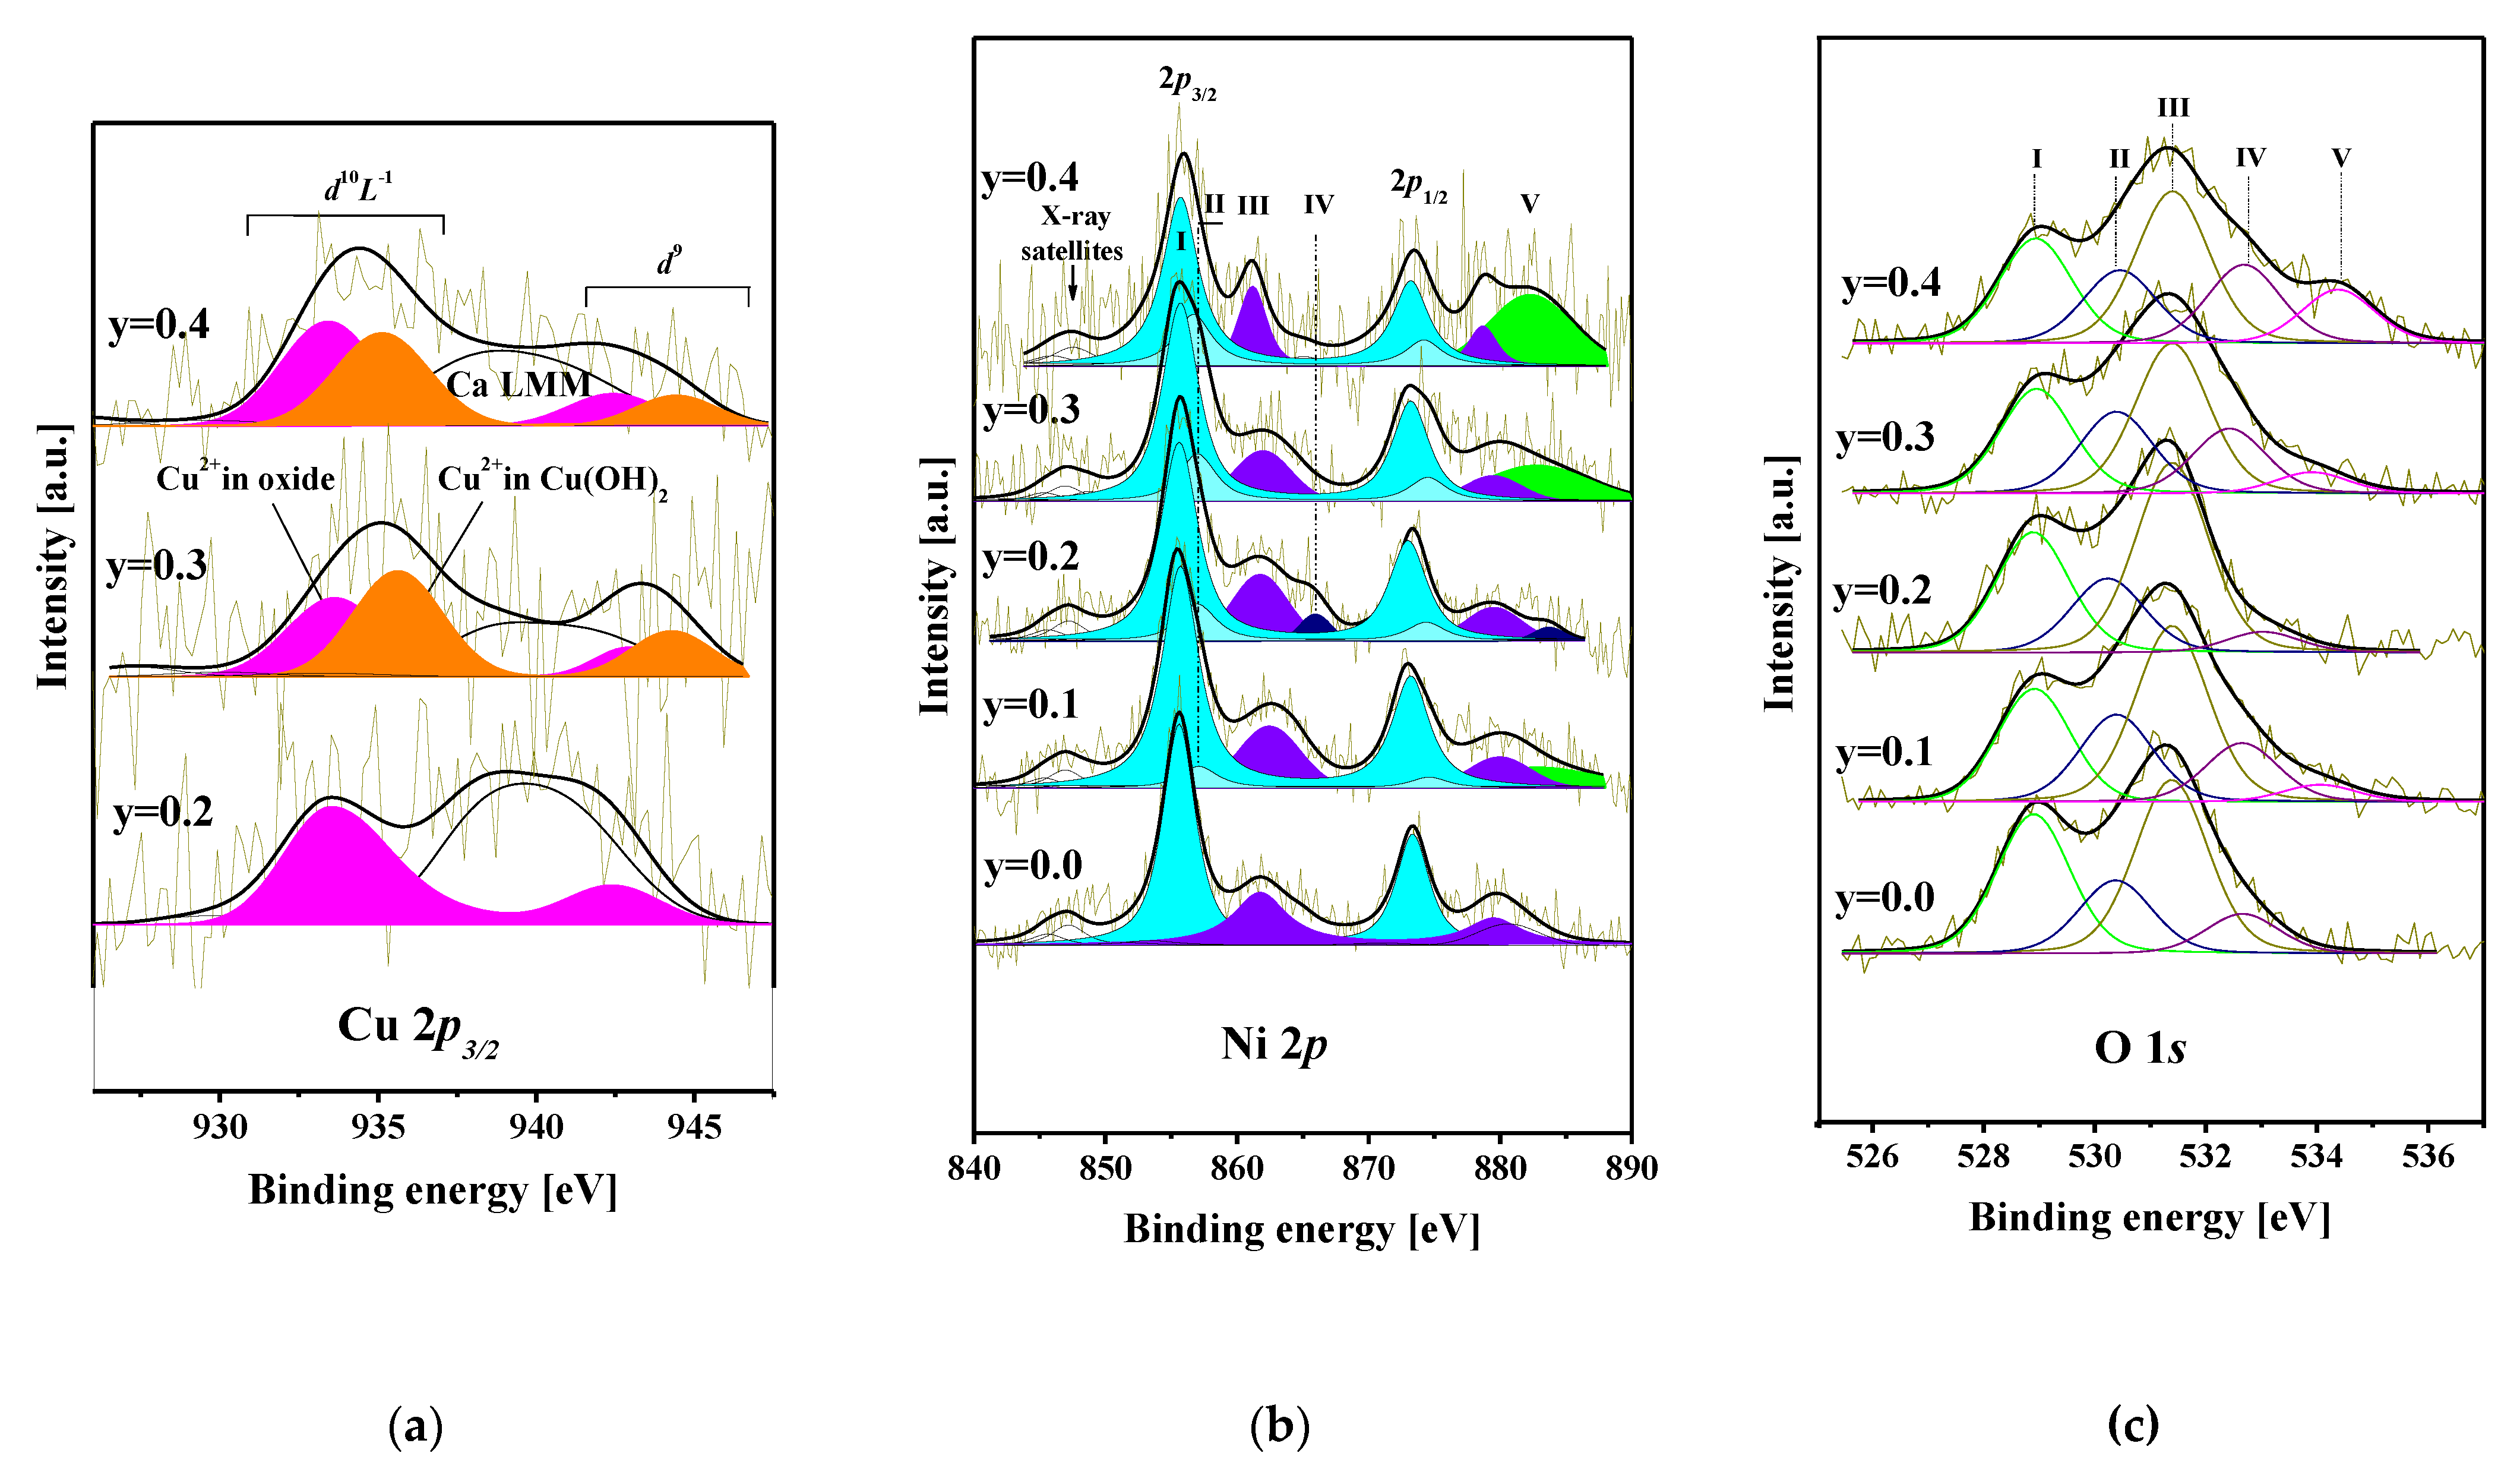
3.3. XPS Studies of the Electrode Materials

Figure 6a shows the XPS spectrum of copper obtained on the samples with high copper content NCNCO02–NCNCO04. We failed to obtain similar spectra on the samples with lower copper content. As it is known, in the process of photoelectron emission, a 2p hole appearing in the core level of bivalent copper can lead to a complex type of relaxation of the electronic structure—a charge transfer from the ligand to the metal with the final state d10L−1. The location of the bottom of the hybridized O 2p band relative to the Fermi level determines the distance between d10L−1and the satellite shake-up peak in the Cu 2p spectrum [72]. Due to the presence of an intense calcium Auger peak in the spectrum, which overlaps with the shake-up satellite, the image of the latter in Figure 6 is given with a certain degree of conventionality. As follows from [73], the obtained binding energies of 933.7 and 935.1 eV for the d10L−1 peaks of the Cu 2p3/2 electronic level correspond, respectively, to the main compound and copper hydroxide.
Figure 6b shows the XPS spectrum of nickel. The NiO spectrum has been studied by many authors, who have stated that, in addition to the spin-orbit splitting, its complex structure also contains multiplets and shake-up satellites [74,75,76,77]. In ref. [75], the XPS method was used to study the defect structure of NiO after the heat treatment. It was shown that the specific changes occurring in the Ni 2p and O 1s spectra upon heating, in particular, the appearance of a peak at 856.1 eV, can be interpreted as the appearance of the Ni(III) state in the oxide. It was shown in [76] that Ni(III) can form on a Ni(110)–O surface doped with potassium. This is due to the presence of a strong electropositive element near the Ni atoms. In this and otherworks [77], the subtraction method was used to determine the presence of Ni(III) in the overlapping of its spectrum with the NiO shake-up satellite.
Referring to the Ni 2p spectra obtained in this study and taking into account the data of other authors, it can be concluded that in the spectrum of the samples with a copper content of 0.1–0.4, along with the Ni(II) state, there was also the Ni(III) state, which corresponds to the main peakII and, in one case of the NCNCO02 sample, to the satellite IV, as shown in Figure 6b. The XPS data obtained on the Ni and Cu states in the series correlate well with the in-situ XRD data (Section 3.2).
Figure 6c shows the XPS spectrum of oxygen in which peaks I and II correspond to metal–oxygen bonds and high-energy peaks III, IV, and V correspond to CO3 and OH groups as well as other organic impurities contained on the surface of the samples.
The number of holes per formula unit in the NCNCO00–NCNCO04 samples in the sublattice of the 3d element can be expressed as: n = α(1 − x), where α is the fraction of Ni(III) (Table 5).This fraction can be determined from the obtained XPS spectra related to the Ni 2p electronic level (see Figure 6b) by the ratio of the corresponding intensities, taking into account that doublets I and III refer to the signals from Ni(II), while doublets II and IV refer to the signals from Ni(III).
It can be seen from the calculation results (Table 5) that the amount of the hole charge increases with a decrease in the amount of copper down to 0.2 and then decreases. It corresponds to the results of the conductivity study, presented in our earlier work [49], where it was shown that the concentration dependence of the total conductivity exhibited a maximum of 165 S cm−1 at y = 0.2.

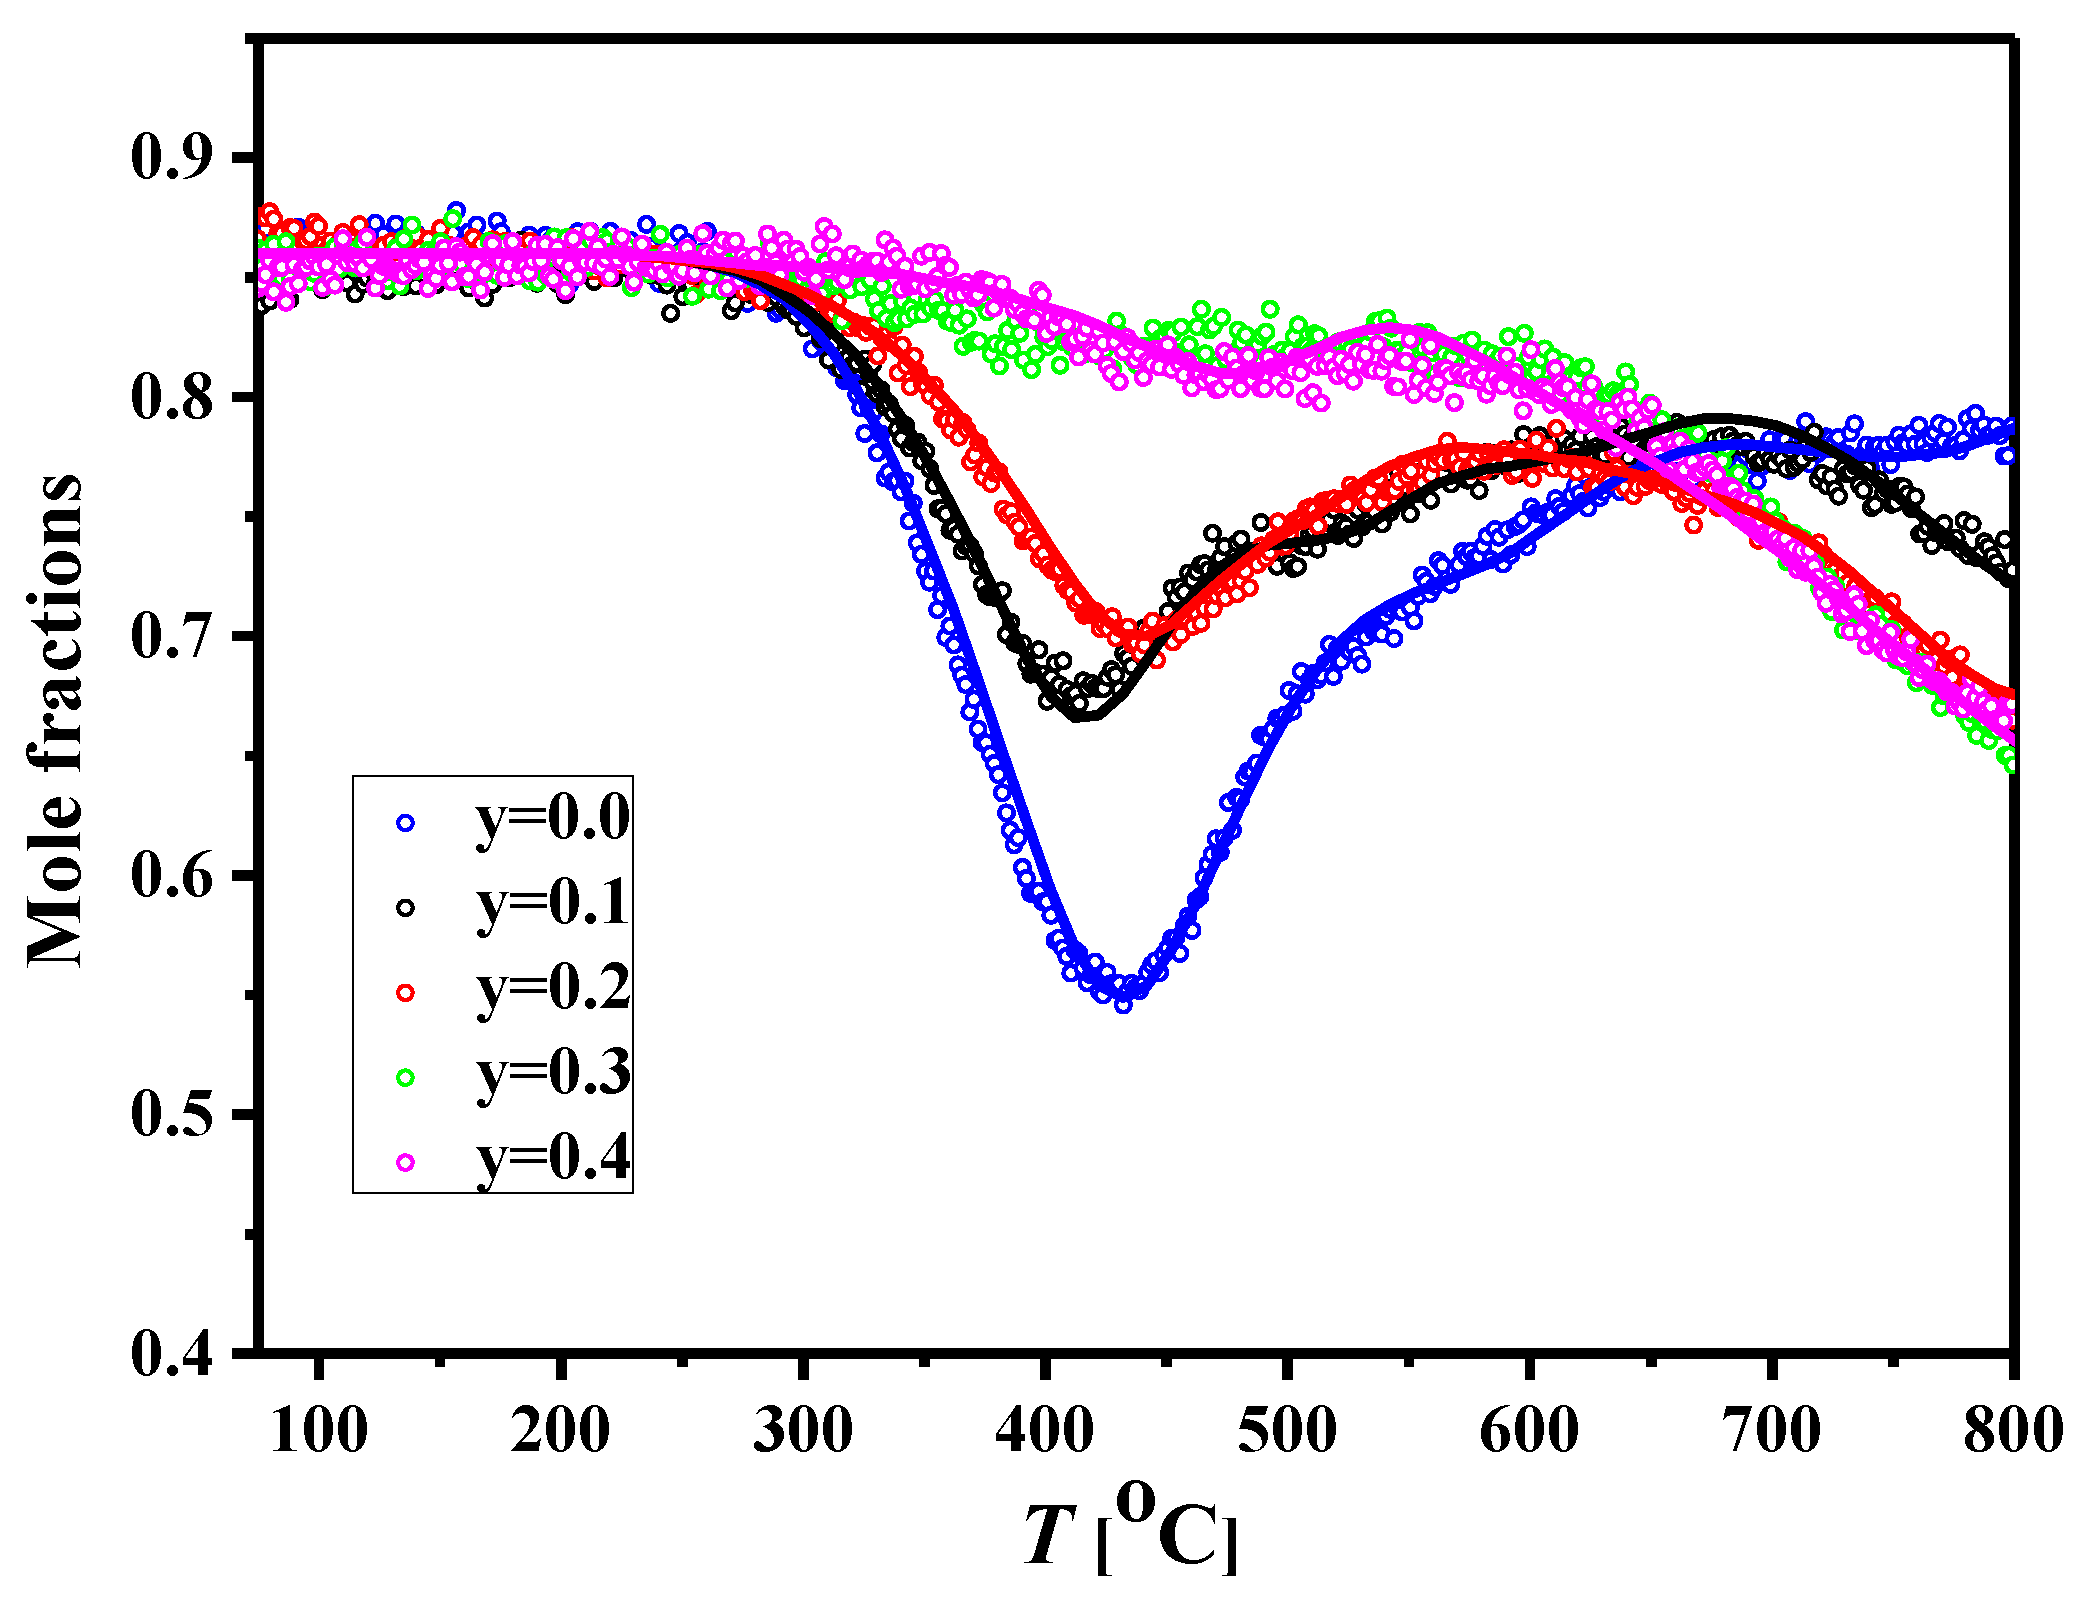
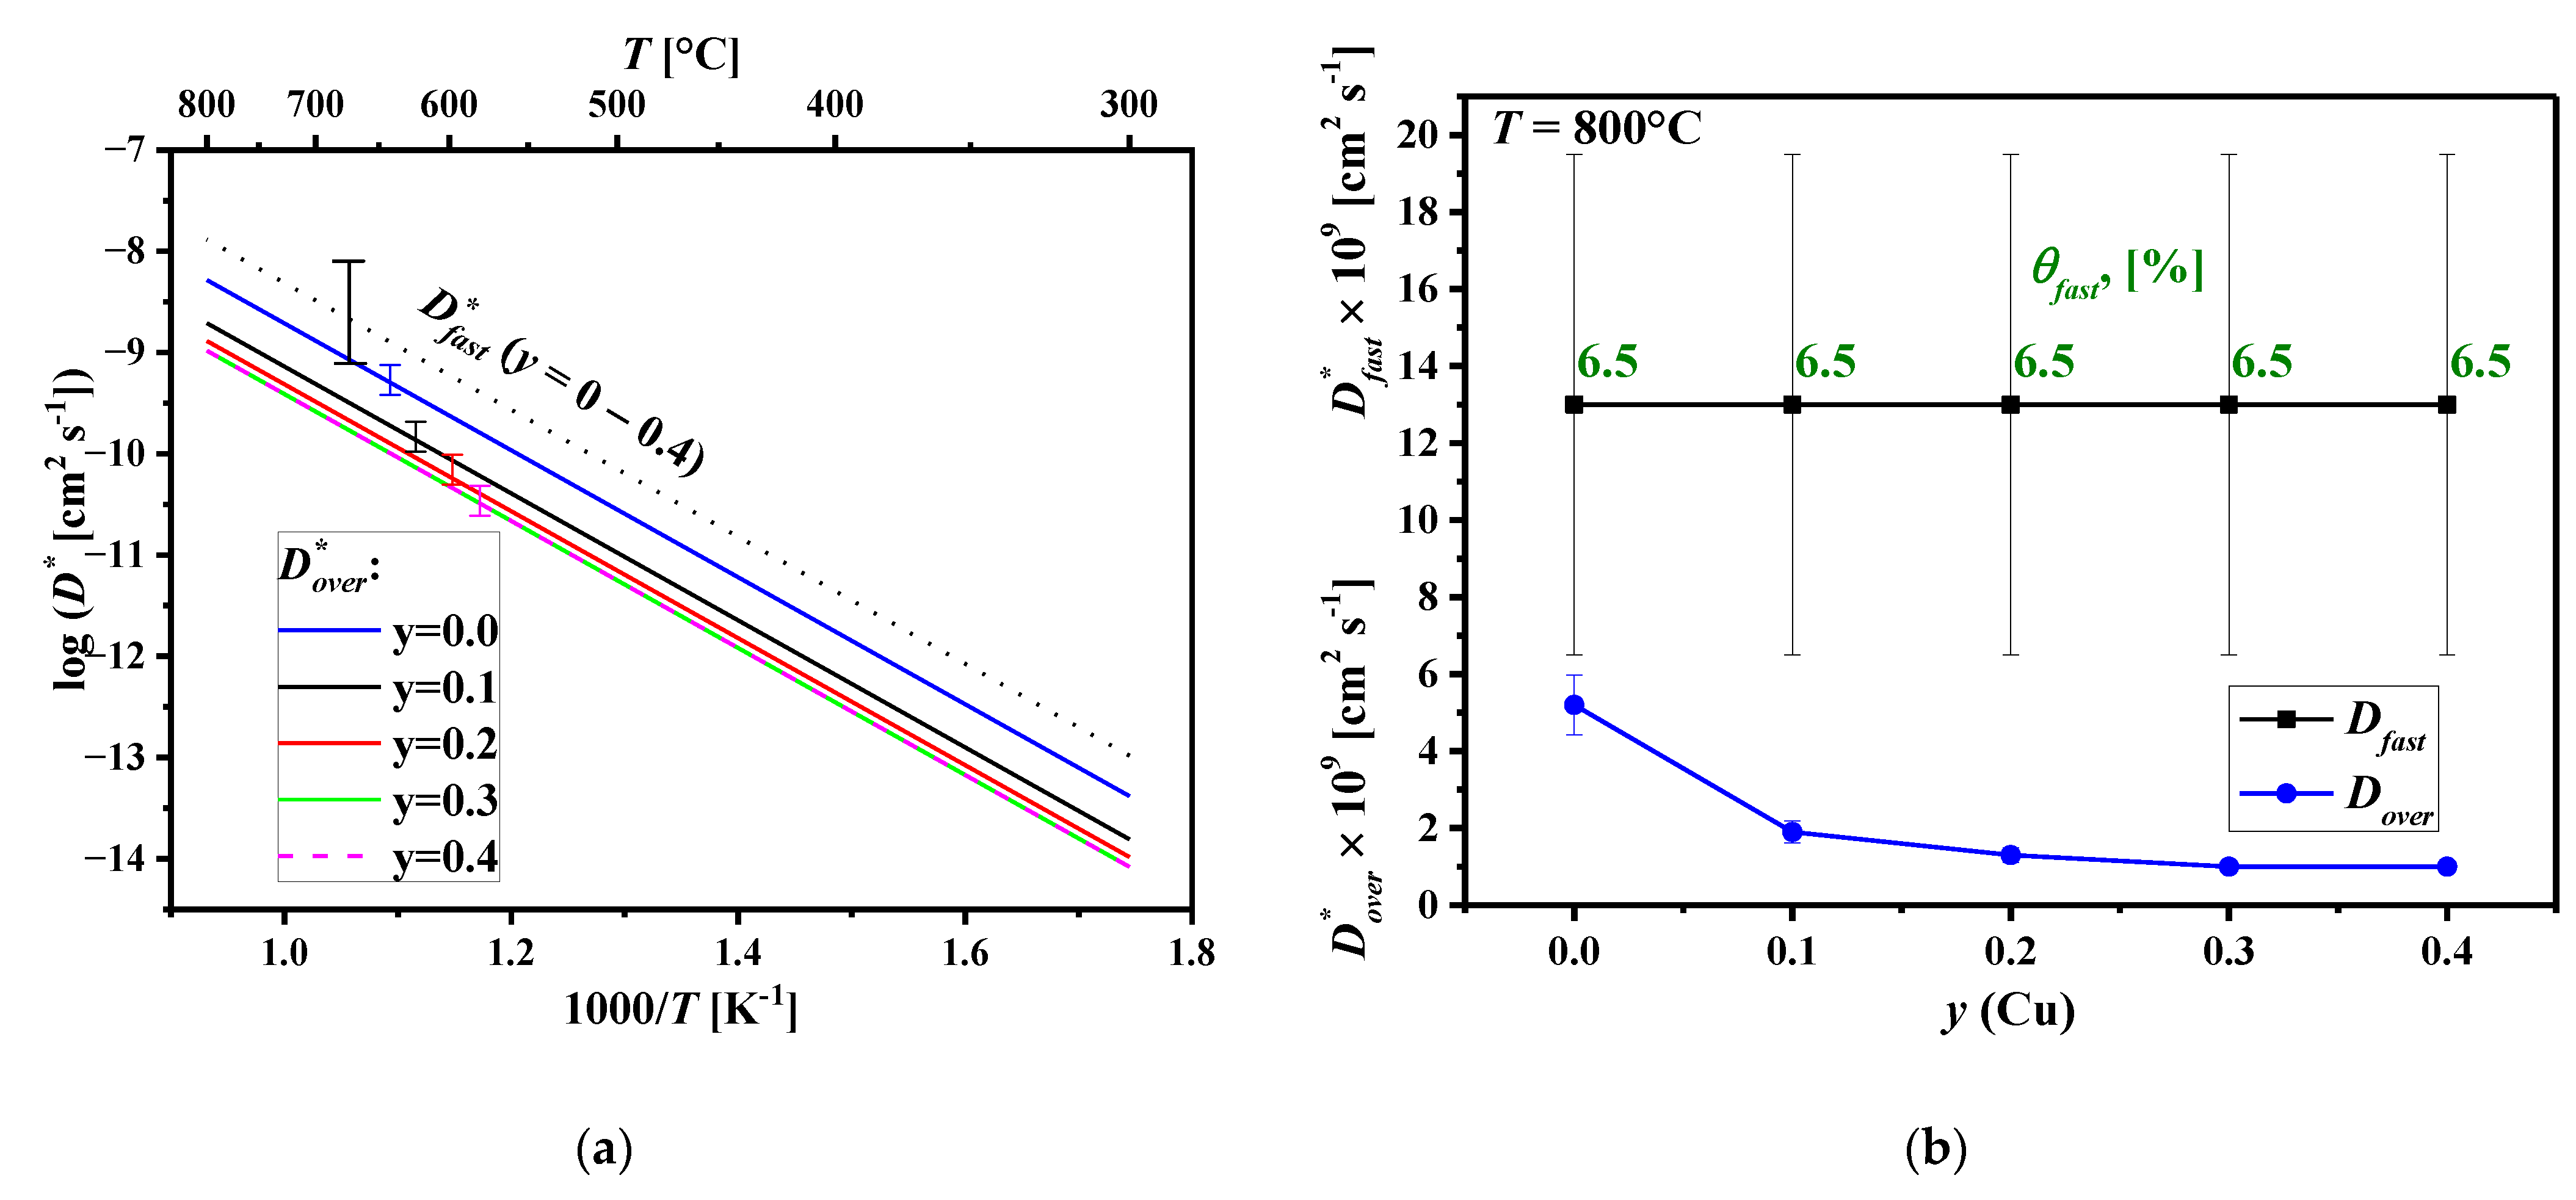
3.4. Oxygen Mobility in the NCNCO Materials

Oxygen mobility was studied by a temperature-programmed isotope exchange of oxygen (TPIE) with C18O2 in a flow reactor. According to the TPIE data for the NCNCO00–NCNCO04 samples (Figure 7), the isotope exchange started at the temperature of 250–300 °C The TPIE peak in the range of 400–450 °C corresponds to the oxygen fraction with the fastest substitution rate, and its intensity decreases with increasing copper content as evidence of a decrease in the fraction of the most mobile oxygen fraction (interstitial oxygen [67]). The tracer diffusion coefficients for this form of oxygen, D o v e r * , and its fraction with respect to the total oxygen amount, θfast, were determined based on the numeric modeling described in the details elsewhere [78,79] (Table 6). It was impossible to unambiguously distinguish other peaks on the TPIE curves; hence, the average weighted tracer diffusion coefficient, D o v e r * , values were used for the comparison of oxygen mobility in the samples with different copper content, calculated as follows:
D o v e r * = i θ i × D i * 100 % ,
where θi is the fraction of oxide anions characterized by a tracer diffusion coefficient, D i * .
Temperature dependencies and concentration dependencies of the oxygen tracer diffusion coefficients for the NCNCO00–NCNCO04 samples are presented in Figure 8a,b, respectively. It is seen that kinetics of oxygen transport decreases with the copper content increasing, which manifests itself in the decreasein both the D o v e r * values and the share of fast oxygen, θfast. There is a lack of information in the literature on the copper doping effect on oxygen transport properties. In [35], decreasing the D* values for the La2Ni1−xCuxO4+δ by increasing the copper content was demonstrated. Along with this, a non-monotonous dependence of oxygen permeability of the Pr2Ni1−xCuxO4+δ (x = 0.1–0.5) membranes on the copper content was demonstrated, with the maximum corresponding to x = 0.2. Nevertheless, for x > 0.2, a decrease in oxygen permeability was demonstrated and probably related to a decrease in oxygen excess [80]. Infiltration of porous lanthanum strontium ferrite (LSF) electrodes with aqueous nitrates solutions containing Pr, Ni, and Cu related to the Pr2Ni0.7Cu0.3O4 and Pr2Ni0.6Cu0.4O4 compositions significantly reduced the polarization resistance at 650 °C from 0.98 Ω cm2 to 0.16 and 0.13 Ω cm2, respectively, due to an increased surface exchange rate [81]. For the B-site excessive Pr2Ni0.8Cu0.2+xO4+δ (x = 0–0.10) and Pr2Ni1.05−xCuxO4+δ (x = 0–0.25), increasing oxygen permeability with increasing copper content was attributed to the anomalous grain growth caused by a Cu-rich liquid phase. Such assumptions were made while analyzing electrochemical impedance spectroscopy data for the Pr2Ni1−xCuxO4+δ-based electrodes [82]. On the other hand, theoretical calculations predicted the positive effect of Cu cations on the oxygen transport characteristics due to the increase in the (Ni,Cu)–O bond lengths for Cu- and Ga-doped Pr2NiO4+δ [83,84]. In the present study, decreasing the oxygen transport characteristics byincreasing the copper content is assumed to be associated with a decrease in the highly-mobile interstitial oxygen content in agreement with the TOF NPD and in-situ XRD data (Section 3.1 and Section 3.2) and the absolute oxygen over-stoichiometry values for the NCNCO samples determined in our recent study [49] from the sample mass change upon reduction in a 50 vol.% H2/50 vol.% Ar gas mixture at 1000 °C, showing their decrease from 0.07 (1) (y = 0.0) down to 0.00 (1) (y = 0.3). Independence of the effective activation energy of diffusion on Cu content (Table 6) and the literature data presented in works [35,80] support this assumption as well.

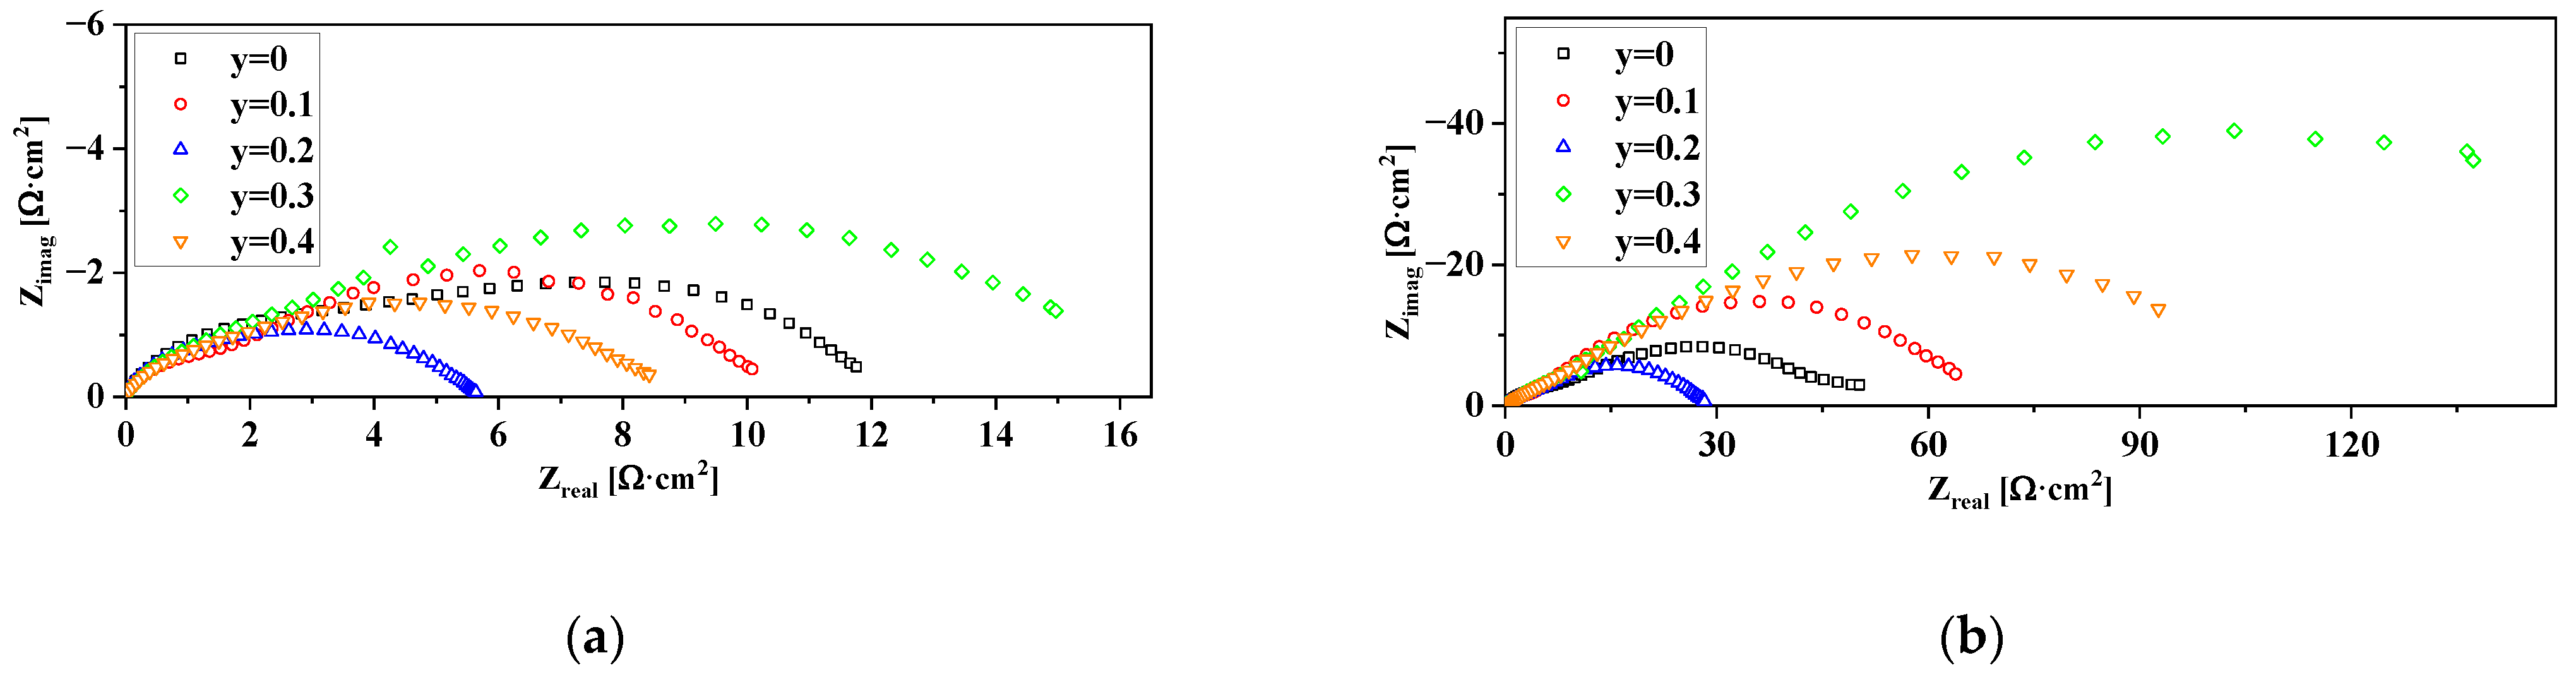
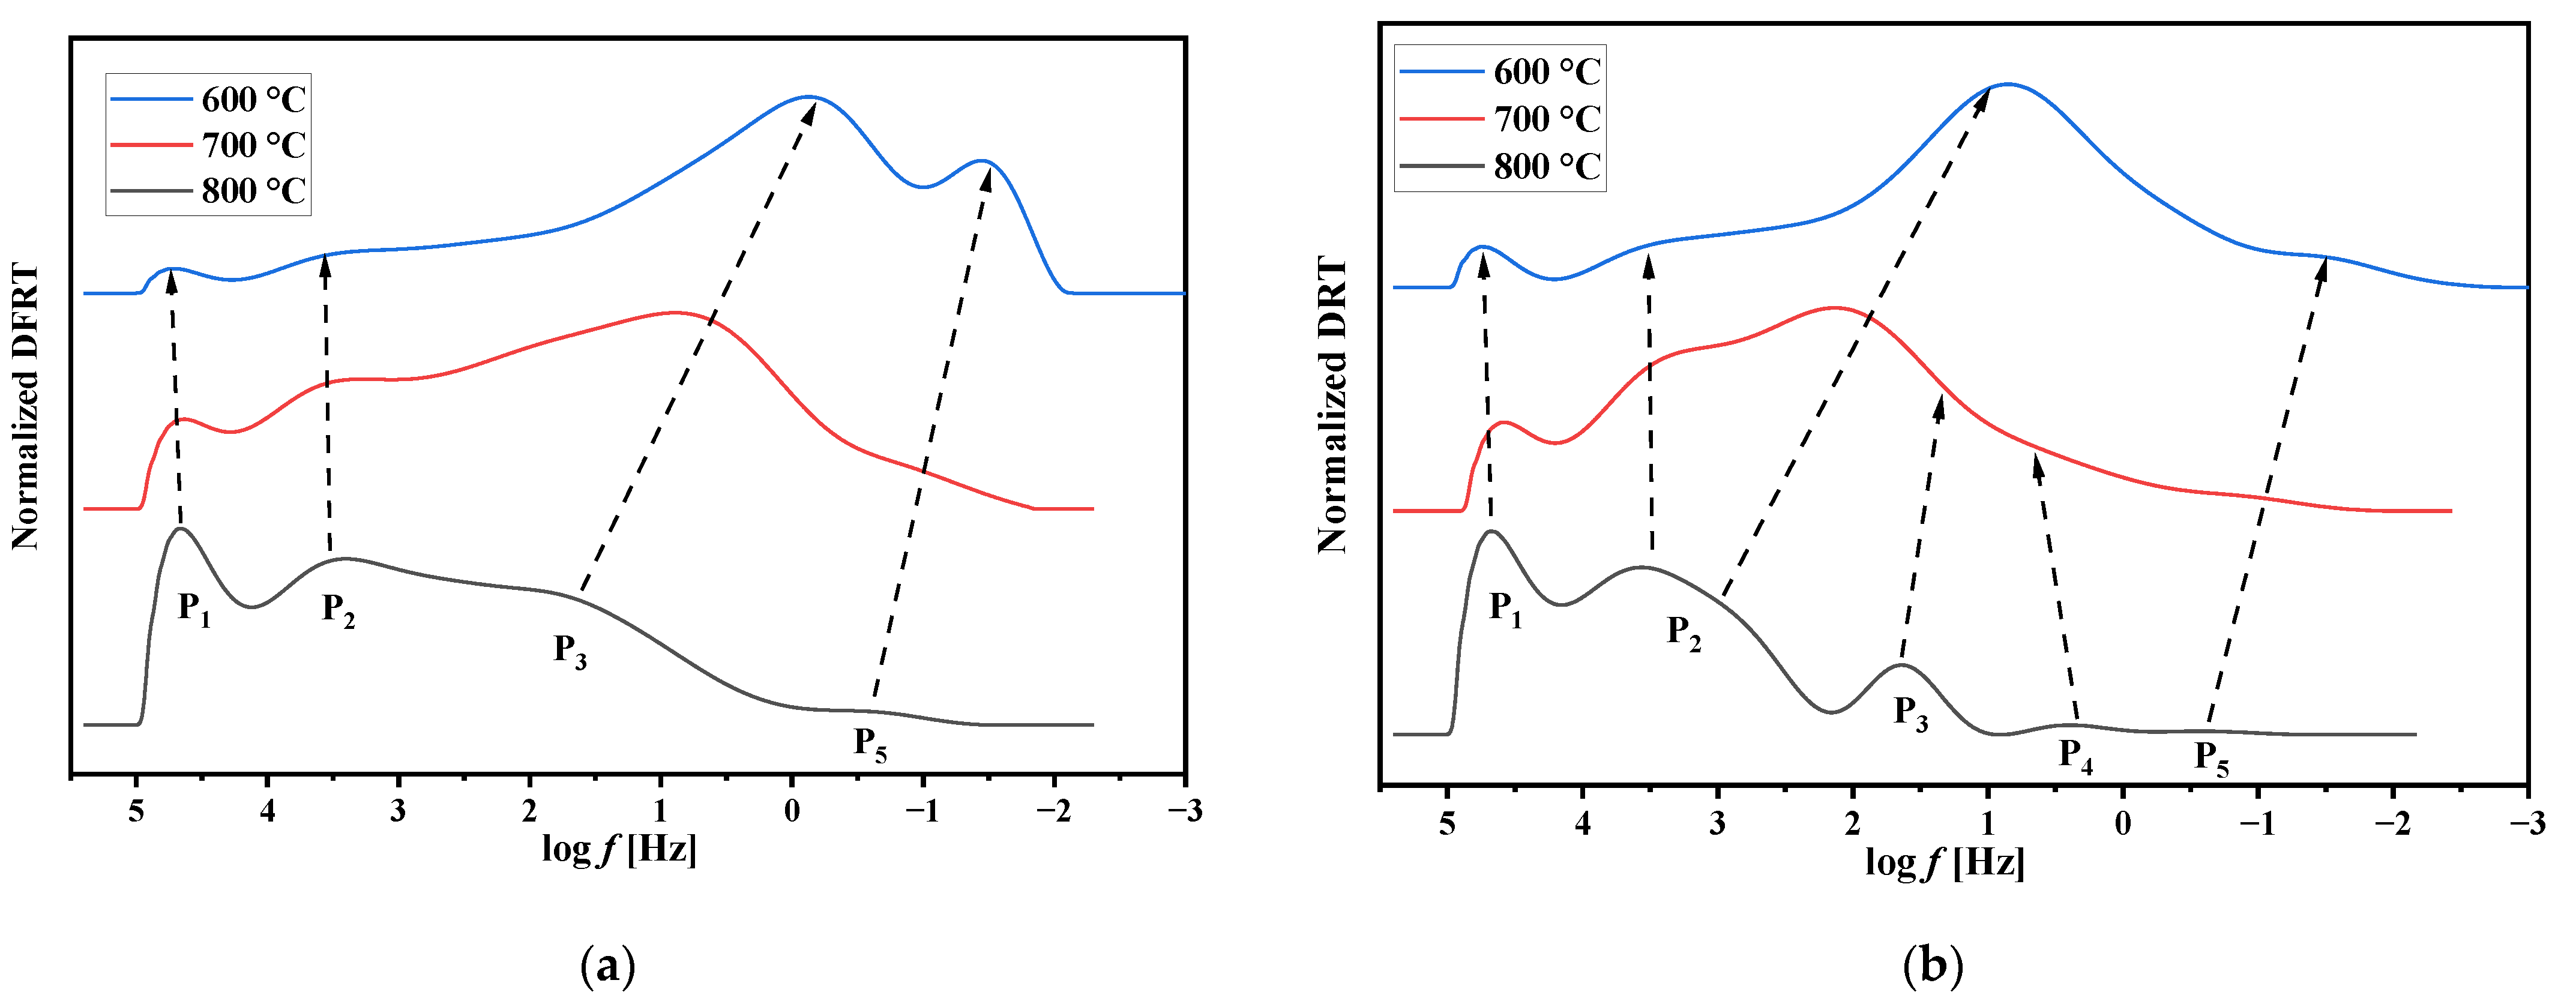
3.5. Electrochemical Performance of the Electrodes with Nd1.6Ca0.4Ni1−yCuyO4+δ Functional Layers. Factors Influencing the Electrode Performance

Impedance data for the Nd1.6Ca0.4Ni1−yCuyO4+δ/SDC symmetrical cells with functional layers sintered at 1000 °C, collected in humidified air at 700 and 600 °C, are shown in Figure 9a,b. The complex shape of the Nyquist plots indicates the presence of several different electrode processes contributing to the overall polarization resistance (Rp).
The overall polarization resistance (Rp) of the electrochemical cell with symmetrically arranged electrodes was calculated as follows:
R p = ( R d c R h f ) S 2
where S is the surface area of the electrode, Rdc is the dc resistance of the electrochemical cell, and Rhf is the ohmic resistance determined by extrapolation of the high-frequency part of an impedance spectrum to the intersection with the x-axis and related to the electrolyte resistance, contact electrolyte-electrode resistance, and a part of the lateral resistance of the electrode.
It is seen that trends in changing the total electrode response are different at different temperatures; however, the electrode with the copper content equal to x = 0.2 shows the lowest polarization resistance equal to 1.28, 2.01, 3.59, and 5.70 Ω cm2 at 850, 800, 750, and 700 °C compared to the NCNCO pristine electrode equal to 2.48, 3.94, 7.45, and 12.28 Ω cm2 at 850, 800, 750, and 700 °C, respectively. To better illustrate this fact, the Arrhenius dependencies of the polarization conductivity, calculated as 1/Rp, are presented in the supplementary materials in Figure S20. It is seen that the activation energy of the total polarization conductivity exhibits the minimum at the same concentration of copper (y = 0.2, Ea = 1.04 eV).
It is worth noting that the Ea values for the doped samples, except for NCNCO02, were higher than those for the pristine NCNCO00 electrode (Ea = 1.03 eV). It is most probably related to lowering the oxygen surface exchange and diffusion kinetics byincreasing the copper content, which correlates well with the data presented in Section 3.4. The oxygen transport characteristics are directly related to the performance of MIEC electrodes and have a significant influence on the ORR rate, especially at low temperatures [84,85]. The superior performance of the NCNCO02 electrode in this series can explain its better electrical characteristics (Section 3.3 and [49]) compared to NCNCO00. Indeed, the application of the highly conducting LNF + 3 wt.% CuO current collector lowered the difference between the NCNCO00–NCNCO02 electrodes, as can be seen from the concentration dependencies of the total Rp at 700 °C, presented in Figure S21. For instance, Rp of the NCNCO02 electrode with the collector layer was 0.42, 0.078, 1.89, and 3.37 Ω cm2 at 850, 800, 750, and 700 °C compared to the NCNCO electrode amounting 0.47, 0.87, 2.35, and 4.26 Ω cm2 at 850, 800, 750, and 700 °C, respectively. Another probable reason for the superior NCNCO02 performance is its better adhesion to the electrolyte substrate compared to the pristine electrode due to enhancing the sintering properties of the electrodes with increased copper content. For instance, despite of closeness of the SBET values (2.62 (3) and 2.43 (7) m2 g−1), analysis of the microstructure of the NCNCO01 and NCNCO02 functional layers sintered at 1000 °C demonstrated an increase in the average particle size from 1.5 (1) to 2.3 (1) µm. SEM images and particle size data are presented in the supplementary materials in Figure S22.
Analysis of the Distribution Functions of Relaxation Times (DFRTs) [86] was applied as a powerful method to identify the electrode processes on the spectra. The impedance Z(ω) is related to the DFRTs γ(τ), according to Equation (5). Calculations were performed on the spectra obtained at different temperatures for the Nd1.6Ca0.4Ni1−yCuyO4+δ/SDC symmetrical cells, with functional layers sintered at 1000 °C (Figure 9) using Tikhonov regularisation and a Gaussian-type function in pyDRTtools [87]. A regularization parameter (RP) was chosen according to a Bayesian approach described elsewhere [88]. The obtained DFRTs for the NCNCO electrodes with different copper content are shown in Figure 10a,b (NCNCO00 and NCNCO02) and in the supplementary materials in Figure S23a–c (NCNCO01, NCNCO03, and NCNCO04). The curves demonstrate the presence of at least five contributions to the polarization resistance of the Nd1.6Ca0.4Ni1−yCuyO4+δ/SDC cells. The narrows on the figures show the process evolution upon cooling.
Z ( ω ) = R h f + 0 + γ ( τ ) 1 + j ω τ d τ
where Rhf corresponds to the ohmic resistance (electrolyte), the integral is the polarization resistance, and γ(τ) is the DRT function.
One can observe two relatively small peaks in the high (P1) frequency range and three significantly larger overlapping peaks in the middle frequency (P2) and low-frequency range (P3, P4, and P5). The P1 process with a capacitance of ~10−6 F cm−2, at a frequency of ~50 kHz, is most likely related to the interfacial charge transfer between the electrode and electrolyte, while middle-frequency process P2 (C~10−5 F cm−2, f~2–3 kHz) may be related to the charge transfer in the MIEC electrode volume [48,89,90,91]. The P3 (C~10−4–10−2 F cm−2, f~100 Hz) and P4 (C~10−3–10−1 F cm−2, f~10 Hz) processes are usually described as being related to the oxygen solid-state diffusion and surface oxygen exchange in the electrode material, respectively [89,91].The last low-frequency process, P5, with C~1–10 F cm−2 and f~0.1 Hz, is usually related to the oxygen gas-phase diffusion in the electrode pores and also to the limitations of oxygen exchange at the electrode/gas-phase interface [48,92]. Comparing the DFRTs for the series for the electrodes sintered at 1000 °C, one can see that this process gives the lowest contribution to the electrode with the optimized microstructure (y = 0.2). The growing contribution of the diffusion processes (P3–P5) to the overall polarization resistance correlates well with the oxygen mobility data (Section 3.4). The introduction of the collector layer significantly reduces the total polarization resistance (Figure 11a).The collector layer has a positive effect on all electrochemical processes (Figure 11b), reducing the resistance of interfacial exchangeapproximately three times, which is possibly due to a more uniform current distribution over the electrode surface. Gas diffusion limitations due to the presence of the collector layer can contribute only at low temperatures (600 °C); at higher temperatures, the P5 process contribution is negligible (Figure S24).
Finally, the electrochemical testing of the electrode with the optimal copper content (y = 0.2) was performed in the cells with the proton-conducting electrolytes. The use of the LNF collector layer led to the delaminating of the electrode, caused by a significant difference in TEC values of the LNF electrode material and BaCeO3 or BaCe(Zr)O3-based electrolytes (14 and 8–10 × 10−6 K−1, respectively). Thus, we increased the sintering temperature up to 1100 °C and applied collector layers based on LSM possessing TEC values of 11.4 × 10⁻⁶ K−1) and obtained the electrodes with excellent adhesion properties and superior electrode performance (Figure 12).
The values of the polarization resistance were in a range of 0.34–0.69 Ω cm2 at 850 °C and 2.73–4.79 Ω cm2 at 700 °C, with the Ea values in a range of 1.17–1.42 eV. The presence of partial electronic conductivity in the proton-conducting electrolytes in humidified air [21,22] may facilitate the charge transport across the electrode/electrolyte interface, and this decreased both the polarization resistance and the activation energy of the polarization conductivity of the electrodes in contact with them. Additionally, chemical compatibility tests were performed, which demonstrated that there was no chemical interaction of the NCNCO02 electrode materials with all considered electrolytes up to 1100 °C, except for BCSCuO. To prevent interaction, for this electrolyte material, the sintering temperature of the electrode layer should be decreased below this temperature level. The results ofthe chemical interaction are presented in Table S3.
The results on the electrode polarization resistance in contact with protonic conductors are close to those presented recently for substituted Nd2NiO4+δ electrodes in protonic ceramic electrochemical cells(Table S4; [37,41,92,93,94,95,96,97,98,99]). However, there is room for further enhancement of electrode performance, especially in contact with the SDC electrolyte. It can be implemented by varying the dispersity of electrode powders, sintering conditions, and the thicknesses of the electrode layers, as well as by using different techniques proposed in our recent studies [51,52,100].

4. Conclusions

In this study, the crystal structure and its high-temperature behavior in atmospheres with different oxygen partial pressures, oxygen transport features, and electrochemical properties of the electrode materials of the Nd1.6Ca0.4Ni1−yCuyO4+δ series (y = 0–0.4) were investigated for the first time. Materials of the series were single-phase and characterized by a structure with a Bmab space group below 350 °C and with anI4/mmm sp.gr. above 500 °C. This phase transition was reversible and could be associated with the release of the structure strain at high temperatures. A transition in the volume thermal expansion coefficient values from 7.8–9.3 to 9.1–12.0 × 10⁻⁶ K−1 was observed at ~400 °C in air and 500 °C in helium.The oxygen self-diffusion coefficient values monotonically decreased with the Cu content increase, which is related to a reduction in the highlymobile interstitial oxygen content. Nevertheless, the average oxygen self-diffusion coefficient values remained high for all Nd1.6Ca0.4Ni1−yCuyO4+δ (y = 0–0.4) samples (~10−9–10−8cm2 s−1 at 800 °C). The Nd1.6Ca0.4Ni0.8Cu0.2O4+δ electrode material, possessing the highest electrical conductivity in the series, showed the lowest polarization resistance in the symmetrical cells based on Ce0.8Sm0.2O1.9 oxygen-ion-conducting electrolyte. It was demonstrated that the application of the oxide collector layer of LNF + 3 wt.% CuO reduced the polarization resistance of the electrode from 1.28 to 0.42 Ω cm2 (at 850 °C). Using the Nd1.6Ca0.4Ni0.8Cu0.2O4+δ electrode in contact with the proton-conducting electrolytes requires the application of acollector with a lower TEC value, namely, LSM + 2% CuO. In contact with different protonics, the electrode showed polarization resistance in a range of 0.34–0.69 Ω cm2 at 850 °C and 2.73–4.79 Ω cm2 at 700 °C.The data obtained in the study is a solid base for further development of Cu-substituted Nd1.6Ca0.4NiO4+δ electrode materials and their feasible application in intermediate temperature electrochemical devices.

Supplementary Materials

The following supporting information can be downloaded at: https://www.mdpi.com/article/10.3390/app12083747/s1, Table S1:Characteristics of the as-prepared electrode materials of the Nd1.6Ca0.4Ni1−yCuyO4+δ series (y = 0.0–0.4) (denoted as NCNCO0–NCNCO04) and materials of the electrode collector layers: structure and unit cell parameters, specific surface area of the powders used for the electrode preparation (SBET); Table S2: Characteristics of the electrolyte materials: structure and unit cell parameters; Table S3: Chemical compatibility of the Nd1.6Ca0.4Ni0.8Cu0.2O4+δ with different solid-state electrolytes;Figure S1: TOF NPD Rietveld refinement results for the NCNCO01 sample before the temperature treatment in air; Figure S2: TOF NPD Rietveld refinement results for the NCNCO01 sample after the temperature treatment in air; Figure S3: TOF NPD Rietveld refinement results for the NCNCO01 sample before the temperature treatment in a vacuum; Figure S4: TOF NPD Rietveld refinement results for the NCNCO01 sample after the temperature treatment in a vacuum; Figure S5: TOF NPD Rietveld refinement results for the NCNCO03 sample before the temperature treatment in air; Figure S6: TOF NPD Rietveld refinement results for the NCNCO03 sample after the temperature treatment in air; Figure S7: TOF NPD Rietveld refinement results for the NCNCO03 sample before the temperature treatment in a vacuum; Figure S8: TOF NPD Rietveld refinement results for the NCNCO03 sample after the temperature treatment in a vacuum; Figure S9: Visualization of the structure (software package VESTA [70]) with structural parameters presented in Table 2 and Table 3. The NCNCO03 sample after synthesis—(a); the NCNCO03 sample after high-temperature treatment in static air—(b); the NCNCO04 sample after high-temperature treatment in static air—(c). In the picture, the oxygen atoms are presented in red color, Ni/Cu in green (with orange part), and Nd/Ca in white (with blue part). Partial coloring of the atom represents occupancies of the site; Figure S10: TOF NPD Rietveld refinement results for the NCNCO04 sample before the temperature treatment in air; Figure S11: TOF NPD Rietveld refinement results for the NCNCO04 sample after the temperature treatment in air; Figure S12: Changes in the a and b lattice parameters upon cooling in the air flow (a); the unit cell volume and the c parameter change (b) for the NCNCO0 sample; Figure S13: Changes in the a and b lattice parameters upon heating/cooling in the He flow (a); the unit cell volume and the c parameter change (b) for the NCNCO0 sample; Figure S14: Changes in the a and b lattice parameters upon cooling in the air flow (a); the unit cell volume and the c parameter change (b) for the NCNCO01 sample; Figure S15: Changes in the a and b lattice parameters upon heating/cooling in the He flow (a); the unit cell volume and the c parameter change (b) for the NCNCO01 sample; Figure S16: Changes in the a and b lattice parameters upon heating/cooling in the air flow (a); the unit cell volume and the c parameter change (b) for the NCNCO03 sample; Figure S17: Changes in the a and b lattice parameters upon heating/cooling in the He flow (a); the unit cell volume and the c parameter change (b) for the NCNCO03 sample; Figure S18: Changes in the a and b lattice parameters upon heating/cooling in the air flow (a); the unit cell volume and the c parameter change (b) for the NCNCO04 sample; Figure S19: Changes in the a and b lattice parameters upon heating/cooling in the He flow (a); the unit cell volume and the c parameter change (b) for the NCNCO04 sample; Figure S20: Temperature dependencies of the polarization conductivity obtained by the impedance spectroscopy method for the Nd1.6Ca0.4Ni1−yCuyO4+δ/SDC symmetrical cells with functional layers sintered at 1000 °C; Figure S21: Concentration dependencies of polarization resistance for the NCNCO electrodes without and with LNF + 3 wt.% CuO collector. The sintering temperatures of the functional layers are shown in the legend (900 or 1000 °C), the sintering temperature of the collector layers—900 °C; Figure S22: SEM images and calculation of the average particle sizes for NCNCO01 and NCNCO02-based electrodes with the LNF + 3 wt.% CuO collector layer. The sintering temperature of the functional layers is 1000 °C; the sintering temperature of the collector layers is 900 °C; Figure S23: DFRTs obtained from the EIS data (at 600–800 °C) for the symmetrical cells with the functional layers sintered at 1000 °C: NCNCO01 (a); NCNCO03 (b); NCNCO04 (c); Figure S24: Temperature evolution of the DFRTs obtained from the EIS data (at 600–800 °C) for the symmetrical cells with the functional layers sintered at 1000 °C and LNF-based collector, sintered at 900 °C: NCNCO00 (a); NCNCO02 (b); Table S4: Polarization resistance of Nd2NiO4+δ-based electrodes

Author Contributions

Conceptualization, D.M., A.S. and E.P.; Formal analysis, E.S., A.F. and A.K.; Investigation, T.M., D.M., N.E., I.B., A.F., N.P. and E.P.; Methodology, D.M. and E.S.; Resources, T.M. and E.P.; Supervision, A.S., V.S. and E.P.; Validation, A.S.; Visualization, E.F., D.M., A.F., N.P. and A.K.; Writing—original draft, T.M., E.F., D.M., N.E. and I.B.; Writing—review and editing, D.M., A.S., V.S. and E.P. All authors have read and agreed to the published version of the manuscript.

Funding

This research received no external funding.

Institutional Review Board Statement

Not applicable.

Informed Consent Statement

Not applicable.

Data Availability Statement

Not applicable.

Acknowledgments

Material synthesis, sample preparation, and electrochemical studies were performed in the framework of budget tasks for the Institute of High Temperature Electrochemistry, UB RAS, project №122020100324-3. The standard characterization of powder and ceramic materials was carried out at the Shared Access Centre “Composition of Compounds” of the Institute of High Temperature Electrochemistry, UB RAS. The synchrotron XRD experiments were performed at the shared research center SSTRC on the basis of the Novosibirsk VEPP-3 complex at BINP SB RAS. The in situ XRD study was carried out using the facilities of the shared research center “National Center of Investigation of Catalysts” at the Boreskov Institute of Catalysis (BIC). The part of the reported study concerning the crystal structure of the samples was funded within the framework of budget project for Synchrotron radiation facility SKIF, Boreskov Institute of Catalysis.BIC support of the isotope exchange study by the Ministry of Science and Higher Education of the Russian Federation projects AAAA-A21-121011390009-1 and AAAA -A21-121011390007-7 is greatly acknowledged. XPS study of the electrode materials was partly performed in the framework of the budget task for the Institute of Metallurgy, UB RAS, project № 122013100200-2 using the equipment of the Shared Access Centre “Ural-M” of the Institute of Metallurgy, UB RAS.

Conflicts of Interest

The authors declare no conflict of interest.

References

  1. Gunnarsdottir, I.; Davidsdottir, B.; Worrell, E.; Sigurgeirsdottir, S. Sustainable energy development: History of the concept and emerging themes. Renew. Sustain. Energy Rev. 2021, 141, 110770. [Google Scholar] [CrossRef]
  2. Strielkowski, W.; Civín, L.; Tarkhanova, E.; Tvaronavičienė, M.; Petrenko, Y. Renewable energy in the sustainable development of electrical power sector: A review. Energies 2021, 14, 8240. [Google Scholar] [CrossRef]
  3. Falcone, P.M.; Hiete, M.; Sapio, A. Hydrogen economy and sustainable development goals: Review and policy insight. Curr. Opin. Green Sustain. Chem. 2021, 31, 100506. [Google Scholar] [CrossRef]
  4. Shahabuddin, M.; Alim, M.A.; Alam, T.; Mofijur, M.; Ahmed, S.F.; Perkins, G. A critical review on the development and challenges of concentrated solar power technologies. Sustain. Energy Technol. Assess. 2021, 47, 101434. [Google Scholar] [CrossRef]
  5. Al-Qadami, E.H.H.; Mustaffa, Z.; Al-Atroush, M.E. Evaluation of the pavement geothermal energy harvesting technologies towards sustainability and renewable energy. Energies 2022, 15, 1201. [Google Scholar] [CrossRef]
  6. Chaudhuri, A.; Datta, R.; Kumar, M.P.; Davim, J.P.; Pramanik, S. Energy conversion strategies for wind energy system: Electrical, mechanical and material aspects. Materials 2022, 15, 1232. [Google Scholar] [CrossRef]
  7. Grande, L.; Pedroarena, I.; Korili, S.A.; Gil, A. Hydrothermal liquefaction of biomass as one of the most promising alternatives for the synthesis of advanced liquid biofuels: A review. Materials 2021, 14, 5286. [Google Scholar] [CrossRef] [PubMed]
  8. Azimov, U.; Okoro, V.; Hernandez, H.H. Recent progress and trends in the development of microbial biofuels from solid waste—A review. Energies 2021, 14, 6011. [Google Scholar] [CrossRef]
  9. Sasaki, T.; Harada, N.; Kikuchi, T.; Takahashi, K. Review of energy conversion technology using magnetohydrodynamics. IEEJ Trans. Power Energy 2016, 136, 769–772. [Google Scholar] [CrossRef]
  10. Mamur, H.; Üstüner, M.A.; Bhuiyan, M.R.A. Future perspective and current situation of maximum power point tracking methods in thermoelectric generators. Sustain. Energy Technol. Assess. 2022, 50, 101824. [Google Scholar] [CrossRef]
  11. Cigolotti, V.; Genovese, M.; Fragiacomo, P. Comprehensive review on fuel cell technology for stationary applications as sustainable and efficient poly-generation energy systems. Energies 2021, 14, 4963. [Google Scholar] [CrossRef]
  12. Sazali, N.; Salleh, W.N.W.; Jamaludin, A.S.; Razali, M.N.M. New perspectives on fuel cell technology: A brief review. Membranes 2020, 10, 99. [Google Scholar] [CrossRef] [PubMed]
  13. Singh, M.; Zappa, D.; Comini, E. Solid oxide fuel cell: Decade of progress, future perspectives and challenges. Int. J. Hydrogen Energy 2021, 46, 27643–27674. [Google Scholar] [CrossRef]
  14. Brett, D.J.L.; Atkinson, A.; Brandon, N.P.; Skinner, S.J. Intermediate temperature solid oxide fuel cells. Chem. Soc. Rev. 2008, 37, 1568–1578. [Google Scholar] [CrossRef]
  15. Morozan, A.; Jousselme, B.; Palacin, S. Low-platinum and platinum-free catalysts for the oxygen reduction reaction at fuel cell cathodes. Energy Environ. Sci. 2011, 4, 1238–1254. [Google Scholar] [CrossRef]
  16. Xu, Q.; Guo, Z.; Xia, L.; He, Q.; Li, Z.; Bello, I.T.; Zheng, K.; Ni, M. A comprehensive review of solid oxide fuel cells operating on various promising alternative fuels. Energy Convers. Manag. 2022, 253, 115175. [Google Scholar] [CrossRef]
  17. Zhang, L.; Chen, G.; Dai, R.; Lv, X.; Yang, D.; Geng, S. A review of the chemical compatibility between oxide electrodes and electrolytes in solid oxide fuel cells. J. Power Sources 2021, 492, 229630. [Google Scholar] [CrossRef]
  18. Irshad, M.; Siraj, K.; Raza, R.; Ali, A.; Tiwari, P.; Zhu, B.; Rafique, A.; Ali, A.; Kaleem Ullah, M.; Usman, A. A brief description of high temperature solid oxide fuel cell’s operation, materials, design, fabrication technologies and performance. Appl. Sci. 2016, 6, 75. [Google Scholar] [CrossRef] [Green Version]
  19. Wang, F.; Lyu, Y.; Chu, D.; Jin, Z.; Zhang, G.; Wang, D. The electrolyte materials for SOFCs of low-intermediate temperature: Review. Mater. Sci. Technol. 2019, 35, 1551–1562. [Google Scholar] [CrossRef]
  20. Pikalova, E.Y.; Kalinina, E.G. Solid oxide fuel cells based on ceramic membranes with mixed conductivity: Improving efficiency. Russ. Chem. Rev. 2021, 90, 703–749. [Google Scholar] [CrossRef]
  21. Shao, Z.; Zhou, W.; Zhu, Z. Advanced synthesis of materials for intermediate-temperature solid oxide fuel cells. Prog. Mater. Sci. 2012, 57, 804–874. [Google Scholar] [CrossRef]
  22. Medvedev, D.A. Current drawbacks of proton-conducting ceramic materials: How to overcome them for real electrochemical purposes. Curr. Opin. Green Sustain. Chem. 2021, 32, 100549. [Google Scholar] [CrossRef]
  23. Zvonareva, I.; Fu, X.-Z.; Medvedev, D.; Shao, Z. Electrochemistry and energy conversion features of protonic ceramic cells with mixed ionic-electronic electrolytes. Energy Environ. Sci. 2022, 15, 439–465. [Google Scholar] [CrossRef]
  24. Qiu, P.; Yang, X.; Zhu, T.; Sun, S.; Jia, L.; Li, J. Review on core-shell structured cathode for intermediate temperature solid oxide fuel cells. Int. J. Hydrogen Energy 2020, 45, 23160–231723. [Google Scholar] [CrossRef]
  25. Mather, G.C.; Muñoz-Gil, D.; Zamudio-García, J.; Porras-Vázquez, J.M.; Marrero-López, D.; Pérez-Coll, D. Perspectives on cathodes for protonic ceramic fuel cells. Appl. Sci. 2021, 11, 5363. [Google Scholar] [CrossRef]
  26. Kasyanova, A.V.; Tarutina, L.R.; Rudenko, A.O.; Lyagaeva, J.G.; Medvedev, D.A. Ba(Ce,Zr)O3-based electrodes for protonic ceramic electrochemical cells: Towards highly compatible functionality and triple-conducting behavior. Russ. Chem. Rev. 2020, 89, 667–692. [Google Scholar] [CrossRef]
  27. Ding, P.; Li, W.; Zhao, H.; Wu, C.; Zhao, L.; Dong, B.; Wang, S. Review on Ruddlesden-Popper perovskites as cathode for solid oxide fuel cells. J. Phys. Mater. 2021, 4, 022002. [Google Scholar] [CrossRef]
  28. Tarutin, A.P.; Lyagaeva, J.G.; Medvedev, D.A.; Bi, L.; Yaremchenko, A.A. Recent advances in layered Ln2NiO4+δ nickelates: Fundamentals and prospects of their applications in protonic ceramic fuel and electrolysis cells. J. Mater. Chem. 2020, 9, 154–195. [Google Scholar] [CrossRef]
  29. Flura, A.; Dru, S.; Nicollet, C.; Vibhu, V.; Fourcade, S.; Lebraud, E.; Grenier, J.C. Chemical and structural changes in Ln2NiO4+δ (Ln = La, Pr or Nd) lanthanide nickelates as a function of oxygen partial pressure at high temperature. J. Solid State Chem. 2015, 228, 189–198. [Google Scholar] [CrossRef]
  30. Philippeau, B.; Mauvy, F.; Mazataud, C.; Fourcade, S.; Grenier, J.C. Comparative study of electrochemical properties of mixed conducting Ln2NiO4+δ (Ln = La, Pr and Nd) and La0.6Sr0.4Fe0.8Co0.2O3−δ as SOFC cathodes associated to CeGdO2−δ, La0.8Sr0.2Ga0.8Mg0.2O3−δ and La9Sr1Si6O26.5 electrolytes. Solid State Ion. 2012, 249–250, 17–25. [Google Scholar] [CrossRef]
  31. Pikalova, E.Y.; Kolchugin, A.A.; Sadykov, V.A.; Sadovskaya, E.M.; Filonova, E.A.; Eremeev, N.F.; Bogdanovich, N.M. Structure, transport properties and electrochemical behavior of the layered lanthanide nickelates doped with calcium. Int. J. Hydrog. Energy 2018, 43, 17373–17386. [Google Scholar] [CrossRef]
  32. Sadykov, V.A.; Pikalova, E.Y.; Kolchugin, A.A.; Fetisov, A.V.; Sadovskaya, E.M.; Filonova, E.A.; Eremeev, N.F.; Goncharov, V.B.; Krasnov, A.V.; Skriabin, P.I.; et al. Transport properties of Ca-doped Ln2NiO4 for intermediate temperature solid oxide fuel cells cathodes and catalytic membranes for hydrogen production. Int. J. Hydrog. Energy 2020, 45, 13625–13642. [Google Scholar] [CrossRef]
  33. Pikalova, E.; Sadykov, V.; Sadovskaya, E.; Eremeev, N.; Kolchugin, A.; Shmakov, A.; Vinokurov, Z.; Mishchenko, D.; Filonova, E.; Belyaev, V. Correlation between structural and transport properties of Ca-doped La nickelates and their electrochemical performance. Crystals 2021, 11, 297. [Google Scholar] [CrossRef]
  34. Takeda, Y.; Nishijima, M.; Imanishi, N.; Kanno, R. Crystal chemistry and transport properties of Nd2−xAxNiO4 (A = Ca, Sr, Ba, 0 < x < 1.4). J. Solid State Chem. 1991, 96, 72–93. [Google Scholar] [CrossRef]
  35. Boehm, E.; Bassat, J.M.; Dordor, P.; Mauvy, F.; Grenier, J.C.; Stevens, P. Oxygen diffusion and transport properties in non-stoichiometric Ln2−xNiO4+δ oxides. Solid State Ion. 2005, 176, 2717–2725. [Google Scholar] [CrossRef]
  36. Pikalova, E.; Kolchugin, A.; Filonova, E.; Bogdanovich, N.; Pikalov, S.; Ananyev, M.; Molchanova, N.; Farlenkov, A. Validation of calcium-doped neodymium nickelates as SOFC air electrode materials. Solid State Ion. 2018, 319, 130–140. [Google Scholar] [CrossRef]
  37. Pikalova, E.Y.; Sadykov, V.A.; Filonova, E.A.; Eremeev, N.F.; Sadovskaya, E.M.; Kolchugin, A.A.; Lyagaeva, J.G.; Vedmid, L.B.; Ishchenko, A.V.; Goncharov, V.B. Structure, oxygen transport properties and electrode performance of Ca-substituted Nd2NiO4. Solid State Ion. 2019, 335, 53–60. [Google Scholar] [CrossRef]
  38. Boehm, E.; Bassat, J.M.; Steil, M.C.; Dordor, P.; Mauvy, F.; Grenier, J.C. Oxygen transport properties of La2Ni1−xCuxO4+δ mixed conducting oxides. Solid State Sci. 2003, 5, 973–981. [Google Scholar] [CrossRef]
  39. Aguadero, A.; Alonso, J.A.; Escudero, M.J.; Daza, L. Evaluation of the La2Ni1−xCuxO4+δ system as SOFC cathode material with 8YSZ and LSGM as electrolytes. Solid State Ionics. 2008, 179, 393–400. [Google Scholar] [CrossRef]
  40. Tarutin, A.P.; Lyagaeva, J.G.; Farlenkov, A.S.; Vylkov, A.I.; Medvedev, D.M. Cu-substituted La2NiO4+δ as oxygen electrodes for protonic ceramic electrochemical cells. Ceram. Intern. 2019, 45, 16105–16112. [Google Scholar] [CrossRef]
  41. Lee, K.J.; Choe, Y.; Hwang, H. Properties of copper doped neodymium nickelate oxide as cathode material for solid oxide fuel cells. J. Arch. Metall. Mater. 2016, 61, 625–628. [Google Scholar] [CrossRef] [Green Version]
  42. Wang, C.; Soga, H.; Okiba, T.; Niwa, E.; Hashimoto, T. Construction of structural phase diagram of Nd2Ni1−xCuxO4+δ and effect of crystal structure and phase transition on electrical conduction behaviour. Mat. Res. Bull. 2019, 111, 61–69. [Google Scholar] [CrossRef]
  43. Sakai, M.; Wang, C.; Okiba, T.; Soga, H.; Niwa, E.; Hashimoto, T. Thermal analysis of structural phase transition behavior of Ln2Ni1−xCuxO4+δ (Ln = Nd, Pr) under various oxygen partial pressures. J. Therm. Anal. Calor. 2019, 135, 2765–2774. [Google Scholar] [CrossRef]
  44. Shen, Y.; Zhao, H.; Swierczek, K.; Du, Z.; Xie, Z. Lattice structure, sintering behavior and electrochemical performance La1.7Ca0.3Ni1−xCuxO4+δ as cathode material for intermediate temperature solid oxide fuel cell. J. Power Sources. 2013, 240, 759–765. [Google Scholar] [CrossRef]
  45. Huang, X.; Shin, T.X.; Zhou, J.; Irvine, J.T.S. Hierarchically nanoporous La1.7Ca0.3CuO4−δ and La1.7Ca0.3NixCu1−xO4−δ (0.25 ≤ x ≤ 0.75) as potential cathode materials for IT-SOFCs. J. Mater. Chem. 2015, 25, 13468–13475. [Google Scholar] [CrossRef] [Green Version]
  46. Myung, J.; Huang, X.; Savaniu, C.; Irvine, J. La1.7Ca0.3Ni0.75Cu0.25O4+δ layered perovskite as cathode on La0.9Sr0.1Ga0.8Mg0.2O3 or Ce0.8Gd0.2O2 electrolyte for intermediate temperature solid oxide fuel cells. Int. J. Appl. Ceram. Technol. 2016, 712, 269–273. [Google Scholar] [CrossRef]
  47. Gilev, A.R.; Kiselev, E.A.; Zakharov, D.M.; Cherepanov, V.A. Effect of calcium and copper/iron co–doping on defect–induced properties of La2NiO4-based materials. J. Alloys Compd. 2018, 27, 491–501. [Google Scholar] [CrossRef]
  48. Pikalova, E.; Kolchugin, A.; Gilev, A.; Medvedev, D.; Pikalova, N.; Guseva, E.; Pikalov, S.; Maignan, A.; Filonova, E. Physico-chemical properties and electrochemical performance of La1.7Ca0.3Ni1−xCuxO4+δ as cathodes for intermediate temperature solid oxide fuel cells. In Proceedings of the International Conference Hypothesis XVI, Muscat, Oman, 15–17 February 2021; p. 66. [Google Scholar]
  49. Filonova, E.A.; Pikalova, E.Y.; Maksimchuk, T.Y.; Vylkov, A.I.; Pikalov, S.M.; Maignan, A. Crystal structure and functional properties of Nd1.6Ca0.4Ni1−yCuyO4+δ as prospective cathode materials for intermediate temperature solid oxide fuel cells. Int. J. Hydrog. Energy 2021, 46, 17037–17050. [Google Scholar] [CrossRef]
  50. FullProf Suite. Crystallographic Tools for Rietveld, Profile Matching and Integrated-Intensity Refinements of X-ray and/or Neutron Data. Available online: https://www.ill.eu/sites/fullprof/ (accessed on 11 March 2022).
  51. Pikalova, E.; Bogdanovich, N.; Kolchugin, A.; Brouzgou, A.; Bronin, D.; Plaksin, S.V.; Khasanov, A.S.; Tsiakaras, P. Effect of nature of the ceramic component of the composite electrodes based on La1.7Ca(Sr)0.3NiO4+δ on their electrochemical performance. ECS Trans. 2015, 68, 809–815. [Google Scholar] [CrossRef]
  52. Pikalova, E.; Bogdanovich, N.; Kolchugin, A.; Ermakova, L.; Farlenkov, A.; Bronin, D. Methods to increase electrochemical activity of lanthanum nickelate-ferrite electrodes for intermediate and low temperature SOFCs. Int. J. Hydrog. Energy 2021, 46, 35923–35937. [Google Scholar] [CrossRef]
  53. Pikalova, E.Y.; Kolchugin, A.A.; Bamburov, V.G. Ceria-based materials for high-temperature electrochemistry applications. Int. J. Energy Prod. Mgmt. 2016, 1, 272–283. [Google Scholar] [CrossRef] [Green Version]
  54. Kalinina, E.; Shubin, K.; Pikalova, E. Electrophoretic deposition and characterization of the doped BaCeO3 barrier layers on a supporting Ce0.8Sm0.2O1.9 solid-state electrolyte. Membranes 2022, 12, 308. [Google Scholar] [CrossRef] [PubMed]
  55. Kalinina, E.; Pikalova, E.; Kolchugin, A.; Pikalova, N.; Farlenkov, A. Comparative study of electrophoretic deposition of doped BaCeO3-based films on La2NiO4+δ and La1.7Ba0.3NiO4+δ cathode substrates. Materials 2019, 12, 2545. [Google Scholar] [CrossRef] [PubMed] [Green Version]
  56. Filonova, E.A.; Tokareva, E.S.; Pikalova, N.S.; Vylkov, A.I.; Bogdanovich, N.M.; Pikalova, E.Y. Assessment of prospective cathodes based on (1−x)Ca3Co4O9+δ-xBaCe0.5Zr0.3Y0.1Yb0.1O3−δ composites for protonic ceramic electrochemical cells. J. Solid State Electrochem. 2020, 24, 1509–1521. [Google Scholar] [CrossRef]
  57. Balagurov, A.; Balagurov, D.; Bobrikov, I.; Bogdzel, A.; Drozdov, V.; Kirilov, A.; Kruglov, V.; Kulikov, S.; Murashkevich, S.; Prikhodko, V. High-resolution neutron Fourier diffractometer at the IBR-2 pulsed reactor: A new concept. Nucl. Instrum. Methods Phys. Res. Sect. B Beam Interact. Mater. At. 2018, 436, 263–271. [Google Scholar] [CrossRef]
  58. Balagurov, A.M.; Bobrikov, I.A.; Bokuchava, G.D.; Zhuravlev, V.V.; Simkin, V.G. Correlation Fourier diffractometry: 20 years of experience at the IBR-2 reactor. Phys. Part. Nuclei. 2015, 46, 249–276. [Google Scholar] [CrossRef]
  59. Piminov, P.A.; Baranov, G.N.; Bogomyagkov, A.V.; Berkaev, D.E.; Borin, V.M.; Dorokhov, V.L.; Karnaev, S.E.; Kiselev, V.A.; Levichev, E.B.; Meshkov, O.I.; et al. Synchrotron radiation research and application at VEPP-4. Phys. Procedia 2016, 84, 19–26. [Google Scholar] [CrossRef]
  60. Aulchenko, V.M.; Evdokov, O.V.; Kutovenko, V.D.; Pirogov, B.Y.; Sharafutdinov, M.R.; Titov, V.M.; Tolochko, B.P.; Vasiljev, A.V.; Zhogin, I.A.; Zhulanov, V.V. One-Coordinate X-ray Detector OD-3M. Nucl. Instrum. Methods Phys. Res. Sect. A Accel. Spectrometers Detect. Assoc. Equip. 2009, 603, 76–79. [Google Scholar] [CrossRef]
  61. Toby, B.H.; Von Dreele, R.B. GSAS-II: The genesis of a modern open-source all purpose crystallography software package. J. Appl. Crystallogr. 2013, 46, 544–549. [Google Scholar] [CrossRef]
  62. Sadykov, V.A.; Sadovskaya, E.M.; Eremeev, N.F.; Skriabin, P.I.; Krasnov, A.V.; Bespalko, Y.N.; Pavlova, S.N.; Fedorova, Y.E.; Pikalova, E.Y.; Shlyakhtina, A.V. Oxygen mobility in the materials for solid oxide fuel cells and catalytic membranes (Review). Russ. J. Electrochem. 2019, 55, 701–718. [Google Scholar] [CrossRef]
  63. SaezPuche, R.; Fernández, F.; Rodríguez Carvajal, J.; Martínez, J.L. Magnetic and X-ray diffraction characterization of stoichiometric Pr2NiO4 and Nd2NiO4 oxides. Solid State Comm. 1989, 72, 273–277. [Google Scholar] [CrossRef]
  64. Rodríguez-Carvajal, J.; Fernández-Díaz, M.T.; Martínez, J.L.; Fernández, F.; Saez-Puche, R. Structural phase transitions and three-dimensional magnetic ordering in the Nd2NiO4 Oxide. Europhys. Lett. 1990, 11, 261–268. [Google Scholar] [CrossRef]
  65. Nakamura, T.; Yashiro, K.; Sato, K.; Mizusaki, J. Oxygen nonstoichiometry and defect equilibrium in La2−xSrxNiO4+δ. Solid State Ion. 2009, 180, 368–376. [Google Scholar] [CrossRef]
  66. Sadykov, V.A.; Sadovskaya, E.M.; Pikalova, E.Y.; Kolchugin, A.A.; Filonova, E.A.; Pikalov, S.M.; Eremeev, N.F.; Ishchenko, A.V.; Lukashevich, A.I.; Bassat, J.M. Transport features in layered nickelates: Correlation between structure, oxygen diffusion, electrical and electrochemical Properties. Ionics 2018, 24, 1181–1193. [Google Scholar] [CrossRef]
  67. Minervini, L.; Grimes, R.W.; Kilner, J.A.; Sickafus, K.E. Oxygen migration in La2NiO4+δ. J. Mater. Chem. 2000, 10, 2349–2354. [Google Scholar] [CrossRef]
  68. Nakamura, T.; Oike, R.; Ling, Y.; Tamenori, Y.; Amezawa, K. The determining factor for interstitial oxygen formation in Ruddlesden–Popper Type La2NiO4-based oxides. Phys. Chem. Chem. Phys. 2016, 18, 1564–1569. [Google Scholar] [CrossRef] [PubMed]
  69. Nakamura, T.; Ling, Y.; Amezawa, K. The effect of interstitial oxygen formation on the crystal lattice deformation in layered perovskite oxides for electrochemical devices. J. Mater. Chem. 2015, 3, 10471–10479. [Google Scholar] [CrossRef]
  70. Momma, K.; Izumi, F. VESTA 3 for three-dimensional visualization of crystal, volumetric and morphology data. J. Appl. Crystallogr. 2011, 44, 1272–1276. [Google Scholar] [CrossRef]
  71. Shannon, R.D. Revised effective ionic radii and systematic studies of interatomic distances in halides and chalcogenides. Acta Cryst. 1976, 32, 751–767. [Google Scholar] [CrossRef]
  72. Okada, K.; Kotani, A. Large-cluster effects on core-level photoemission spectra of quasi-one-dimensional copper compounds. J. Elect. Spectrosc. Relat. Phenom. 1998, 88–91, 255–260. [Google Scholar] [CrossRef]
  73. Zeng, D.W.; Yung, K.C.; Xie, C.S. UV Nd: YAG laser ablation of copper: Chemical states in both crater and halo studied by XPS. Appl. Surf. Sci. 2003, 217, 170–180. [Google Scholar] [CrossRef]
  74. Matienzo, J.; Yin, L.I.; Grim, S.O.; Swartz, W.E., Jr. X-ray photoelectron spectroscopy of nickel compounds. Inorg. Chem. 1973, 12, 2762–2769. [Google Scholar] [CrossRef]
  75. Roberts, M.W.; Smart, R.S.C. The defect structure of nickel oxide surfaces as revealed by photoelectron spectroscopy. J. Chem. Soc. Faraday 1984, 1, 2957–2968. [Google Scholar] [CrossRef]
  76. Carley, A.F.; Jackson, S.D.; O’Shea, J.N.; Roberts, M.W. The formation and characterisation of Ni3+—An X-ray photoelectron spectroscopic investigation of potassium-doped Ni(110)–O. Surf. Sci. 1999, 440, L868–L874. [Google Scholar] [CrossRef]
  77. Payne, B.P.; Grosvenor, A.P.; Biesinger, M.C.; Kobe, B.A.; McIntyre, N.S. Structure and growth of oxides on polycrystalline nickel surfaces. Surf. Interface Anal. 2007, 39, 582–592. [Google Scholar] [CrossRef]
  78. Sadykov, V.A.; Sadovskaya, E.M.; Filonova, E.A.; Eremeev, N.F.; Belyaev, V.D.; Tsvinkinberg, V.A.; Pikalova, E.Y. Oxide ionic transport features in Gd-doped La nickelates. Solid State Ion. 2020, 357, 115462. [Google Scholar] [CrossRef]
  79. Fedorova, V.; Simonov, M.; Valeev, K.; Bespalko, Y.; Smal, E.; Eremeev, N.; Sadovskaya, E.; Krieger, T.; Ishchenko, A.; Sadykov, V. Kinetic regularities of methane dry reforming reaction on nickel-containing modified ceria–zirconia. Energies 2021, 140, 2973. [Google Scholar] [CrossRef]
  80. Miyoshi, S.; Furuno, T.; Sangoanruang, O.; Matsumoto, H.; Ishihara, T. Mixed conductivity and oxygen permeability of doped Pr2NiO4-based oxides. J. Electrochem. Soc. 2007, 154, B57. [Google Scholar] [CrossRef]
  81. Khoshkalam, M.; Tripković, Ð.; Tong, X.; Faghihi-Sani, M.A.; Chen, M.; Hendriksen, P.V. Improving oxygen incorporation rate on (La0.6Sr0.4)0.98FeO3−δ via Pr2Ni1−xCuxO surface decoration. J. Power Sources 2020, 457, 228035. [Google Scholar] [CrossRef]
  82. Yashima, M.; Yamada, H.; Nuansaeng, S.; Ishihara, T. Role of Ga3+ and Cu2+ in the High interstitial oxide-ion diffusivity of Pr2NiO4-based oxides: Design concept of interstitial ion conductors through the higher-valence d10 dopant and Jahn–Teller effect. Chem. Mater. 2012, 24, 4100–4113. [Google Scholar] [CrossRef]
  83. Yashima, M.; Sirikanda, N.; Ishihara, T. Crystal structure, diffusion path, and oxygen permeability of a Pr2NiO4-based mixed conductor (Pr0.9La0.1)2(Ni0.74Cu0.21Ga0.05)O4+δ. J. Am. Chem. Soc. 2010, 132, 2385–2392. [Google Scholar] [CrossRef] [PubMed]
  84. Adler, S.B. Limitations of charge-transfer models for mixed-conducting oxygen electrodes. Solid State Ion. 2020, 135, 603–612. [Google Scholar] [CrossRef]
  85. Gao, Z.; Mogni, L.V.; Miller, E.C.; Railsback, J.G.; Barnett, S.A. A perspective on low-temperature solid oxide fuel cells. Energy Environ. Sci. 2016, 9, 1602–1644. [Google Scholar] [CrossRef]
  86. Boukamp, B.A. Distribution (function) of relaxation times, successor to complex nonlinear least squares analysis of electrochemical impedance spectroscopy? J. Phys. Energy 2020, 2, 042001. [Google Scholar] [CrossRef]
  87. Wan, T.H.; Saccoccio, M.; Chen, C.; Ciucci, F. Influence of the discretization methods on the Distribution of Relaxation Times deconvolution: Implementing radial basis functions with DRTtools. Electrochim. Acta 2015, 184, 483–499. [Google Scholar] [CrossRef]
  88. Effat, M.B.; Ciucci, F. Bayesian and hierarchical Bayesian based Regularization for deconvolving the Distribution of Relaxation Times from electrochemical impedance spectroscopy data. Electrochim. Acta 2017, 247, 1117–1129. [Google Scholar] [CrossRef]
  89. Gilev, A.R.; Kiselev, E.A.; Cherepanov, V.A. Oxygen transport phenomena in (La,Sr)2(Ni,Fe)O4 materials. J. Mater. Chem. 2018, 6, 5304–5312. [Google Scholar] [CrossRef]
  90. Escudero, M.J.; Aguadero, A.; Alonso, J.A.; Daza, L.A. Kinetic study of oxygen reduction reaction on La2NiO4 cathodes by means of impedance spectroscopy. J. Electroanal. Chem. 2007, 611, 107–116. [Google Scholar] [CrossRef]
  91. Antonova, E.P.; Khodimchuk, A.V.; Usov, G.R.; Tropin, E.S.; Farlenkov, A.S.; Khrustov, A.V.; Ananyev, M.V. EIS analysis of electrode kinetics for La2NiO4+δ cathode in contact with Ce0.8Sm0.2O1.9 electrolyte: From DRT analysis to physical model of the electrochemical process. J. Solid State Electrochem. 2019, 23, 1279–1287. [Google Scholar] [CrossRef]
  92. Khandale, A.P.; Bansod, M.G.; Bhoga, S.S. Improved electrical and electrochemical performance of co-doped Nd1.8Sr0.2Ni1−xCuxO4+δ. Solid State Ion. 2015, 276, 127–135. [Google Scholar] [CrossRef]
  93. Shirani-Faradonbeh, H.; Paydar, M. Electrical behavior of the Ruddlesden–Popper phase (Nd0.9La0.1)2Ni0.75Cu0.25O4 (NLNC) and NLNC- x wt% Sm0.2Ce0.8O1.9 (SDC) (x = 10, 30 and 50), as intermediate-temperature solid oxide fuel cells cathode. Ceram. Intern. 2018, 44, 1971–1977. [Google Scholar] [CrossRef]
  94. Khandale, A.P.; Bhoga, S.S.; Kumar, R.V. Effect of Ni doping on structural, electrical and electrochemical properties of Nd1.8Ce0.2Cu1−xNixO4+δ mixed ionic–electronic conductor. Solid State Ion. 2013, 238, 1–6. [Google Scholar] [CrossRef]
  95. Montenegro-Hernandez, A.; Mogni, L.V.; Caneiro, A. Validation of Nd2NiO4+δ as oxygen electrode material for intermediate temperature solid oxide cells with LSGM electrolyte. ECS Trans. 2013, 58, 183–190. [Google Scholar] [CrossRef]
  96. Sun, L.-P.; Li, Q.; Zhao, H.; Huo, L.-H.; Grenier, J.-C. Preparation and electrochemical properties of Sr-doped Nd2NiO4 cathode materials for intermediate-temperature solid oxide fuel cells. J. Power Sources 2008, 183, 43–48. [Google Scholar] [CrossRef]
  97. Lee, K.J.; Chung, J.H.; Lee, M.J.; Hwang, H.J. Chromium Poisoning of Neodymium Nickelate (Nd2NiO4) Cathodes for Solid Oxide Fuel Cells. J. Korean Ceram. Soc. 2019, 56, 160–166. [Google Scholar] [CrossRef] [Green Version]
  98. Tarutin, A.P.; Gorshkov, M.Y.; Bainov, I.N.; Vdovin, G.K.; Vylkov, A.I.; Lyagaeva, J.G.; Medvedev, D.A. Barium-doped nickelates Nd2−xBaxNiO4+δ as promising electrode materials for protonic ceramic electrochemical cells. Ceram. Int. 2020, 46, 24355–24364. [Google Scholar] [CrossRef]
  99. Grenier, J.C.; Mauvy, F.; Lalanne, C.; Bassat, J.-M.; Chauveau, F.; Mougin, J.; Dailly, J.; Marrony, M. A2MO4+δ oxides: Flexible materials for solid oxide cells. ECS Trans. 2009, 25, 2537–2546. [Google Scholar] [CrossRef]
  100. Antonova, E.P.; Kolchugin, A.A.; Pikalova, E.Y.; Medvedev, D.A.; Bogdanovich, M.N. Development of electrochemically active electrodes for BaCe0.89Gd0.1Cu0.01O3−δ proton conducting electrolyte. Solid State Ion. 2017, 306, 55–61. [Google Scholar] [CrossRef]
Figure 1. Visualization of the structure (obtained using a software package VESTA [70]) with structural parameters presented in Table 1: the NCNCO01 sample after the synthesis (a); the NCNCO01 sample after the high-temperature treatment in static air (b). In the picture, the oxygen atoms are presented in red, Ni/Cu in green (with orange parts), and Nd/Ca in white (with blue parts). Partial coloring of the atoms represents partial occupancies of the site.
Applsci 12 03747 g001
Figure 2. Concentration dependencies of the lattice parameters (a) and the unit cell volume (b) of the as-synthesized NCNCO00–NCNCO04 samples. (Error bars are not visible on the graph as they are of the size of the symbols for the data points).
Applsci 12 03747 g002
Figure 3. Changes in the a and b lattice parameters upon heating/cooling in the air flow (a); the unit cell volume and the c parameter change (b) for the NCNCO02 sample. Parameters of the tetragonal structure are given in an unconventional F4/mmm sp.gr. for the direct comparison with those of a Bmab sp.gr.
Applsci 12 03747 g003
Figure 4. Changes in the a and b lattice parameters upon heating/cooling in the He flow (a); the unit cell volume and the c parameter change (b) for the NCNCO02 sample. Parameters of the tetragonal structure are given in an unconventional F4/mmm sp.gr. for the direct comparison with those of a Bmab sp.gr.
Applsci 12 03747 g004
Figure 5. Concentration dependencies of the lattice parameters (a) and the unit cell volume (b) of the NCNCO00-NCNCO04 samples after the treatment in the synthetic air flow and in the He flow (error bars are not visible on the graph asthey are of the size of the symbols for the data points).
Applsci 12 03747 g005
Figure 6. XPS spectra obtained in air at room temperature for the NCNCO samples with different Cu content: Cu 2p3/2 (a); Ni 2p (b); and O 1s (c).
Applsci 12 03747 g006
Figure 7. Temperature-programmed isotope exchange of oxygen with C18O2 in the flow reactor for the NCNCO samples with different copper content. Points—experiments, lines—modeling.
Applsci 12 03747 g007
Figure 8. Arrhenius plots (a) and concentration dependencies (b) of the oxygen tracer diffusion coefficients for Nd1.6Ca0.4Ni1−yCuyO4+δ samples according to TPIE with C18O2 data.
Applsci 12 03747 g008
Figure 9. Nyquist plots obtained for the Nd1.6Ca0.4Ni1−yCuyO4+δ/SDC symmetrical cells with functional layers sintered at 1000 °C: at 700 °C (a) and at 600 °C (b), humidified air. Ohmic electrolyte resistance was subtracted from the spectra forthe sake of easier comparison of the electrode performances.
Applsci 12 03747 g009
Figure 10. DFRTs obtained from the EIS data (at 600–800 °C) for the NCNCO00/SDC (a) and NCNCO02/SDC (b) symmetrical cells with the functional layers sintered at 1000 °C.
Applsci 12 03747 g010
Figure 11. EIS spectra (a) and DFRTs (b) (at 700 °C) for the symmetrical cells with the NCNCO00 and NCNCO02 functional layers sintered at 1000 °C and the LNF + 3 wt.% CuO collector sintered at 900 °C.
Applsci 12 03747 g011
Figure 12. Temperature dependencies of the polarization conductivity obtained by the impedance spectroscopy method for the symmetrical cells with the NCNCO02 functional layer in contact with different solid-state electrolytes.
Applsci 12 03747 g012
Table 1. Results of the Rietveld refinement of the NCNCO01 structure obtained at 50 °C by TOF NPD.
NCNCO01As SynthesizedAfter Treatment in AirBefore Treatment in VacuumAfter Treatment in Vacuum
a, Å5.31796 (7)5.31948 (8)5.32090 (7)5.32054 (8)
b, Å5.38898 (8)5.38596 (8)5.38846 (8)5.39752 (8)
c, Å12.3197 (1)12.3235 (2)12.3265 (2)12.3234 (2)
V, Å3353.062 (5)353.074 (6)353.420 (5)353.900 (6)
y (Nd/Ca)−0.0082 (6)−0.0090 (6)−0.0091 (6)−0.0075 (6)
z (Nd/Ca)0.3614 (1)0.3626 (2)0.3607 (1)0.3608 (2)
1U (Nd/Ca), Å20.009 (1)0.013 (2)0.011 (1)0.014 (1)
U (Ni/Cu), Å20.011 (1)0.006 (2)0.0036 (9)0.005 (1)
z (O1)−0.0122 (2)−0.0137 (2)−0.0122 (2)−0.0120 (2)
U (O1), Å20.011 (1)0.013 (2)0.011 (1)0.014 (1)
y (O2)0.0353 (5)0.0391 (5)0.0365 (5)0.0420 (4)
z (O2)0.1766 (3)0.1742 (3)0.1743 (3)0.1765 (3)
U (O2), Å20.021 (2)0.017 (2)0.026 (1)0.020 (1)
2F (O2)1.00 (1)0.94 (1)0.99 (1)1
z (O3)-0.297 (4)--
F (O3)00.056 (8)00
wR, %/GoF3.71/1.673.93/1.863.36/1.733.34/1.66
4+δ4.00 (2)3.98 (3)3.98 (2)4.00 (2)
1U—atomic displacement factor; 2F—occupancy of a site.
Table 2. Results of the Rietveld refinement of the NCNCO03 structure obtained at 50 °C by TOF NPD.
NCNCO03As SynthesizedAfter Treatment in AirBefore Treatment in VacuumAfter Treatment in Vacuum
a, Å5.29762 (7)5.29898 (7)5.30136 (9)5.30594 (8)
b, Å5.37345 (8)5.37350 (8)5.38033 (9)5.38628 (9)
c, Å12.4607 (1)12.4636 (1)12.4556 (2)12.4479 (2)
V, Å3354.711 (5)354.890 (6)355.271 (7)355.753 (7)
y (Nd/Ca)−0.0096 (6)−0.0071 (6)−0.0051 (7)−0.0118 (6)
z (Nd/Ca)0.3601 (2)0.3602 (2)0.3610 (2)0.3593 (2)
1U (Nd/Ca), Å20.011 (2)0.0112 (2)0.008 (2)0.0073 (4)
U (Ni/Cu), Å20.009 (2)0.0093 (5)0.011 (2)0.011
z (O1)−0.0119 (2)−0.0102 (3)−0.0132 (3)−0.0096 (4)
U (O1), Å20.013 (3)0.0197 (6)0.011 (2)0.0189 (7)
2F (O1)1111
y (O2)0.0381 (5)0.0423 (4)0.0400 (5)0.0446 (5)
z (O2)0.1752 (3)0.1776 (4)0.1775 (4)0.1777 (4)
U (O2), Å20.019 (2)0.0188 (8)0.021 (2)0.0177 (8)
F (O2)0.96 (1)0.924 (9)0.95 (1)0.96 (1)
z (O3)-0.292 (5)--
F (O3)00.044 (8)00
wR, %/GoF3.73/1.733.67/1.784.11/2.003.74/1.79
4+δ3.93 (2)3.94 (2)3.90 (2)3.92 (2)
1U—atomic displacement factor; 2F—occupancy of a site.
Table 3. Results of the Rietveld refinement of the NCNCO04 structure obtained at 50 °C by TOF NPD.
NCNCO04As SynthesizedAfter the Treatment in Air
a, Å5.2987 (1)5.2992 (1)
b, Å5.3742 (1)5.3779 (1)
c, Å12.4573 (2)12.4516 (3)
V, Å3354.739 (9)354.85 (1)
y (Nd/Ca)−0.0119 (8)−0.0121 (9)
z (Nd/Ca)0.3595 (2)0.3603 (2)
1U (Nd/Ca). Å20.0113 (7)0.0126 (8)
U (Ni/Cu). Å20.0079 (8)0.0098 (9)
z (O1)−0.0123 (3)−0.0102 (4)
U (O1). Å20.010 (1)0.013 (1)
2F (O1)0.97 (2)0.94 (2)
y (O2)0.0369 (7)0.0433 (7)
z (O2)0.1736 (4)0.1731 (5)
U (O2). Å20.017 (1)0.017 (1)
F (O2)0.92 (1)0.92 (2)
wR/GoF4.72/2.134.84/2.39
4+δ3.77 (4)3.72 (5)
1U—atomic displacement factor; 2F—occupancy of a site.
Table 4. Results of the in-situ XRD study of the NCNCO00-NCNCO04 samples: unit cell parameters (UCP) and unit cell volume (UCV) (collected at room temperature), temperatures of the phase transition (Tpt), and calculated values of the volumetric thermal expansion coefficient (VTEC).
SampleUCP (Å)
UCV (Å3)
after Treatment in Synthetic Air
UCP (Å)
UCV (Å3)
after Treatment in He Flow
Orthorhombic Distortion 1
after Synthetic Air/after He
Tpt (°C)
Air Flow, Heating/Cooling
Tpt (°C)
He Flow, Heating/Cooling
VTEC 2
×10−6 (K−1)
Air Flow,
Bmab sp.gr/
I4/mmm sp.gr
VTEC
×10−6 (K−1)
He Flow,
Bmab sp.gr/
I4/mmm sp.gr
NCNCO00a = 5.3253 (1)
b = 5.3862 (1)
c = 12.2690 (2)
V =351.916 (7)
a = 5.3191 (1)
b = 5.4018 (1)
c = 12.2558 (2)
V =352.144 (7)
1.13/1.53430/375385/4859.0/11.79.3/12.0
NCNCO01a = 5.3172 (2)
b = 5.3840 (2)
c = 12.3121 (5)
V =352.47 (2)
a = 5.3118 (1)
b = 5.3958 (1)
c = 12.3009 (2)
V =352.56 (2)
1.24/1.56410/365365/4407.8/9.18.2/9.2
NCNCO02a = 5.3070 (2)
b = 5.3789 (2)
c = 12.3600 (4)
V =352.83 (1)
a = 5.3042 (2)
b = 5.3901 (2)
c = 12.3475 (3)
V = 353.01 (2)
1.34/1.59420/400430/4458.7/10.08.0/10.4
NCNCO03a = 5.2974 (3)
b = 5.3757 (3)
c = 12.4470 (7)
V =354.46 (6)
a = 5.2971 (2)
b = 5.3778 (2)
c = 12.4341 (4)
V =354.21 (3)
1.46/1.50400–500/
400–500
400–500/
400–500
n/an/a
NCNCO04a = 5.2946 (1)
b = 5.3740 (1)
c = 12.4498 (3)
V =354.24 (2)
a = 5.2948 (1)
b = 5.3749 (1)
c = 12.4488 (3)
V =354.28 (2)
1.48/1.49400–500/
400–500
400–500/
400–500
n/an/a
1 (1 − a/b)*100%; 2 slope of (V(T)1/3 − V(RT)1/3)/V(RT)1/3 − T.
Table 5. Ni(III) share, α, in the NCNCO samples evaluated from the XPS data.
Sampleαn
NCNCO040.1850.111
NCNCO030.1570.110
NCNCO020.1620.130
NCNCO010.069≤0.062
NCNCO0000
Table 6. Oxygen tracer diffusion coefficients (D*) at 700 °C and their effective activation energies (Ea,D) for Nd1.6Ca0.4Ni1−yCuyO4+δ samples according to TPIE with C18O2 data.
Sample D fast * ,   ( cm 2   s 1 ) θfast, (%) D over * ,   ( s 1 ) Ea,D, (kJ mol−1)
NCNO3.3(±1.6) × 10−9601.3 × 10−9120
NCNCO1 254.9 × 10⁻¹⁰
NCNCO2203.3 × 10−10
NCNCO352.6 × 10−10
NCNCO4
Publisher’s Note: MDPI stays neutral with regard to jurisdictional claims in published maps and institutional affiliations.

