Article

What Does the Ideal Built-In Car Navigation System Look Like?—An Investigation in the Central European Region

1
Doctoral School of Earth Sciences, ELTE Eötvös Loránd University, Pázmány P. Sétány 1/C, H-1117 Budapest, Hungary
2
Institute of Cartography and Geoinformatics, ELTE Eötvös Loránd University, H-1117 Budapest, Hungary
3
Research Division Cartography, Department of Geodesy and Geoinformation, Technical University Vienna, 1040 Vienna, Austria
4
Department of Geography/Geology, University of Nebraska at Omaha, Omaha, NE 68182, USA
*
Author to whom correspondence should be addressed.
Appl. Sci. 2022, 12(8), 3716; https://doi.org/10.3390/app12083716
Submission received: 21 February 2022 / Revised: 30 March 2022 / Accepted: 4 April 2022 / Published: 7 April 2022
(This article belongs to the Special Issue User Experience for Advanced Human-Computer Interaction II)

Abstract

:

Featured Application

Suggestion for navigation software companies about an “ideal” built-in car navigation interface, which can be more helpful for drivers.

Abstract

Driving is based on effective navigation. When using a navigation device, the user interface, the amount and quality of the underlying data and its representation all effect the quality of navigation. This study evaluates whether drivers in three different countries consider these devices to be useful and what functionality they would prefer. An online questionnaire was used to assess built-in navigation systems. The findings from 213 respondents show that current car GPSs are overloaded with features. Regardless of country, drivers simply require more basic functionality in the interface. It was also noted that the embedded functions in these devices are not fully utilized. In addition, many people use the navigation service to enter a new address while the car is moving. It may be worth examining how this option can be better implemented.

1. Introduction

A major requirement for safe travel is fast and accurate navigation assistance. While maps once served this function, at least with the help of a navigator/passenger, technology now provides electronic and mostly automated solutions. Several different types of navigation tools are available, including free phone apps, such as Google Maps, dedicated GPS navigation devices or built-in car navigation systems. These devices all have different user interfaces and graphic displays requiring varying amounts of user attention [1].
This research specifically examines built-in GPS systems in cars. These types of navigation systems have been the subject of only a minimal amount of academic research. The primary purpose of this research was to determine what should be implemented in a new generation of car navigation devices. We wanted to obtain answers to the following general questions:
  • What do GPS systems look like today and how are they used?
  • Do drivers consider these devices to be appropriate? If not, what would they prefer?
  • Are there any differences in the preferences between countries with different economic backgrounds?
The survey was conducted in three Central European countries: Hungary, Romania and Austria.
The authors recognize the implicit quandary in using navigation devices of all kinds. When navigating in an environment without electronic assistance, people learn its spatial configuration as a side effect of wayfinding. This is especially true when using a larger map that provides an overall perspective of the environment. A variety of cognitive processes are involved when self-navigating with a map. For example, mental rotation is needed in order to adapt the map to the current view of the environment [1]. The process of planning a route from start to finish requires an entire array of cognitive skills. When people move without navigation assistance, objects in the environment are noted and compared to mental visualizations for confirmation [2]. This all helps to form a mental map that can be the basis for future navigation.
It should also be noted that a more general definition of “GPS” is used here. Formally, the acronym refers to the Global Positioning System, first used for the U.S.’ satellite network, called Navstar. Therefore, the term “car/built-in GPS” would technically refer only to devices that use satellites from the U.S. system. Global Navigation Satellite Systems (GNSS) refers to all satellite positioning systems that have been implemented by different countries throughout the world. Most current position-finding devices use a combination of GNSS, WiFi and cell-phone-tower triangulation methods to determine a user’s location. To most people, GPS simply means “position-finding,” without consideration or understanding of how it is actually achieved.
This paper begins by relating the historic progression of navigation devices. It then examines previous research on their effectiveness, spatial knowledge acquisition and location-based services (LBS). Finally, the questionnaire is presented and results are statistically analyzed. This leads to the presentation of a proposed user interface that can help in the design of future car navigation systems.

2. Background and Methods

2.1. Brief History In-Car Navigation Devices

Specialized devices for navigation assistance have been available for over a century. An advertisement dated 30 December 1909 describes a scrolling map associated with a steering wheel. By 1930, the Italian “Touring Club Italiano” worked on a simple principle: before starting, the driver selected and threaded the appropriate map sheets, and then the device rolled these sheets from one roll to another. The problem was that when the vehicle deviated from the route or came to a fork, the driver had to change the map sheet and find the current position [3,4].
In 1966, General Motors introduced DAIR (Driver Aid, Information and Routing), which alerted the driver to road signs, speed limits and hazards along the route [5]. The first true automotive navigation system, the Electro Gyro-Cator, appeared in 1981 from Honda, Alpine and Stanley Electric [4,6]. By 1985, the Etak Navigator, which used ‘dead reckoning’ to determine the vehicle’s position [3,7], was the world’s first publicly available, in-car navigation system.
GPS-based navigation based on the US satellite configuration was introduced in 1990 in the Mazda Eunos Cosmo as part of the touch-screen car control system [8]. Two years later, the world’s first GPS with voice navigation was introduced in the Toyota Celsior (Lexus LS—luxury sedan). In Europe, the BMW E38 incorporated GPS navigation in 1994 [9]). In the US, it was introduced a year later by Oldsmobile, and called GuideStar. Selective availability was removed by the US government in 2000, making GPS signals more accurate, and GPS-based navigation of all forms became more prevalent. More and more car companies, businesses and tech giants have since entered the automotive GPS market.

2.2. Evaluation of In-Car Navigation

A variety of studies have examined the effectiveness of in-car navigation. In 2009, TomTom users were asked about the use of their navigation device [10]. In 2011, a Hungarian-founded company, NNG—which developed the iGO Navigation Engine—used a questionnaire to evaluate its system [11]. A Romanian study examined traffic in reference to navigation systems [12].
With the increased use of smartphones, free navigation applications have become popular. Hu et al., (2015) examined if drivers are willing to sacrifice some of the affordances of modern navigation systems in order to prolong the phone’s battery life. The study also acquired data about the prevalence of phone-based GPSs and voice/visual preference [13]. To get information on prototypes of Google Maps Navigation during real-world usage, an Android-based feedback mechanism was developed [14]. According to the 41 participants, most used the built-in car navigation system as a supplemental application [15].

2.3. Spatial Knowledge Acquisition

Differences in the spatial acquisition of knowledge between verbal instructions and mobile maps during driving were investigated in 2005 [16]. Münzer et al. compared three electronic navigation systems with paper maps [1]. It was found that although navigation system users have poor survey knowledge, they have good route knowledge. It was also shown that the size of the map display has an effect on spatial knowledge acquisition [2]. ‘Wizard of Oz’ prototyping—a design methodology used to improve user experience (UX)—was used in the research, e.g., no GPS was used. To compare spatial knowledge acquisition, Ishikawa et al. [17] included map-based GPS navigation systems in their research (in addition to paper maps and direct travel experience).

2.4. Location-Based Services

Location-based services (LBS) are mobile applications that give information depending on the location and context of the user [18,19]. The largest and probably the most popular LBS applications (including driver assistance, passenger information and vehicle management) are the mobile (car or pedestrian) navigation systems [20]. These systems are created and designed to help people during wayfinding activities in different environments [21].
Location-based information can be conveyed to users through an overview map or as turn-by-turn instructions. According to Gartner [22], limited-sized screens provide a limited overview. This can be compensated with good wayfinding instructions [23]. Fabrikant and Goldsberry [24] highlighted that bottom-up and top-down mechanisms drive human visual attention. Unexperienced users process animated displays based on perceptual salience and not thematic relevance [25]. According to Ware [26], users can detect a maximum of four moving objects simultaneously.
The ‘Geographic Information Displays’ (GID) offered by smartphones can be examined from (a) GIScience, (b) cartographic and (c) a cognitive science perspective [27].
(a)
The main challenge—from the GIScience perspective—is the ‘context’ (information for a person, place or object characterization)—that is, adaptation, inference, management and modeling [28]. According to Griffin et al. [29], people’s behavior will change if they receive more information about the environment (e.g., spatial and task contexts often alter during navigation). Technical systems should solve this problem.
(b)
In order to help the user’s understanding, graphic elements on the display should change according to many visual variables [30,31]. The more sophisticated the visualizations are, the better the performance of a navigation-related task. To this end, new functions have been developed, e.g., multi-scale traversal routes in a simultaneous representation, reducing the need to zoom in and out for orientation [32]. The extent of a visualization task’s performance depends on expertise [33,34,35] and emotional context [36].
(c)
GIDs should support the user’s mental representation of the variety of spatial conditions that can be used during navigation [27]. For navigation, spatial information must be translated from one reference frame to another [37]. GIDs can facilitate this transition by providing a track-up map that improves navigation efficiency [38]. With the help of the GID’s instructions, the decision-making process of the user decreases [39,40], or rather distracts the visual attention from the environment—the space is less experienced directly by the users [41,42].

2.5. User Experience

The term “user experience” (UX) has a wide range of meanings [43]. According to Alben [44], ‘experience’ refers to the way interactive products are used: the sense of ownership, the feeling of use, how well the tools serve their purpose, whether they are understood to work and how well the tool fits into the environment in which it is used.
The UX is (1) the consequence of the user’s internal state (expectations, needs, motivations, moods, etc.), (2) the characteristics of the intended system (including all products, services and infrastructure that are involved in the interaction when the product under consideration is used) and (3) the context (or environment) within which the interaction takes place.
UX is subjective: the user’s state influences the perception of the system, which in turn influences the experience and the user’s state. Built-in navigation systems have the potential to influence the relationship between users and their environment in deep and complex ways. Empirical and theoretical analyses show that the use of GPS units changes people’s understanding of the world around them, their learning habits, their navigation techniques and their knowledge of spaces and places. GPS navigation is based on abstract representations of these spaces and places [45].

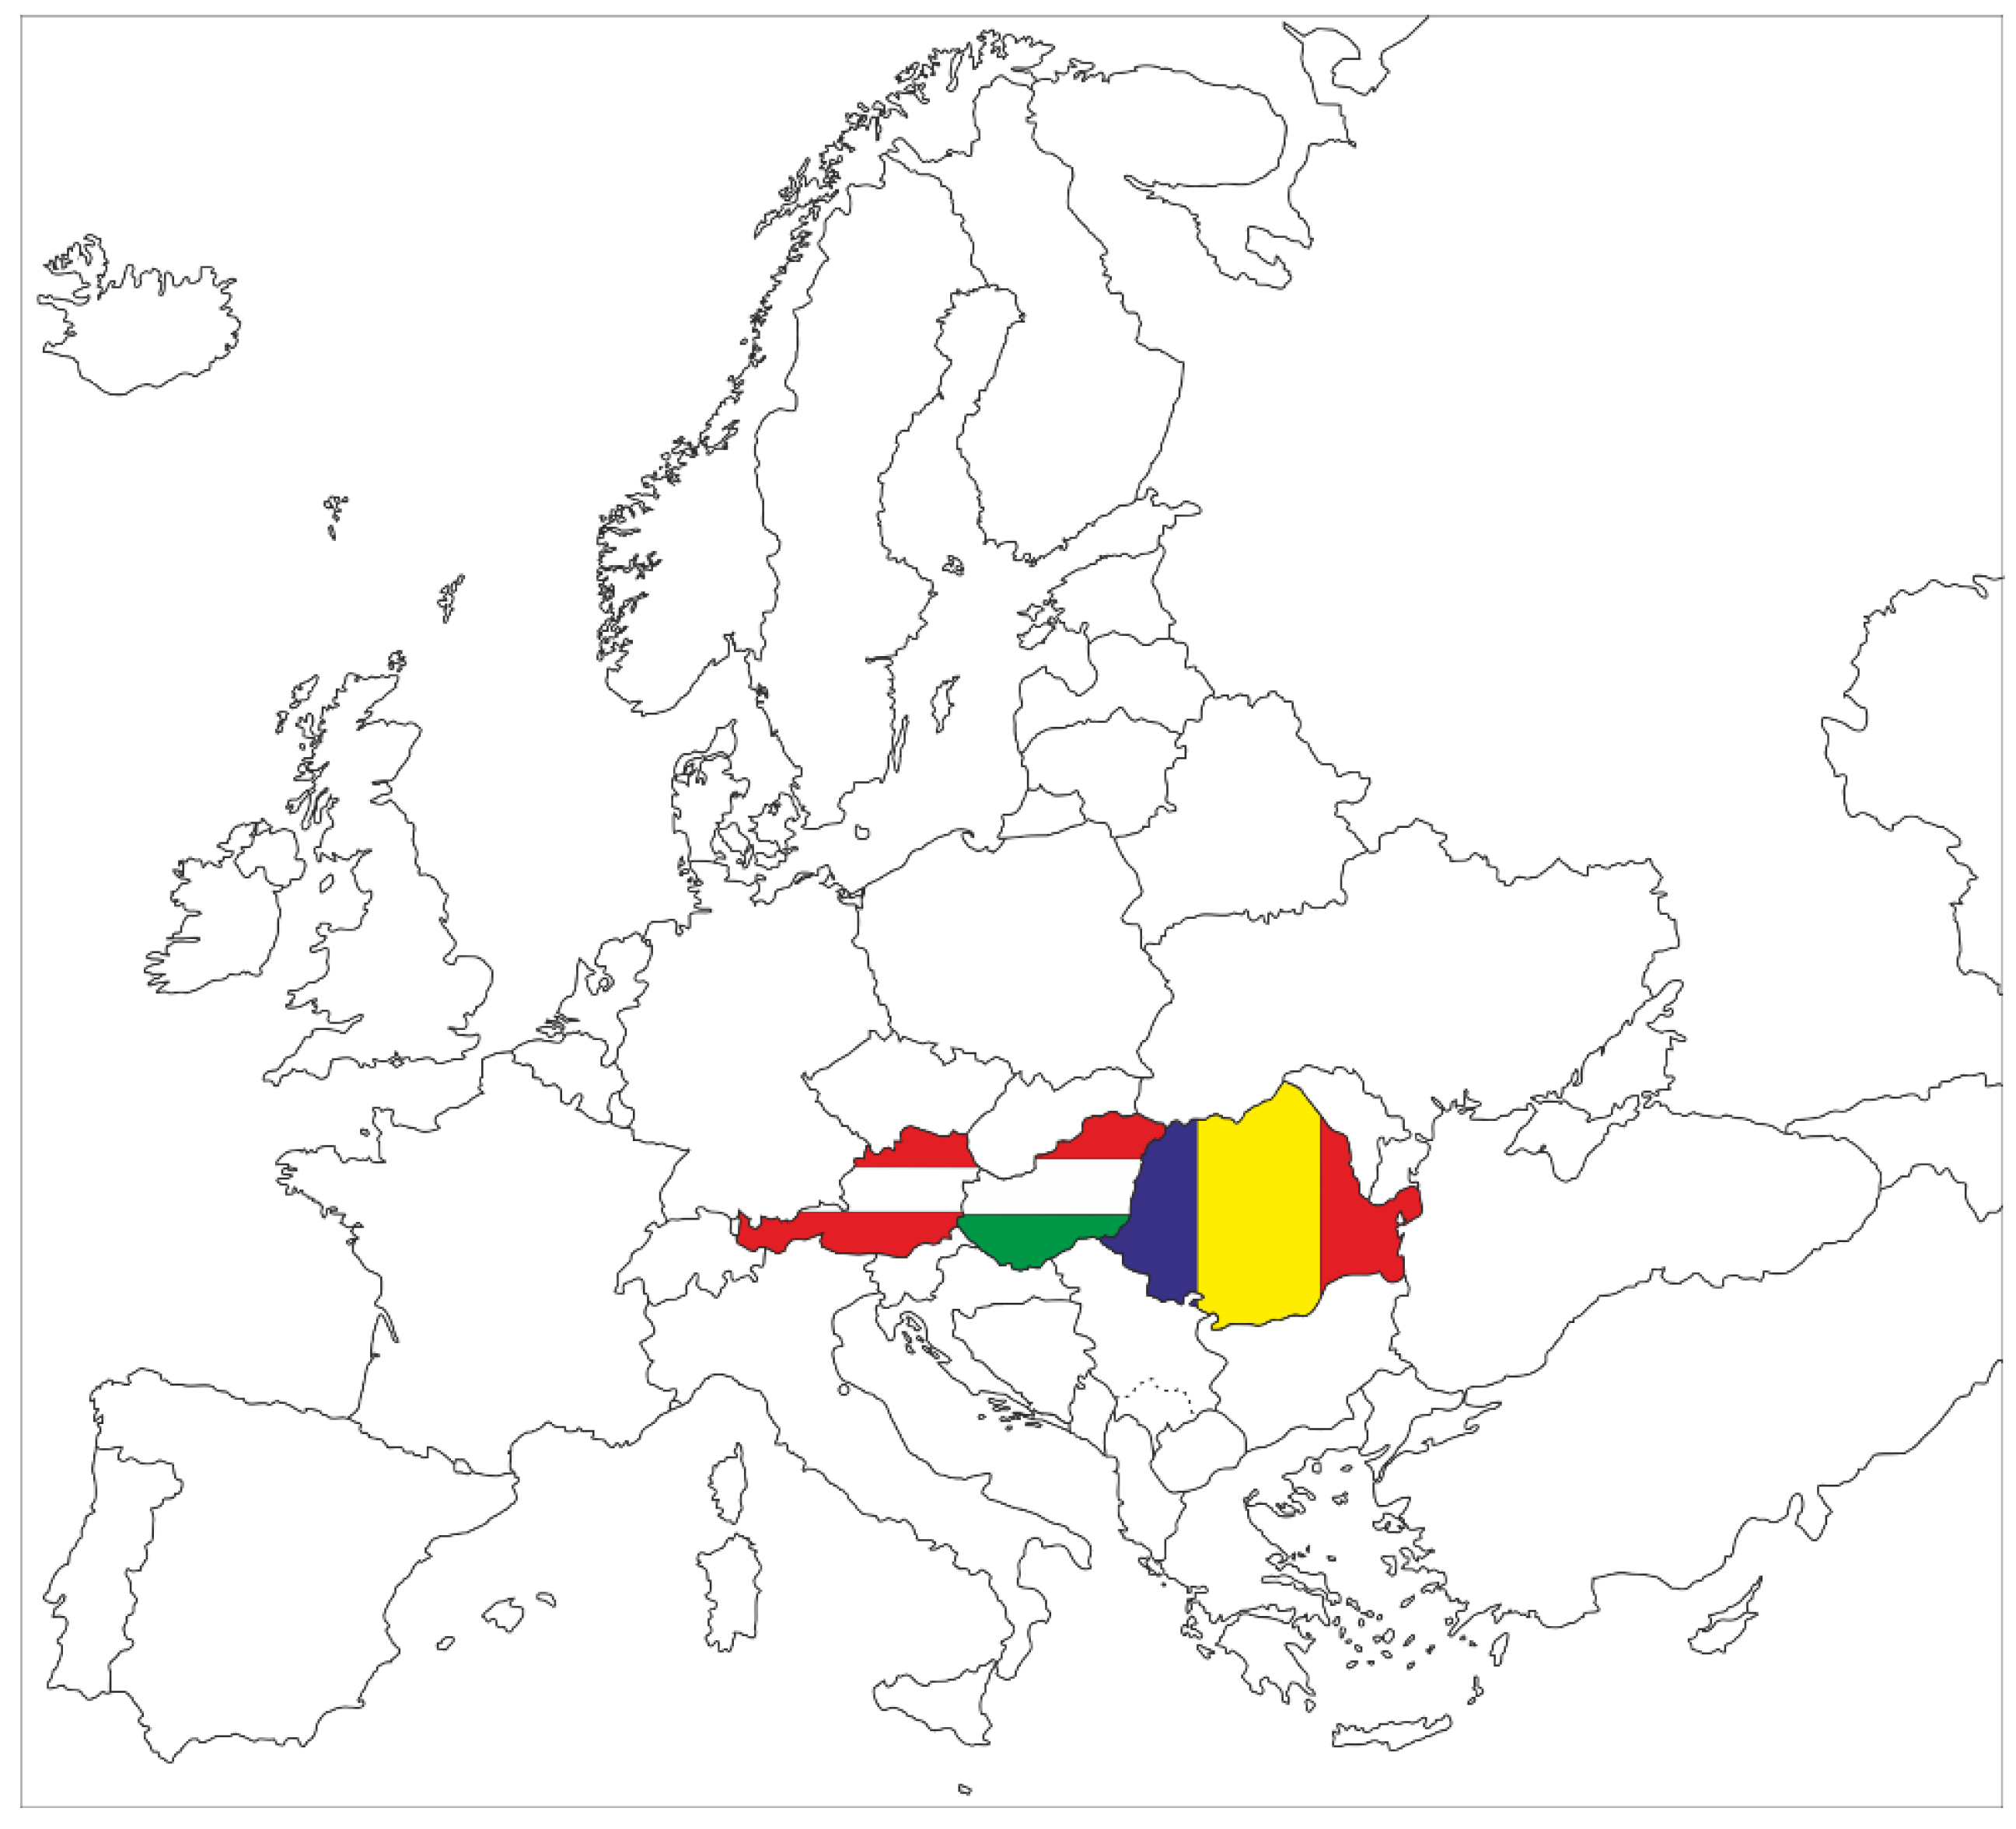
2.6. Examined Countries

The questionnaire was completed in three countries: Hungary, Romania and Austria (Figure 1). The three countries have different historical pasts. Thus, roughly simplified, Austria can be considered a “western”, Hungary a “central”, and Romania an “eastern” type of country. This difference is reflected in the GDP per capita and even in the length and quality of roads. These characteristics make these three countries suitable for comparison and let us make a recommendation for a one-size-fits-all tool for everyone.

2.7. The Questionnaire

2.7.1. Creating a Useful Questionnaire

Questionnaires are useful when the opinions or attitudes of a population need to be assessed. They can provide relevant and accurate data [46] but must be appropriate, understandable, clear, unbiased, satisfactorily coded, tested and ethical [47]. They enable the acquisition of both qualitative and quantitative information [48,49].
For many questionnaires, respondents are “invited” directly by researchers to complete the questionnaire. In this case, there is a high probability of respondents coming from similar backgrounds. This limitation should be indicated. The appropriate sample size can be facilitated by using online tools [50]. Questionnaires can be written or verbal. Although time consuming, the advantage of the latter is that it is more similar to an everyday conversational environment [51].
A number of criteria must be met for a successful survey (see [47]). The inclusion of a few test items is valuable for exploring context, broadening the range of responses and providing rich data to improve the interpretation of numerical results [50]. The relationships between items or groups of items in the questionnaire may be important. Online surveys present many advantages but can be impersonal. Respondents have no recourse when confused by a question.
There are several ways to analyze the data. Graphical representations provide a valuable visual overview. Analysis of qualitative (free text) responses requires coding (or organizing) the data into themes, which form the basis of an interpretive discussion. Online survey software, office software or specialized data analysis software (developed for researchers) are often used [52]. Most online surveys incorporate some type of analysis function. The most commonly used software is a spreadsheet program facilitating the use of a wide range of calculation and visualization functions, including basic statistical calculations. SPSS, R or Statistica can be used for sophisticated statistical analyses.

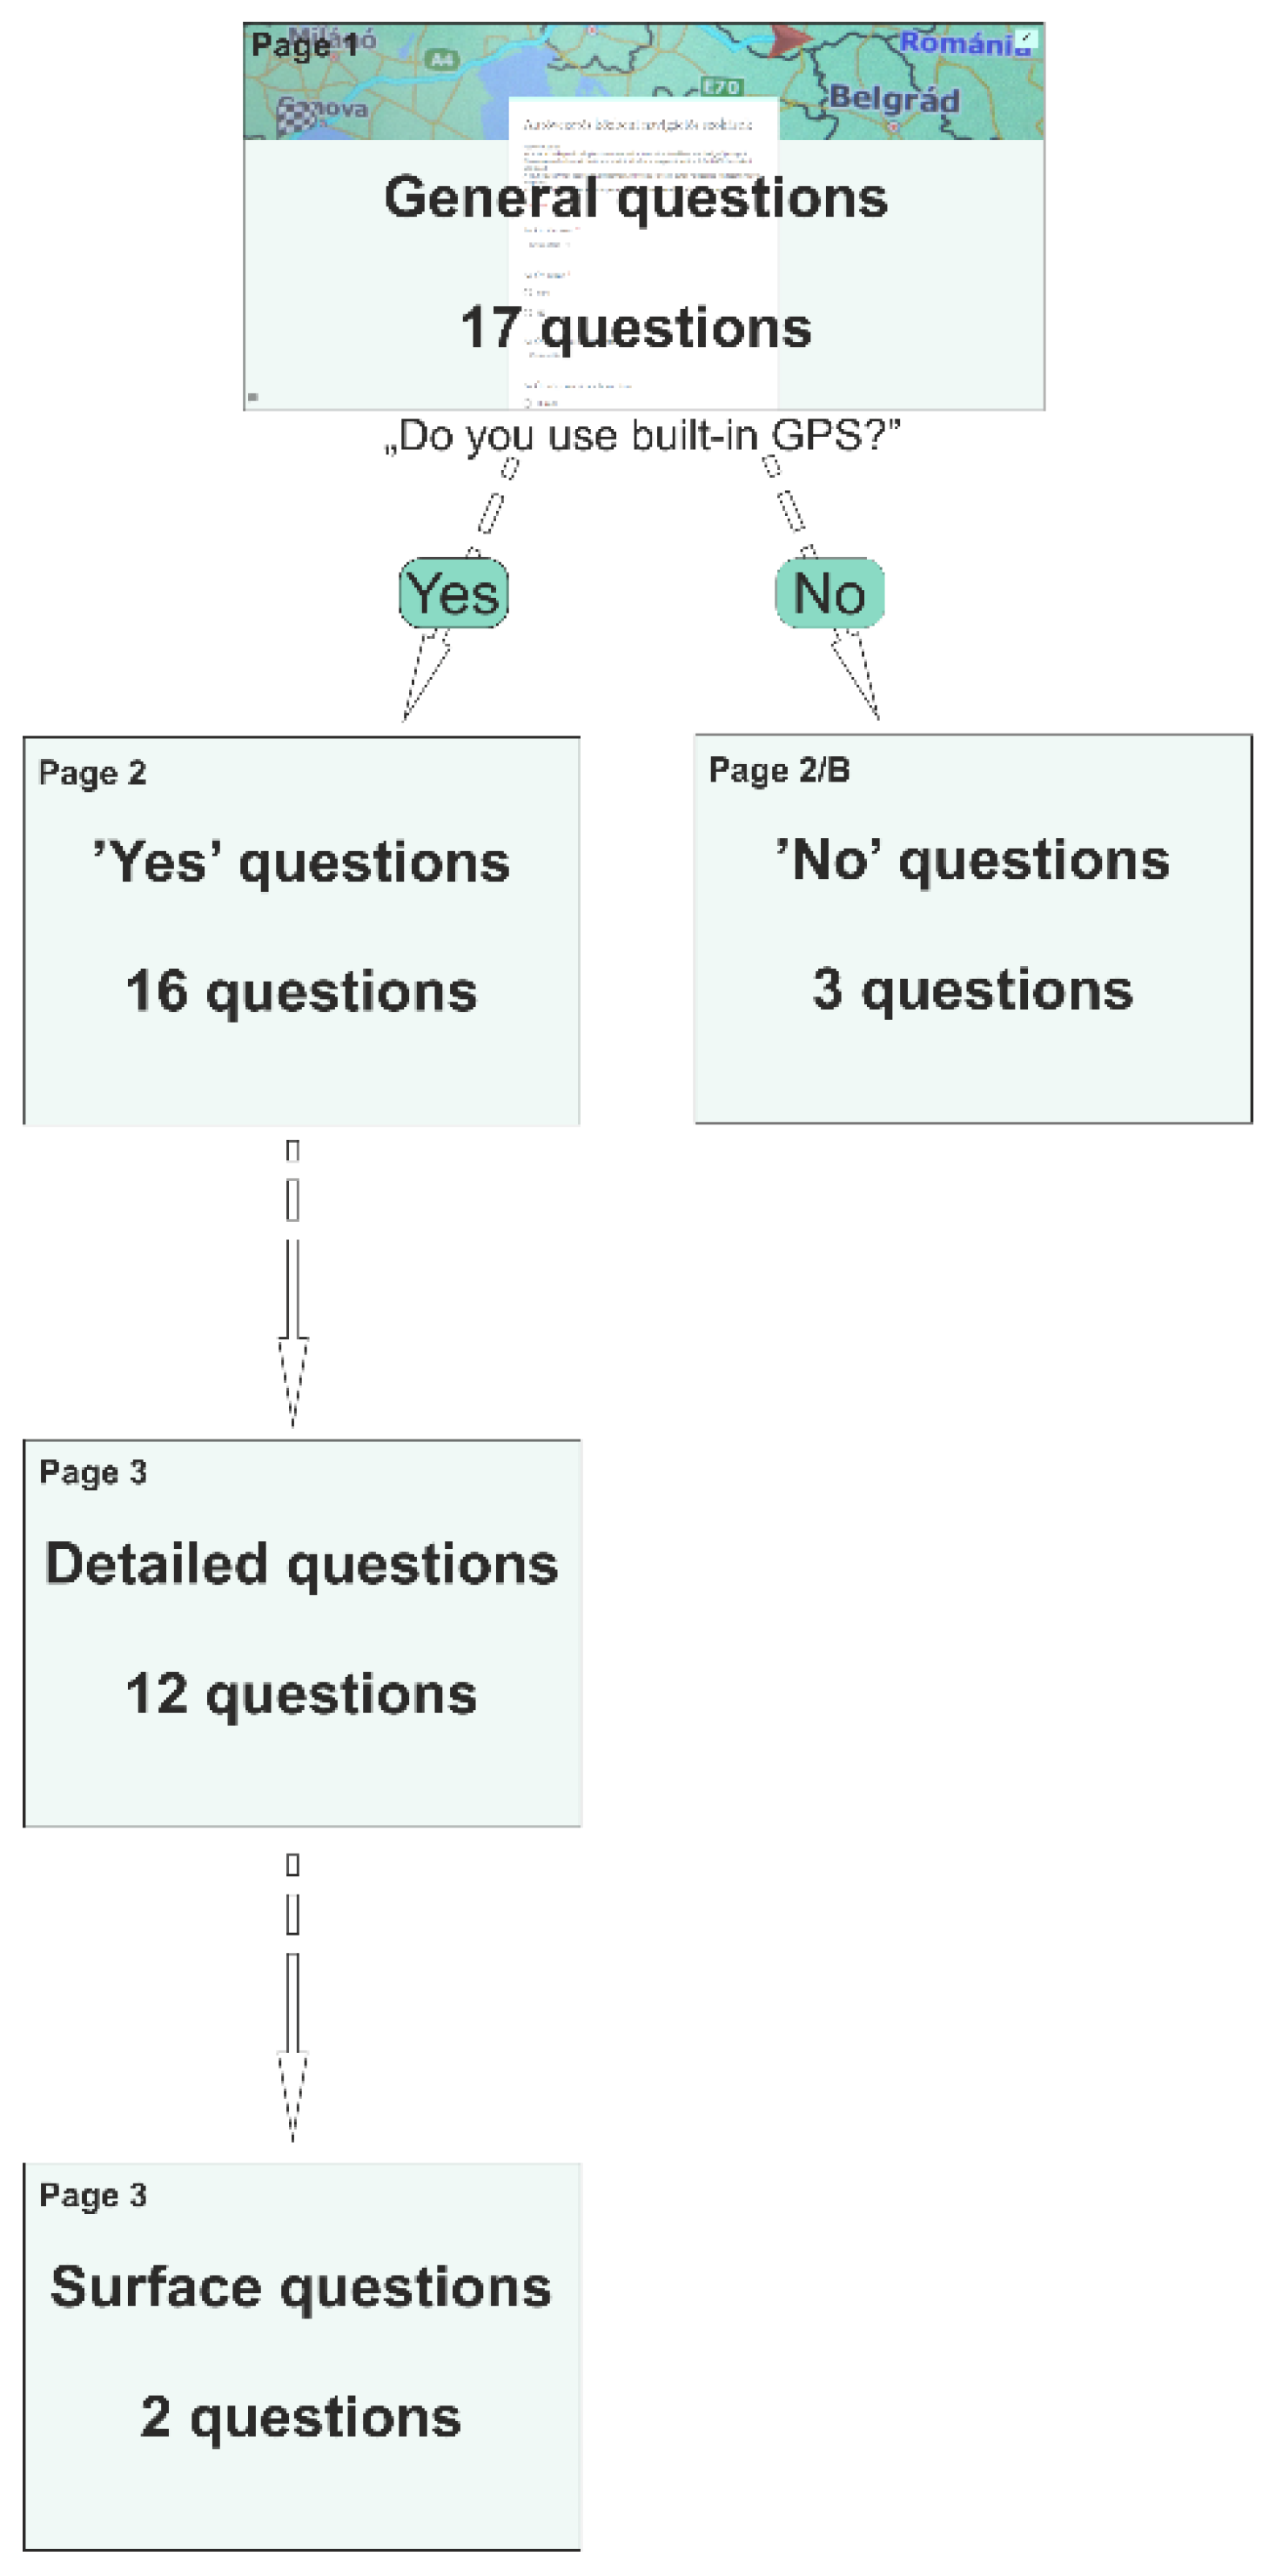
2.7.2. Our Online Questionnaire

In view of the guidelines for questionnaire design, we designed the survey to reach as many people as possible in the three different countries. The same questions were asked in order to make the results comparable between countries. The questions were translated in such a way to capture the identical meaning of each question. Google Forms was used because most people have familiarity with this online platform. Figure 2 shows how the questionnaire was structured.
Three separate “tiles” were created for the questionnaire. General questions were asked on the first sheet. There was only one criterion to take the quiz: the respondent needed to be a driver. This section asked a total of 17 questions, about half of which concerned their background (age, gender, education, etc.), while the other half were about driving habits (e.g., how often they drive in certain circumstances, how many kilometers per year they drive). Predefined answers were given to most of these questions. We asked about the presence or use of a built-in GPS in the last two questions.
Those who answered “NO” to a question about the use of an in-car navigation system were simply asked why they do not use it. This was followed by a question to determine whether they use any other navigation application, and whether they still use the built-in system. These individuals may have had a built-in navigation system but chose not to use it. For this reason, the questions and answers on the “NO” path had to be constructed in such a way that the respondent could find an appropriate option.
The “YES” usage path consisted of 50 questions divided into three parts (see https://mercator.elte.hu/~vorosfanni/navigation.html, accessed on 20 February 2022). The first 16 questions were general, asking for information about the system itself and the user’s relationship with it (e.g., what view they use while driving, and whether they take advantage of the ability to update the internal database for an added cost). For questions using a Likert-type scale [50], we tried to avoid the “neutral points” by using even-numbered options. We asked two questions about what they like and what they view as lacking in their navigation system. In part two, consisting of 12 questions, we asked more detailed questions. Several questions concerned frequently visited addresses and the use of GPS while driving. These questions were followed by optional questions. We did not want anyone to reach this point in the questionnaire and not submit it. These questions asked what the driver currently sees in the “map” view of his GPS and what they wanted to see. A series of options were provided but the respondent could also provide their own answer. Altogether, 1557 replies were received from the three countries. It was found that a large percentage of respondents did not use a built-in navigation system. Table 1 shows a summary of respondents who did.

3. Results

3.1. By Country

The answers to the questions in Table 1 are summarized in Figure 3 (we grouped the related issues as much as possible). In the graph, negative answers are marked in shades of red while ‘agreeing’ answers are marked in shades of green. When based on the country, green represents Hungary, blue Romania and red Austria. As the number of respondents from the three countries were different, it would not make much sense to plot the number on the charts; instead, we provide percentages.
The first few questions were about the “internal” data of the built-in navigation device. Figure 3a reveals that at least half of the devices in each country speak the national language. It is remarkable that almost all Austrian drivers use these devices with the German language, while a significant percentage of respondents in the other countries use a language different from their national language (whether the system knows the national language or not). Figure 3b shows the answers to two related questions that are also related to the use of sound in the interface. Whether the system can be controlled with voice instructions is shown here. Austria leads in this category. Lines indicate how many of the voice-controlled devices are used by the drivers.
In Figure 4a, the input methods—touchscreen, navigation knob, or voice—are analyzed. The Romanian drivers are mostly touchscreen users. In Figure 3b, the question was whether the system could respond to voice commands—not whether it could only work with voice. The last question was about how the driver reacts to sound when the user accepts/selects something. Based on this, it can be said that the Austrians use this feature the least.
After the sound-based questions, the questions were about the system’s display. In Figure 5a, the most commonly used views can be seen. Any of the four following view options—Perspective, Top, North-oriented or Travel direction—can be selected. If it has a perspective view, it can be oriented to north or in the travel direction. Unfortunately, the respondents did not consider this point, so we received only one answer in most cases. On the other hand, it can be stated that most people chose the perspective view, but Austrians use the top view to a greater extent. The night mode is clearly not disabled by users; they are happy with this automatic feature.
Two questions concerned what they did not like and what they were missing in the navigation system. Most of the answers commented that it was slow, expensive to update (the map becomes outdated for those who do not pay for updates) and no real-time traffic data are displayed. Several complained about inadequate zoom options. Those who answered at the beginning that they did not use their built-in device but used another one (e.g., Google Maps) had similar complaints.
Respondents were dissatisfied not only with the content of the navigation interface, but also its display and location. As part of the survey, we gave the respondents five possible alternative locations (see Figure 6). Table 2 shows where the navigation device is most commonly located. Out of the other four options, the currently used placement is preferred. In the case of Hungarians in particular, the other options also received a significant number of votes.
Figure 7 shows details about the planned routes and intermediate points. In most cases, GPS offers alternative routes, which are most often (min. 80%) viewed by drivers. About 40% of respondents do not enter more (intermediate) waypoints, but only one at a time. Only the Austrians indicated a tendency to enter more destinations in advance. This would be safer than entering intermediate locations while driving.
Figure 8 attempts to display three different types of data, each related to frequently visited addresses. Columns in shades of brown and yellow indicate how drivers enter locational information (from history, save as a favorite or enter again). ‘Recall from history’ dominates in all three countries, and very few (>10%) people re-enter every time. Different types of favorites are marked in shades of green. None of the six options dominate. The proportion of those who do not save addresses is around 25%. Finally, a line indicates how many addresses they have if they are saving something to favorites. Austrians saved the fewest addresses, while 30% of Hungarians and Romanians saved at least 10 points.
There were four questions about the use of the device while driving. These are important questions as this type of use can greatly increases the risk of a collision. Most devices allow the chauffeur (driver) to use the device while driving (usually the driver has to agree at the very beginning that he/she knows that it is dangerous to use it in a moving vehicle). More than half of drivers in all three countries use the device while driving. Figure 9b presents the situations (blue) and reasons (green) for when the system is used. There are no big differences between the countries for why and when the system is used while driving.
The last two optional questions concerned what drivers see now on the built-in GPS “map” view and what they want to see. Similar answers were given to both questions. The responses were organized into four groups: “I have it and I want it”, “I have it, but I don’t want it”, “I don’t have it but I want it” and “I don’t have it and I don’t want it”. For each country, two user interfaces were created from these groups. Each map on the prepared interfaces represents a real place, and the place names are written in the official language of the country.

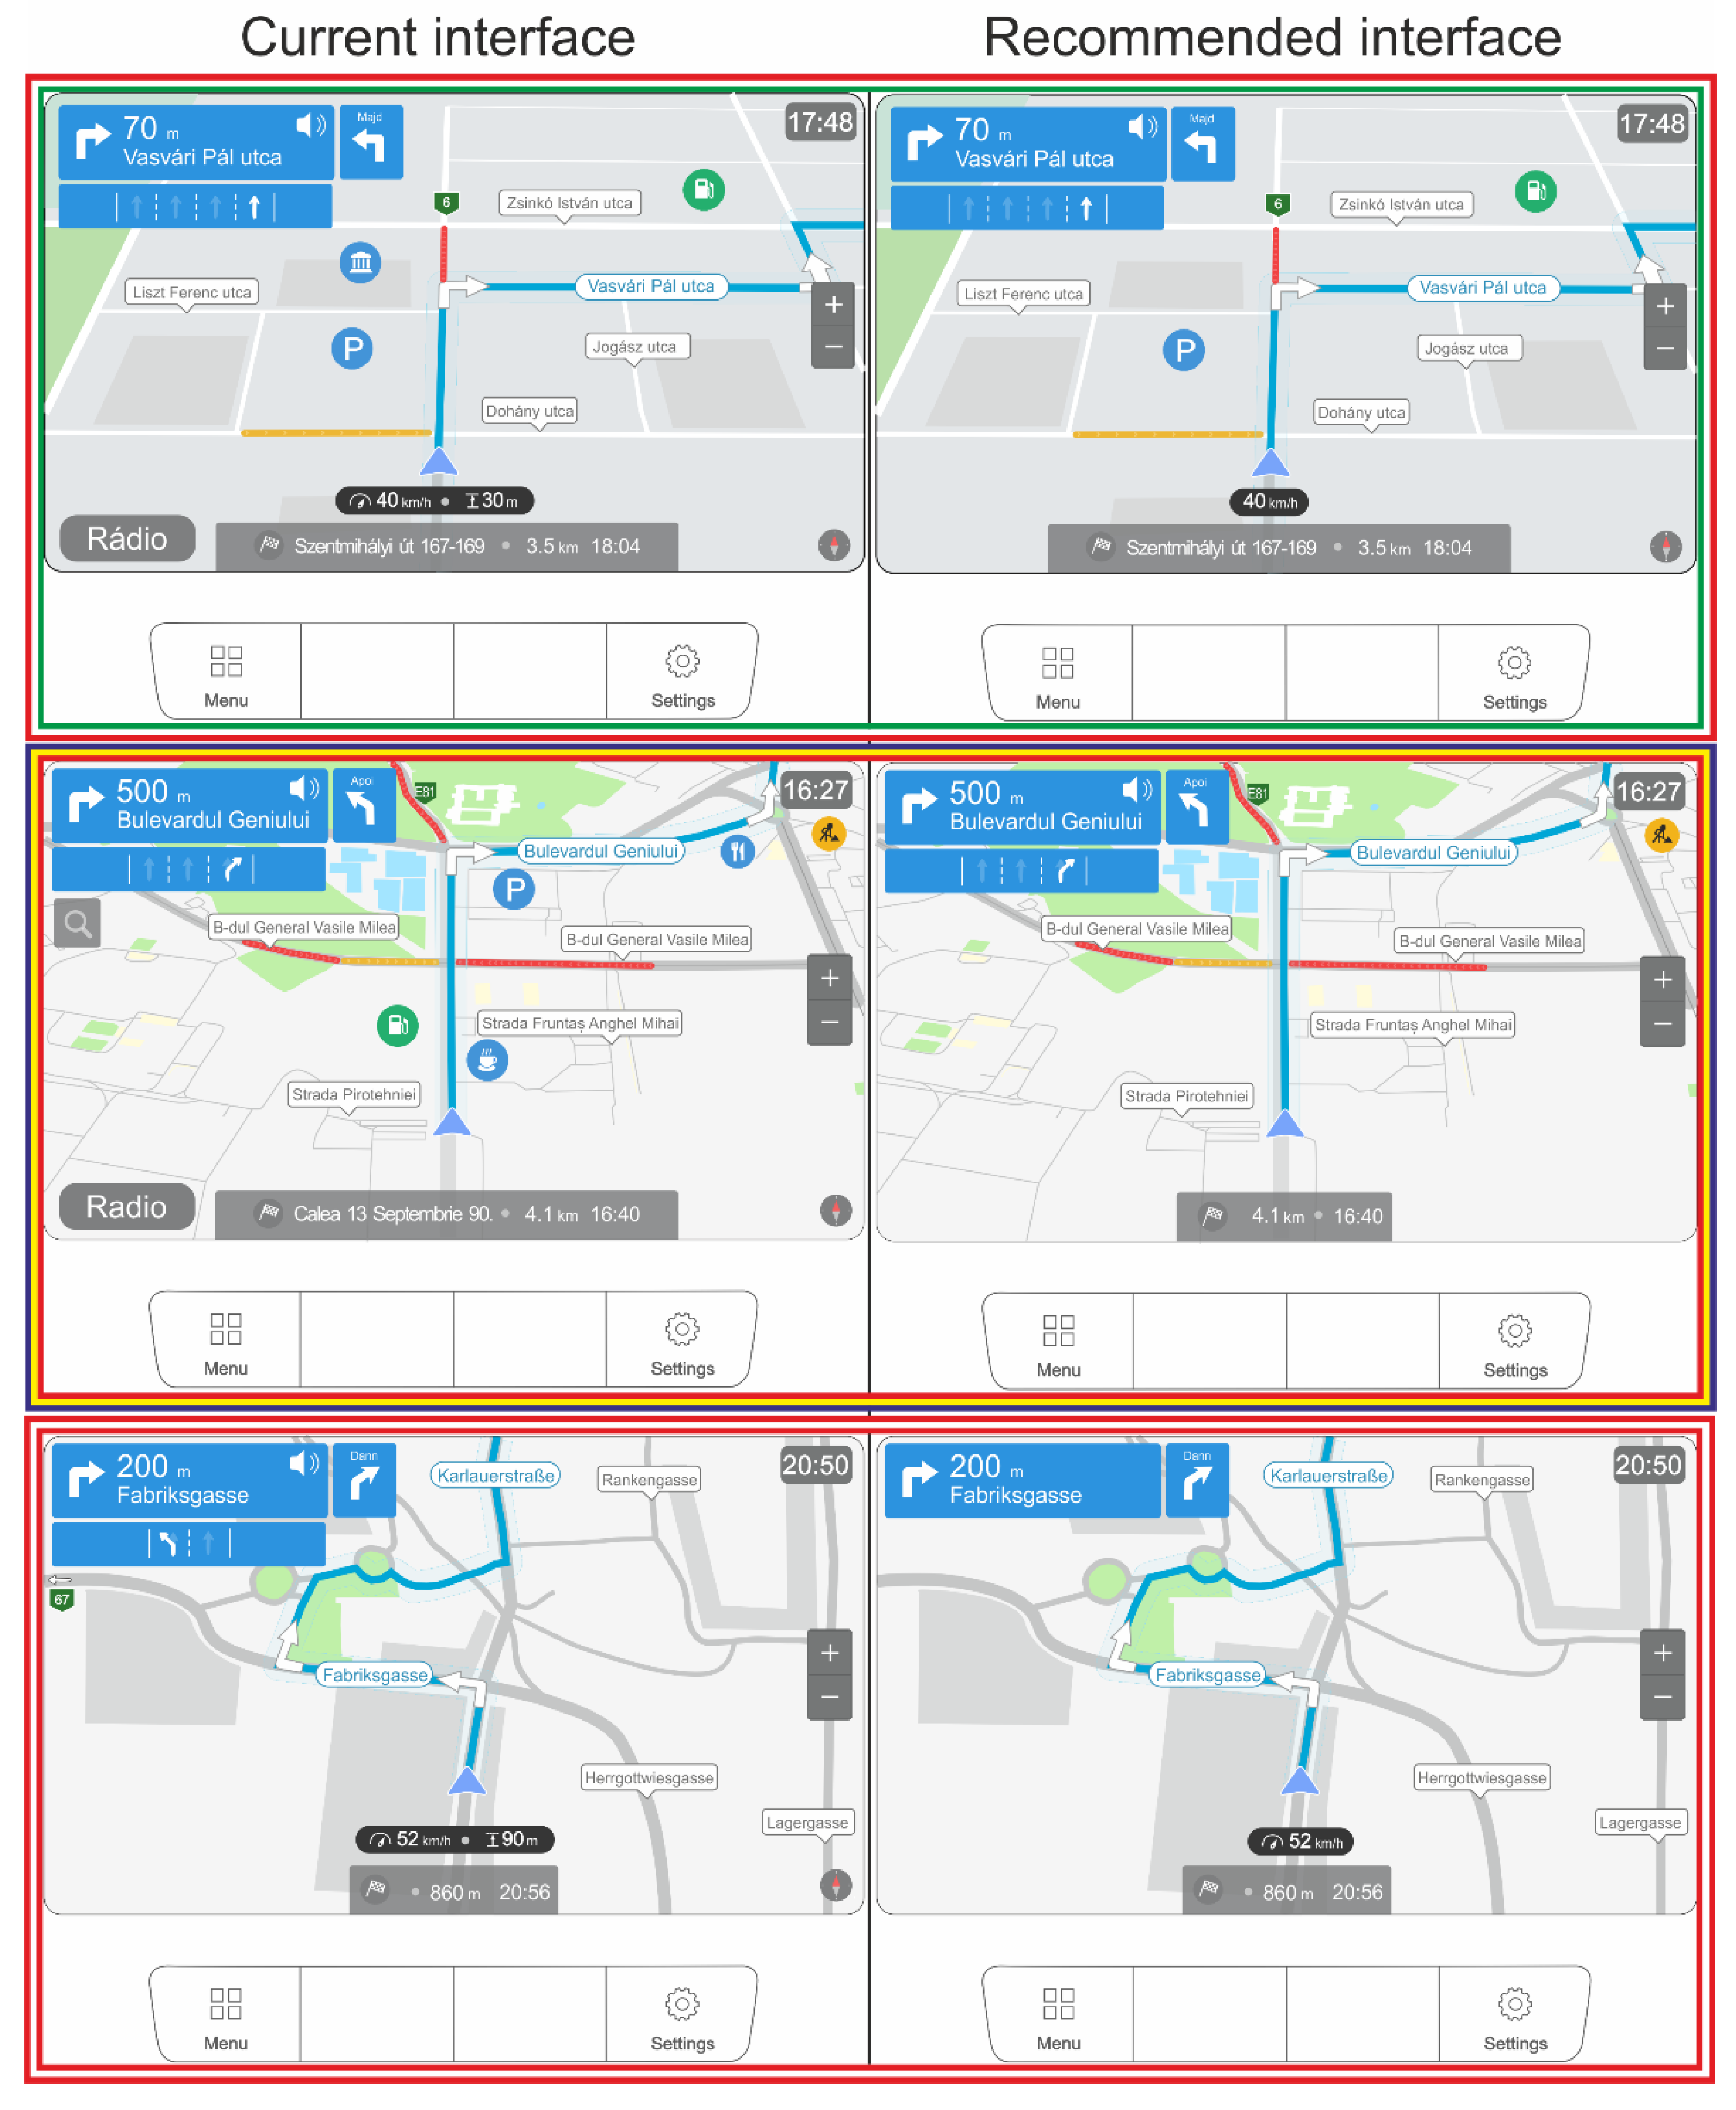
3.1.1. Current Interface

The current interface was created by merging the “I have it and I want it” and “I have it, but I don’t want it” groups. We did not depict all the features; only those for which at least 10% of all respondents responded positively. The answers given here are worth treating with some skepticism, as most respondents filled in the questionnaire from memory. Based on these, 19/24 functions were represented in Hungary, 20/24 in Romania and 10/24 in Austria (Figure 10, first column). Table 3 compares the functions in the current interfaces.
When the functions appear on the interfaces, the general rule is, “the more important it is, the more it moves to the left”. The most important information is closer for drivers on the left. Since we traditionally start reading from the top left corner, it is advisable to move these functions to the top.
During driving, apart from showing the current location, the next maneuver is the most important. This is why the distance to turning and turning direction (along with the turning street name) are placed in this special location at the top. The lane assist, indicating the preferred lane, is placed directly below the turning properties and is usually presented as a pop-up. The icon for our current position is located at the bottom middle, so the driver can look as far off from the screen as possible; the speed of the vehicle and its altitude are related to this.
Arrival information (address, distance and time) are all important, but the driver will only look at it if they are on time. This explains its placement in the bottom middle. The local time, the radio, the zoom icon and the compass have no particular significance, but were requested by the respondents. They were placed in locations further from the driver. Although the mute button had a low response in the questionnaire, it still occupies a more central position, mainly due to space saving.
The other features are all related to the map itself and its content; street names, road numbers, points of interest (POI) along the route and traffic information are now visible to users. The main menu and settings buttons are usually not on the display itself. They are on the car’s center console, its language being dependent on the vehicle make.

3.1.2. Recommended Interface

We used all four groups to create the proposed ideal interface, but we merged the values into two groups: I want it = “I have it and I want it” + “I don’t have it, but I want it” and I don’t want it = “I have it, but I don’t want it” + “I don’t have it and I don’t want it”. We set a limit in terms of the number of votes. We still depicted the function where the number of “no” votes did not exceed one and was half the number of “yes” votes (Table 4).
Comparing the interfaces shown in Figure 10, the following differences can be detected: (1) In Hungary, drivers now see 19 functions on the display but want 15. They indicate that they do not need altitude, mute, POIs and radio buttons. (2) Romanians have 20 functions and want 12 (no ‘add new destination’ button, arrival address, GPS accuracy, mute, north direction, POIs, radio and speed value). (3) In the case of Austria, they have 15 and they want only 10 (no altitude, lane assist, mute, north direction and route number).
It should be remembered that most drivers have not had the opportunity to try out the proposed GPSs systems. As a result, they may indicate that they do not require certain features because they have never had these features made available to them.

3.2. Results of Statistical Test

A Chi-squared test was used to check for normality of responses. The essence of the test is to first calculate the expected distribution. This distribution is then compared to the real (observed) distribution. The difference in deviation should be significant. Fisher’s exact test for statistical significance test belongs to non-parametric procedures and is used to analyze contingency tables. It measures the strength of the relationship between two dichotomous variables and tests independence.
Its application is recommended for small samples because, with a small number of elements, the sample distribution of the test statistic under the null hypothesis is generally not χ2. Thus, a statistical decision based on this distribution will not be correct. However, it can be used on a larger sample too. Due to the nature of the questions, we can examine the relationships between the countries studied. Significant differences are red.
In the case of Fisher’s exact test, only “yes” and “no” answers can be used. We summarized the answers for some questions (Table 5). For example, the possible answers for ‘Does the built-in GPS navigate you loudly?’ question were: Yes, in the native language; Yes, in another language, but it can speak in the native language; No, it’s not speaking and No, it can’t speak in the native language. For the data input method, we took as a starting point that most of the drivers used the touchscreen. It was the same with the physical appearance: the “usual place” was the affirmative answer.
In cases where there is a significant difference, Austria is always one of the countries that is different from the others with one exception. p = 1 means they are coming from the same distribution.

4. Discussion

We summarized the 213 answers of the three countries for all the 24 questions (4023 answers). The results presented in Table 5 were also used for this summary. If at least two of the three p values showed significant differences, they were included in the final results. The results are presented in Figure 11. Hungarian is used in the illustration. “Utca” means street and “Majd” means then. For other terms or help labels, the English meaning is shown in gray. In line with the questions, we derived the following results:
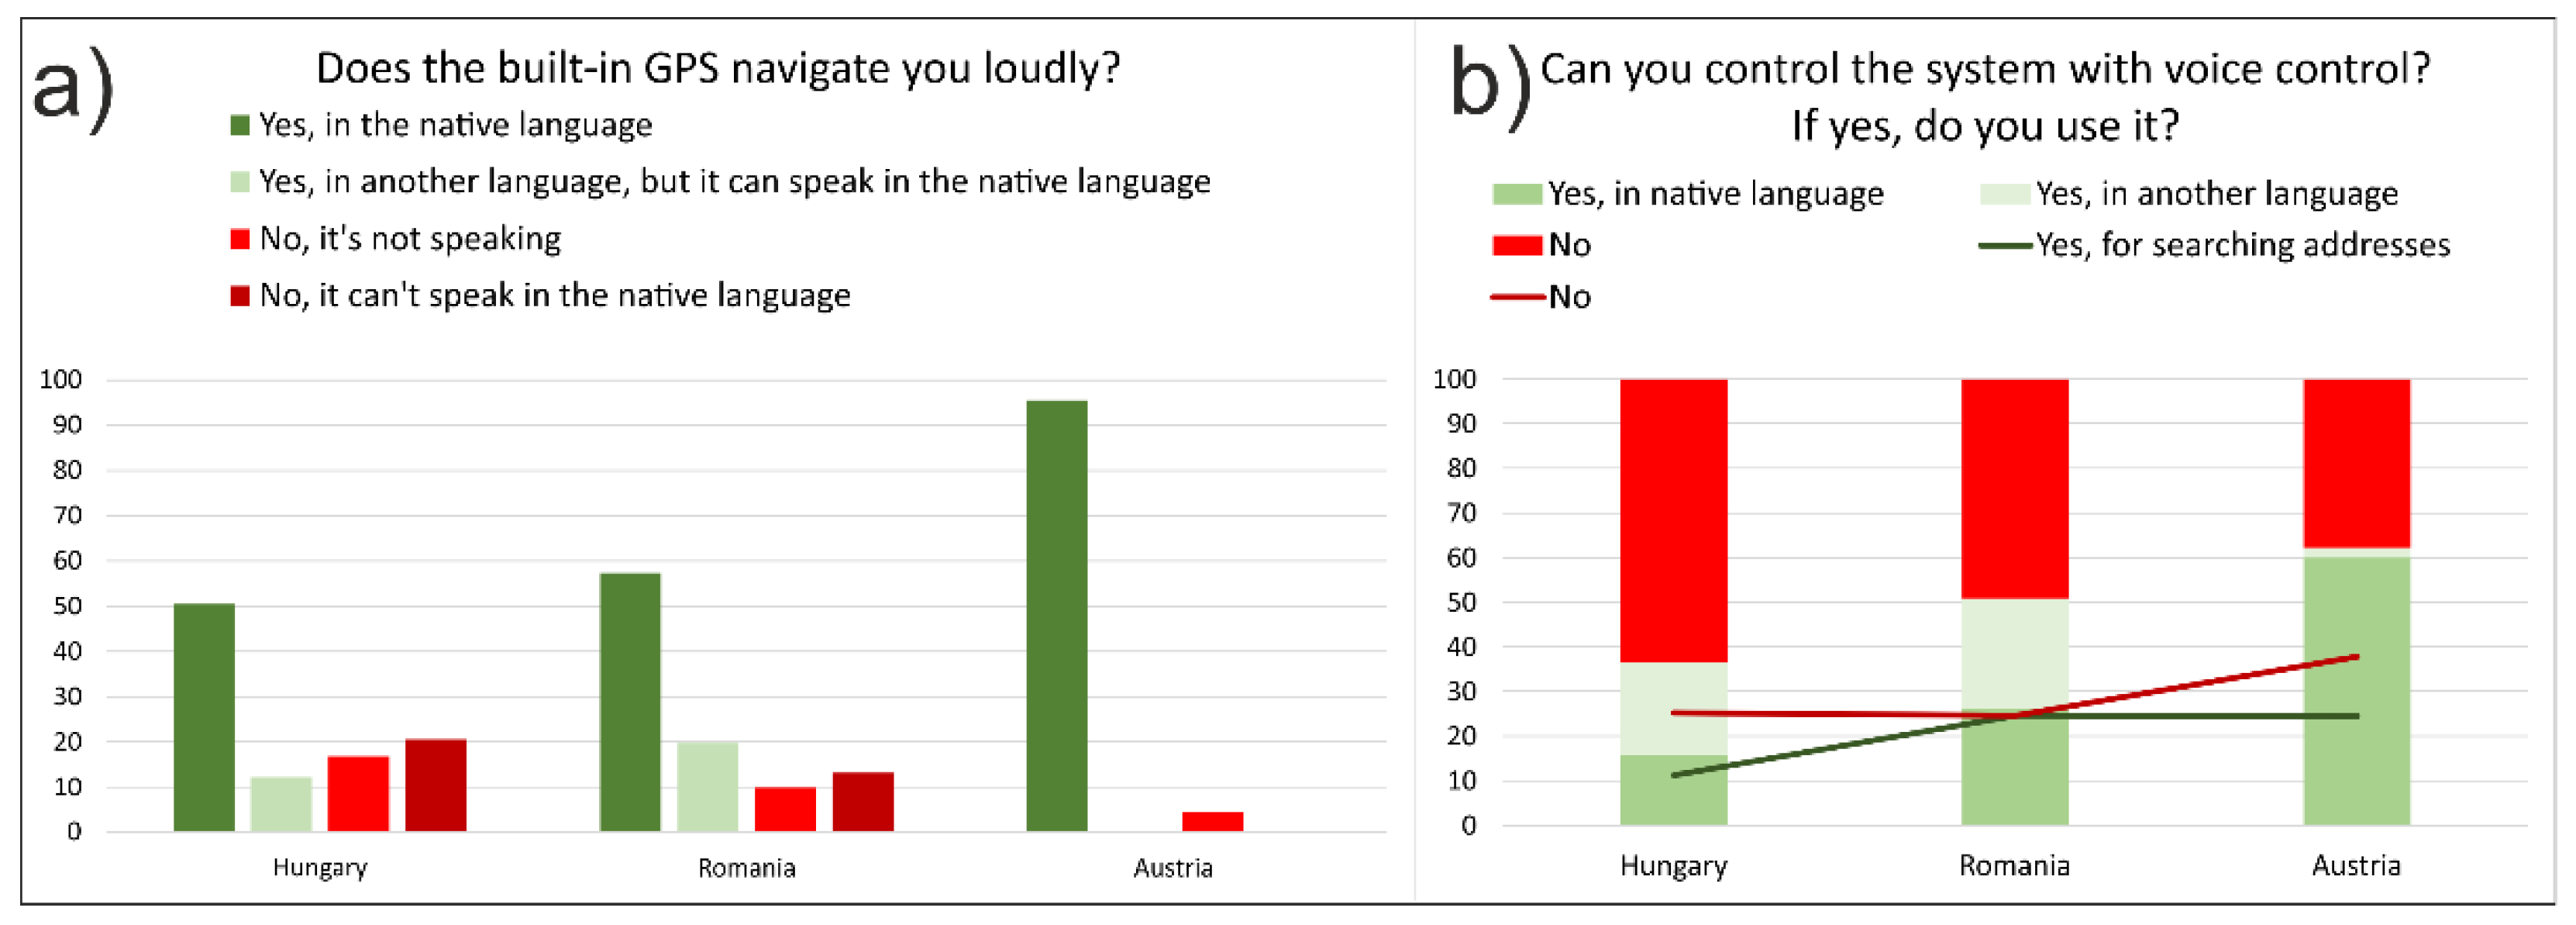
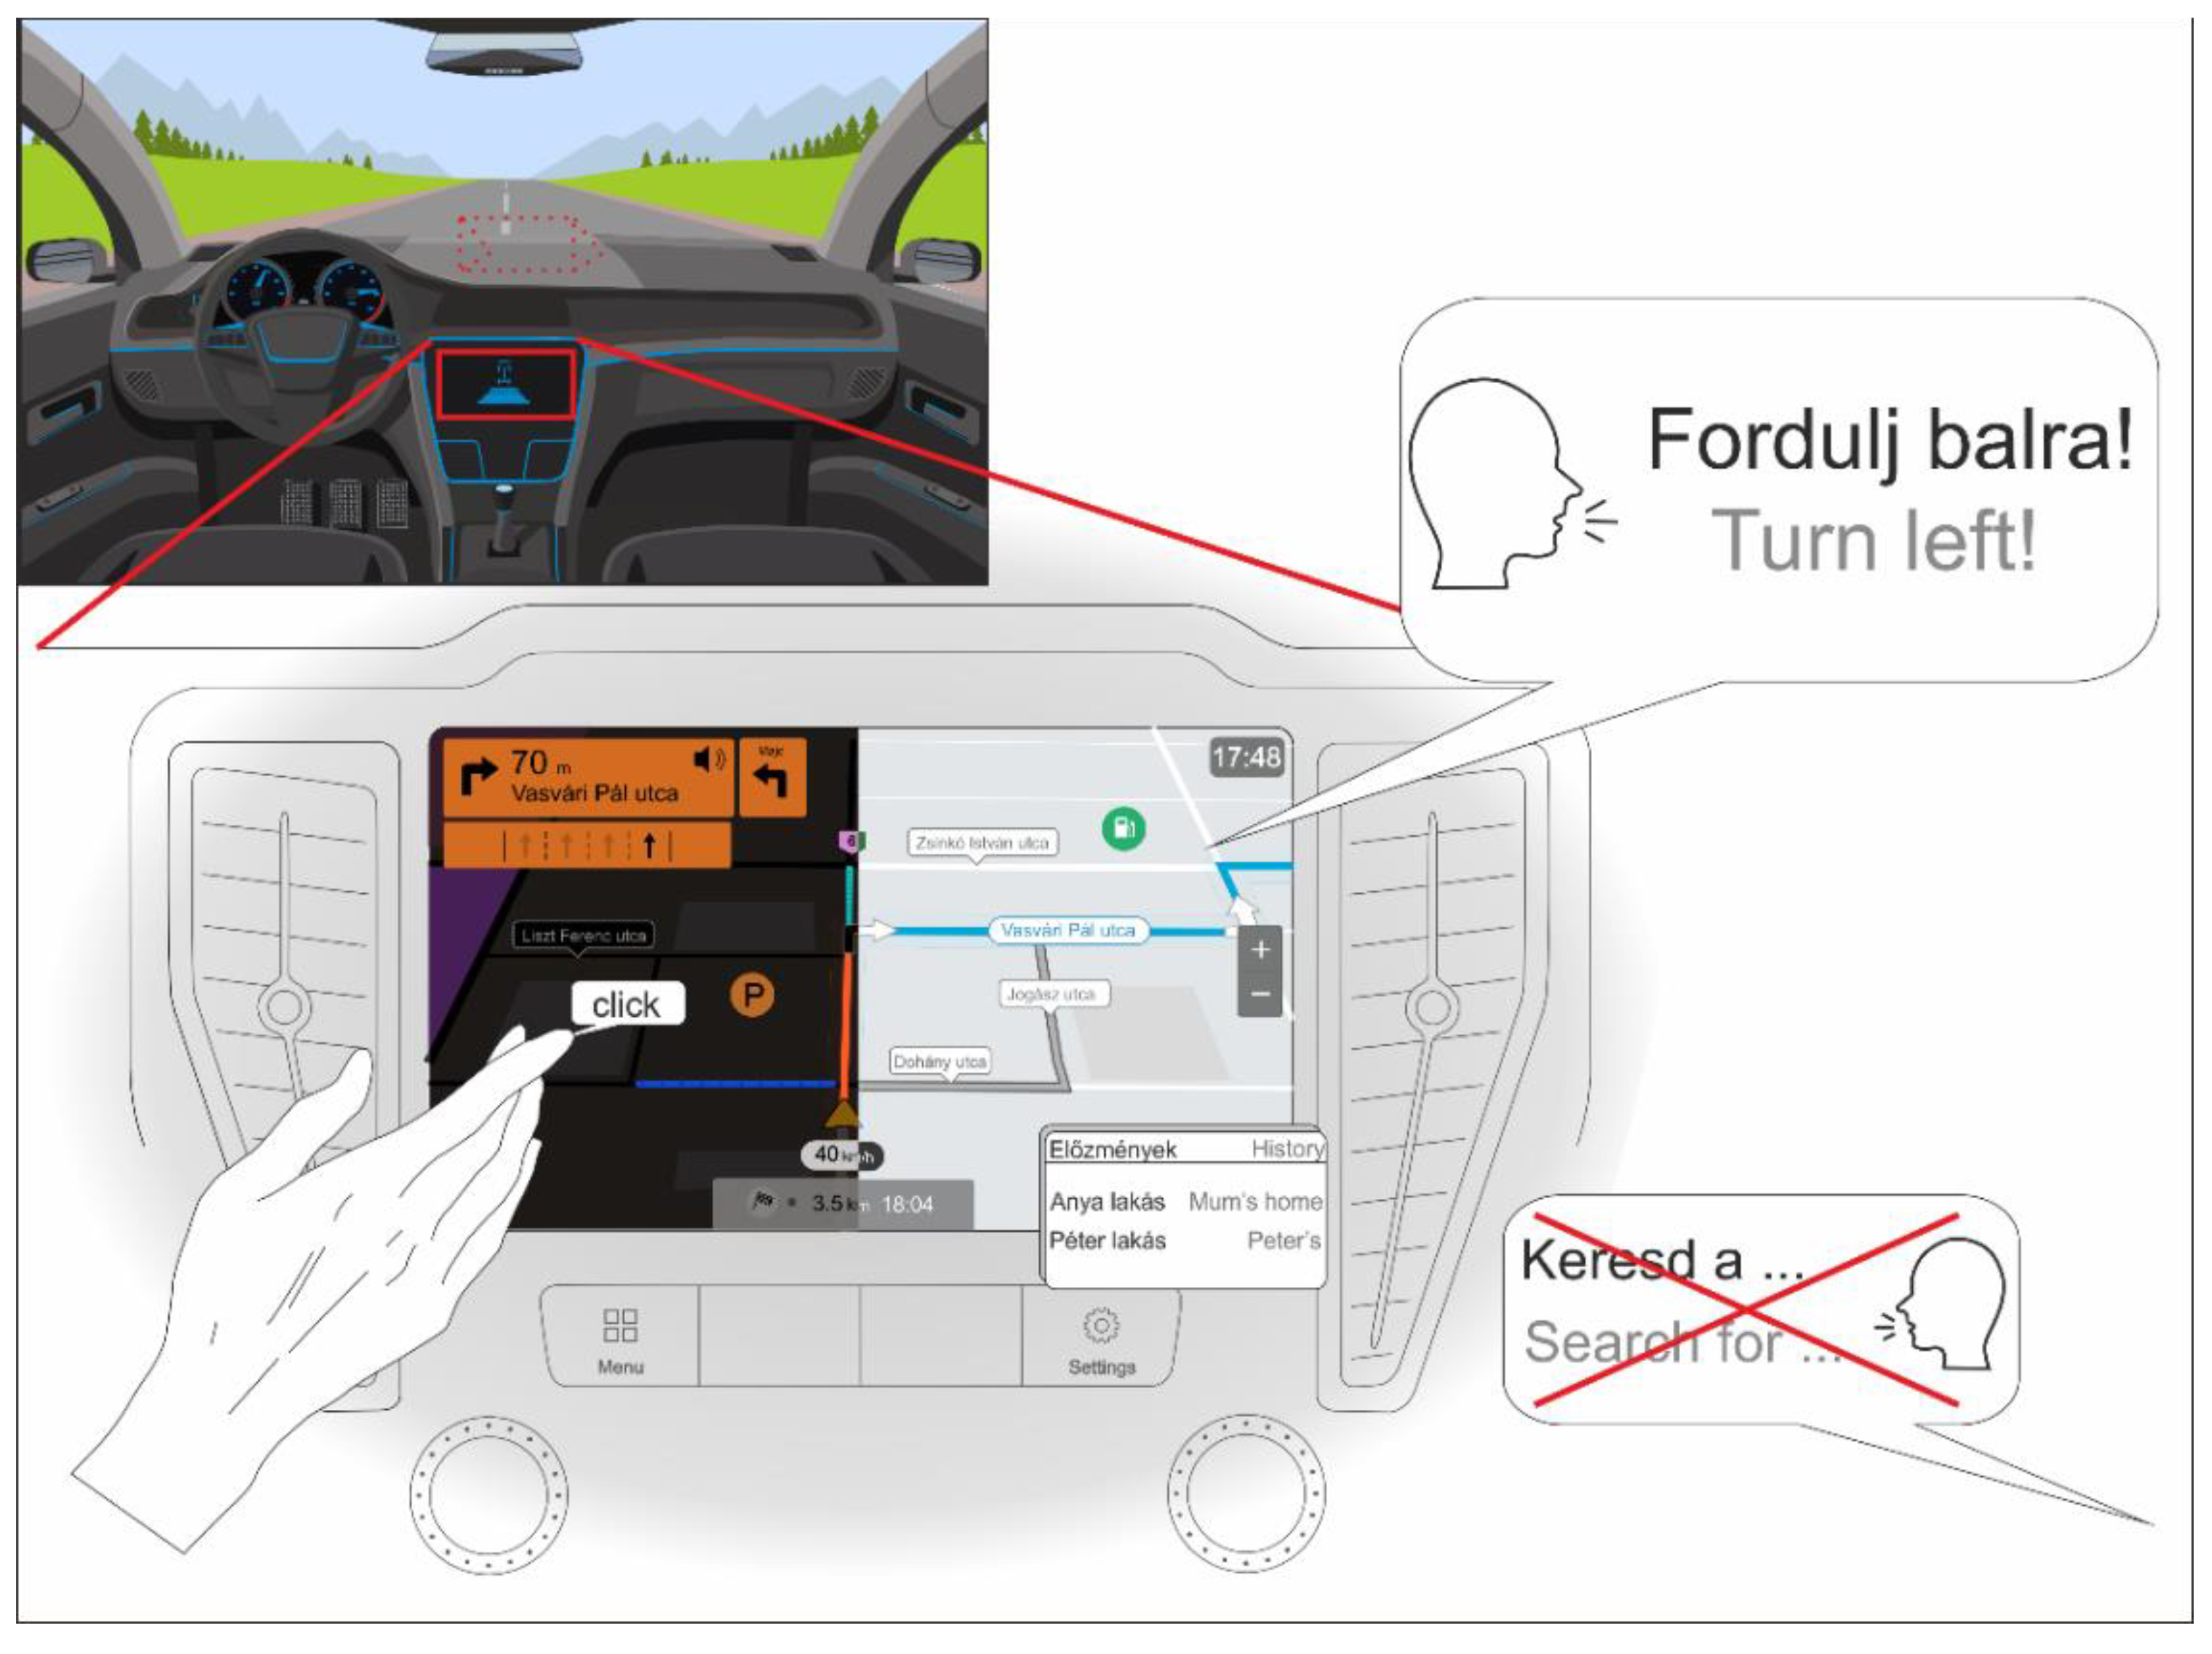
  • The device speaks the user’s native language most of the time but cannot handle voice commands—even if it implements voice recognition, it is more common that drivers do not take advantage of this feature (Figure 3).
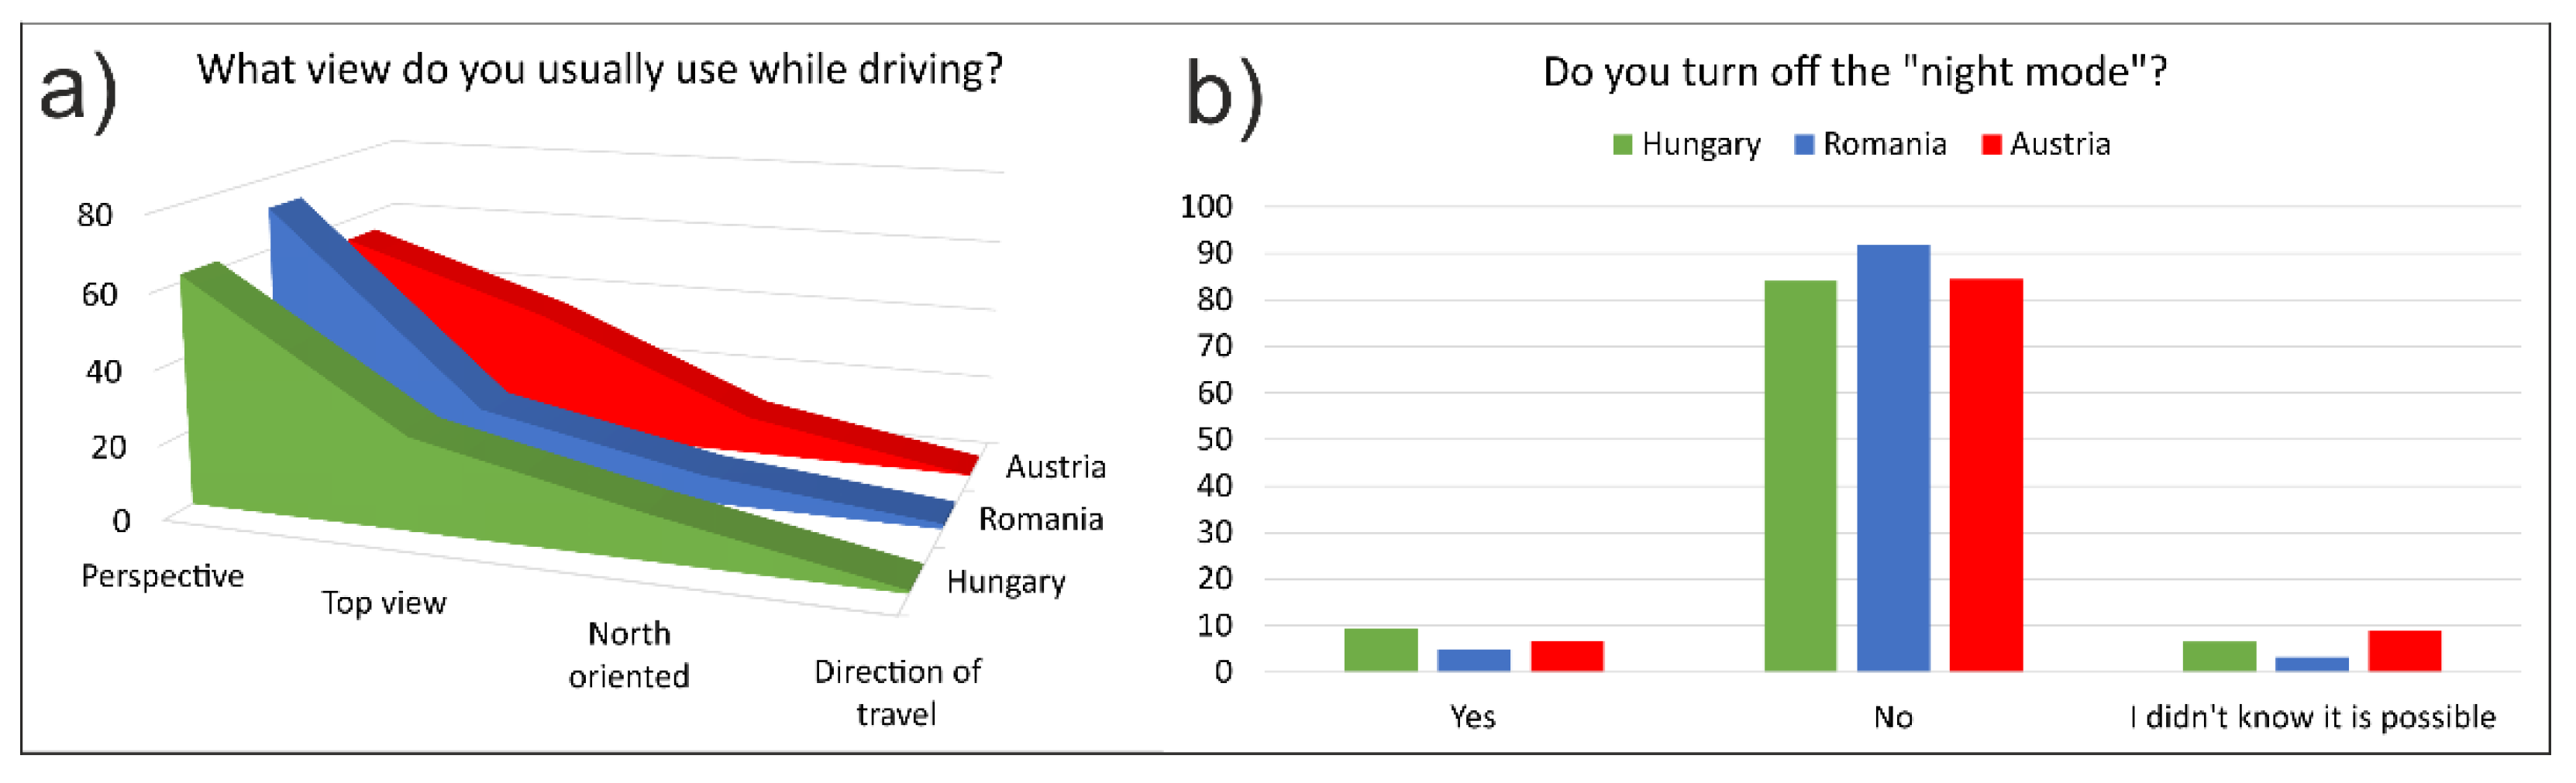
  • Most people use a perspective view (with the facing direction to the north).
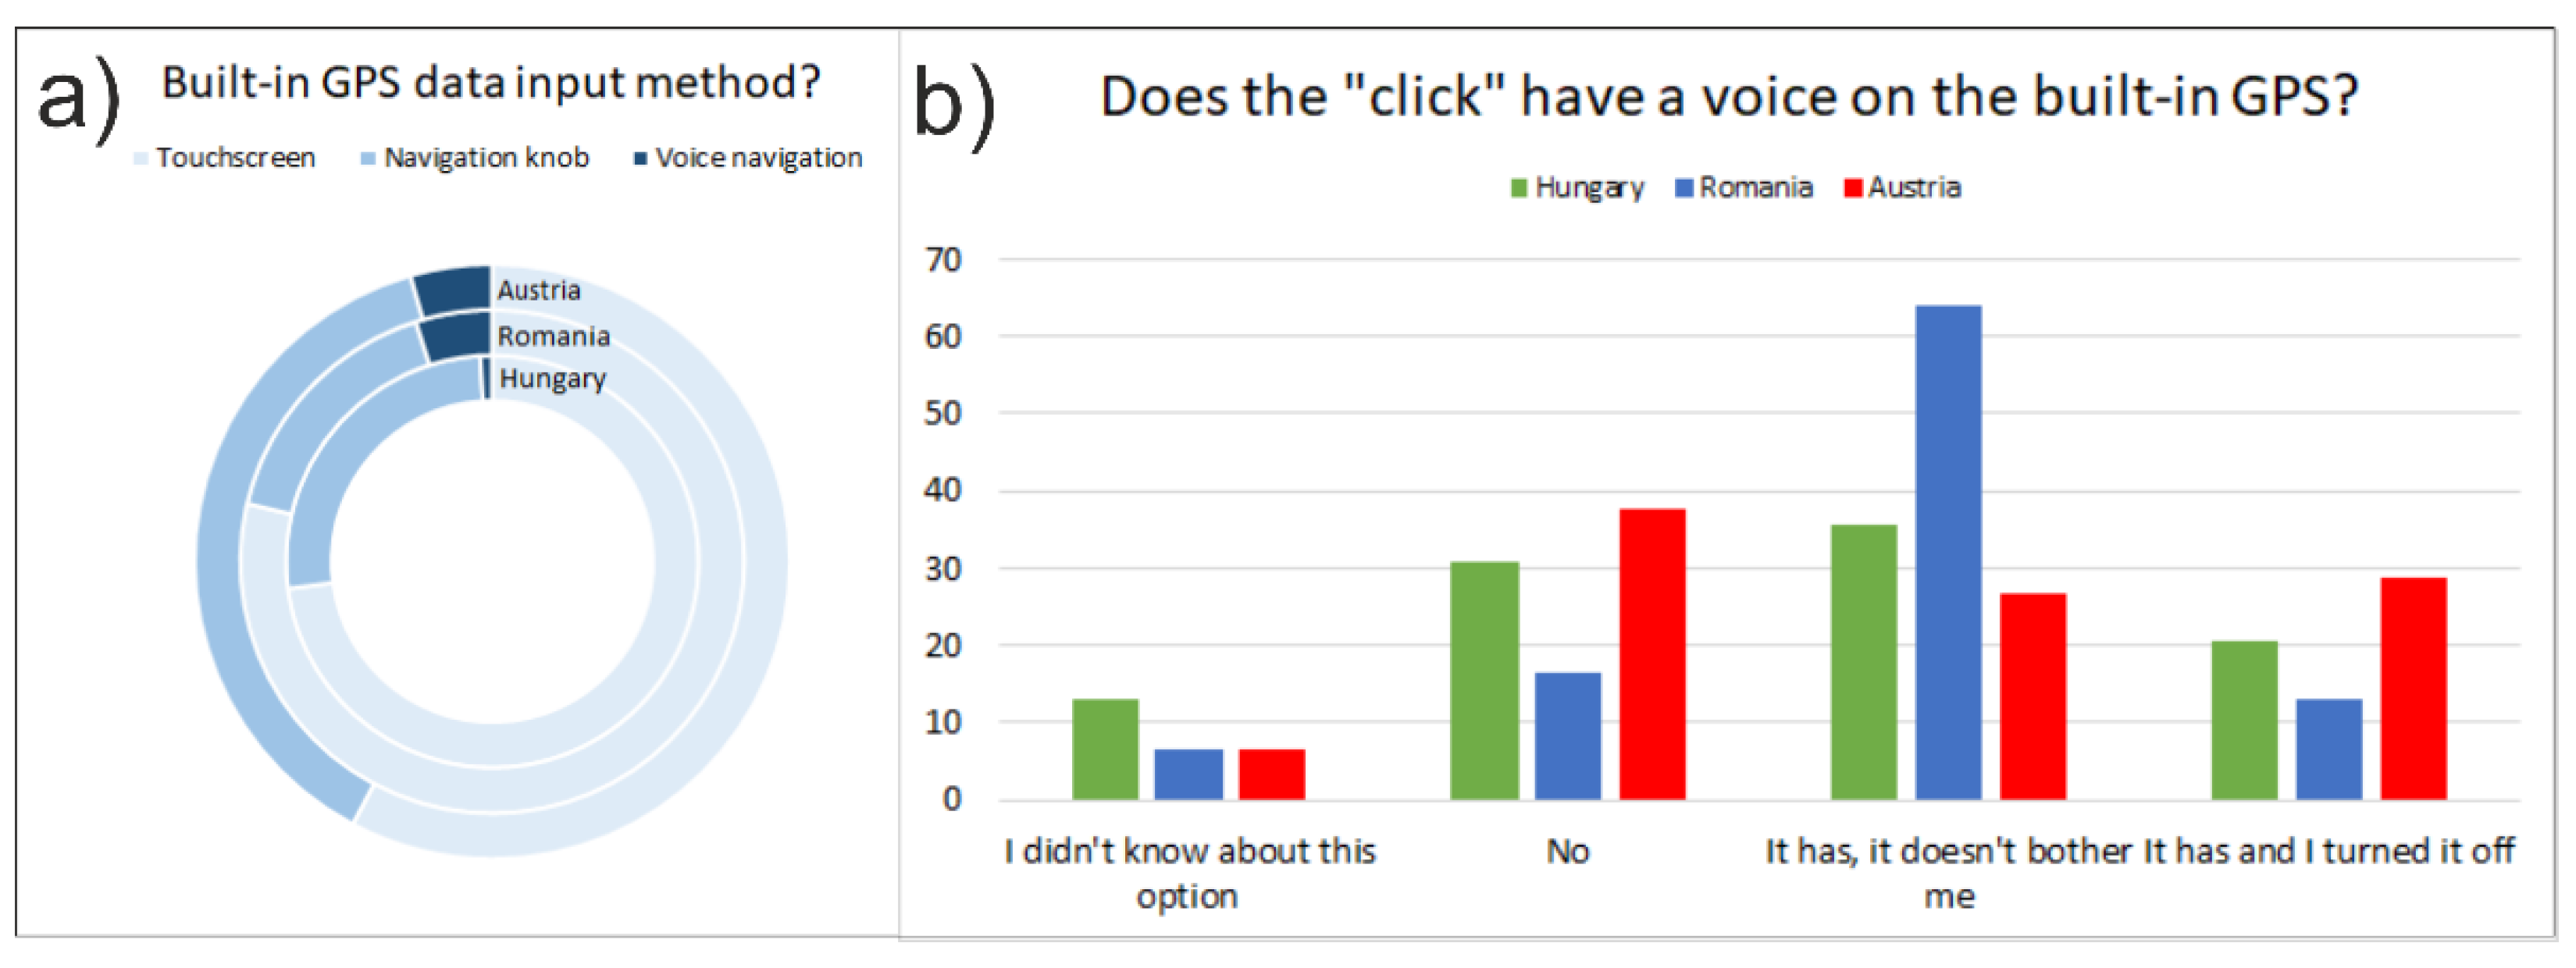
  • Although it was not specifically asked what input method was preferred (just what they currently have), from Figure 4a, we can conclude that: (A) many people are bothered by the navigation knob (it makes it difficult to enter text); and (B) voice navigation is not widely used. Based on these questions, the touchscreen has been designated as the required input.
  • Since only a small percentage of users (~30) indicated that they are specifically bothered by the click sound when they select something on the interface, we concluded that users will also want this sound to some extent.
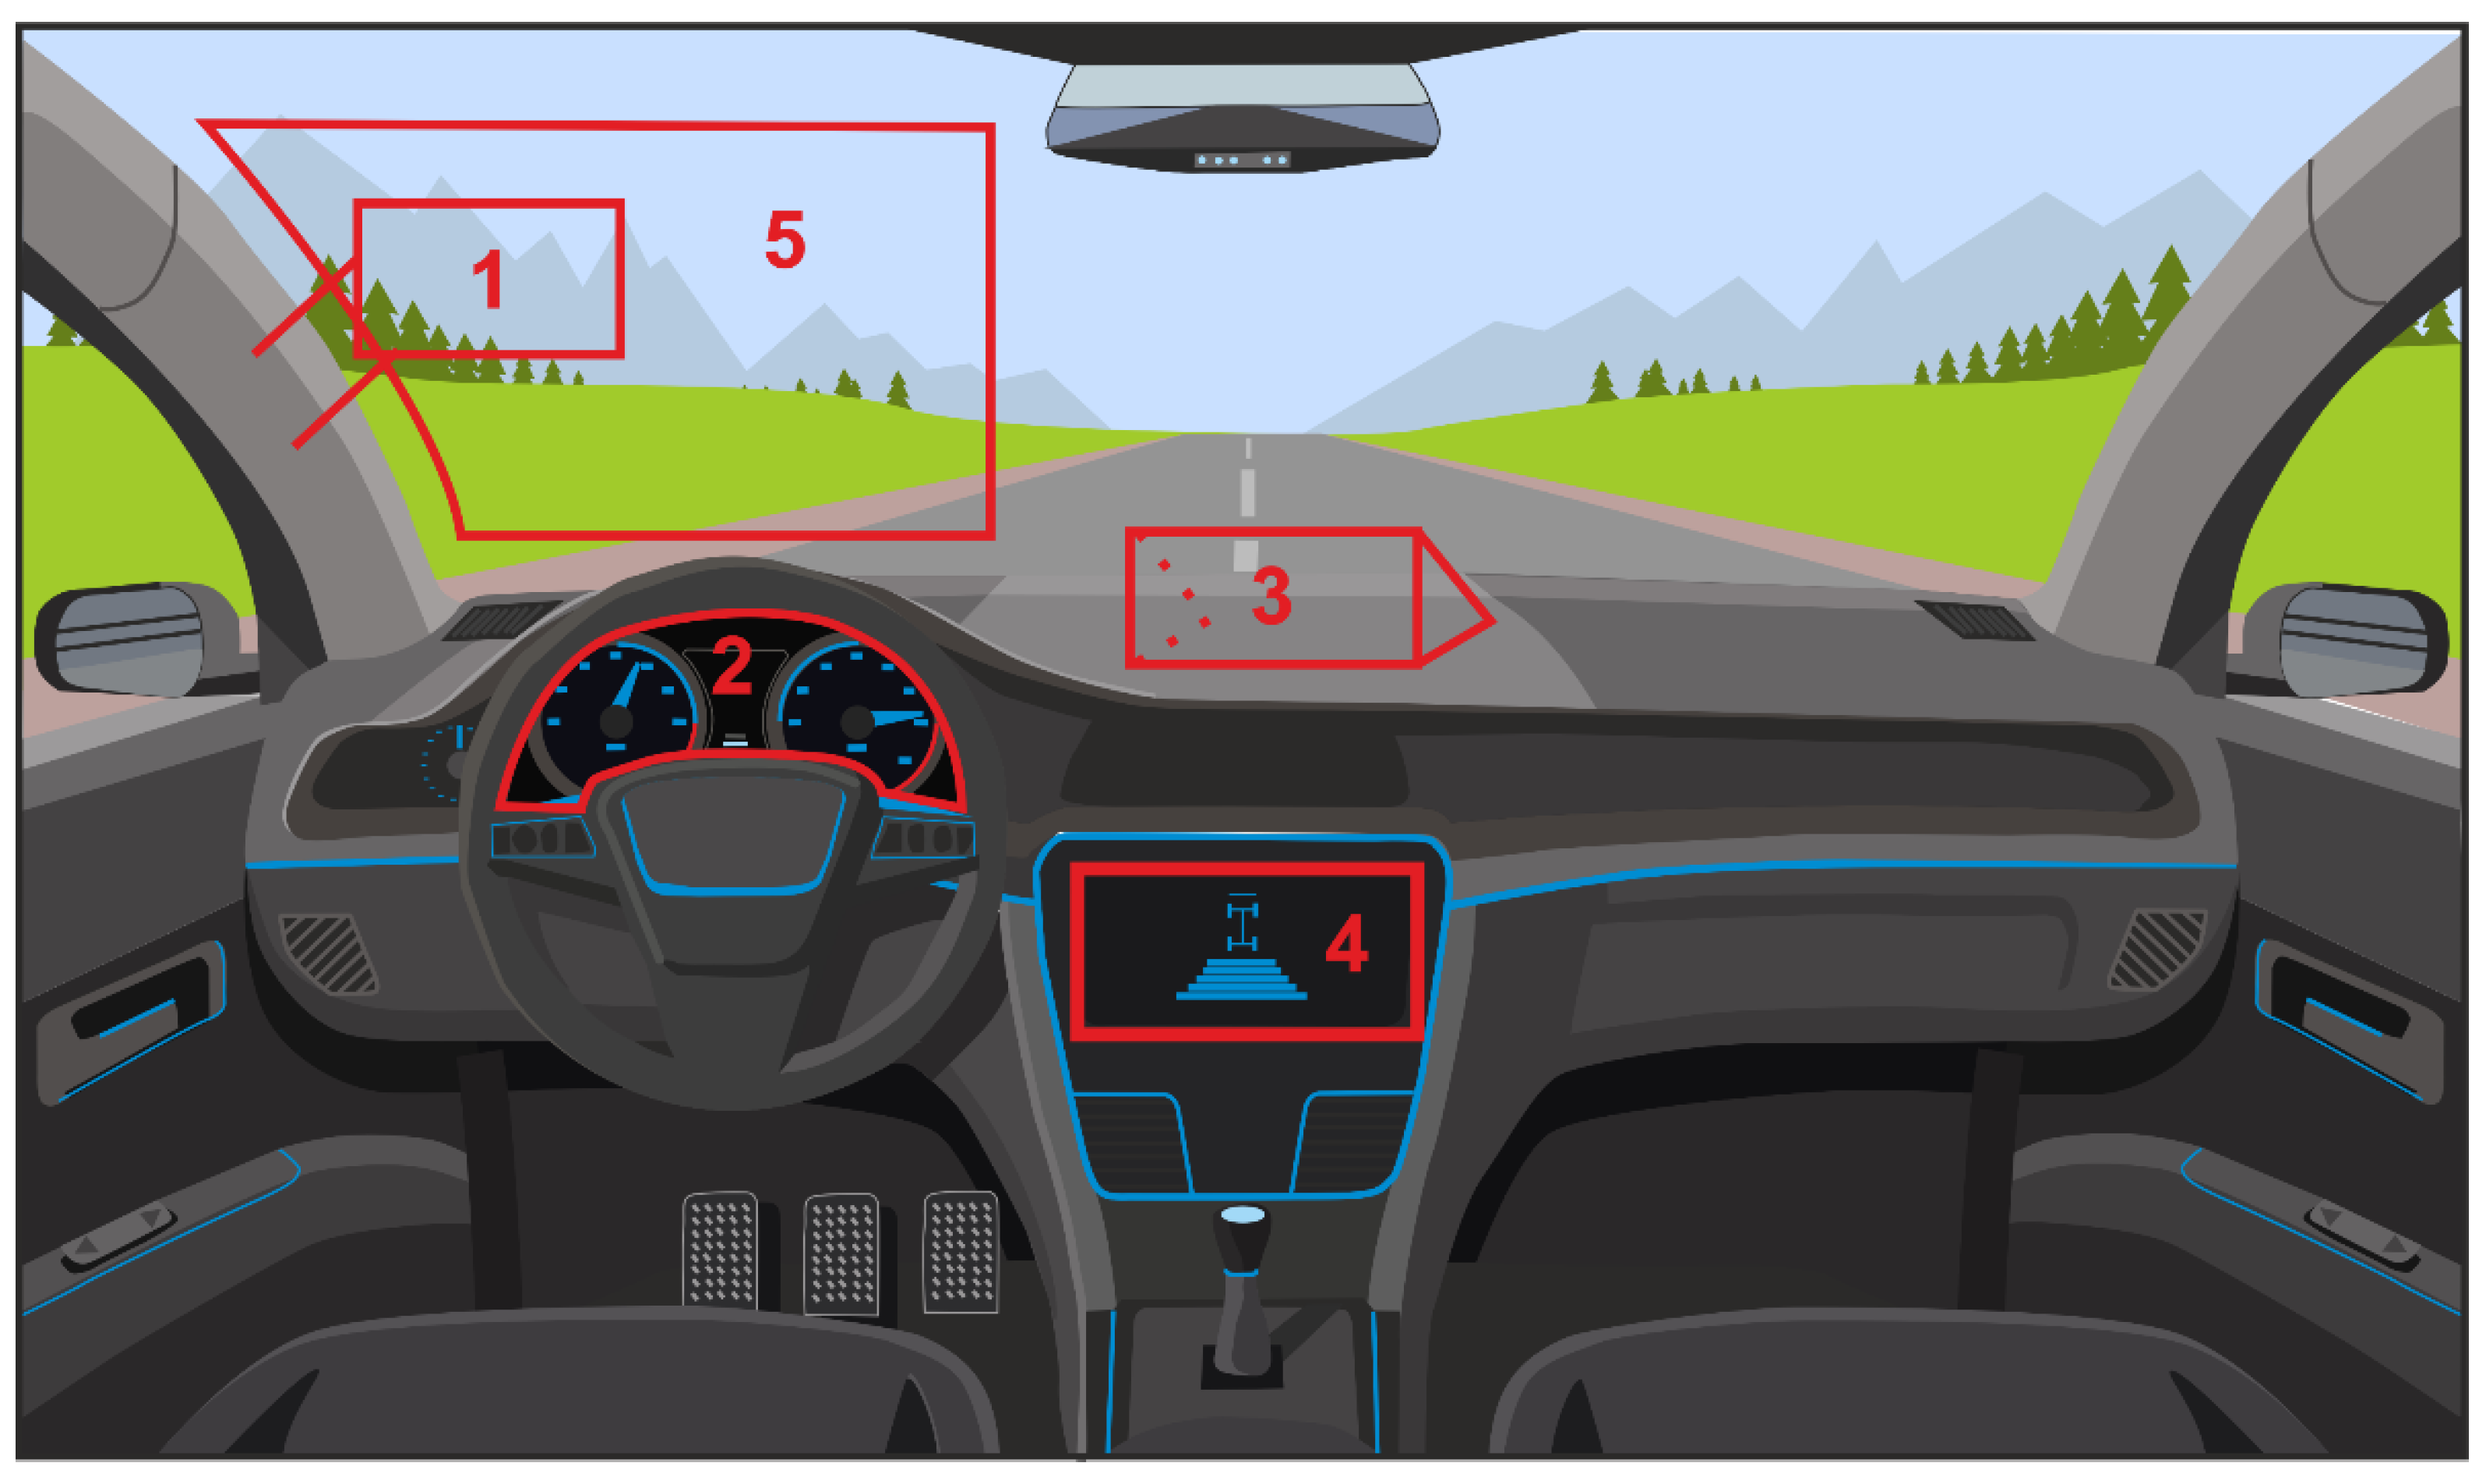
  • Most would prefer the current placement of the navigation interface. The top of the center console also received a similar percentage, so we marked it with a dashed line.
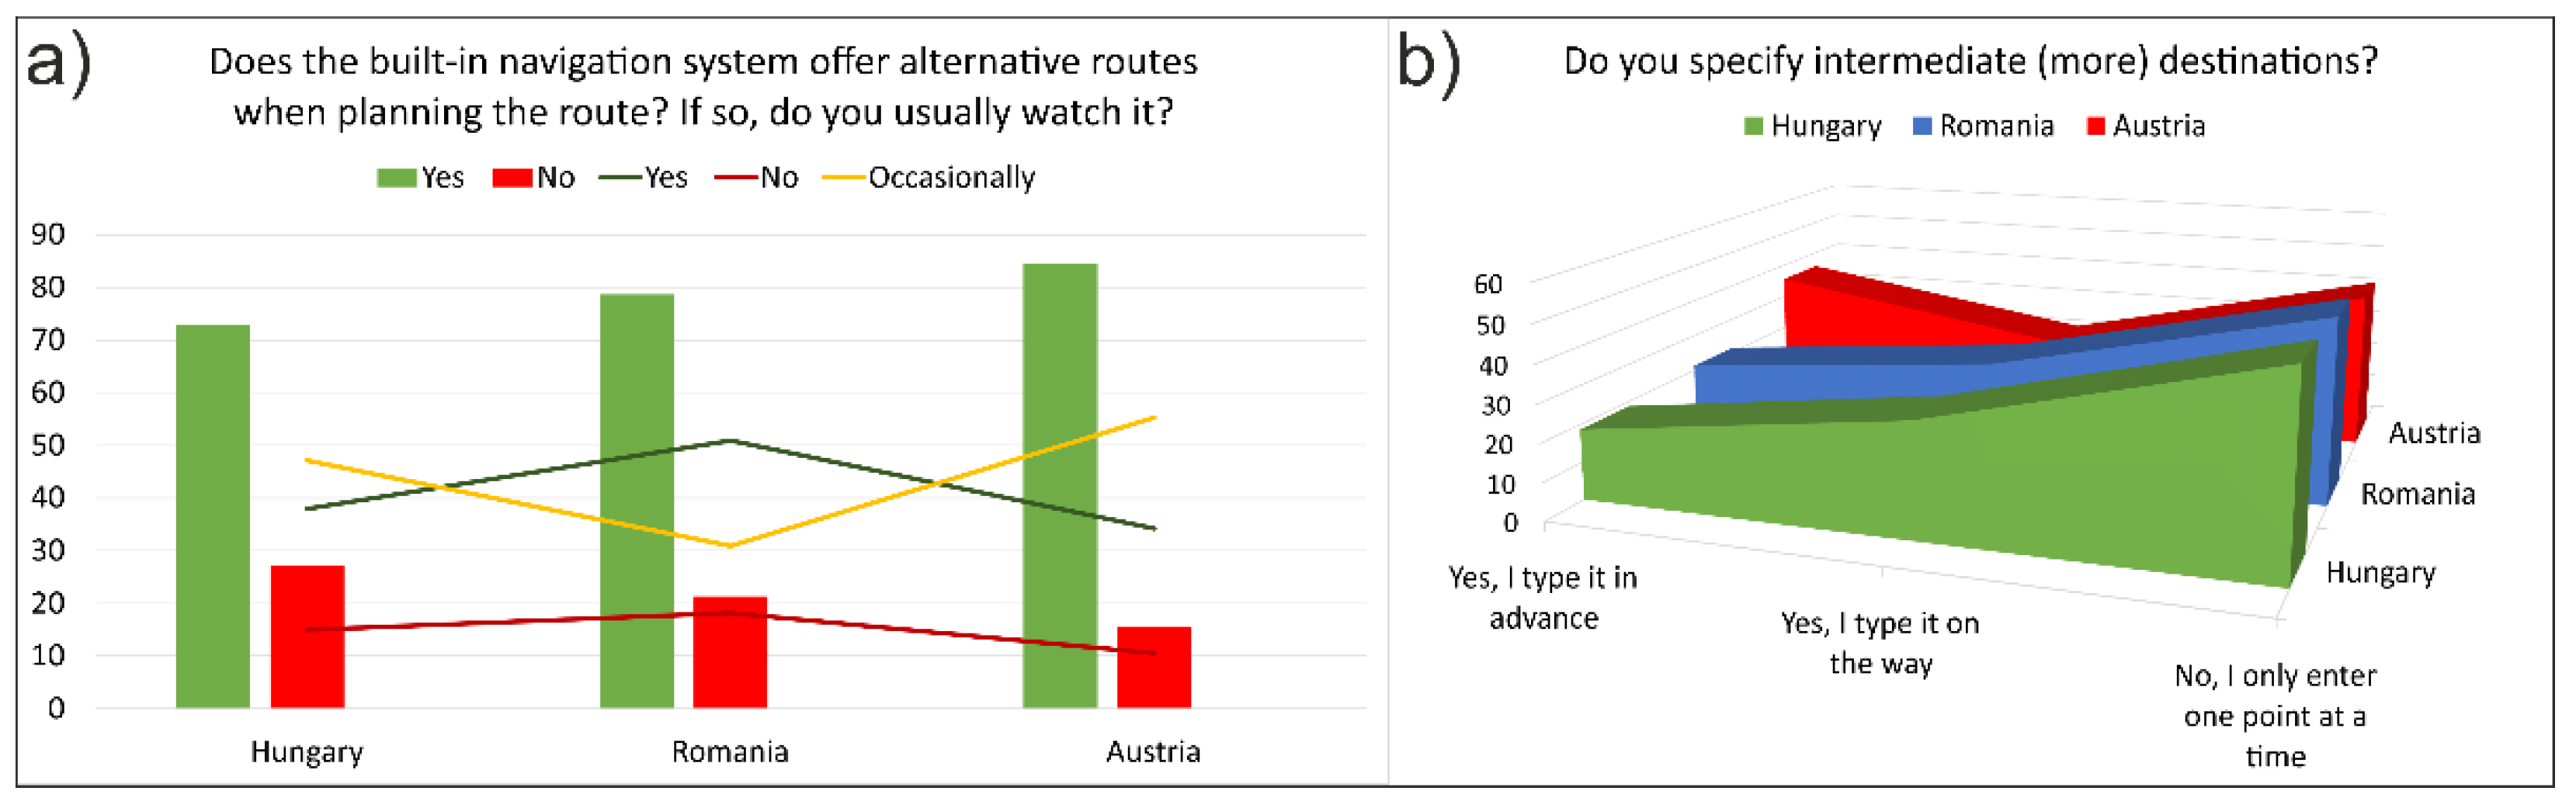
  • Users prefer the night mode and they usually check the alternative routes during planning (gray line in the illustration).
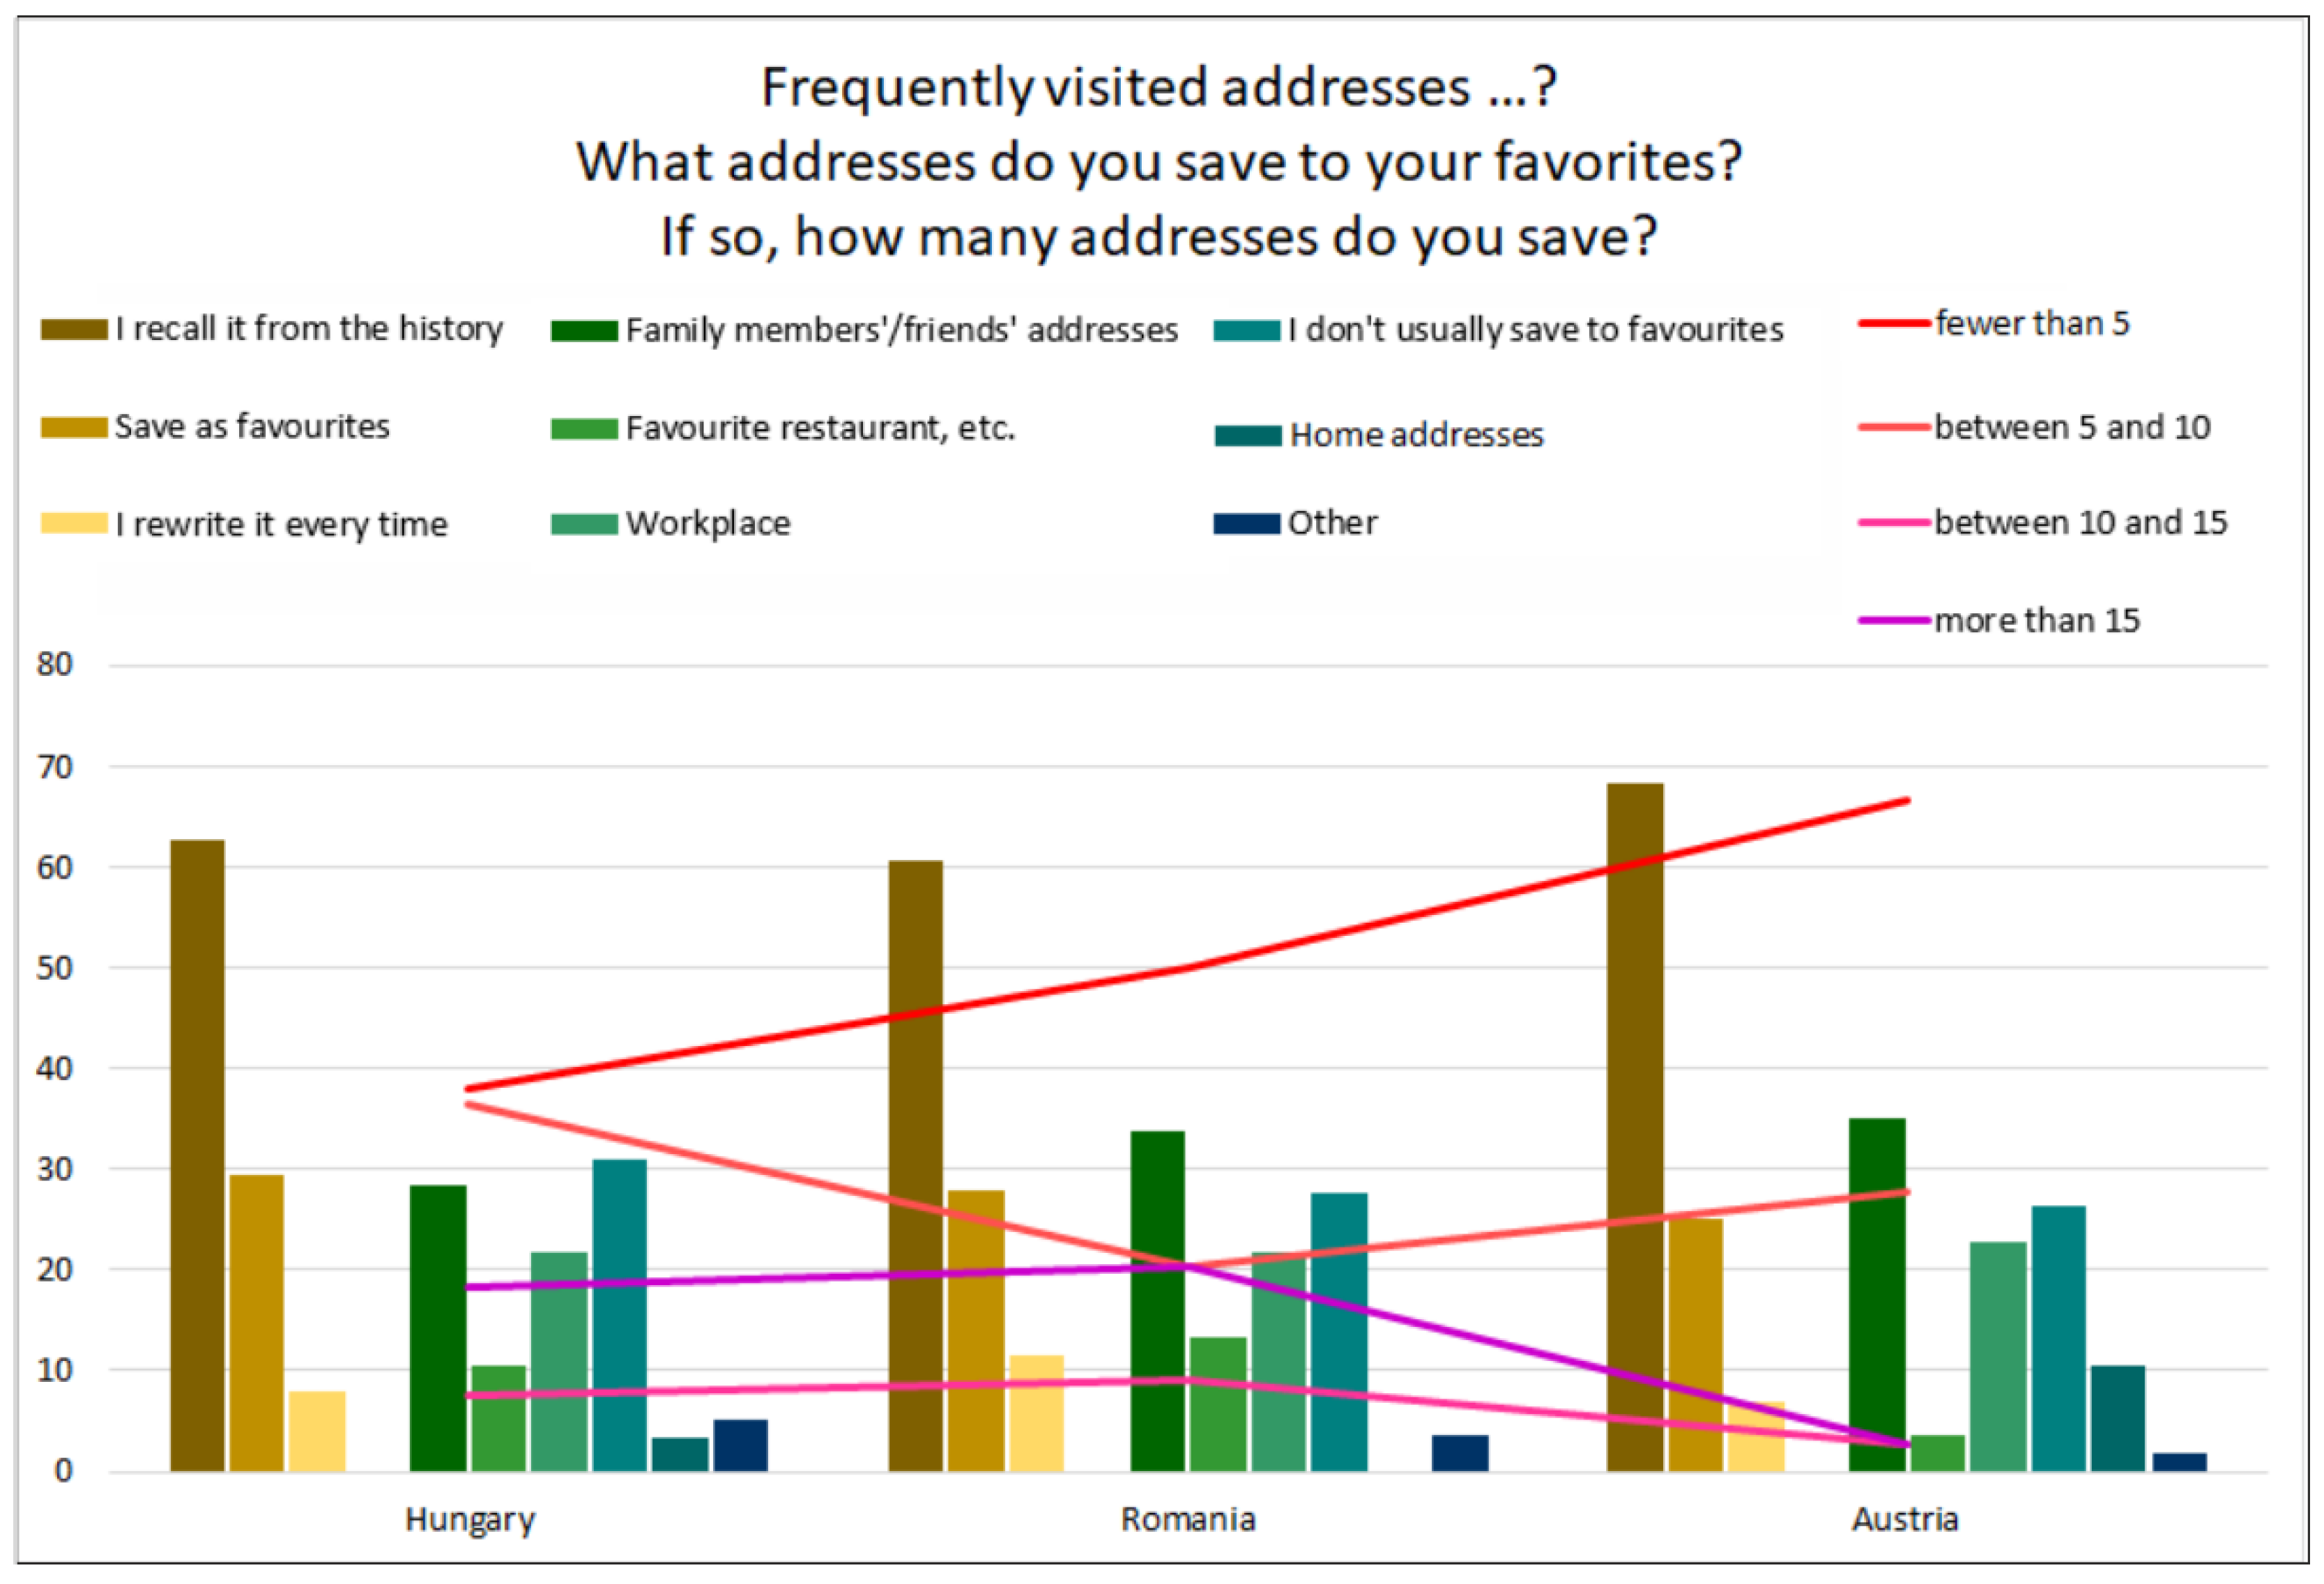
  • Although it is not connected to the map view of the interface, most drivers use history for frequently visited addresses (mostly addresses of family or friends).
Returning to the specific objectives outlined in the introduction:
  • What do GPSs look like today and what are they used for?
In Figure 10, the currently used interfaces can be seen. Respondents have indicated quite a few features that they are seeing in their built-in navigation device. Only a few questions about usage have been highlighted here (see [54,55,56] for more). Based on these, it seems that even though the device incorporates many capabilities, most drivers use it to perform only a few basic tasks.
  • Do drivers consider these devices to be appropriate? If not, what would they prefer?
Whether we look at the responses divided by country (Figure 10) or in total (Figure 11), it is clear that drivers want fewer features on these devices. Perhaps an even bigger problem is that because of the cost of the device (and upgrades), many people prefer to not use the built-in navigation device at all. The lack of traffic information—available for free on a phone app—is a major drawback to built-in GPSs.
  • Are there any differences in the preferences of countries with different economic backgrounds?
If we compare the three countries, the habits and devices of the Austrians differ in several respects. Because they speak a world language, their tools almost always speak to them in their native language. In the case of the other two countries, this may even be explained by the fact that more people may buy a car from a foreign country because it is less expensive. For example, in the case of Hungarian respondents, 65% have a used car and did not have the opportunity to choose what device they wanted in the vehicle. In the case of Austria, this applied to only 37% of respondents. The major difference can be seen in the currently used devices—in terms of its language on the one hand and its level of development on the other. This is advantageous in that it makes it easier to create an interface that is suitable for everyone.

5. Conclusions

In general, it seems that car and navigation companies have likely not carried out the necessary research to make built-in navigation devices really useful to a broad user base. This research can serve as a starting point. The specific findings are as follows:
(1)
Generally speaking, the built-in GPSs currently on the market are overloaded with features. On the one hand, users themselves (regardless of country) seem to require less functionality in the interface, and on the other hand, the existing functions are not fully utilized either.
(2)
From a cartographic point of view, users desire the display of fewer and fewer objects and need them represented in the simplest possible form. Further simplification may be a necessary as a car navigation system is primarily intended to facilitate driving.
(3)
The main downside is the price of these built-in devices. Many people also do not pay to update the data. Thus, these built-in devices will become less useful over time.
(4)
Only a few users take advantage of the more sophisticated features in these devices. Those who do so do it confidently and regularly.
(5)
Due to the different economic backgrounds in the countries surveyed, there are differences in the desired interface. However, when looking at usage habits, these differences become much more negligible.
(6)
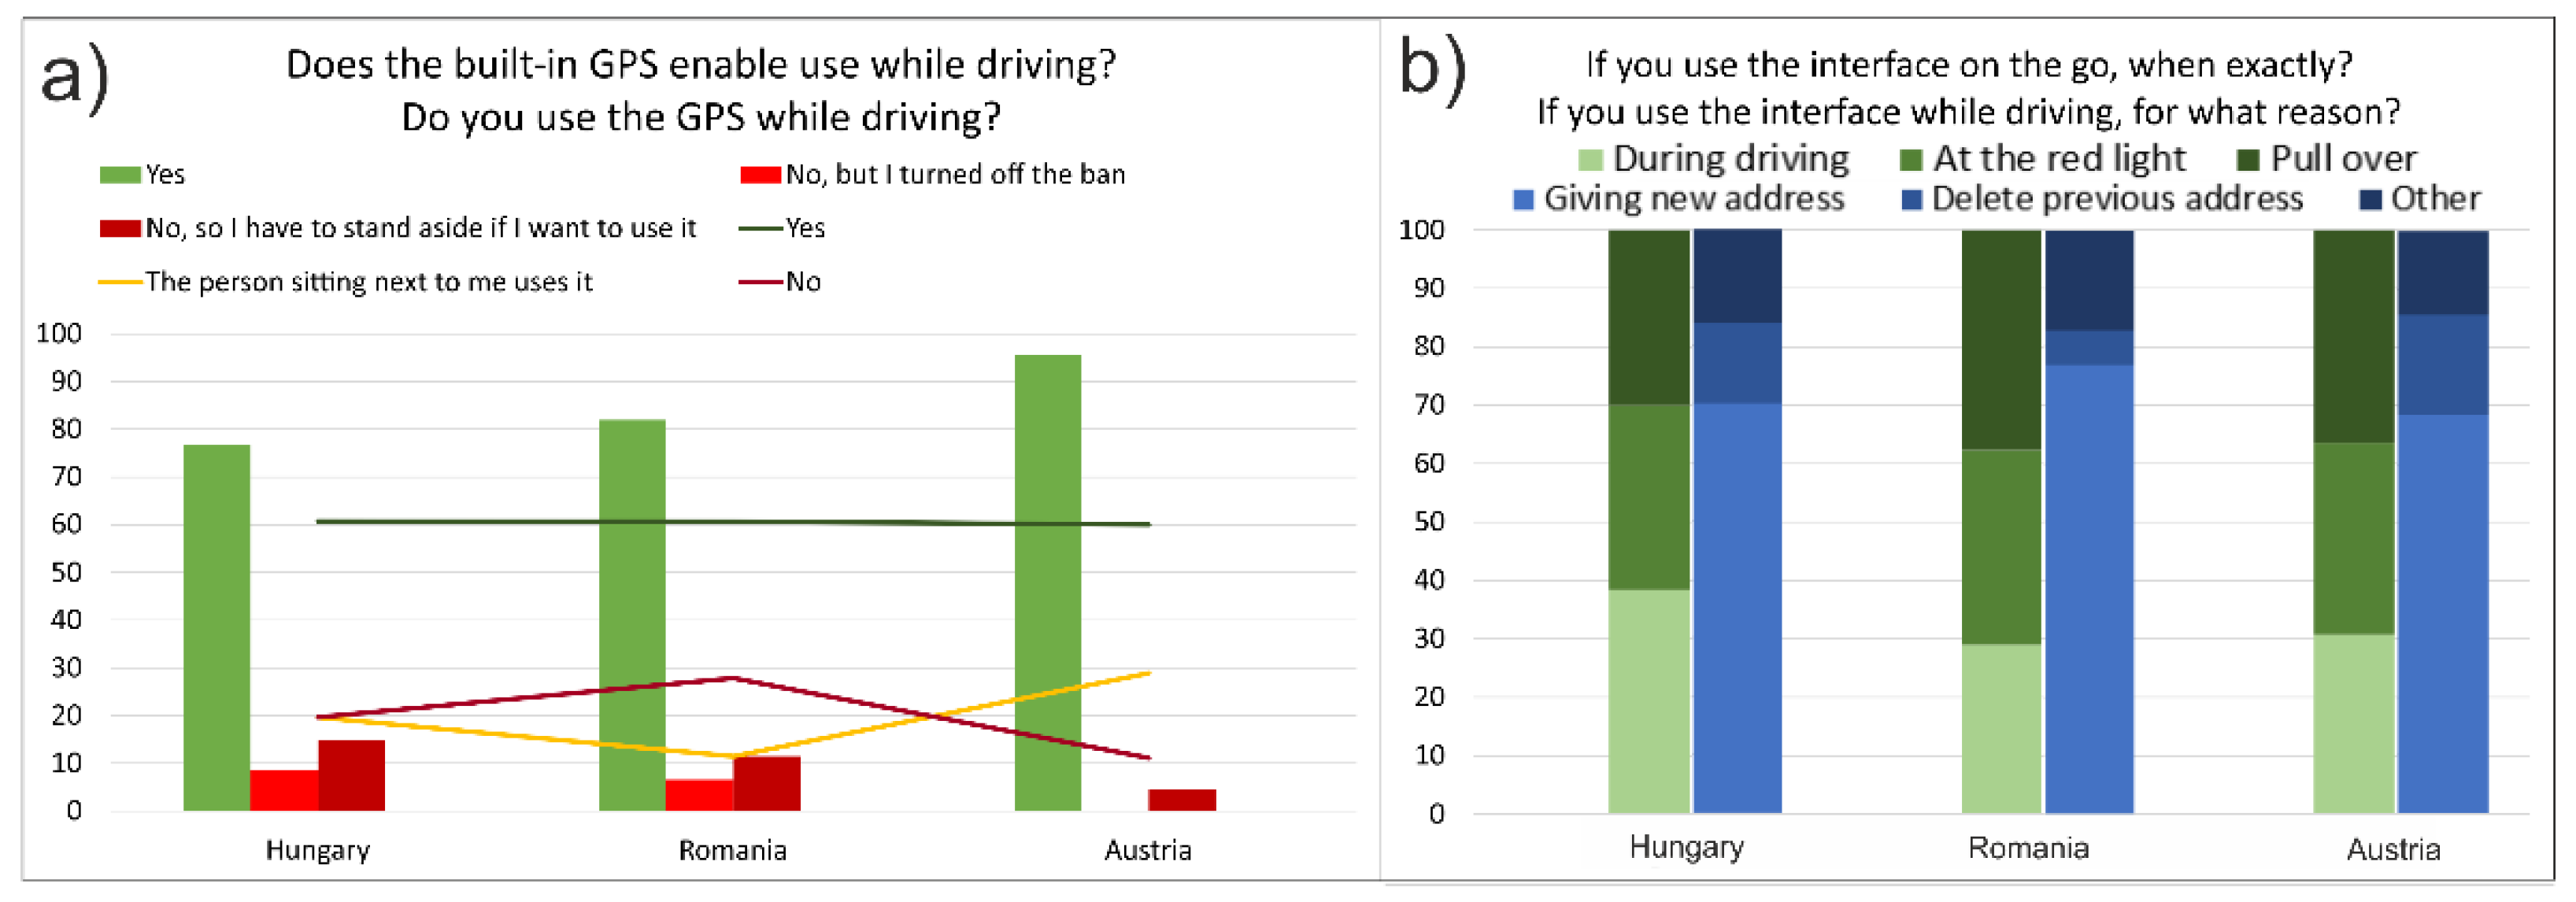
Navigation software companies should notice that a lot of people use the GPS while driving, especially to enter a new address. It may be worth re-thinking this feature to minimize the potential for accidents.
An area of future research associated with navigation devices of all types would be whether map-reading skills are declining as users become more dependent on their devices. It may also be the case that the quality or functionality of mental maps is declining. While navigation devices help us move through the spatial environment, they may not help the user conceive of the space they are traversing. If that is the case, humans will become increasingly dependent on them.

Author Contributions

Conceptualization, F.V., G.G., M.P.P. and B.K.; methodology, F.V.; software, F.V.; validation, B.K., G.G. and M.P.P.; investigation, F.V., G.G., M.P.P. and B.K.; resources, G.G. and M.P.P.; data curation, F.V.; writing—original draft preparation, F.V.; writing—review and editing, G.G. and M.P.P.; visualization, F.V.; funding acquisition, F.V. and B.K. All authors have read and agreed to the published version of the manuscript.

Funding

F.V. is supported by the ÚNKP-21-3 New National Excellence Program of the Ministry for Innovation and Technology from the source of the National Research, Development and Innovation fund. B.K. is supported by the NRDI Fund of Hungary, Thematic Excellence Programme no. TKP2020-NKA-06 (National Challenges Subprogramme) funding scheme.

Institutional Review Board Statement

Not applicable.

Informed Consent Statement

Not applicable.

Data Availability Statement

Not applicable.

Conflicts of Interest

The authors declare no conflict of interest. The funders had no role in the design of the study; in the collection, analyses, or interpretation of data; in the writing of the manuscript or in the decision to publish the results.

References

  1. Münzer, S.; Zimmer, H.D.; Schwalm, M.; Baus, J.; Aslan, I. Computer-assisted navigation and the acquisition of route and survey knowledge. J. Environ. Psychol. 2006, 26, 300–308. [Google Scholar] [CrossRef]
  2. Gartner, G.; Hiller, W. Impact of restricted display size on spatial knowledge acquisition in the context of pedestrian navigation. Lect. Notes Geoinf. Cartogr. 2009, 155–166. [Google Scholar] [CrossRef]
  3. Krausz, N.; Csepinszky, A.; Potó, V.; Barsi, Á. Az autós térképtől az önvezetésig: A járműnavigáció története. Geodézia Kartográfia 2019, 71, 14–18. [Google Scholar] [CrossRef]
  4. Leite, J.P. A Brief History of GPS In-Car Navigation. Available online: https://ndrive.com/brief-history-gps-car-navigation/?fbclid=IwAR3Ddr2-kte_fkHCJhmEVp (accessed on 26 January 2022).
  5. Miller, T. 1966 In-Car Navigation System Looks Very Familiar Today. Available online: https://www.wheels.ca/news/1966-in-car-navigation-system-looks-very-familiar-today/ (accessed on 26 January 2022).
  6. Murph, D. Honda’s 1981 Electro Gyrocator: Vintage Navigation at Its Finest. Available online: https://www.engadget.com/2007-11-30-hondas-1981-electro-gyrocator-vintage-gps-at-its-finest.html?guce_referrer_us=aHR0cHM6Ly9lbi53aWtpcGVkaWEub3JnLw&guce_referre (accessed on 26 January 2022).
  7. Edwards, B. Who Needs GPS? The Forgotten Story of Etak’s Amazing 1985 Car Navigatigation System. Available online: https://www.fastcompany.com/3047828/who-needs-gps-the-forgotten-story-of-etaks-amazing-1985-car-navigation-system (accessed on 26 January 2022).
  8. Evans, S. 1993 Eunos/Mazda Cosmo Classic Drive. Available online: https://www.motortrend.com/reviews/12q2-1993-eunos-mazda-cosmo-drive/ (accessed on 26 January 2022).
  9. Gulde, D. 20 Jahre Navigation: Was Ist Aus Ihnen Geworden? Available online: https://www.auto-motor-und-sport.de/technik/20-jahre-navigation-was-ist-aus-ihnen-geworden/ (accessed on 26 January 2022).
  10. Al Mahmud, A.; Mubin, O.; Shahid, S. User experience with in-car GPS navigation systems. In Proceedings of the 11th International Conference on Human-Computer Interaction with Mobile Devices and Services, Bonn, Germany, 15–18 September 2009. [Google Scholar] [CrossRef]
  11. Varga, G. Navigációs rendszerek használata: Felhasználói szokások és interakciók vizsgálata. BME Mob. Innovációs Központ 2011, 185. Available online: https://www.researchgate.net/publication/338374649_A_hazai_gepkocsivezetok_beepitett_GPS_hasznalati_szokasai_-javaslat_egy_uj_navigacios_felhasznaloi_feluletre (accessed on 20 February 2022).
  12. Mihai, P. Obiceiuri si atitudini in traficul din Romania. Rap. Cont. Futur. Motion 2018. Available online: https://www.promotor.ro/stiri-auto/obiceiuri-si-atitudini-in-traficul-din-romania-studiul-care-dezvaluie-ce-ii-deranjeaza-cel-mai-mult-pe-soferi-in-trafic-17789880 (accessed on 20 February 2022).
  13. Hu, S.; Choudhury, R.R.; Abdelzaher, T.F.; Su, L.; Li, S.; Wang, S.; Pan, C.; Gu, S.; Al Amin, M.T.; Liu, H.; et al. Experiences with eNav: A low-power vehicular navigation system. Exp. Enav. 2015, 433–444. [Google Scholar] [CrossRef]
  14. Nakhimovsky, Y.; Miller, A.T.; Dimopoulos, T.; Siliski, M. Behind the scenes of google maps navigation. Assoc. Comput. Mach. 2010, 3763–3768. [Google Scholar] [CrossRef]
  15. Wang, L.; Ju, D.Y. Concurrent use of an in-vehicle navigation system and a smartphone navigation application. Soc. Behav. Pers. 2015, 43, 1629–1640. [Google Scholar] [CrossRef]
  16. Ortag, F. Sprachausgabe vs. Kartendarstellung in der Fußgängernavigation; Vienna University of Technology: Vienna, Austria, 2005. [Google Scholar]
  17. Ishikawa, T.; Fujiwara, H.; Imai, O.; Okabe, A. Wayfinding with a GPS-based mobile navigation system: A comparison with maps and direct experience. J. Environ. Psychol. 2008, 28, 74–82. [Google Scholar] [CrossRef]
  18. Raper, J.; Gartner, G.; Karimi, H.; Rizos, C. A critical evaluation of location based services and their potential. J. Locat. Based Serv. 2007, 1, 5–45. [Google Scholar] [CrossRef]
  19. Brimicombe, A.; Chao, L. Location-Based Services and Geo-Information Engineering; John Wiley & Sons.: West Sussex, UK, 2009. [Google Scholar]
  20. Raper, J.; Gartner, G.; Karimi, H.; Rizos, C. Applications of location–based services: A selected review. J. Locat. Based Serv. 2007, 1, 89–111. [Google Scholar] [CrossRef]
  21. Huang, H.; Gartner, G.; Krisp, J.M.; Raubal, M.; Van de Weghe, N. Location based services: Ongoing evolution and research agenda. J. Locat. Based Serv. 2018, 12, 63–93. [Google Scholar] [CrossRef]
  22. Gartner, G. Location-based mobile pedestrian navigation services—The role of multimedia cartography. Methods 2003, B, 155–184. [Google Scholar]
  23. Giannopoulos, I.; Kiefer, P.; Raubal, M.; Richter, K.F.; Thrash, T. Wayfinding decision situations: A conceptual model and evaluation. Lect. Notes Comput. Sci. (Incl. Subser. Lect. Notes Artif. Intell. Lect. Notes Bioinform.) 2014, 8728, 221–234. [Google Scholar] [CrossRef]
  24. Fabrikant, S.I.; Goldsberry, K. Thematic Relevance and Perceptual Salience of Dynamic Geovisualization Displays. In Proceedings of the 22th ICA/ACI International Cartographic Conference, A Coruña, Spain, 9–16 July 2005; Volume 1, pp. 11–16. [Google Scholar]
  25. Boucheix, J.M.; Lowe, R.K. An eye tracking comparison of external pointing cues and internal continuous cues in learning with complex animations. Learn. Instr. 2010, 20, 123–135. [Google Scholar] [CrossRef]
  26. Ware, C. Information Visualisation: Perception for Design, 4th ed.; Kaufmann, M., Ed.; Elsevier: San Francisco, CA, USA, 2013; ISBN 978-0-12-812875-6. [Google Scholar]
  27. Thrash, T.; Fabrikant, S.I.; Brügger, A.; Do, C.T.; Huang, H.; Richter, K.F.; Lanini-Maggi, S.; Bertel, S.; Credé, S.; Gartner, G.; et al. The future of geographic information displays from giscience, cartographic, and cognitive science perspectives. In Proceedings of the 14th International Conference on Spatial Information Theory (COSIT 2019), Regensburg, Germany, 9–13 September 2019; Volume 142. [Google Scholar] [CrossRef]
  28. Dey, A.K. Understanding and using context. Pers. Ubiquitous Comput. 2001, 5, 4–7. [Google Scholar] [CrossRef]
  29. Griffin, A.L.; White, T.; Fish, C.; Tomio, B.; Huang, H.; Sluter, C.R.; Bravo, J.V.M.; Fabrikant, S.I.; Bleisch, S.; Yamada, M.; et al. Designing across map use contexts: A research agenda. Int. J. Cartogr. 2017, 3, 90–114. [Google Scholar] [CrossRef] [Green Version]
  30. Bertin, J.; William, J.B.; Wainer, H. Semiology of graphics: Diagrams, Networks, Maps, Volume 1; University of Wisconsin Press: Madison, WI, USA, 1983. [Google Scholar]
  31. Roth, R.E. Visual Variables. Int. Encycl. Geogr. 2017, 1–11. [Google Scholar] [CrossRef]
  32. Delikostidis, I.; Van Elzakker, C.P.J.M.; Kraak, M.J. Overcoming challenges in developing more usable pedestrian navigation systems. Cartogr. Geogr. Inf. Sci. 2016, 43, 189–207. [Google Scholar] [CrossRef]
  33. Scaife, M.; Rogers, Y. External cognition: How do graphical representations work? Int. J. Hum. Comput. Stud. 1996, 45, 185–213. [Google Scholar] [CrossRef] [Green Version]
  34. Hegarty, M.; Smallman, H.S.; Stull, A.T.; Canham, M.S. Naïve cartography: How intuitions about display configuration can hurt performance. Cartographica 2009, 44, 171–186. [Google Scholar] [CrossRef]
  35. Maggi, S.; Fabrikant, S.I.; Imbert, J.P.; Hurter, C. How do display design and user characteristics matter in animations? An empirical study with air traffic control displays. Cartographica 2016, 51, 25–37. [Google Scholar] [CrossRef]
  36. Gardony, A.; Brunyé, T.T.; Mahoney, C.R.; Taylor, H.A. Affective states influence spatial cue utilization during navigation. Presence Teleoperators Virtual Environ. 2011, 20, 223–240. [Google Scholar] [CrossRef]
  37. Thorndyke, P.W.; Hayes-Roth, B. Differences in spatial knowledge acquired from maps and navigation. Cogn. Psychol. 1982, 14, 560–589. [Google Scholar] [CrossRef]
  38. Münzer, S.; Zimmer, H.D.; Baus, J. Navigation assistance: A trade-off between wayfinding support and configural learning support. J. Exp. Psychol. Appl. 2012, 18, 18–37. [Google Scholar] [CrossRef] [PubMed]
  39. Bakdash, J.Z.; Linkenauger, S.A.; Itt, D.P. Comparing decision-making and control for learning a virtual environment: Backseat drivers learn where they are going. In Proceedings of the Human Factors and Ergonomics Society Annual Meeting; SAGE Publications: Los Angeles, CA, USA, 2008; Volume 3, pp. 2117–2121. [Google Scholar] [CrossRef] [Green Version]
  40. Chung, J.; Pagnini, F.; Langer, E. Mindful navigation for pedestrians: Improving engagement with augmented reality. Technol. Soc. 2016, 45, 29–33. [Google Scholar] [CrossRef]
  41. Gardony, A.L.; Brunyé, T.T.; Mahoney, C.R.; Taylor, H.A. How Navigational Aids Impair Spatial Memory: Evidence for Divided Attention. Spat. Cogn. Comput. 2013, 13, 319–350. [Google Scholar] [CrossRef]
  42. Gardony, A.L.; Brunyé, T.T.; Taylor, H.A. Navigational Aids and Spatial Memory Impairment: The Role of Divided Attention. Spat. Cogn. Comput. 2015, 15, 246–284. [Google Scholar] [CrossRef]
  43. Forlizzi, J.; Battarbee, K. Understanding experience in interactive systems. DIS2004—Des. Interact. Syst. Across Spectr. 2004, 261–268. [Google Scholar] [CrossRef]
  44. Alben, L. Quality of experience: Defining the criteria for effective interaction design. Interact. Stud. Commun. Cult. 1996, 3, 11–15. [Google Scholar] [CrossRef]
  45. Leshed, G.; Velden, T.; Rieger, O.; Kot, B.; Sengers, P. In-car GPS navigation: Engagement with and disengagement from the environment. In Proceedings of the SIGCHI Conference on Human Factors in Computing Systems, Florence, Italy, 5–10 April 2008; pp. 1675–1684. [Google Scholar] [CrossRef]
  46. McClelland, S.B. Training Needs Assessment Data-gathering Methods: Part 1, Survey Questionnaires. J. Eur. Ind. Train. 1994, 18, 22–26. [Google Scholar] [CrossRef]
  47. Stone, D.H. Design a questionnaire. Br. Med. J. 1993, 307, 1264–1266. [Google Scholar] [CrossRef] [PubMed] [Green Version]
  48. Wilson, J. Essentials of Business Research: A Guide to Doing Your Research Project, 2nd ed.; Seaman, J., Ed.; SAGE Publications: Los Angeles, CA, USA, 2014; ISBN 978-1-4462-5732-6. [Google Scholar]
  49. Tavakol, M.; Sandars, J. Quantitative and qualitative methods in medical education research: AMEE Guide No. 90: Part II. Med. Teach. 2014, 36, 838–848. [Google Scholar] [CrossRef] [PubMed]
  50. Thwaites Bee, D.; Murdoch-Eaton, D. Questionnaire design: The good, the bad and the pitfalls. Arch. Dis. Child. Educ. Pract. Ed. 2016, 101, 210–212. [Google Scholar] [CrossRef] [PubMed]
  51. Malcolm, W. Making Sense of Social Researc; Sage: London, UK, 2003; ISBN 0761964215. [Google Scholar]
  52. Rowley, J. Designing and using research questionnaires. Manag. Res. Rev. 2014, 37, 308–330. [Google Scholar] [CrossRef]
  53. VectorStock—Vector Art, Images, Graphics & Clipart. Available online: https://www.vectorstock.com/ (accessed on 7 February 2022).
  54. Vörös, F.; Gartner, G.; Kovács, B. Driving and navigation habits of Austrian drivers. Proc. ICA 2021, 4, 1–8. [Google Scholar] [CrossRef]
  55. Vörös, F.; Magyari, M.; Kovács, B. Hungarian and Romanian user needs of built-in car navigation systems. In Proceedings of the Proceedings Vol. 1, 8th International Conference on Cartography and GIS; Bandrova, T., Konečný, M., Marinova, S., Eds.; Bulgarian Cartographic Association: Nessebar, Bulgaria, 2020. [Google Scholar]
  56. Vörös, F.; Tompos, Z.; Kovács, B. Examination of car navigation systems and UX designs—Suggestion for a new interface. Proc. ICA 2019, 2, 1–7. [Google Scholar] [CrossRef]
Figure 1. The three countries examined: Austria, Hungary and Romania.
Applsci 12 03716 g001
Figure 2. Structure of the online questionnaire.
Applsci 12 03716 g002
Figure 3. Answers about the sound effects I: (a) the output and (b) the input possibilities for voice navigation.
Applsci 12 03716 g003
Figure 4. Answers about the sound effects II: (a) possible data input methods and (b) appearance of the “click” sound.
Applsci 12 03716 g004
Figure 5. Answers about the (a) view and (b) night mode.
Applsci 12 03716 g005
Figure 6. Possible placements for the navigation interface (based on a [53] image).
Applsci 12 03716 g006
Figure 7. Answers about (a) alternative routes and (b) intermediate destinations.
Applsci 12 03716 g007
Figure 8. Answers about frequently visited addresses.
Applsci 12 03716 g008
Figure 9. Answers about (a) GPS usage while driving and (b) the reasons for the interface usage.
Applsci 12 03716 g009
Figure 10. The current and the recommended interfaces by country—Hungary, Romania and Austria.
Applsci 12 03716 g010
Figure 11. The ideal built-in navigation interface based on 213 answers from three countries.
Applsci 12 03716 g011
Table 1. The questions elaborated for this paper, and the number of respondents for each country.
QuestionAnswers
-Hungary-
Answers
-Romania-
Answers
-Austria-
Does the built-in GPS navigate you loudly?1076145
What view do you usually use while driving?1076145
Can you control the system with voice control?1076145
If yes, do you use it?775627
Built-in GPS data input method?1076145
Does the “click” has a voice on the built-in GPS?1076145
Now where is the built-in navigation in your car?1076145
Where would you place the navigation information (e.g., arrow) in your area?1076145
What do you dislike about your current navigation system?643314
What are you missing?543310
Do you turn off the “night mode”?1076145
If yes, why?1254
Does the in-built navigation system offer alternative routes when planning a route?1076145
If so, do you usually watch it?875536
Do you specify intermediate (more) destinations (e.g., gas station, restaurant)?1076145
Frequently visited addresses …?1076145
What addresses do you save to your favourites?1076145
If so, how many addresses do you save?664436
Does the built-in GPS enable use while driving?1076145
Do you use the GPS while driving?1076145
If you use the interface on the go, when exactly?855036
If you use the interface while driving, for what reason?814531
While you drive, the map view on your current built-in GPS displays the following…995943
What would you like to see on this “home screen” if you could set it up for yourself? (What features would you like to achieve with a single click?)895943
Table 2. Current and recommended placements in percentage distribution.
PlacementCurrently
-Hungary-
Currently
-Romania-
Currently
-Austria-
Recommended
-Hungary-
Recommended
-Romania-
Recommended
-Austria-
10%0%0%3.7%0%2.2%
212.2%4.9%2.2%22.4%18%15.6%
317.8%19.7%20%25.2%31.2%22.2%
466.4%73.8%75.6%24.3%34.4%48.9%
53.7%1.6%2.2%24.3%16.4%11.1%
Table 3. Optional features and their current appearance by country.
FunctionCurrent Interface
-Hungary-
Current Interface
-Romania-
Current Interface
-Austria-
Add new destination button +
Altitude+
Arrival address++
Arrival distance+++
Arrival time+++
Arrival weather
Delete previous destination button
Fuel consumption
GPS accuracy +
Lane assist++
Local time+++
Map+++
Mute++
North direction++
POIs next to route++
Radio++
Route number++
Settings button+++
Speed value+++
Street name+++
Traffic information++
Turning direction+++
Turning distance+++
Zoom button+++
Table 4. Optional features and the needs by country.
FunctionRecommended
Interface
-Hungary-
Recommended
Interface
-Romania-
Recommended
Interface
-Austria-
Add new destination button
Altitude +
Arrival address+
Arrival distance+++
Arrival time+++
Arrival weather
Delete previous destination button
Fuel consumption
GPS accuracy
Lane assist+++
Local time+++
Map+++
Mute +
North direction+ +
POIs next to route
Radio
Route number+++
Settings button+++
Speed value+ +
Street name+++
Traffic information++
Turning direction+++
Turning distance+++
Zoom button+++
Table 5. Results of the Fisher’s exact test. Significant differences (p < 0.05) in red.
Questionp Value
Hungary-Romania
p Value
Hungary-Austria
p Value
Romania-Austria
Does the built-in GPS navigate you loudly?0.0604<0.000010.0118
Can you control the system with voice control?0.07570.00430.3229
Built-in GPS data input method?0.46180.08550.0316
Does the “click” has a voice on the built-in GPS?0.00040.34650.0002
Where would you place the navigation information (e.g., arrow) in your area?0.21060.00410.163
Do you turn off the “night mode”?0.37460.75630.6869
(Does the built-in navigation system offer alternative routes when planning the route?)
If so, do you usually watch it?
111
Does the built-in GPS enable use while driving?0.44280.00470.0398
Do you use the GPS while driving?111
Publisher’s Note: MDPI stays neutral with regard to jurisdictional claims in published maps and institutional affiliations.

