
A Numerical Study on Fuel Injection Optimization for a ME-GI Dual-Fuel Marine Engine Based on CFD Analysis


Abstract
:1. Introduction
2. Numerical Analysis
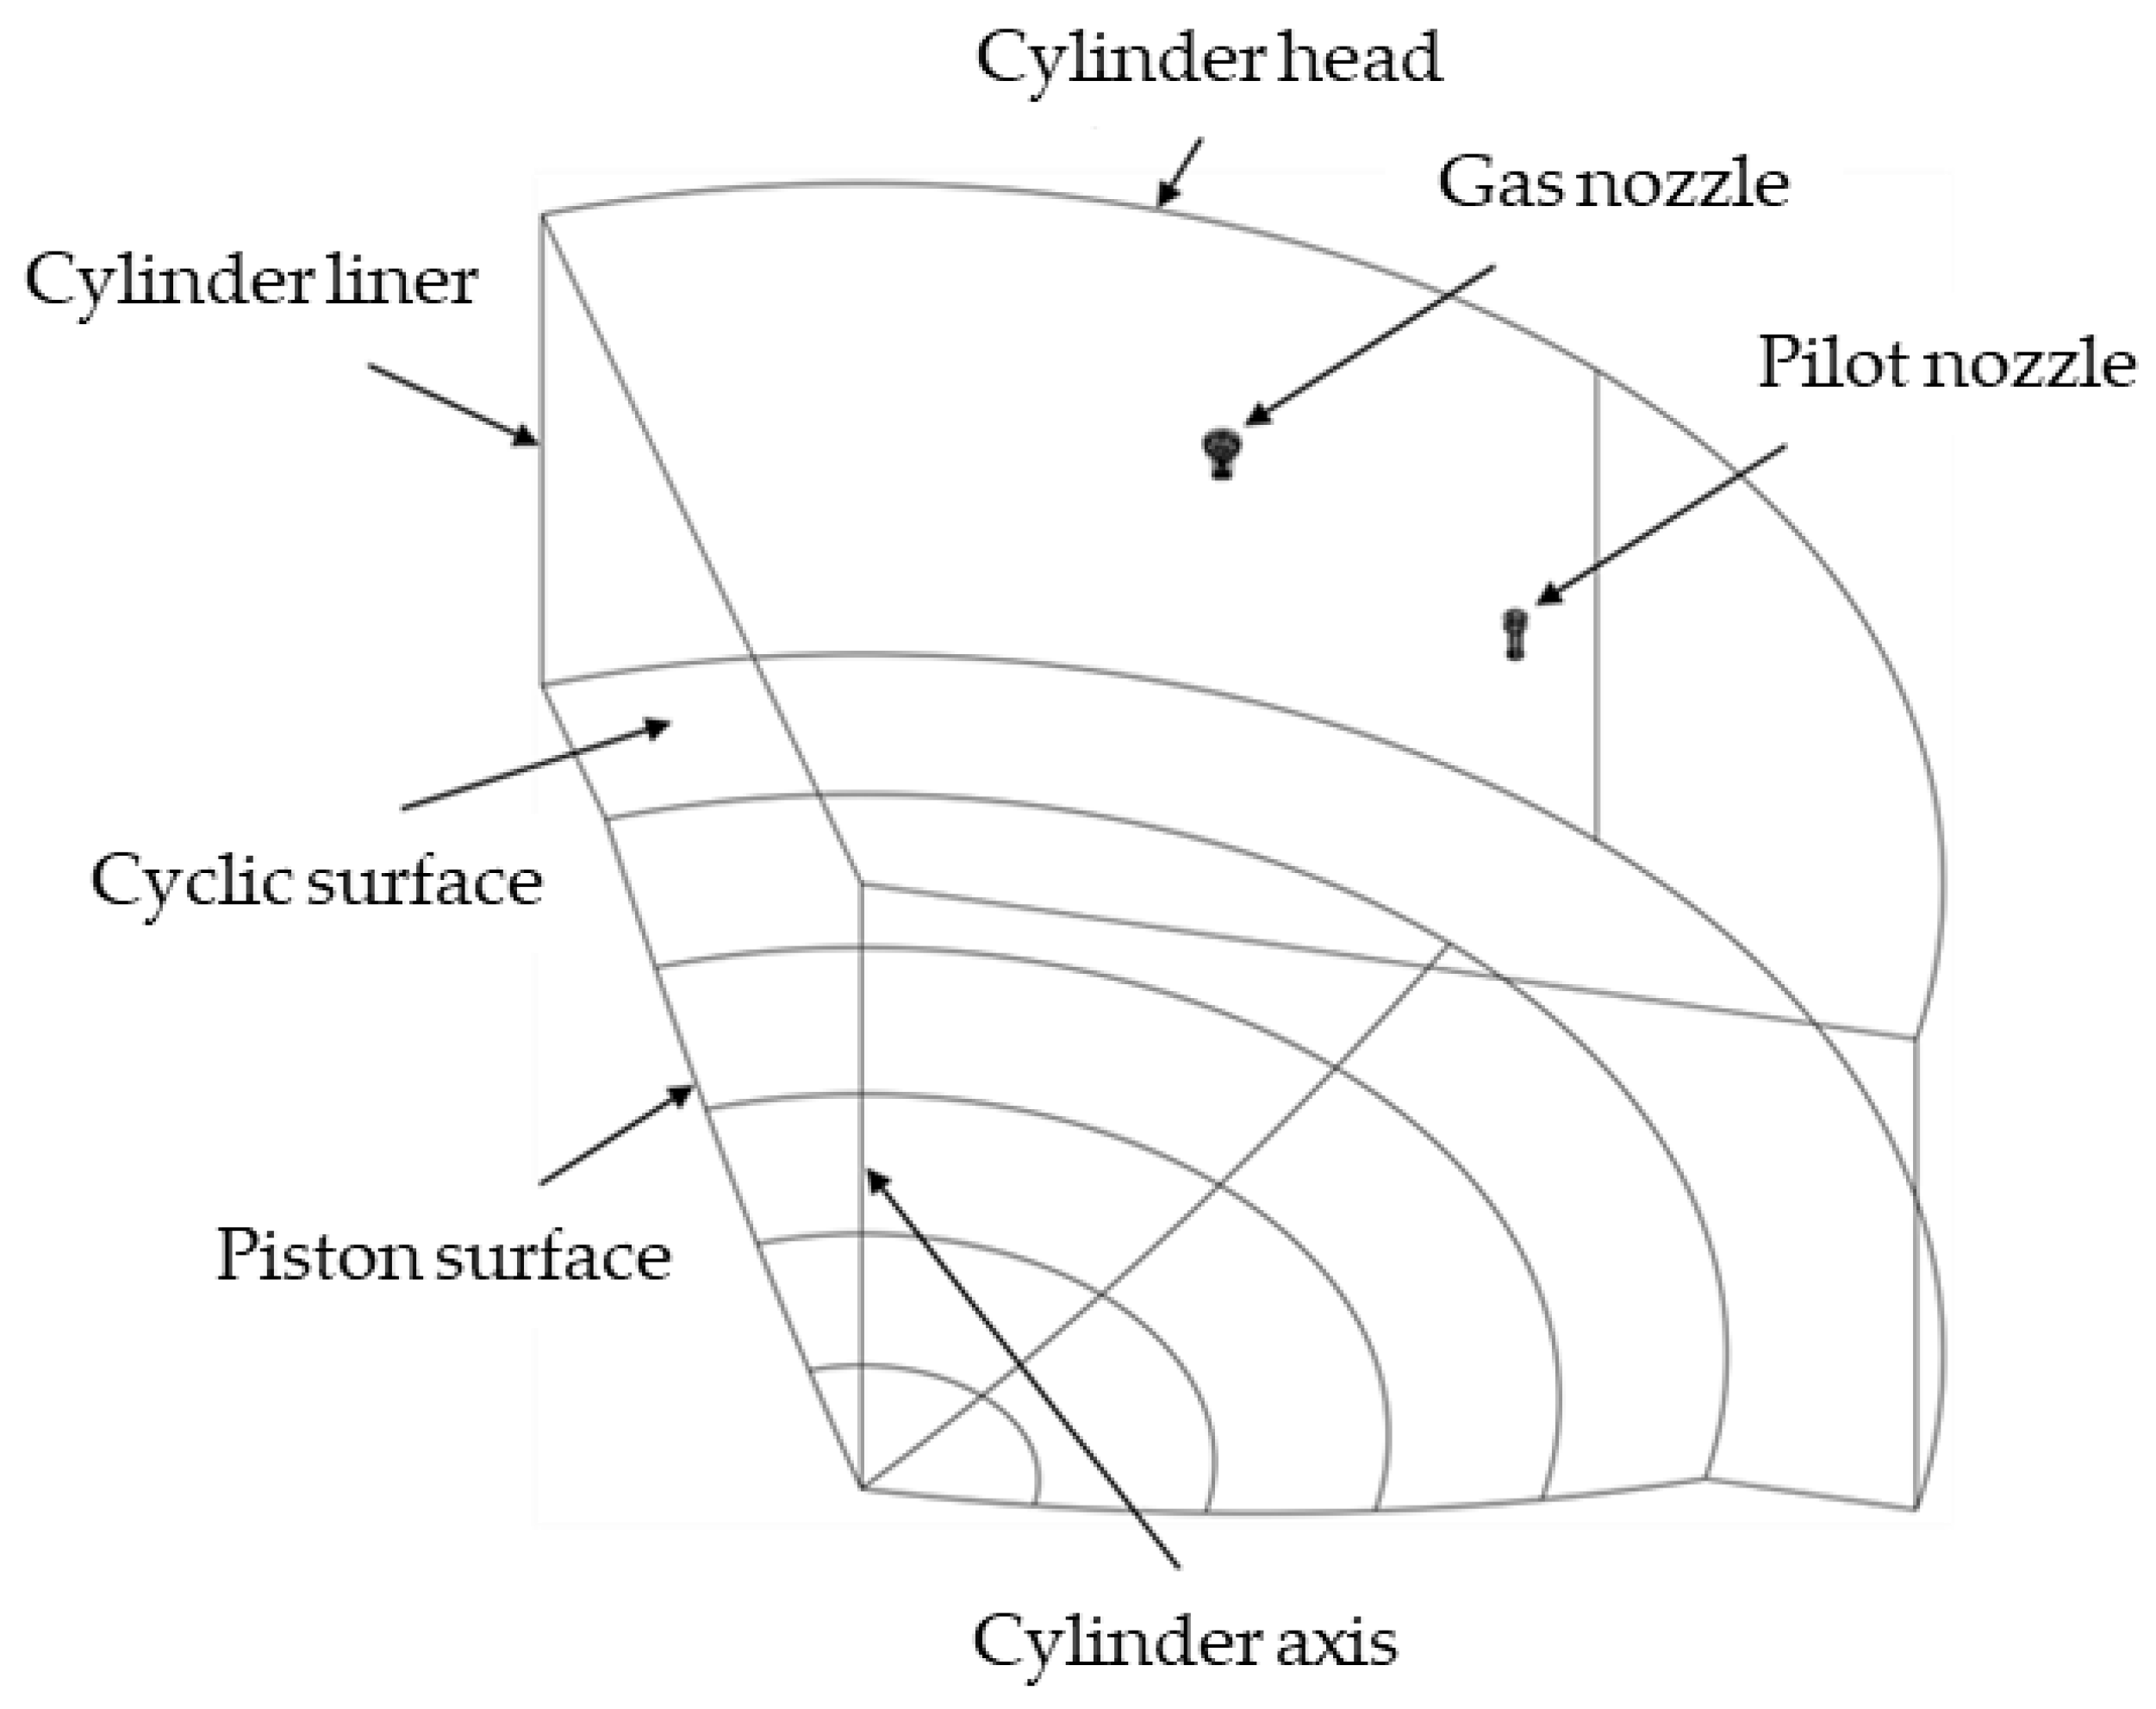
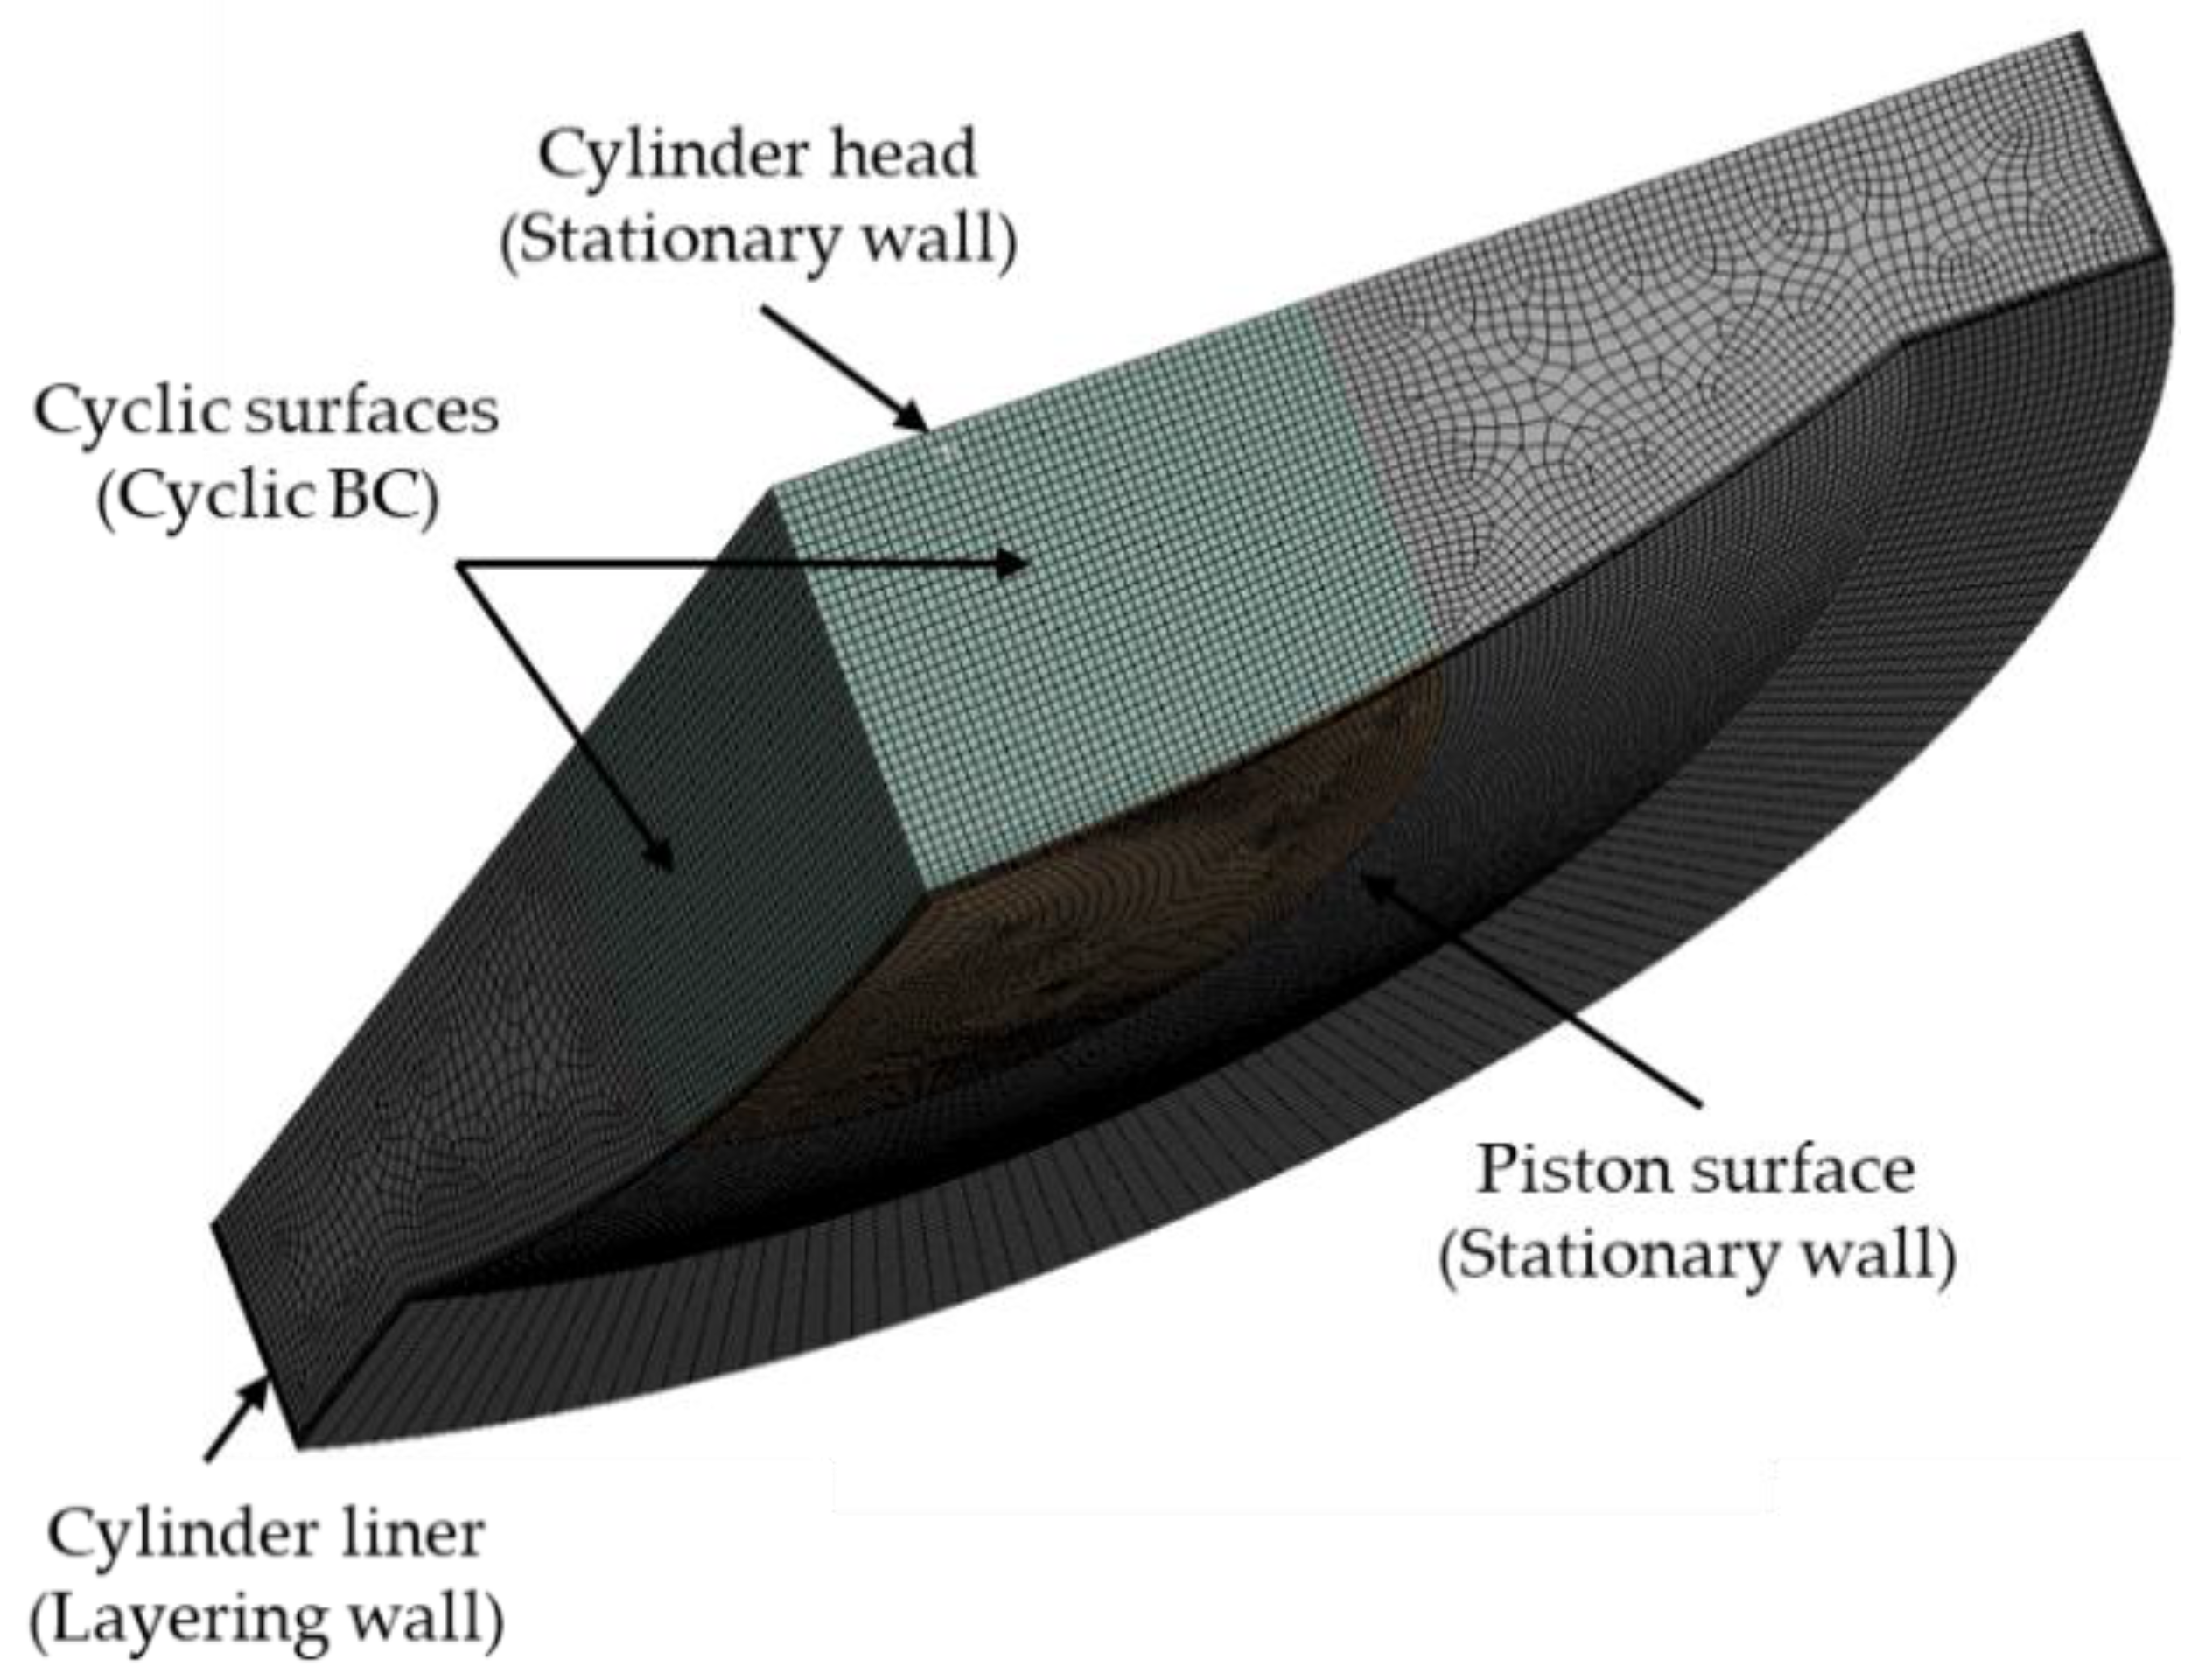
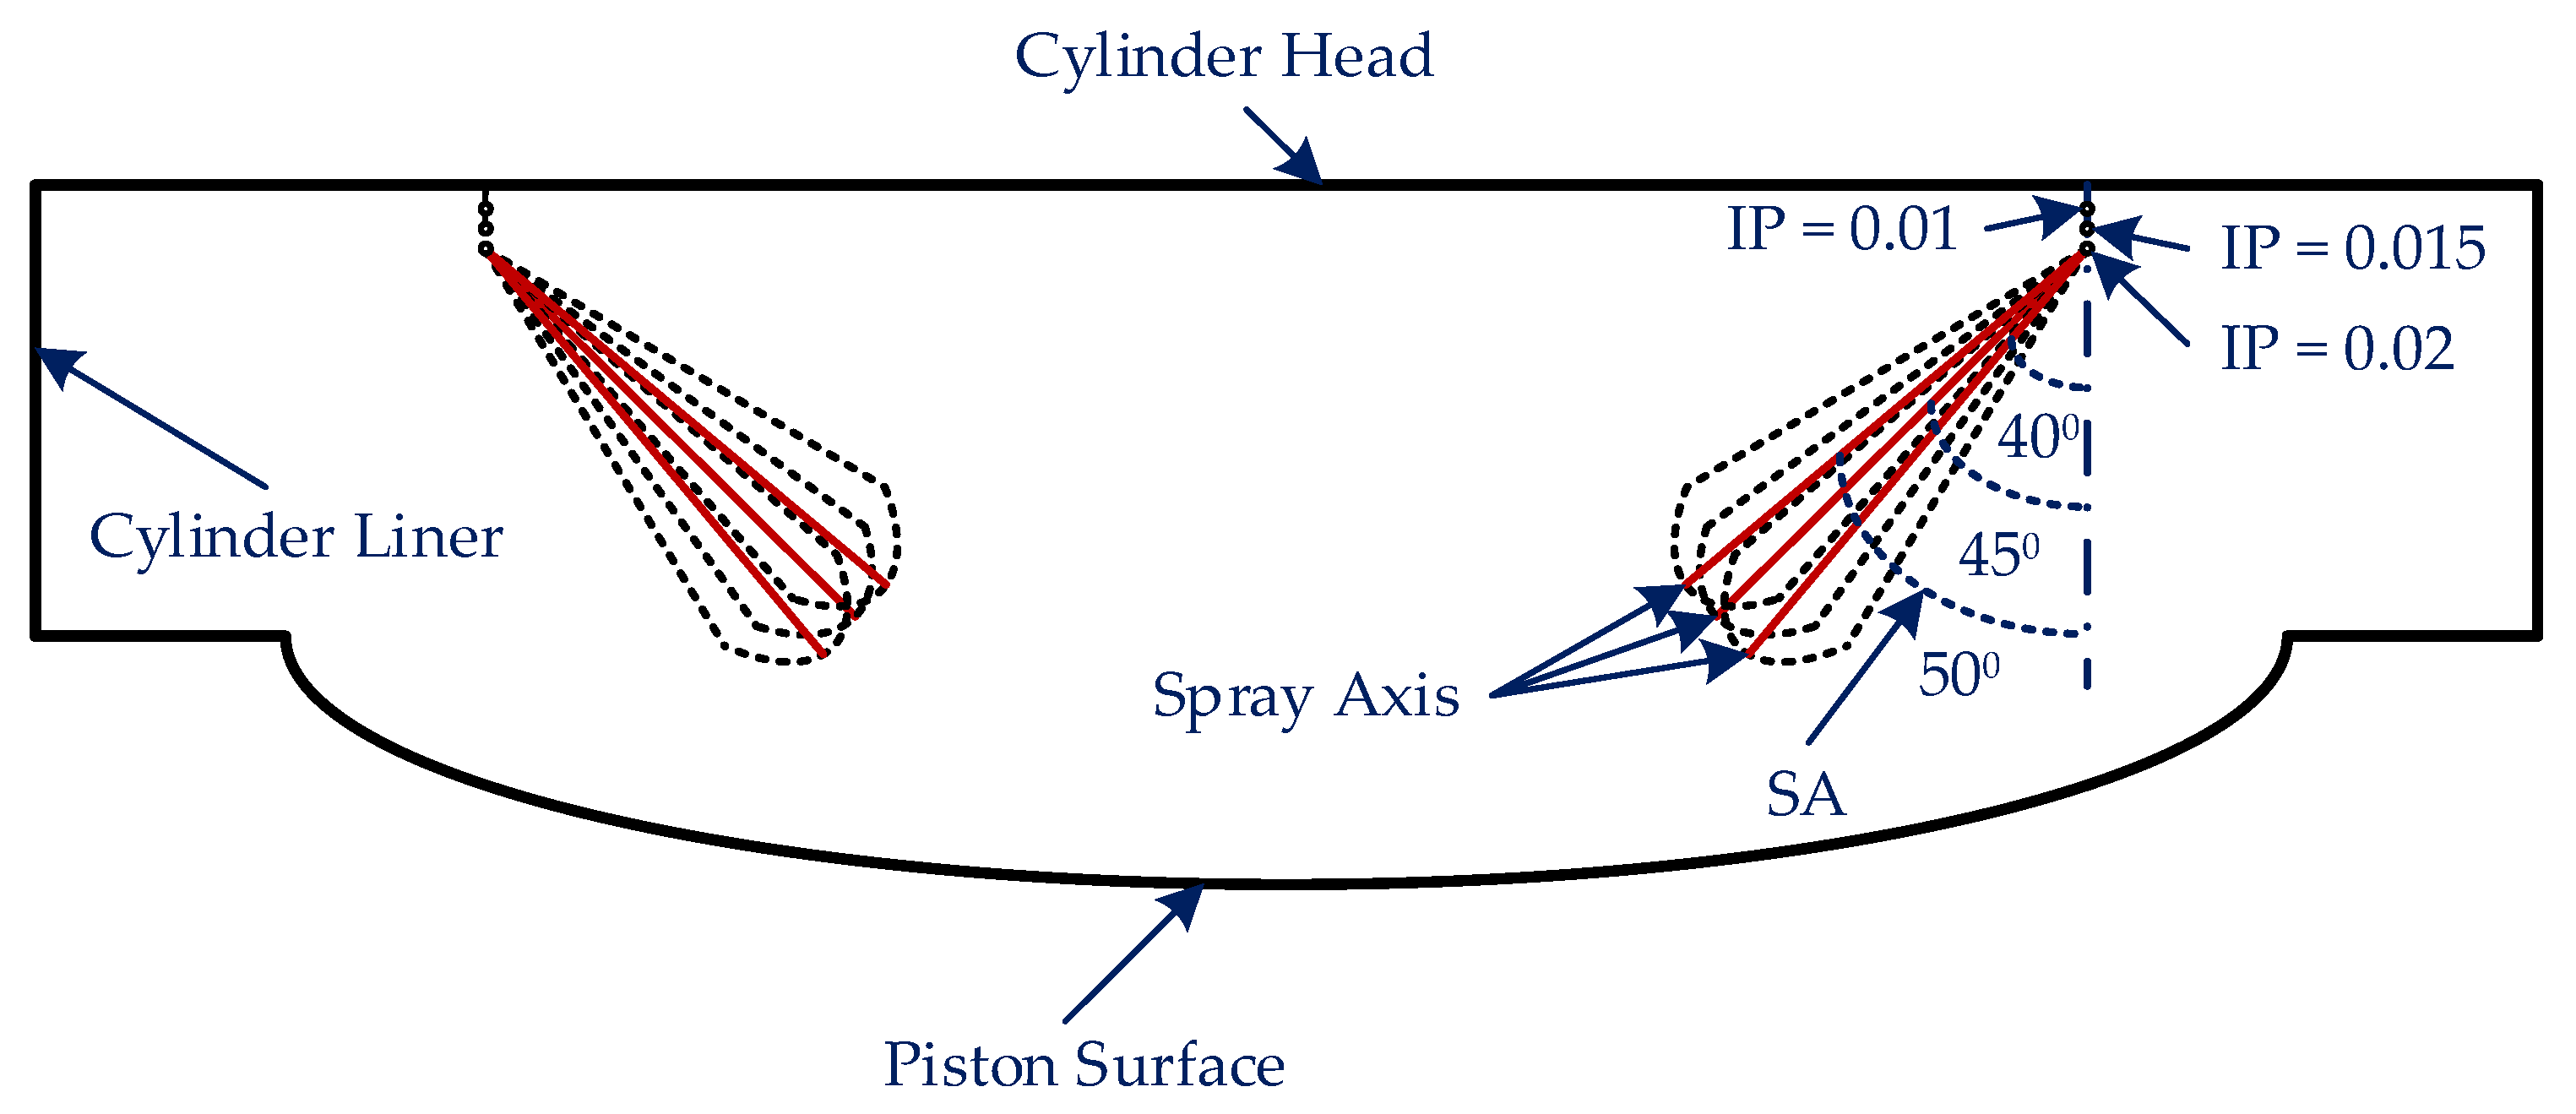
2.1. Combustion Chamber Geometry and Computational Mesh
2.2. Simulation Cases and Fuel Properties
2.3. CFD Models and Governing Equations
| mean fluid density; | |
| P = | Favre joint PDF of composition; |
| Favre mean fluid velocity vector; | |
| composition space vector; | |
| reaction rate for specie k; | |
| molecular diffusion flux vector; | |
| fluid velocity fluctuation vector. |
2.4. Boundary and Initial Conditions
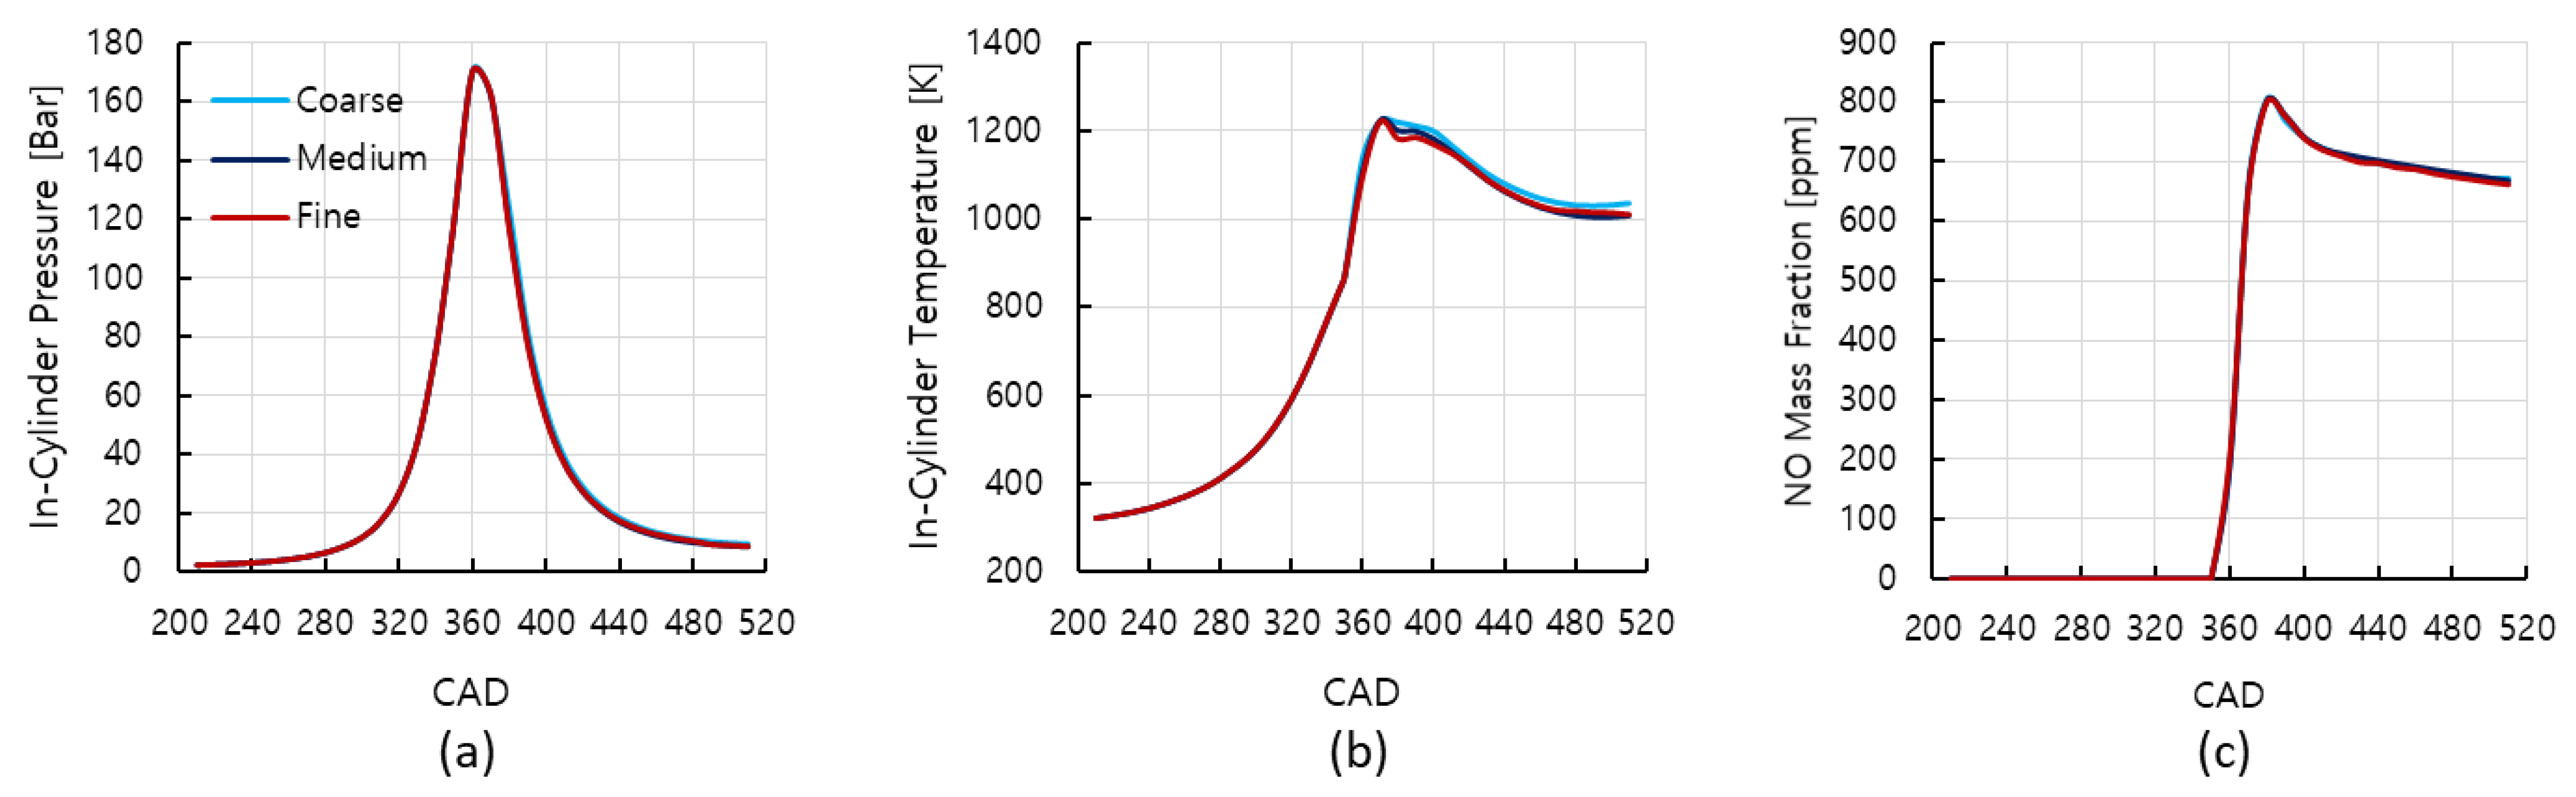
2.5. Mesh Independence Analysis
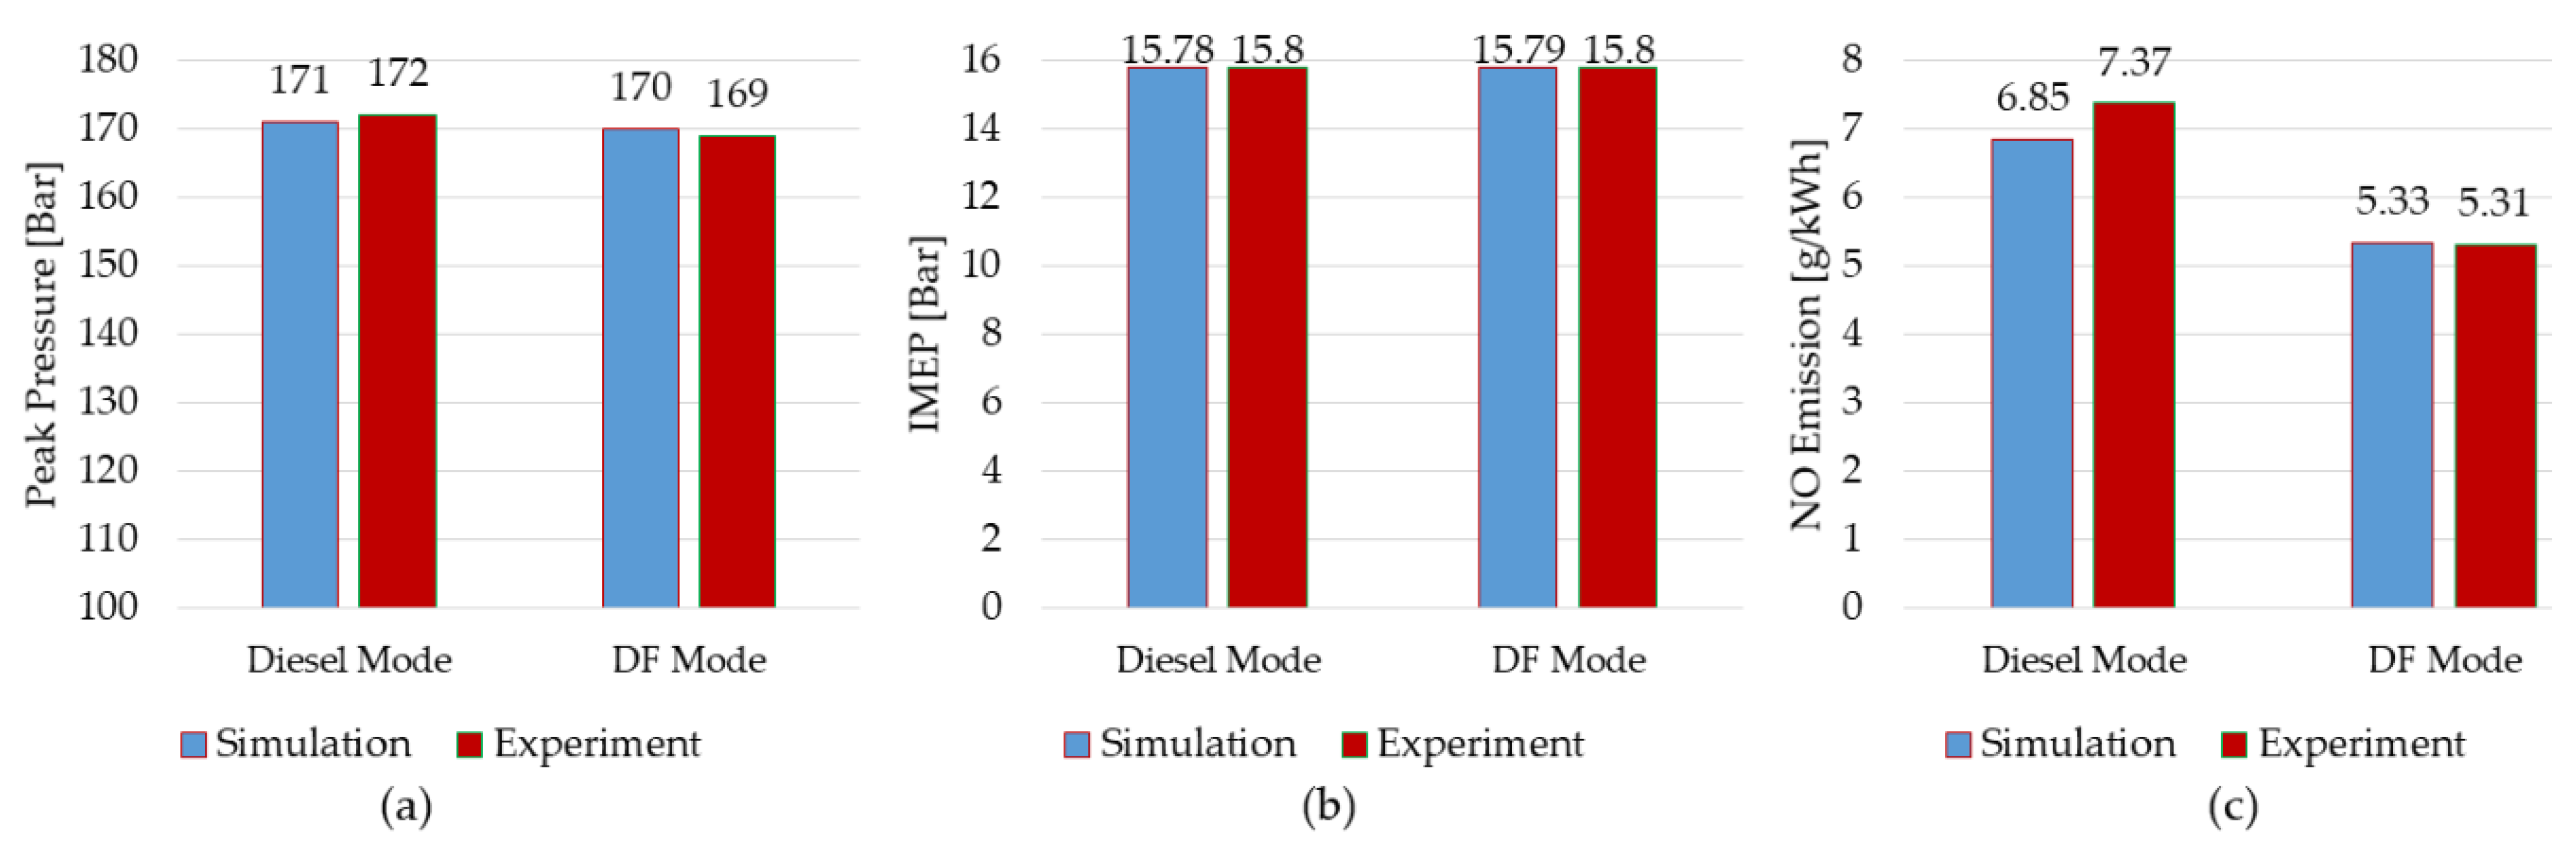
2.6. CFD Model Validation
3. Results
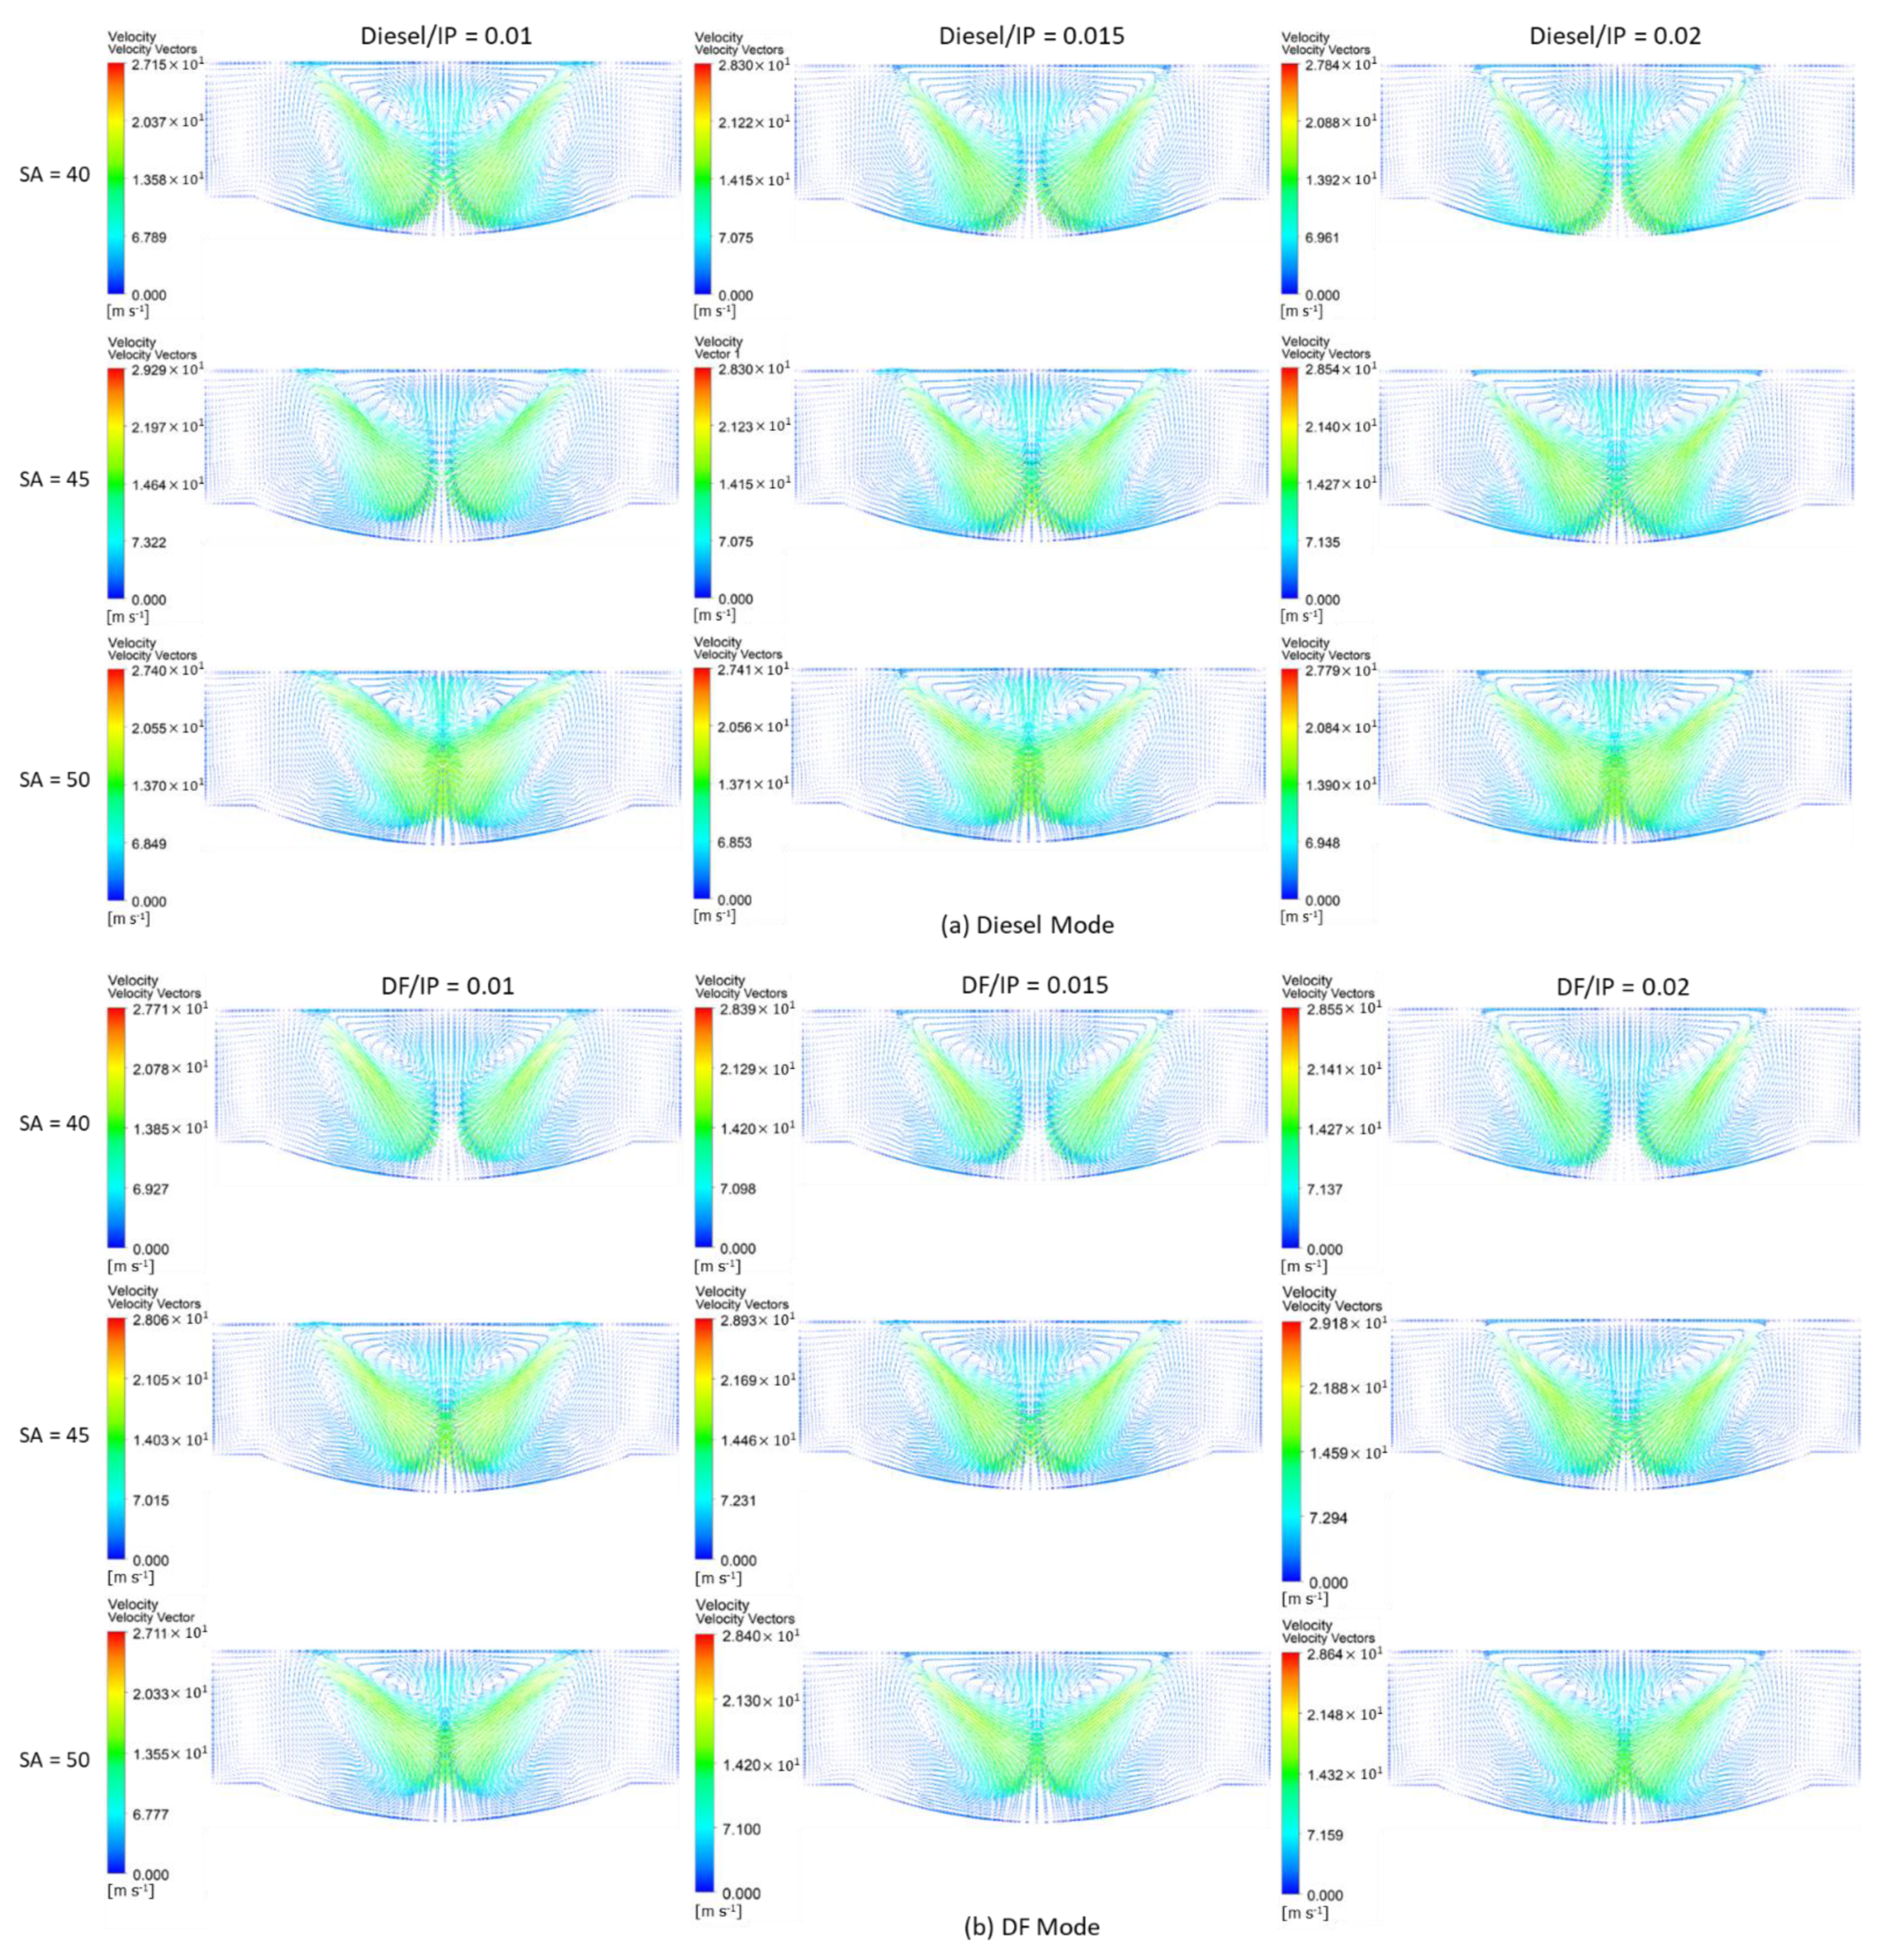
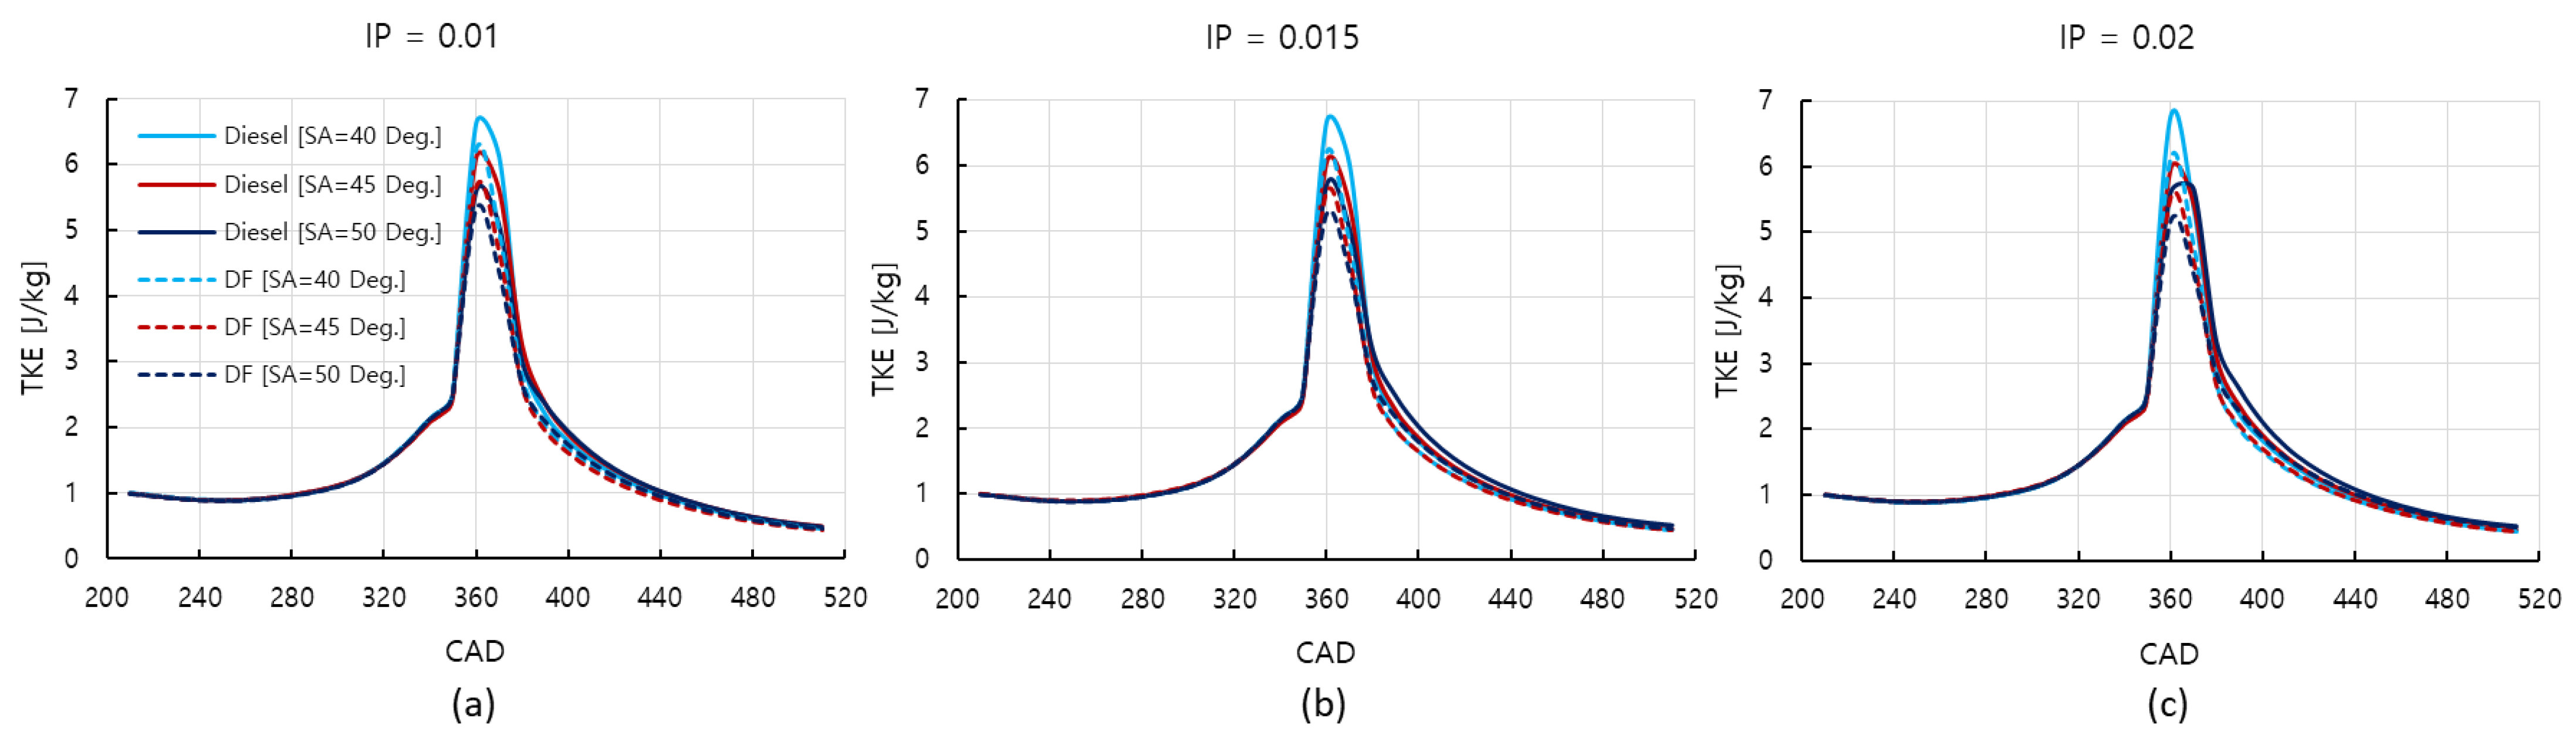
3.1. Velocity Vectors and Turbulence Kinetic Energies
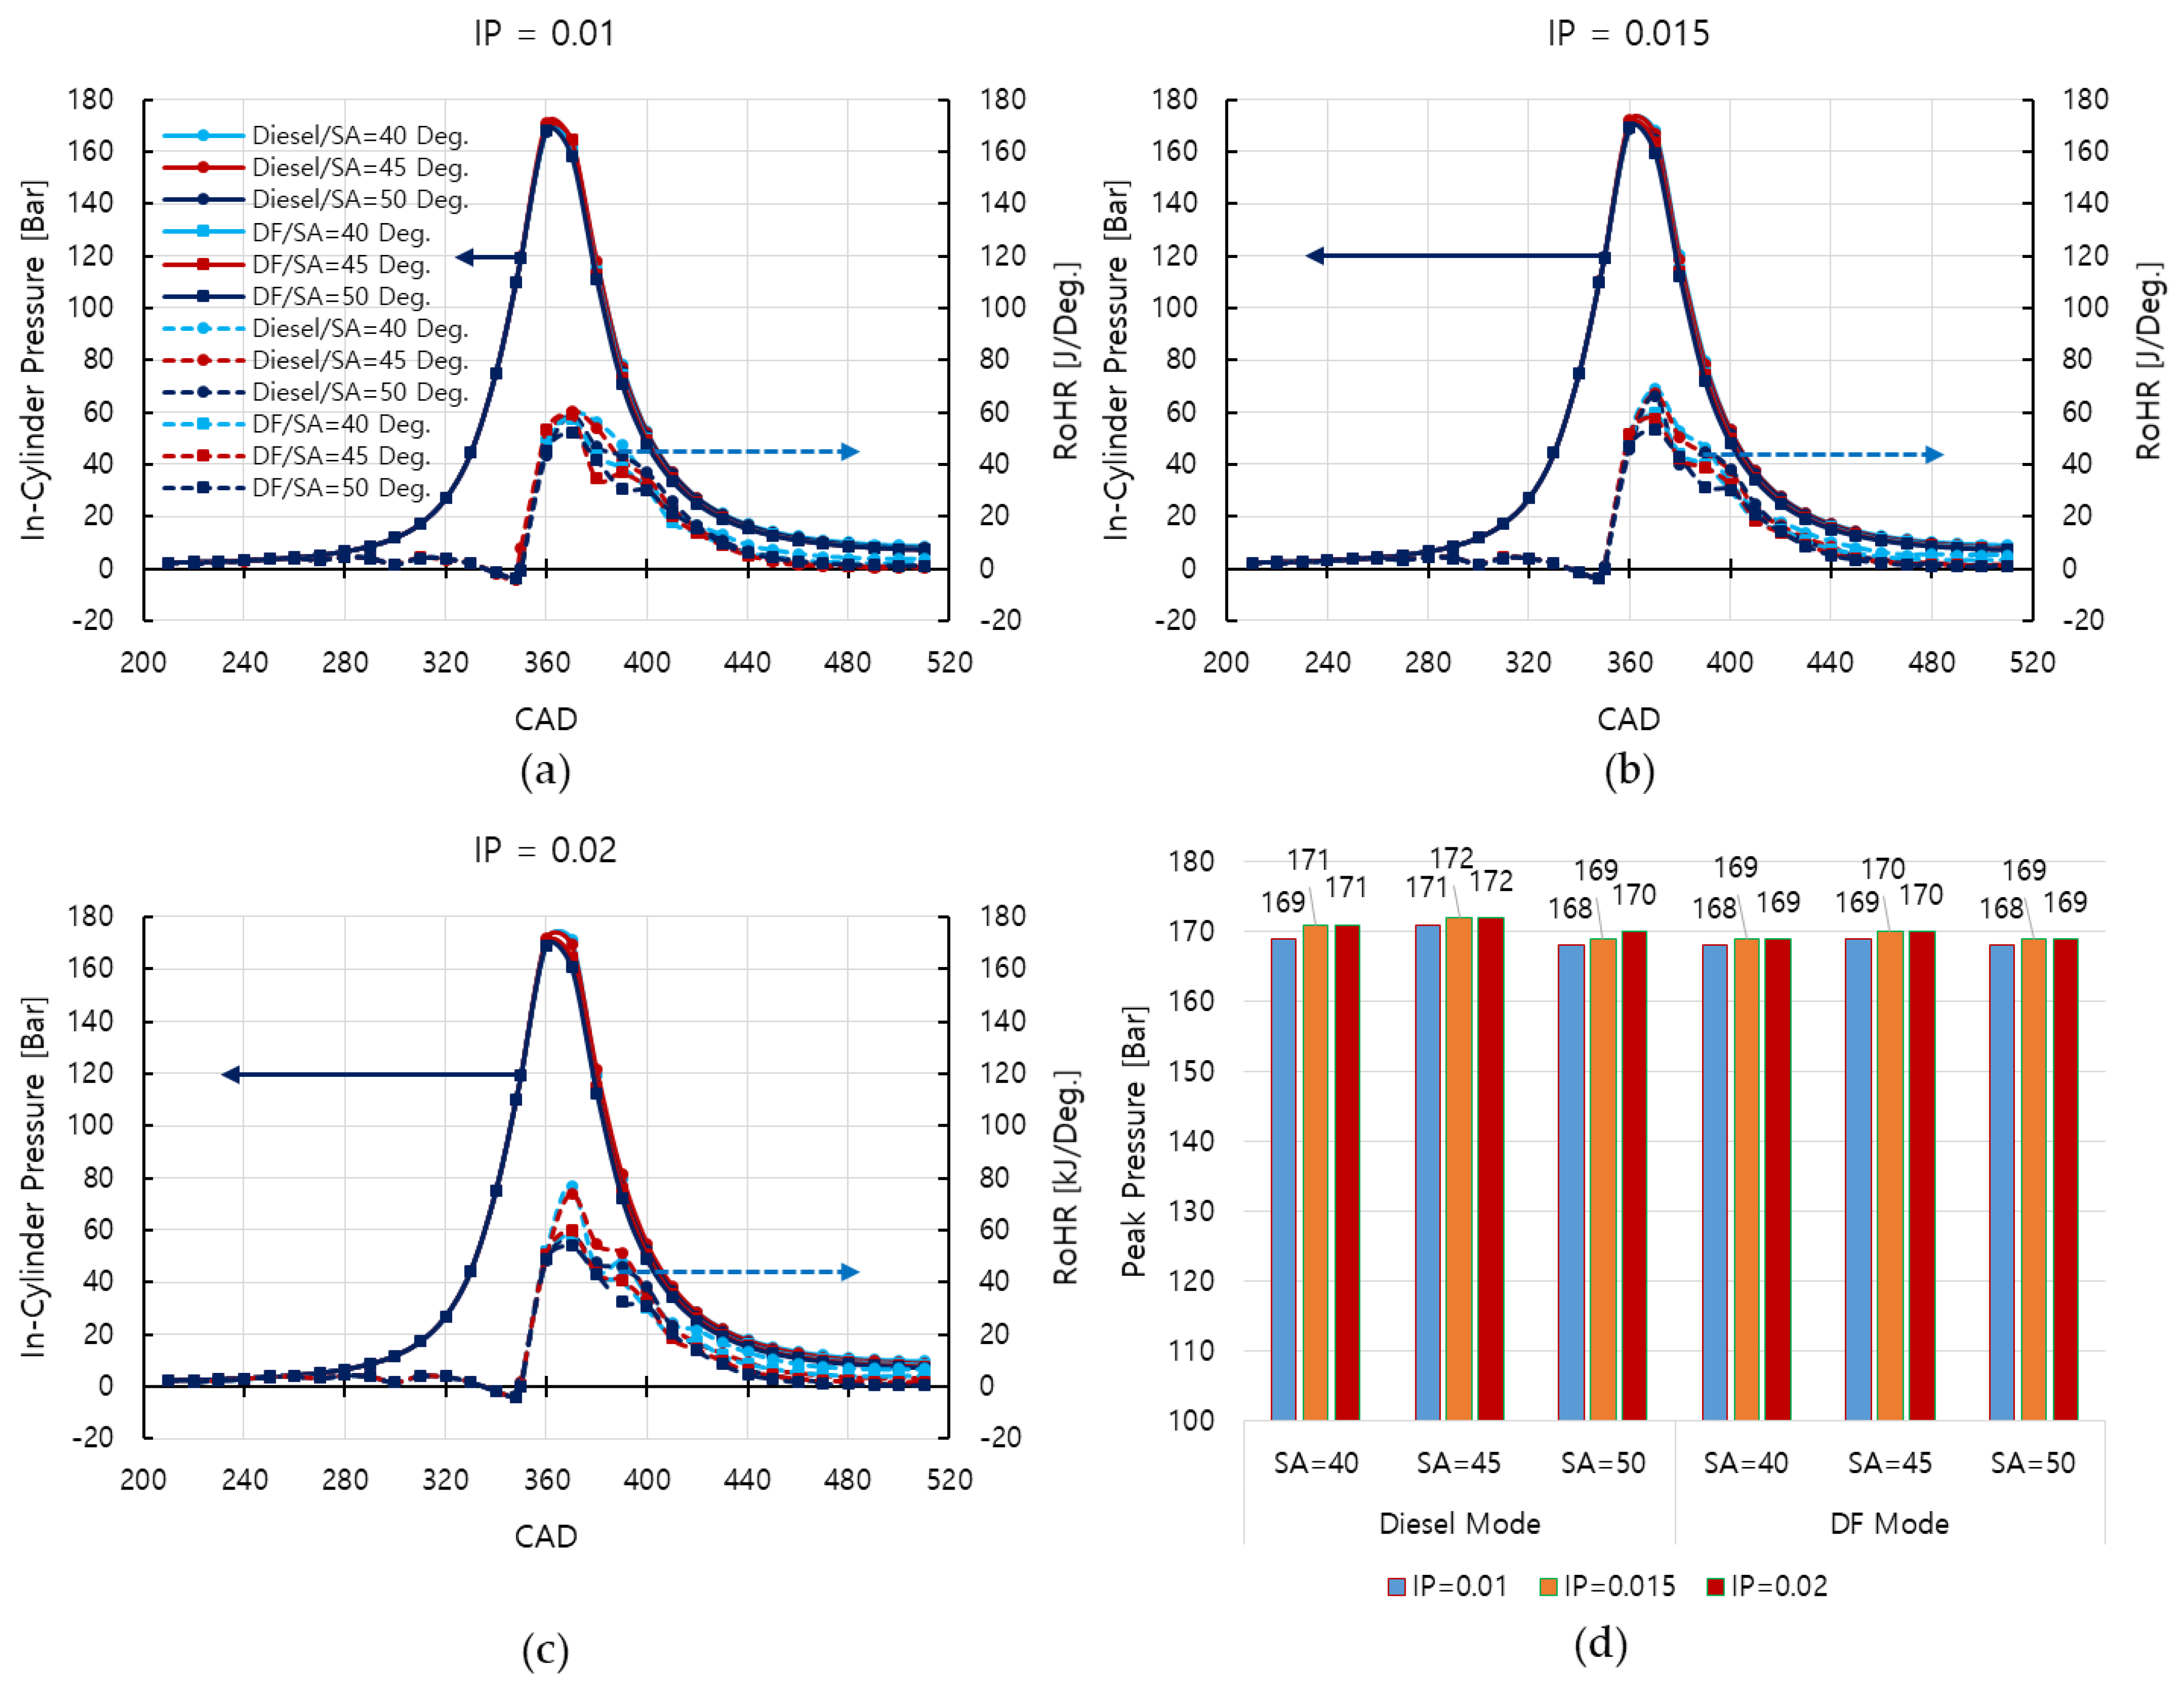
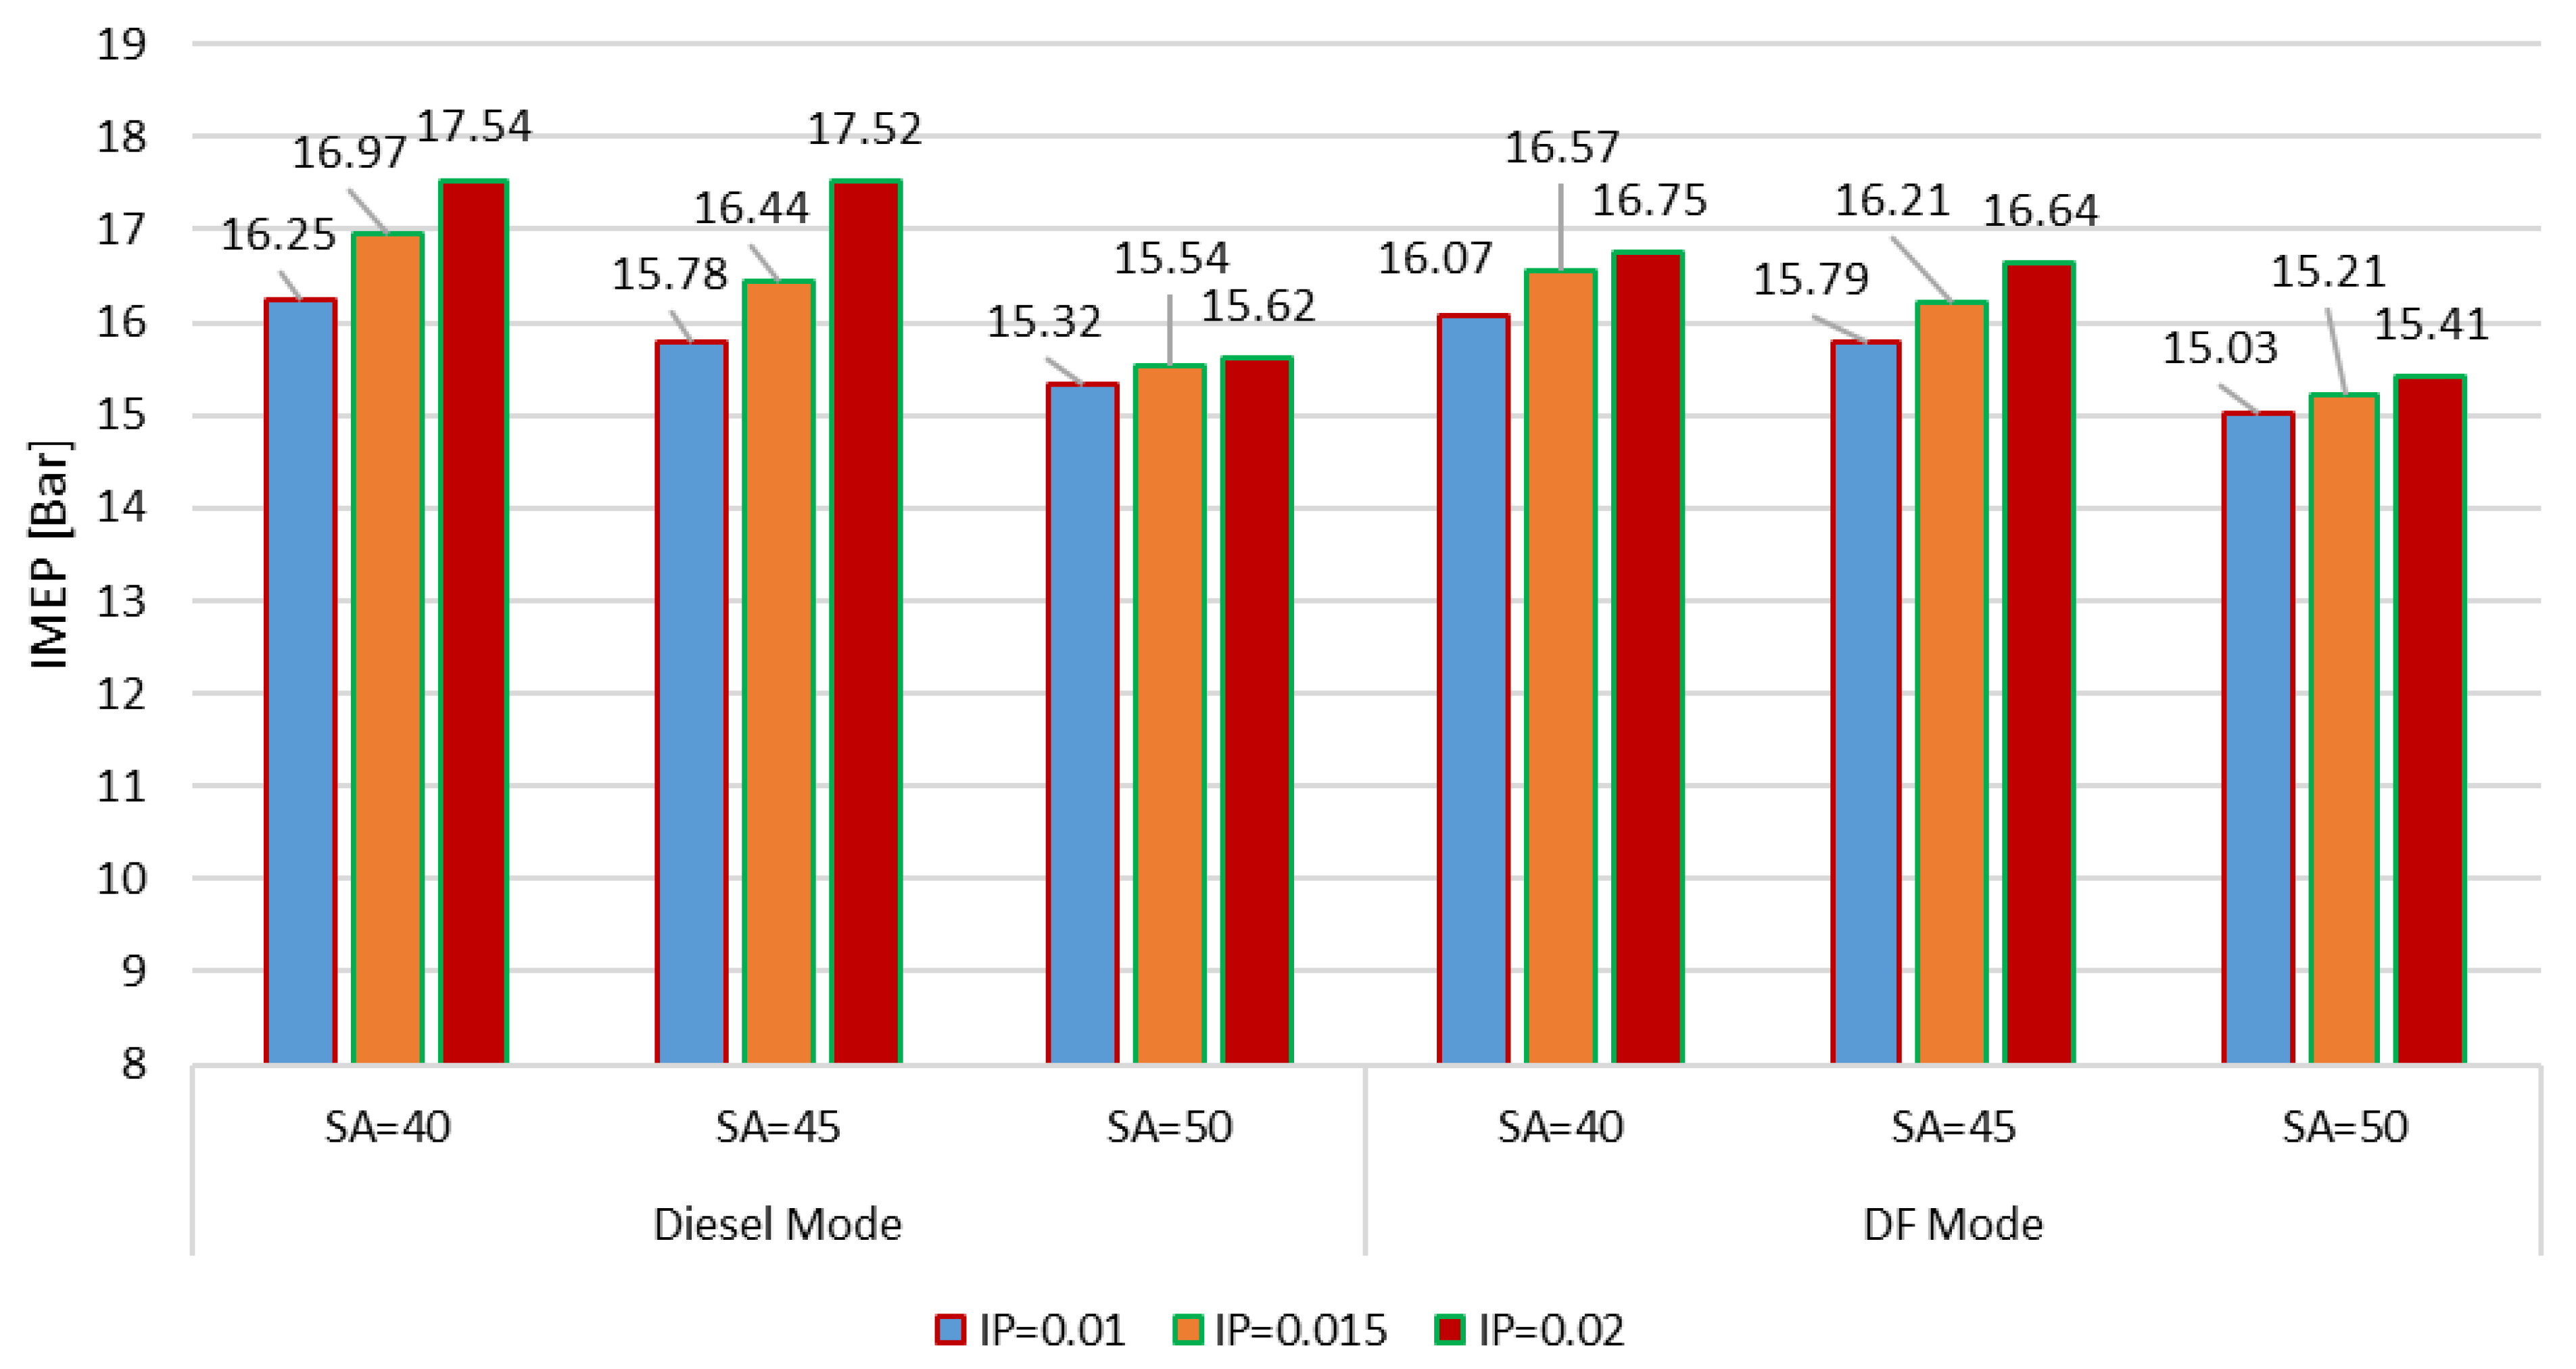
3.2. In-Cylinder Pressure and Engine Performance
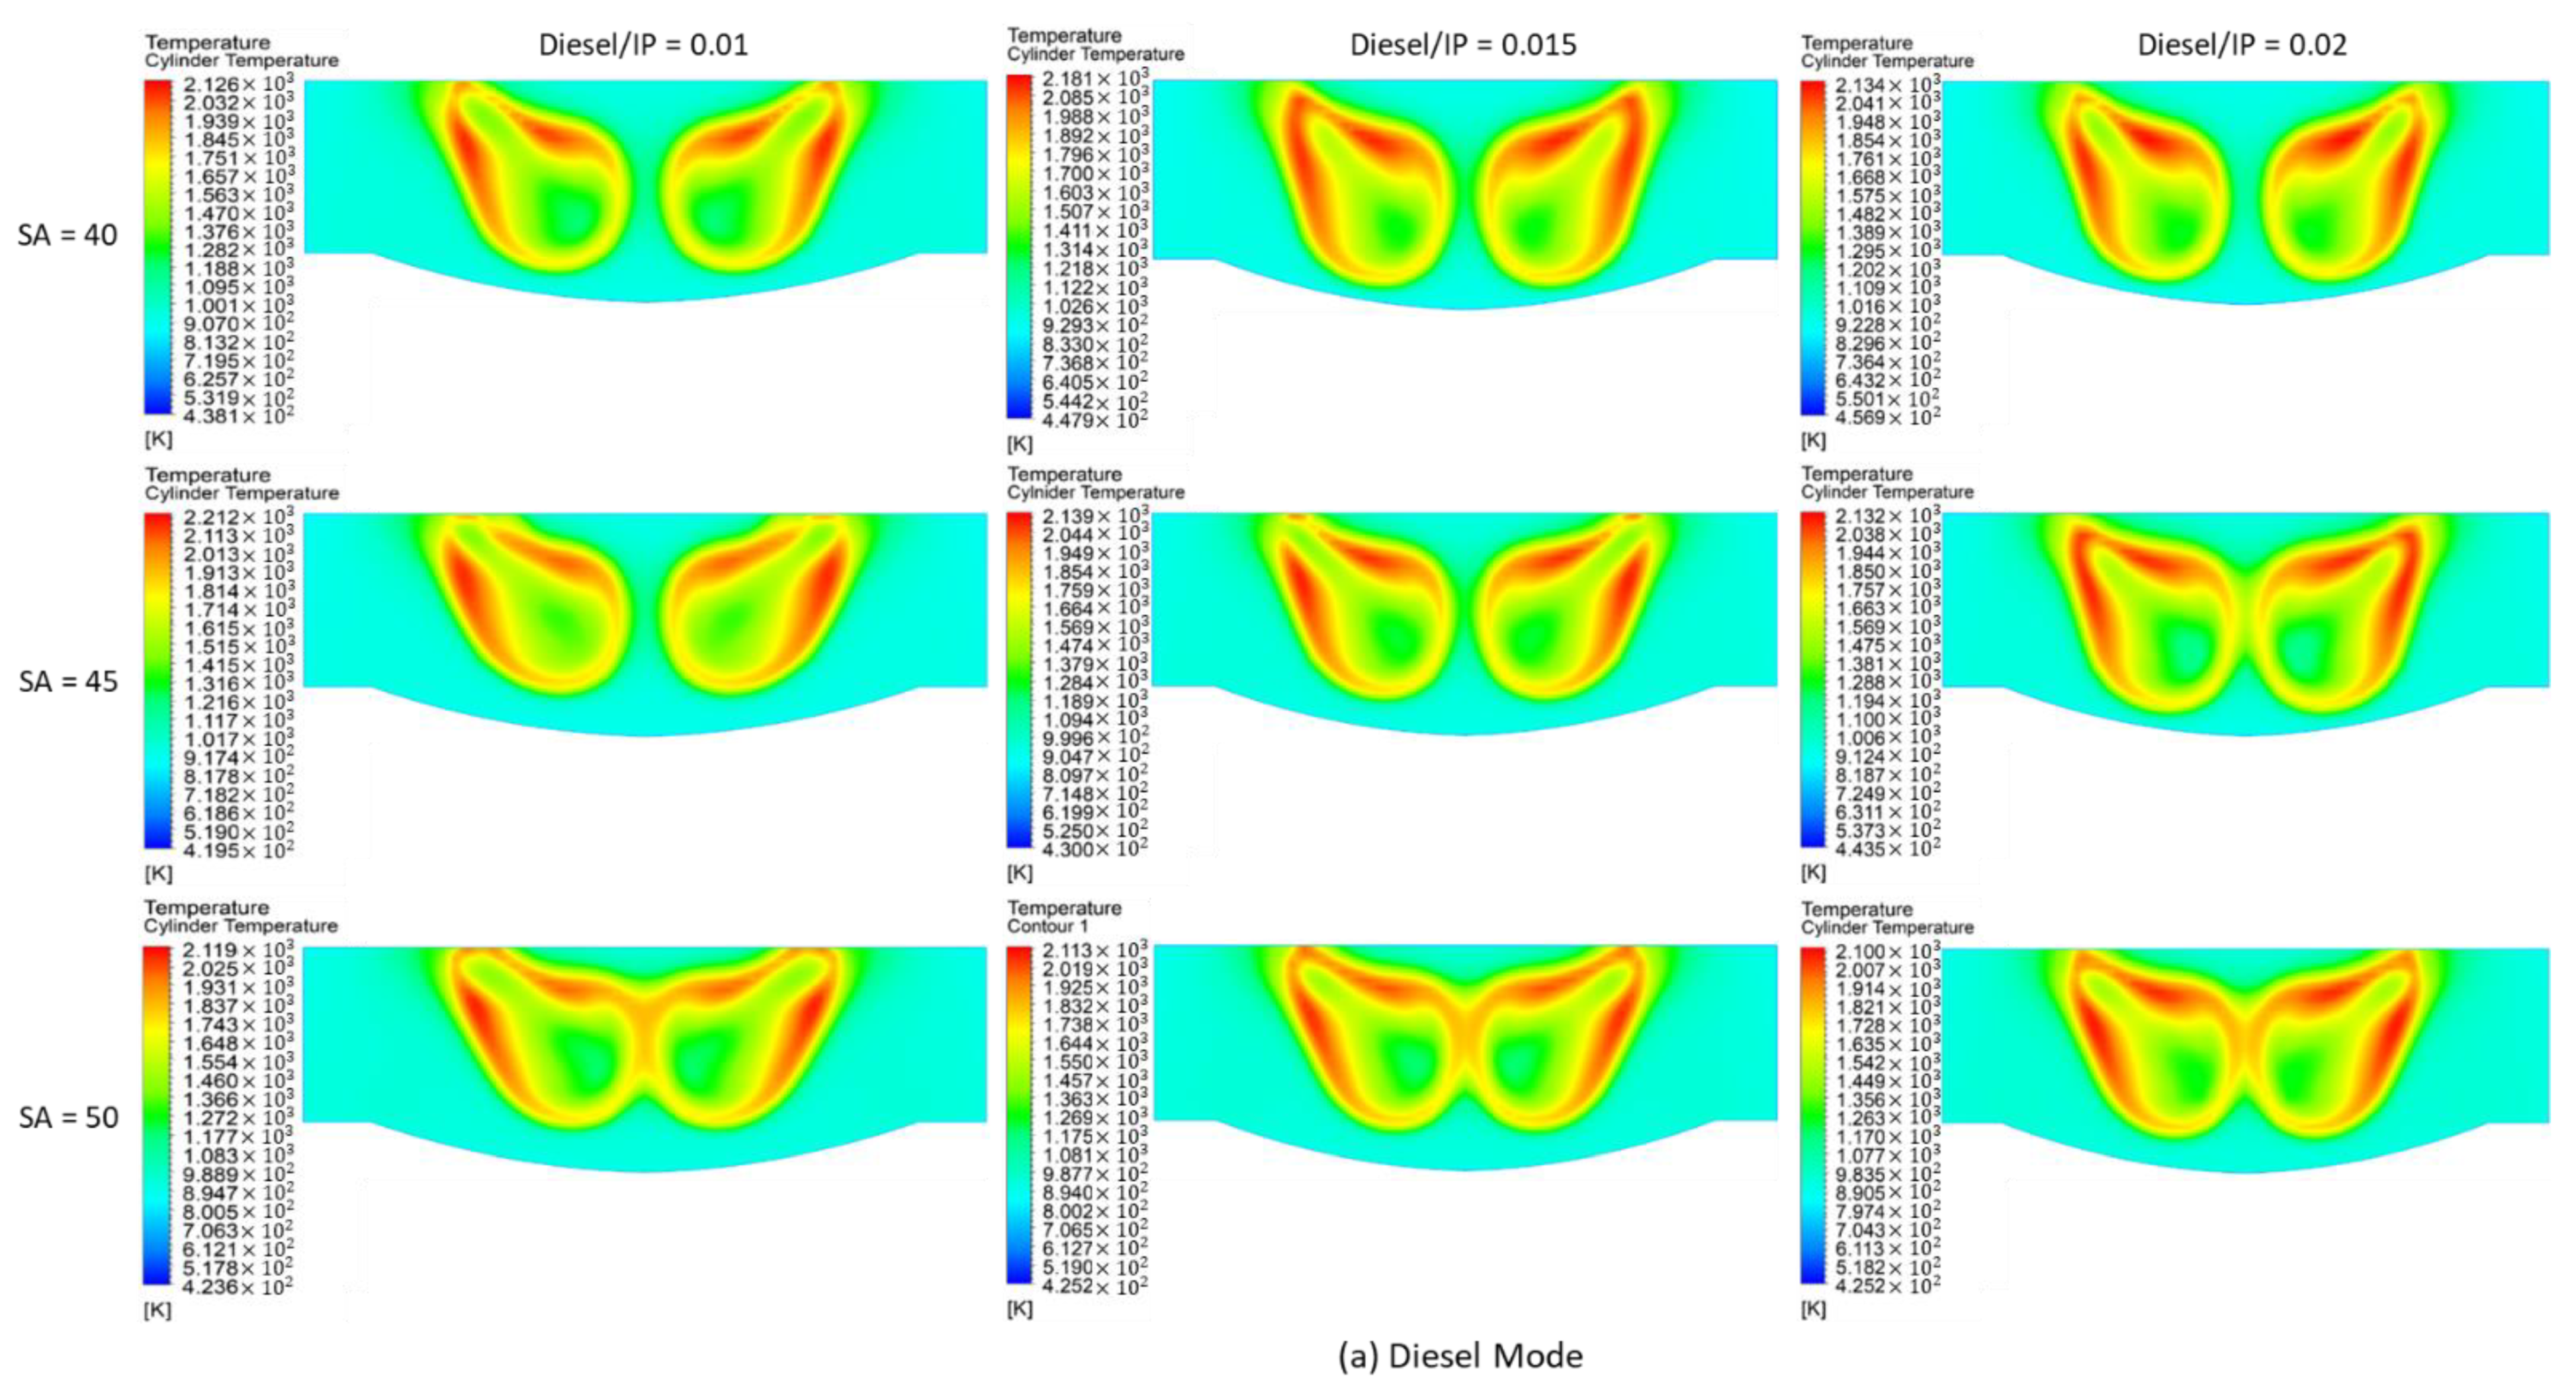
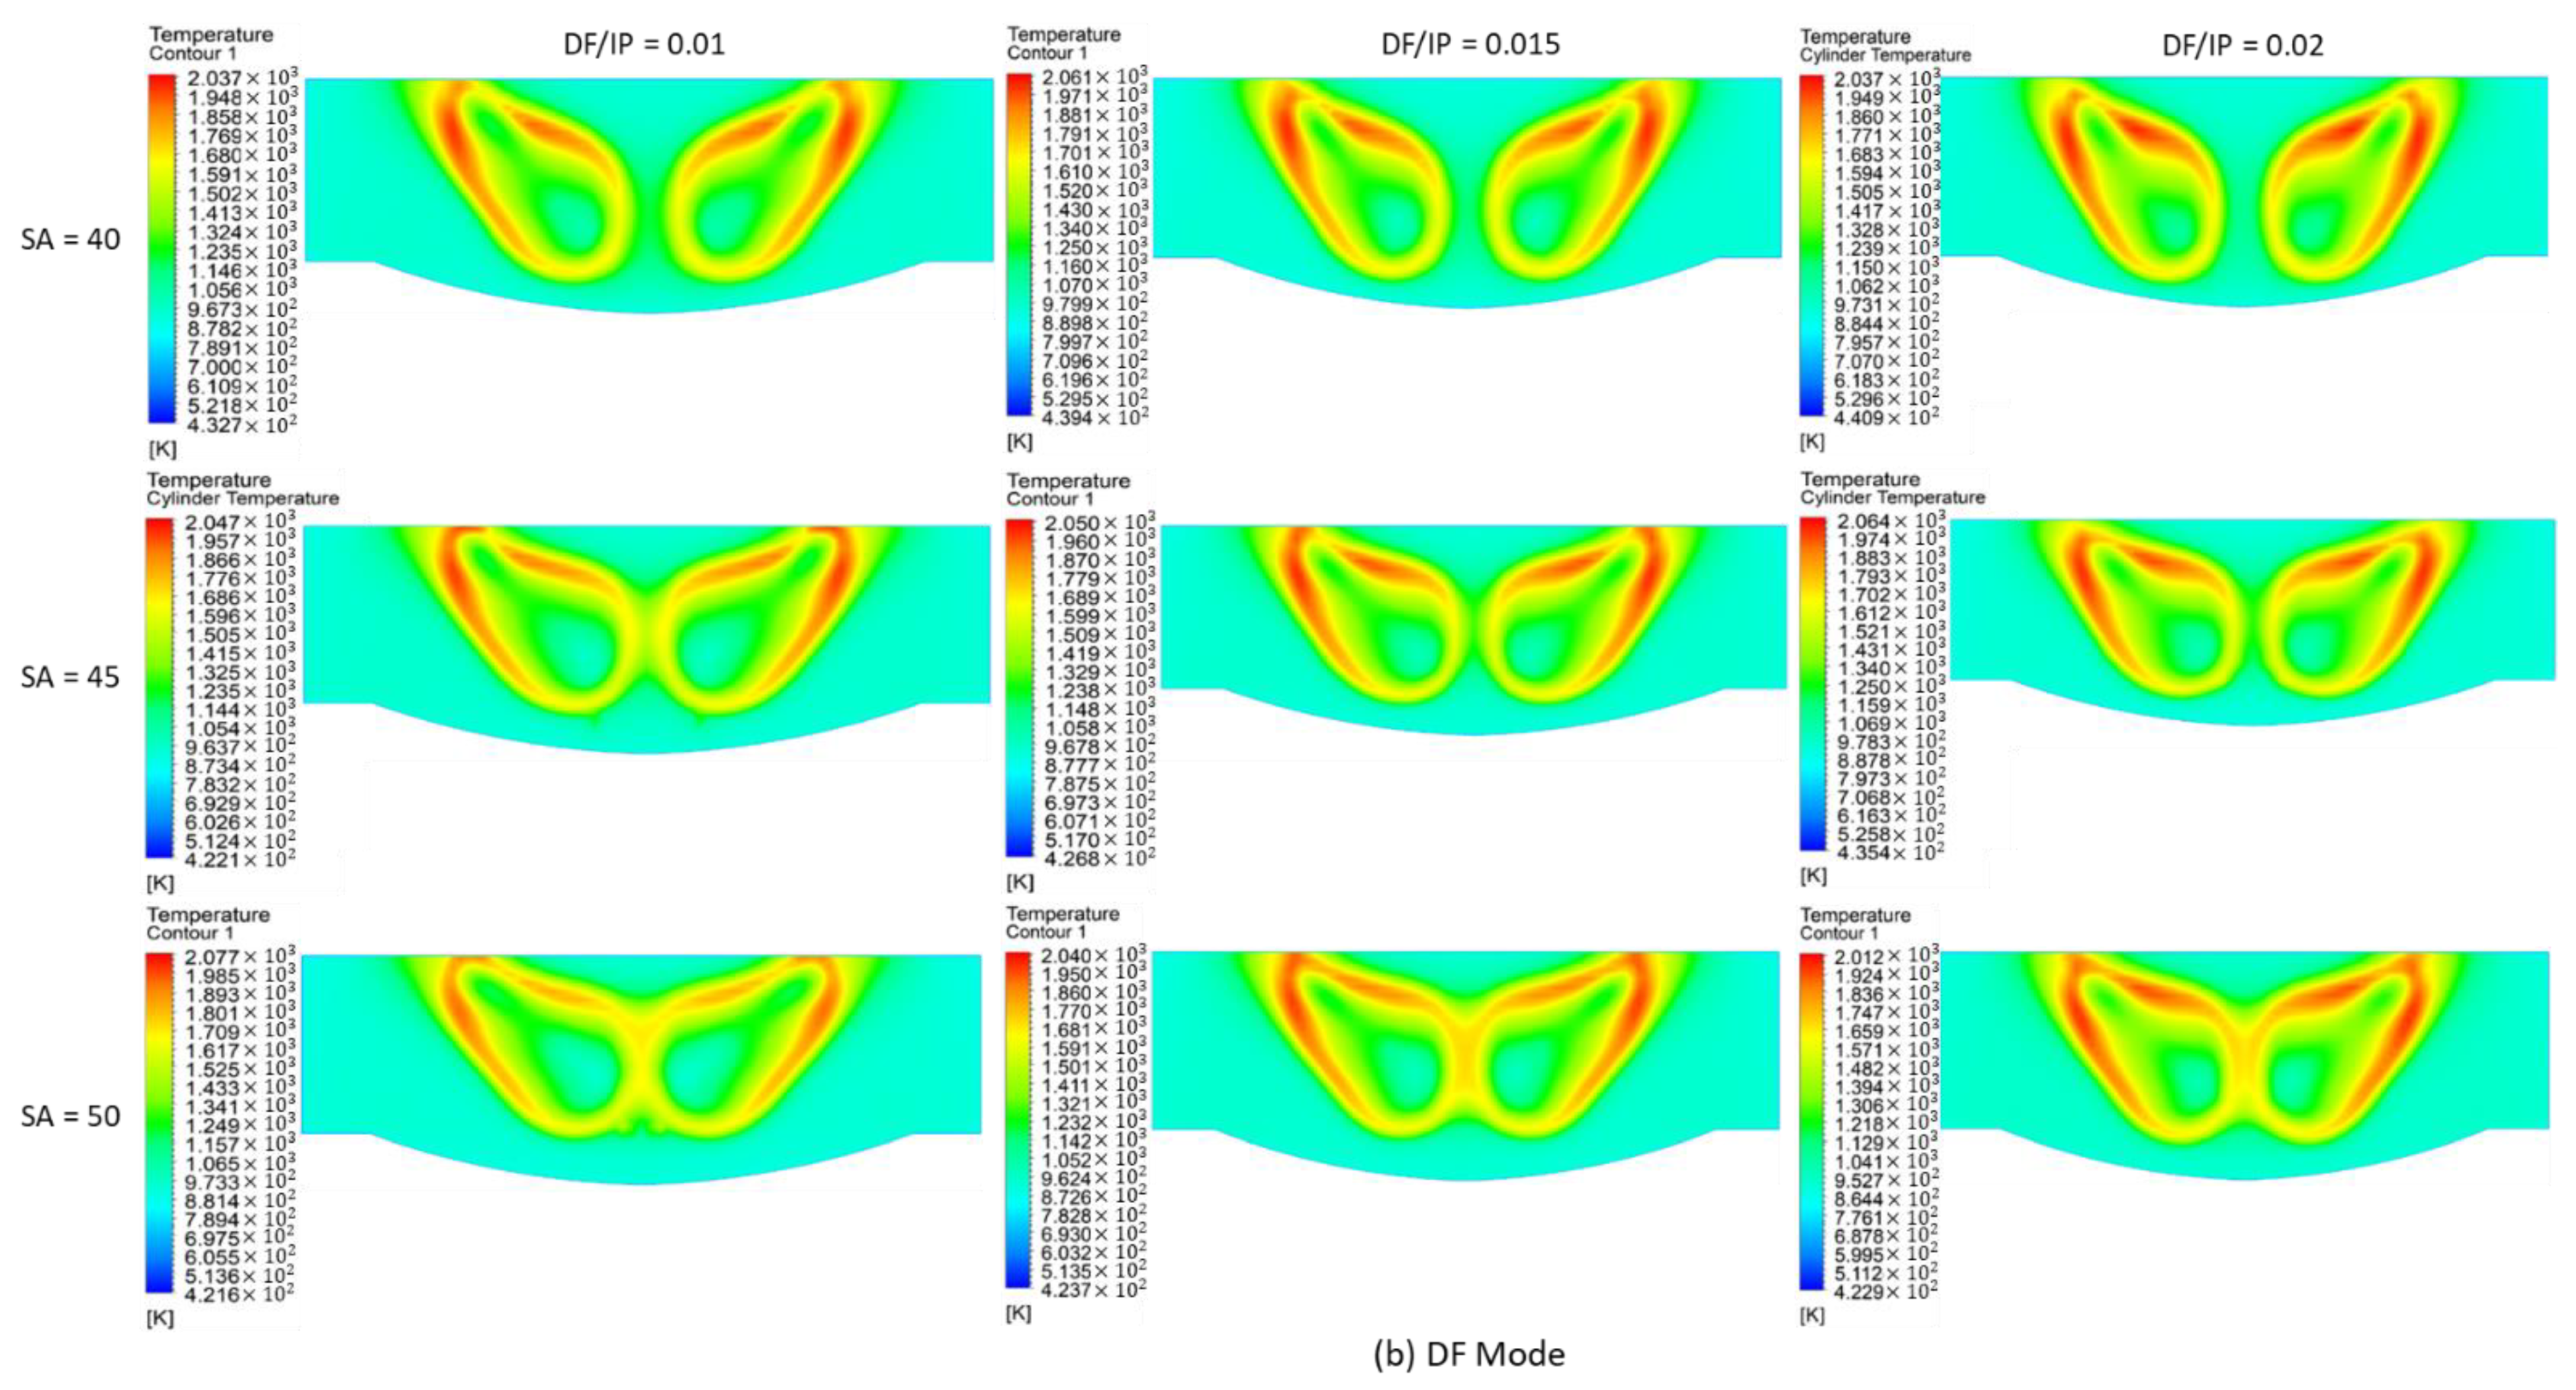
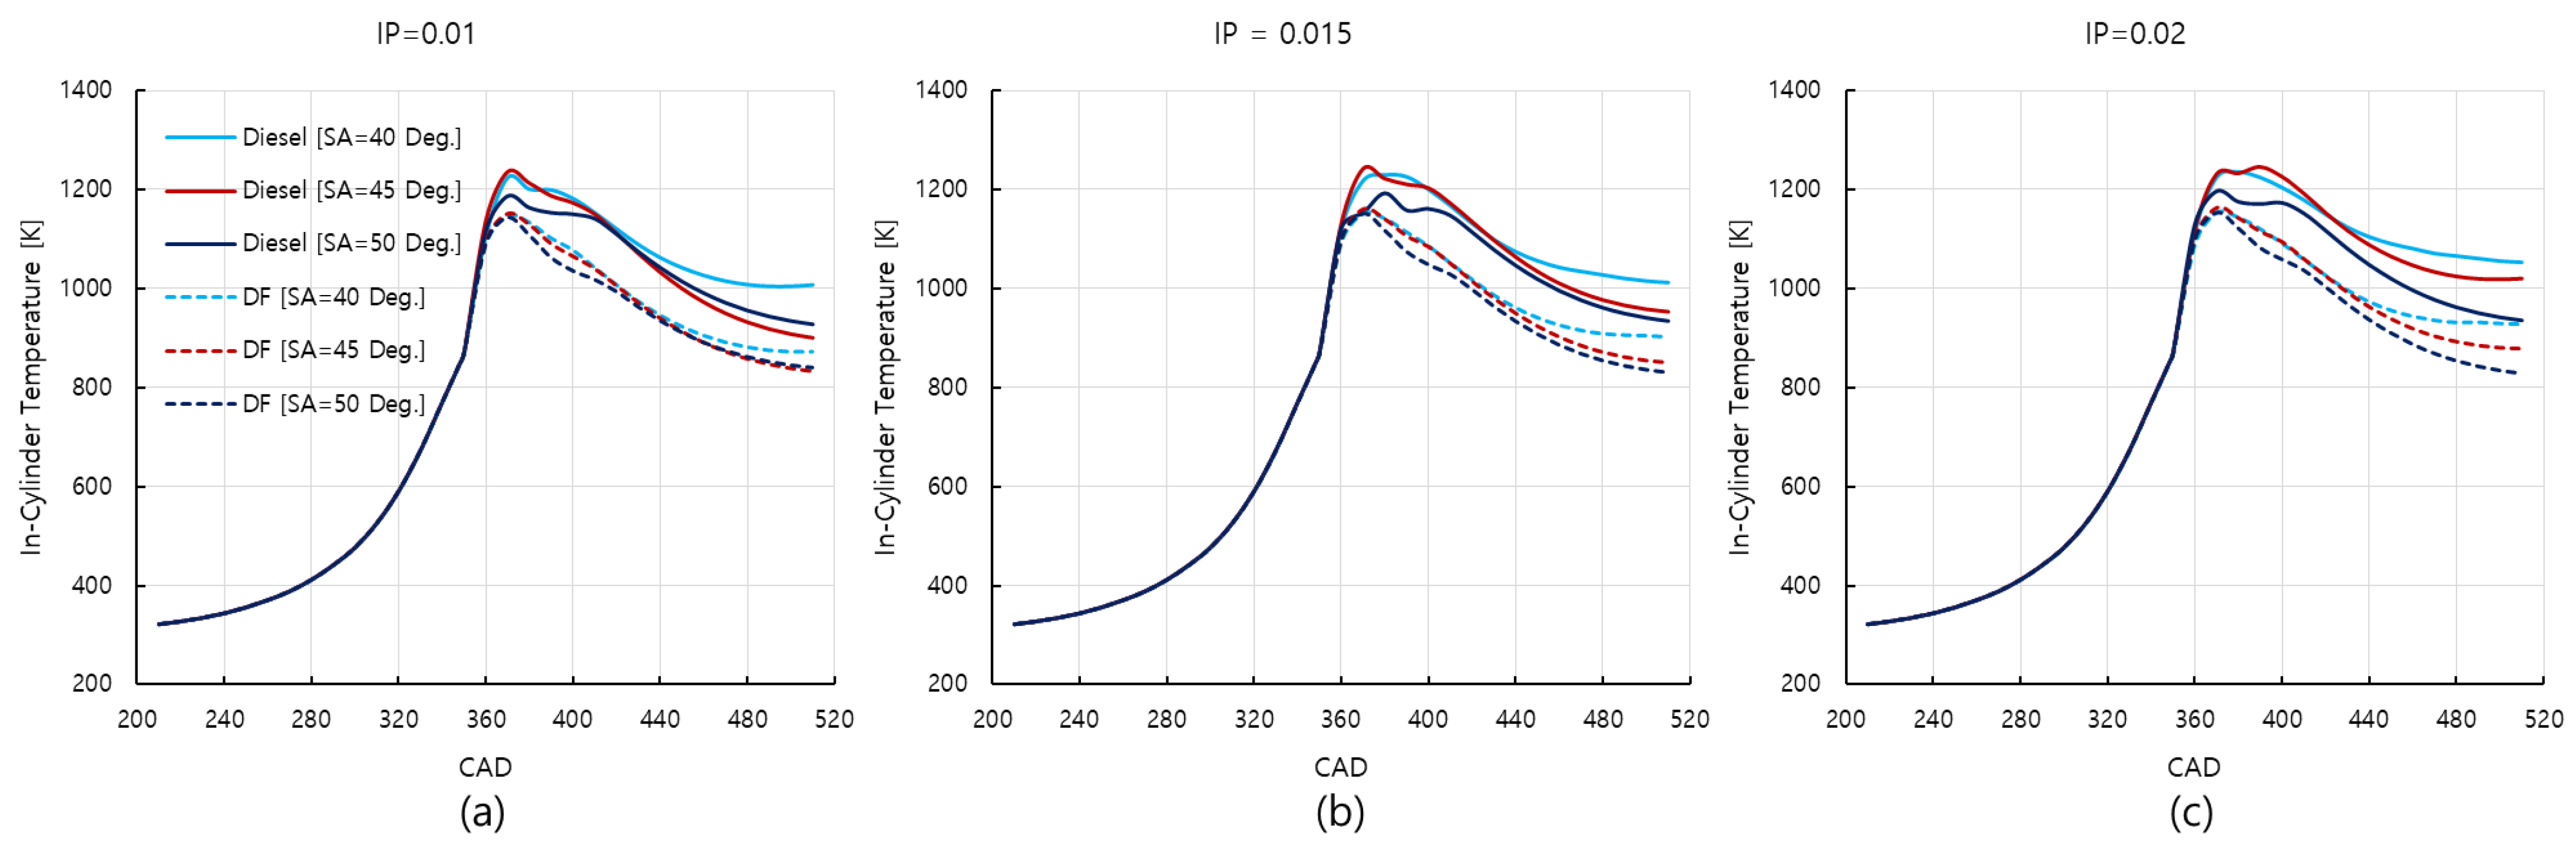
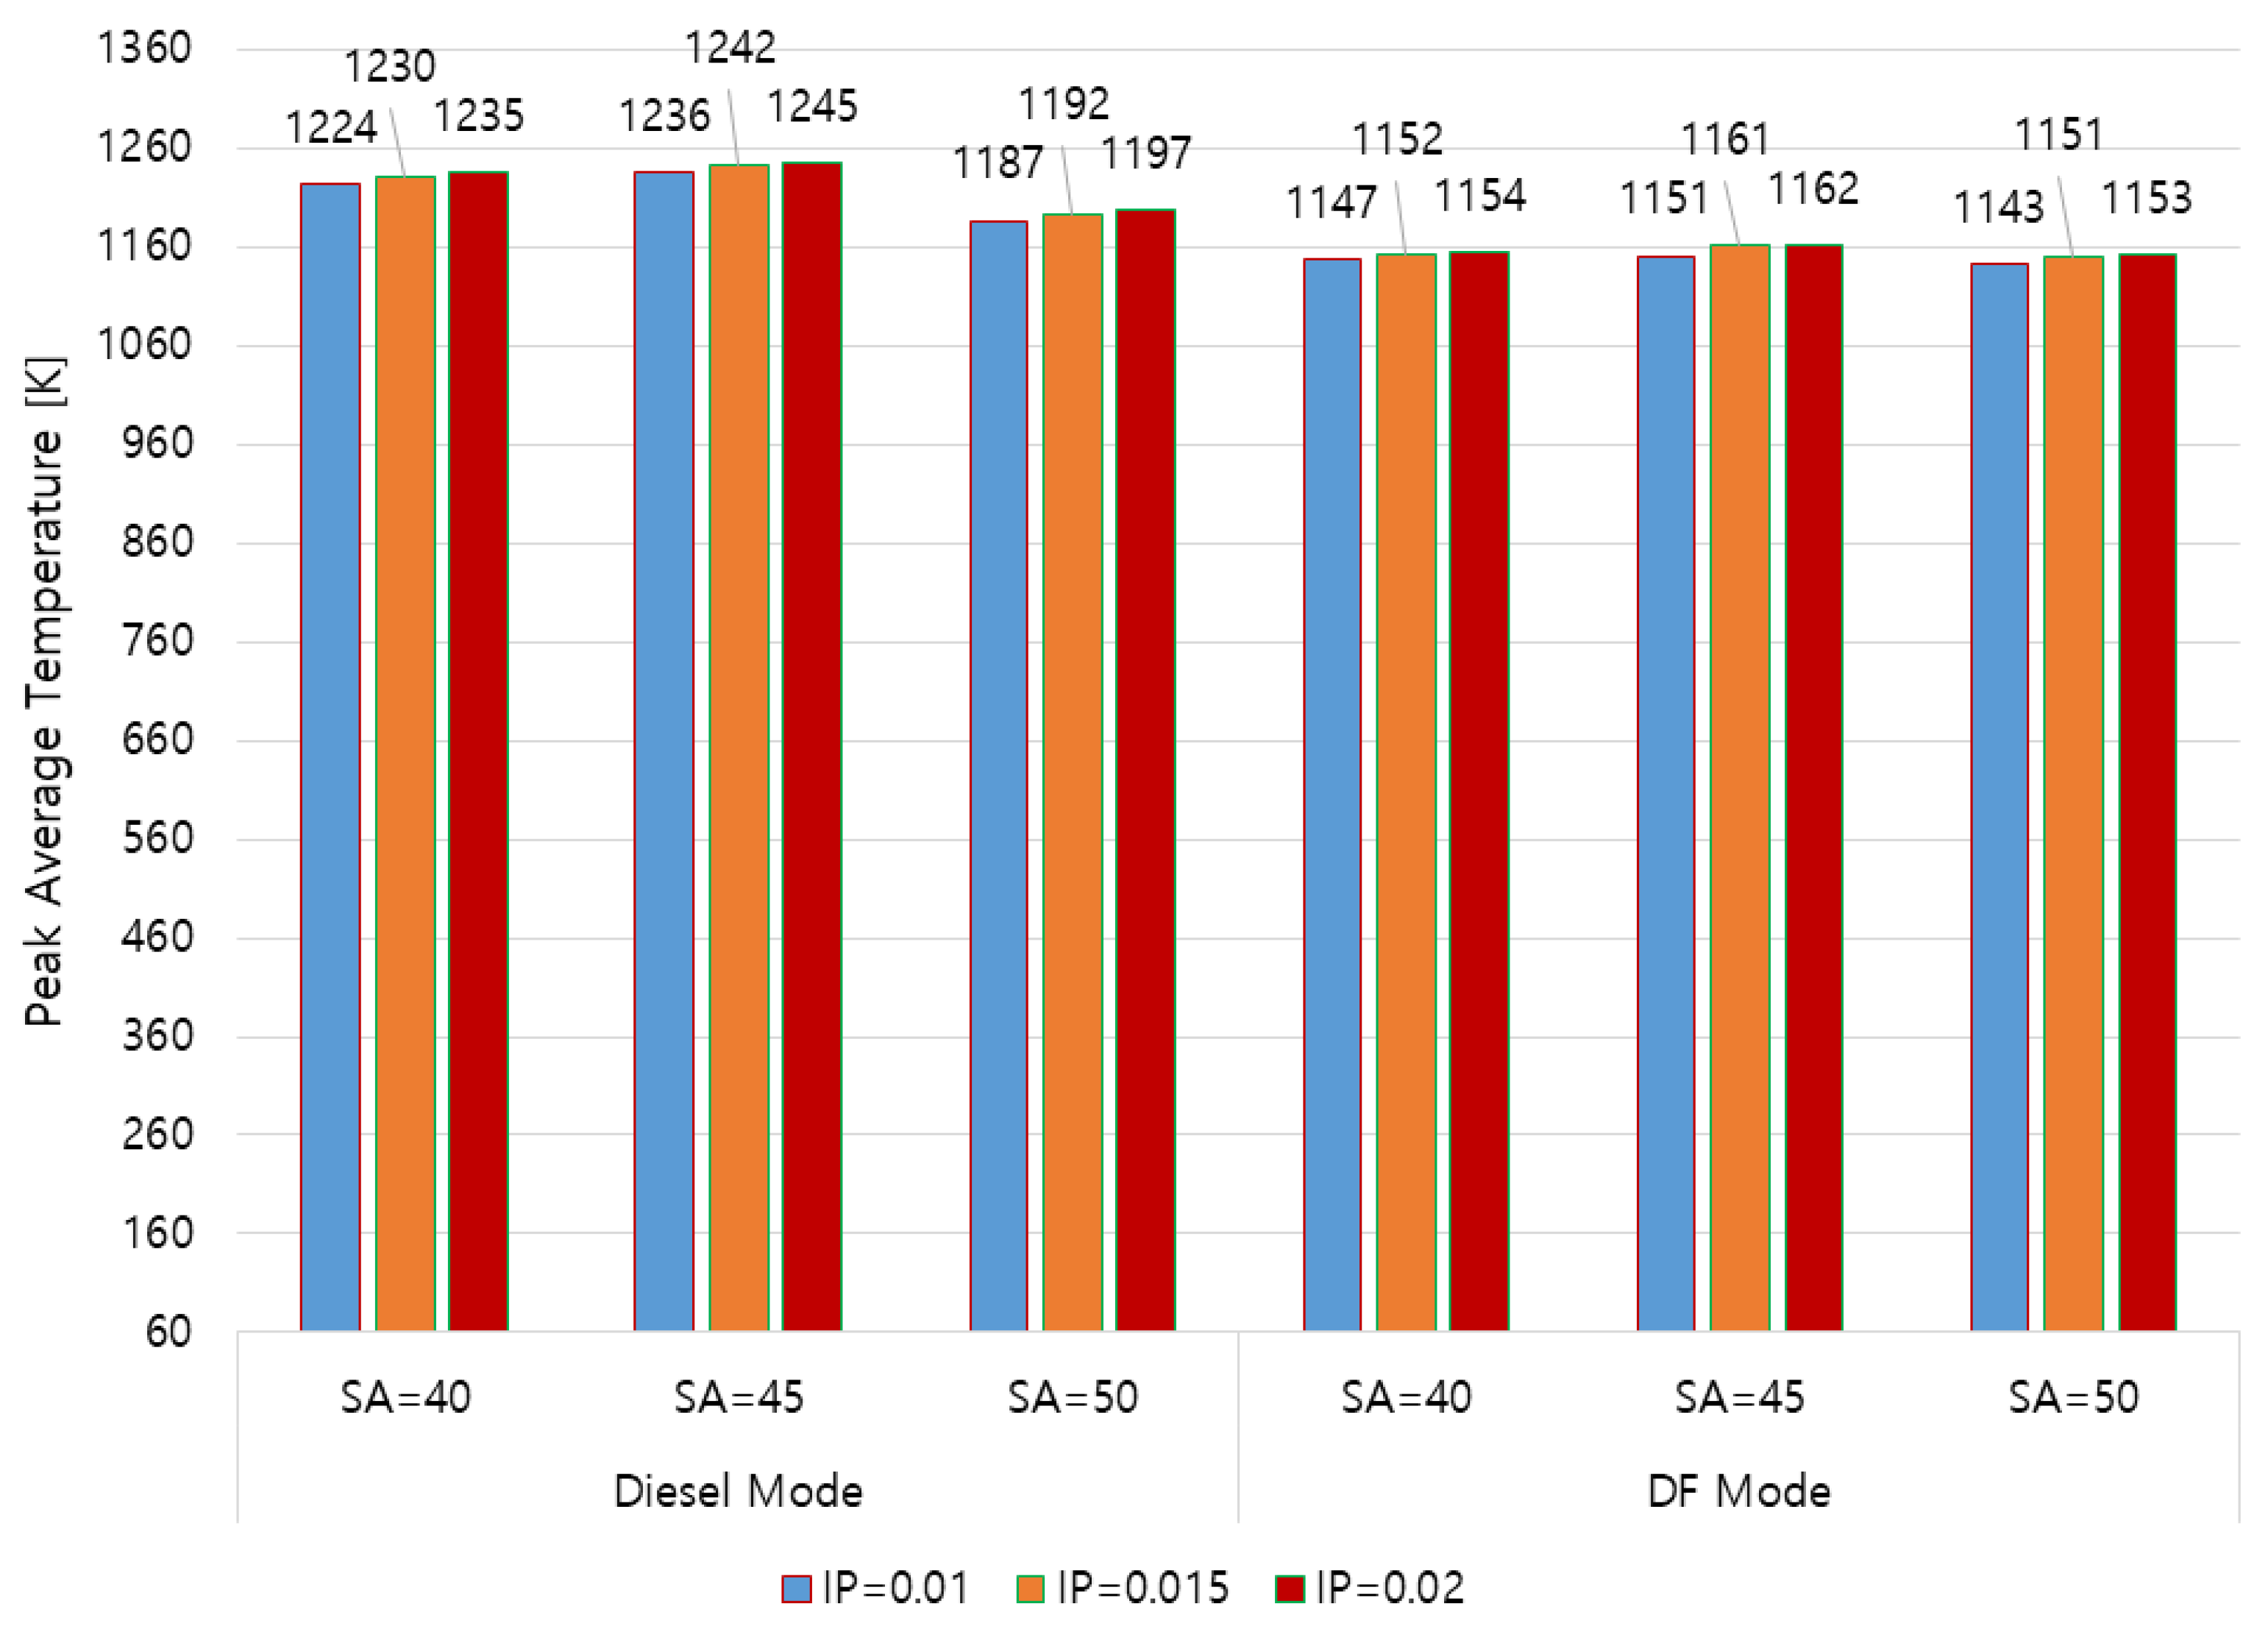
3.3. In-Cylinder Temperature and NO Emission
3.4. Soot Formation
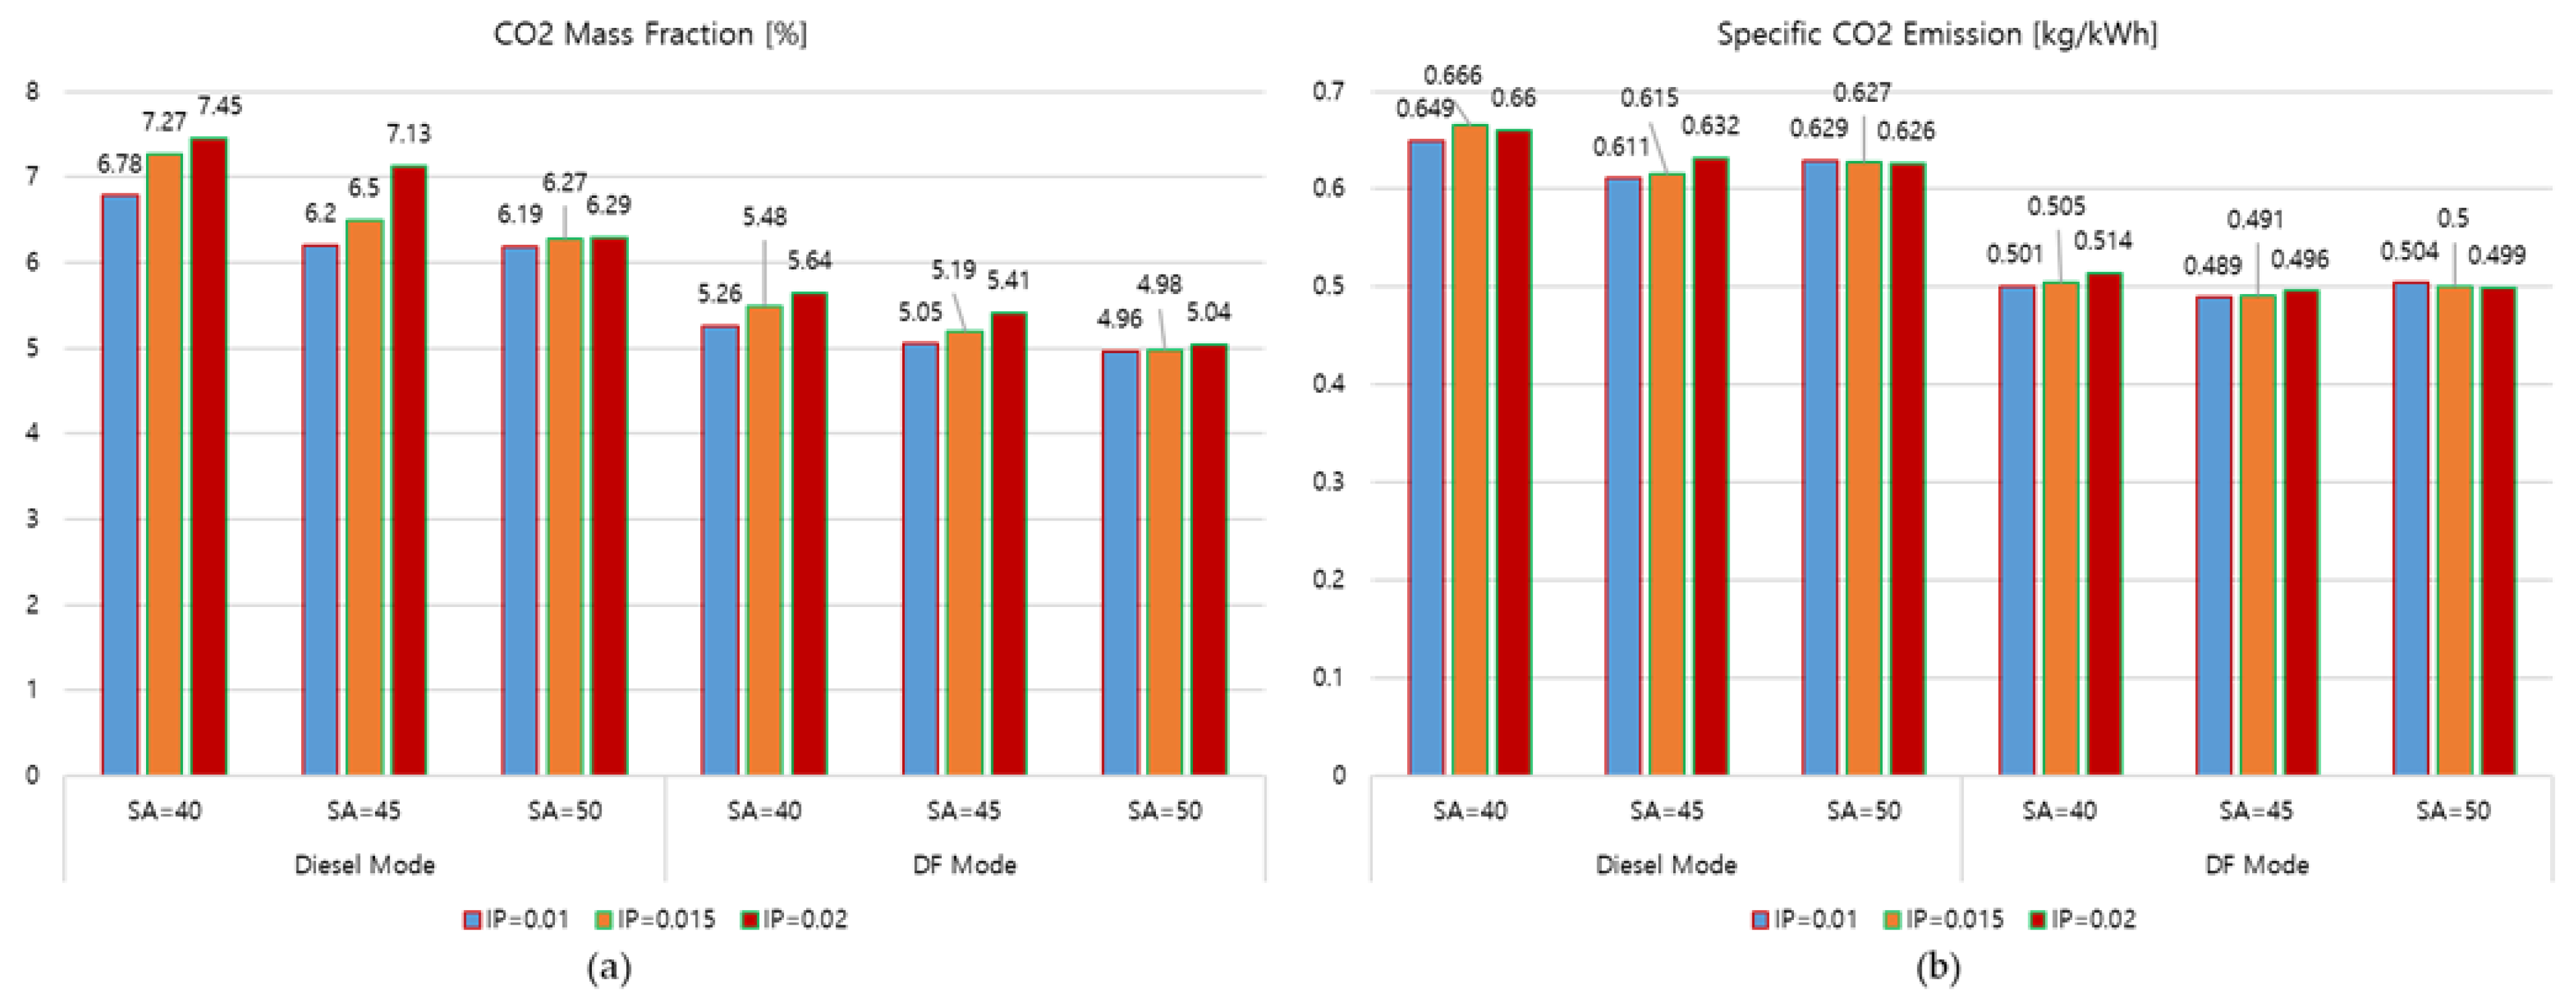
3.5. Carbon Dioxide (CO2) Emission
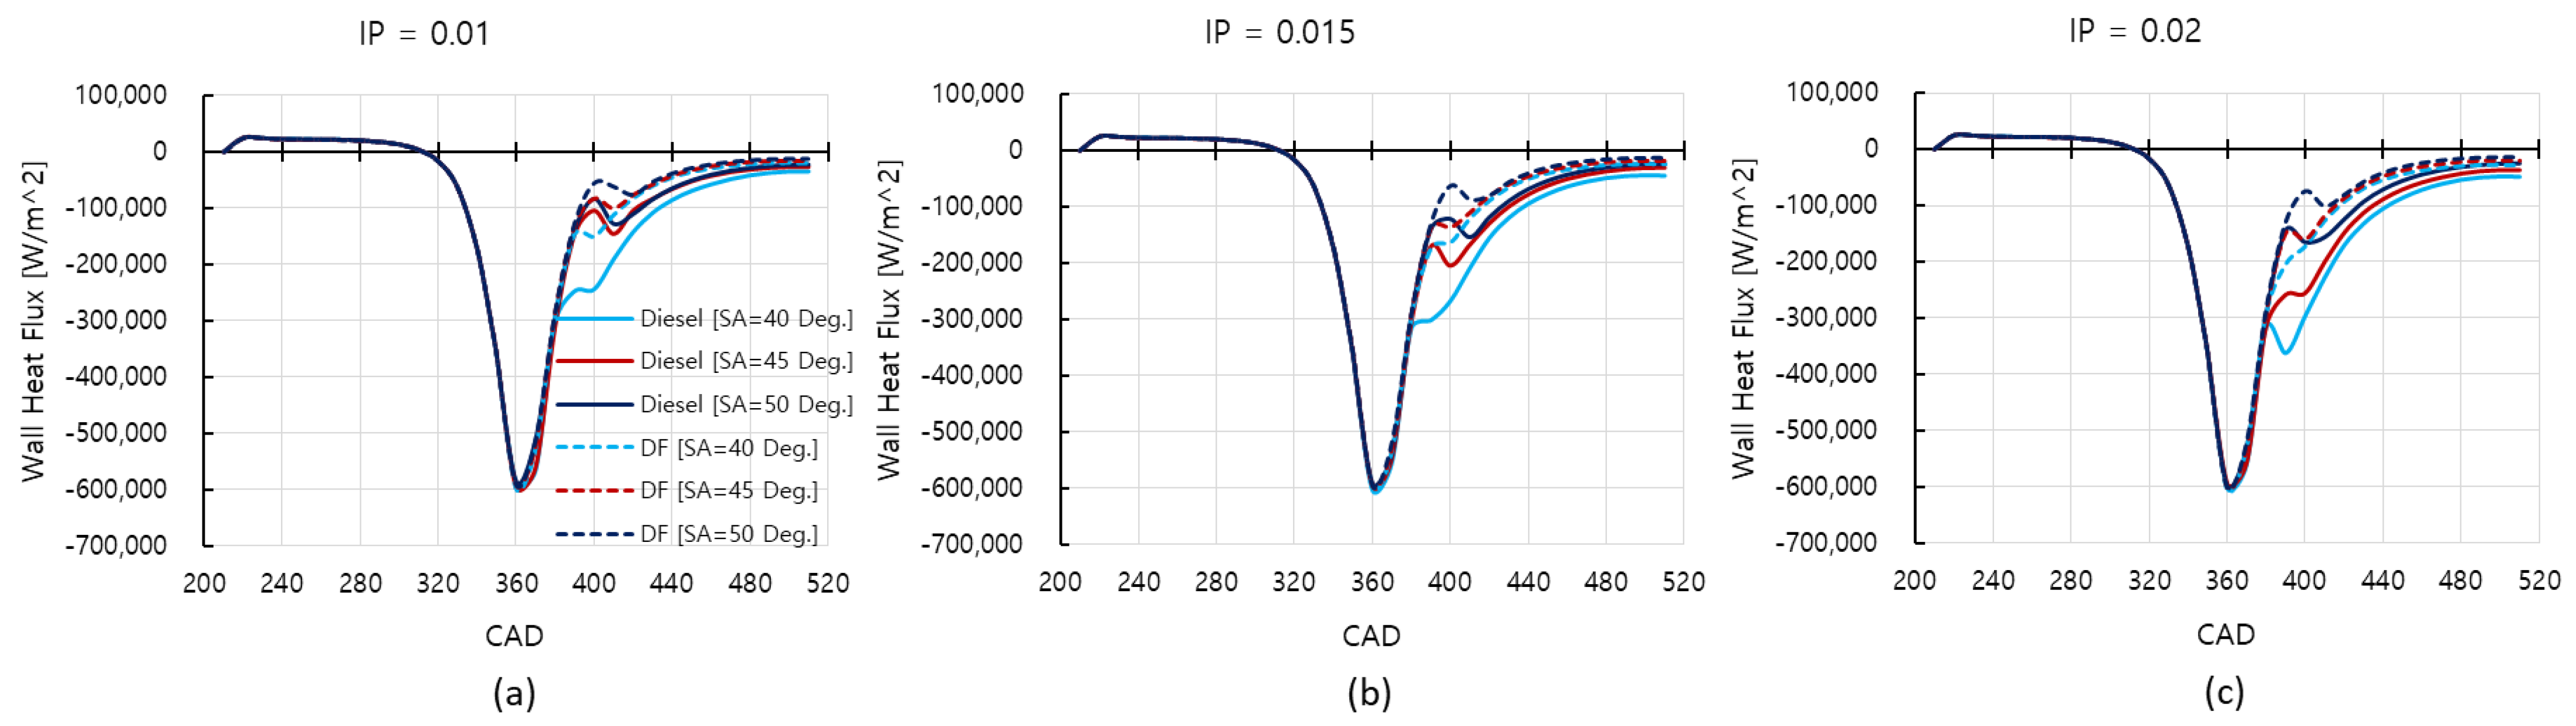
3.6. Wall Heat Flux
4. Conclusions
- -
- The IP of 0.02 m with an SA of 40 degrees produced the highest IMEP for the engine in both diesel and DF modes. This set of injection parameters increased the IMEP of the engine by 11.15% and 6.08% compared to when using the original set of injection parameters (IP = 0.01/SA = 45) in the diesel and DF mode, respectively. It is thus considered to be the optimal parameter that should be set for the fuel injector to enhance engine performance in both diesel and DF modes.
- -
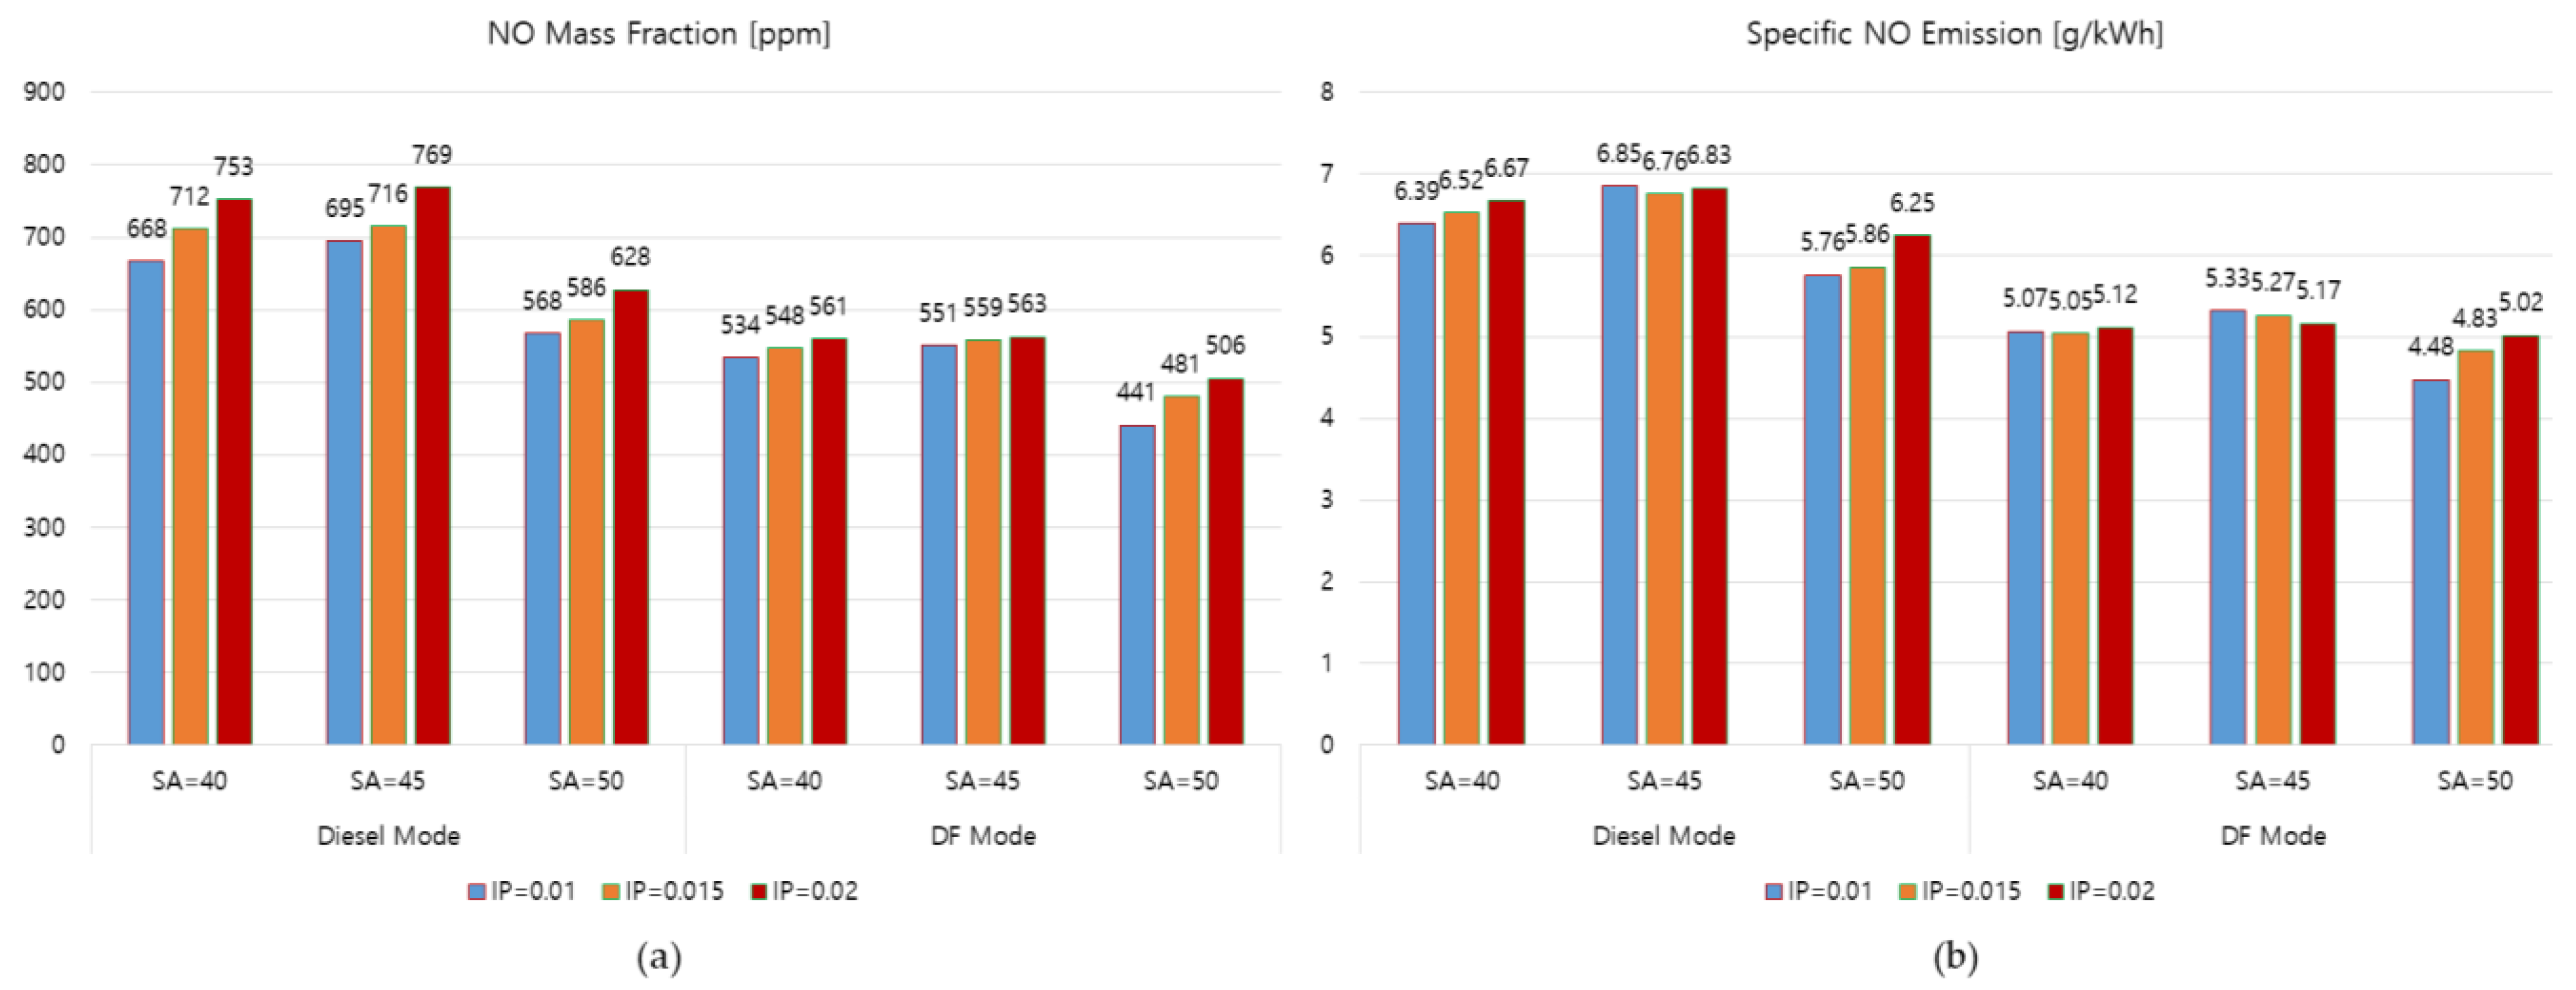
- The IP of 0.01 m with an SA of 50 degrees produced the lowest specific NO emission in both diesel and DF modes. This set of injection parameters decreased the specific NO emissions of the engine by 18.92% and 18.97% compared to when using the original set of injection parameters (IP = 0.01/SA = 45) in the diesel and DF mode, respectively. It is thus considered to be the optimal parameter that should be set for the fuel injector to reduce NO emissions in both diesel and DF modes.
- -
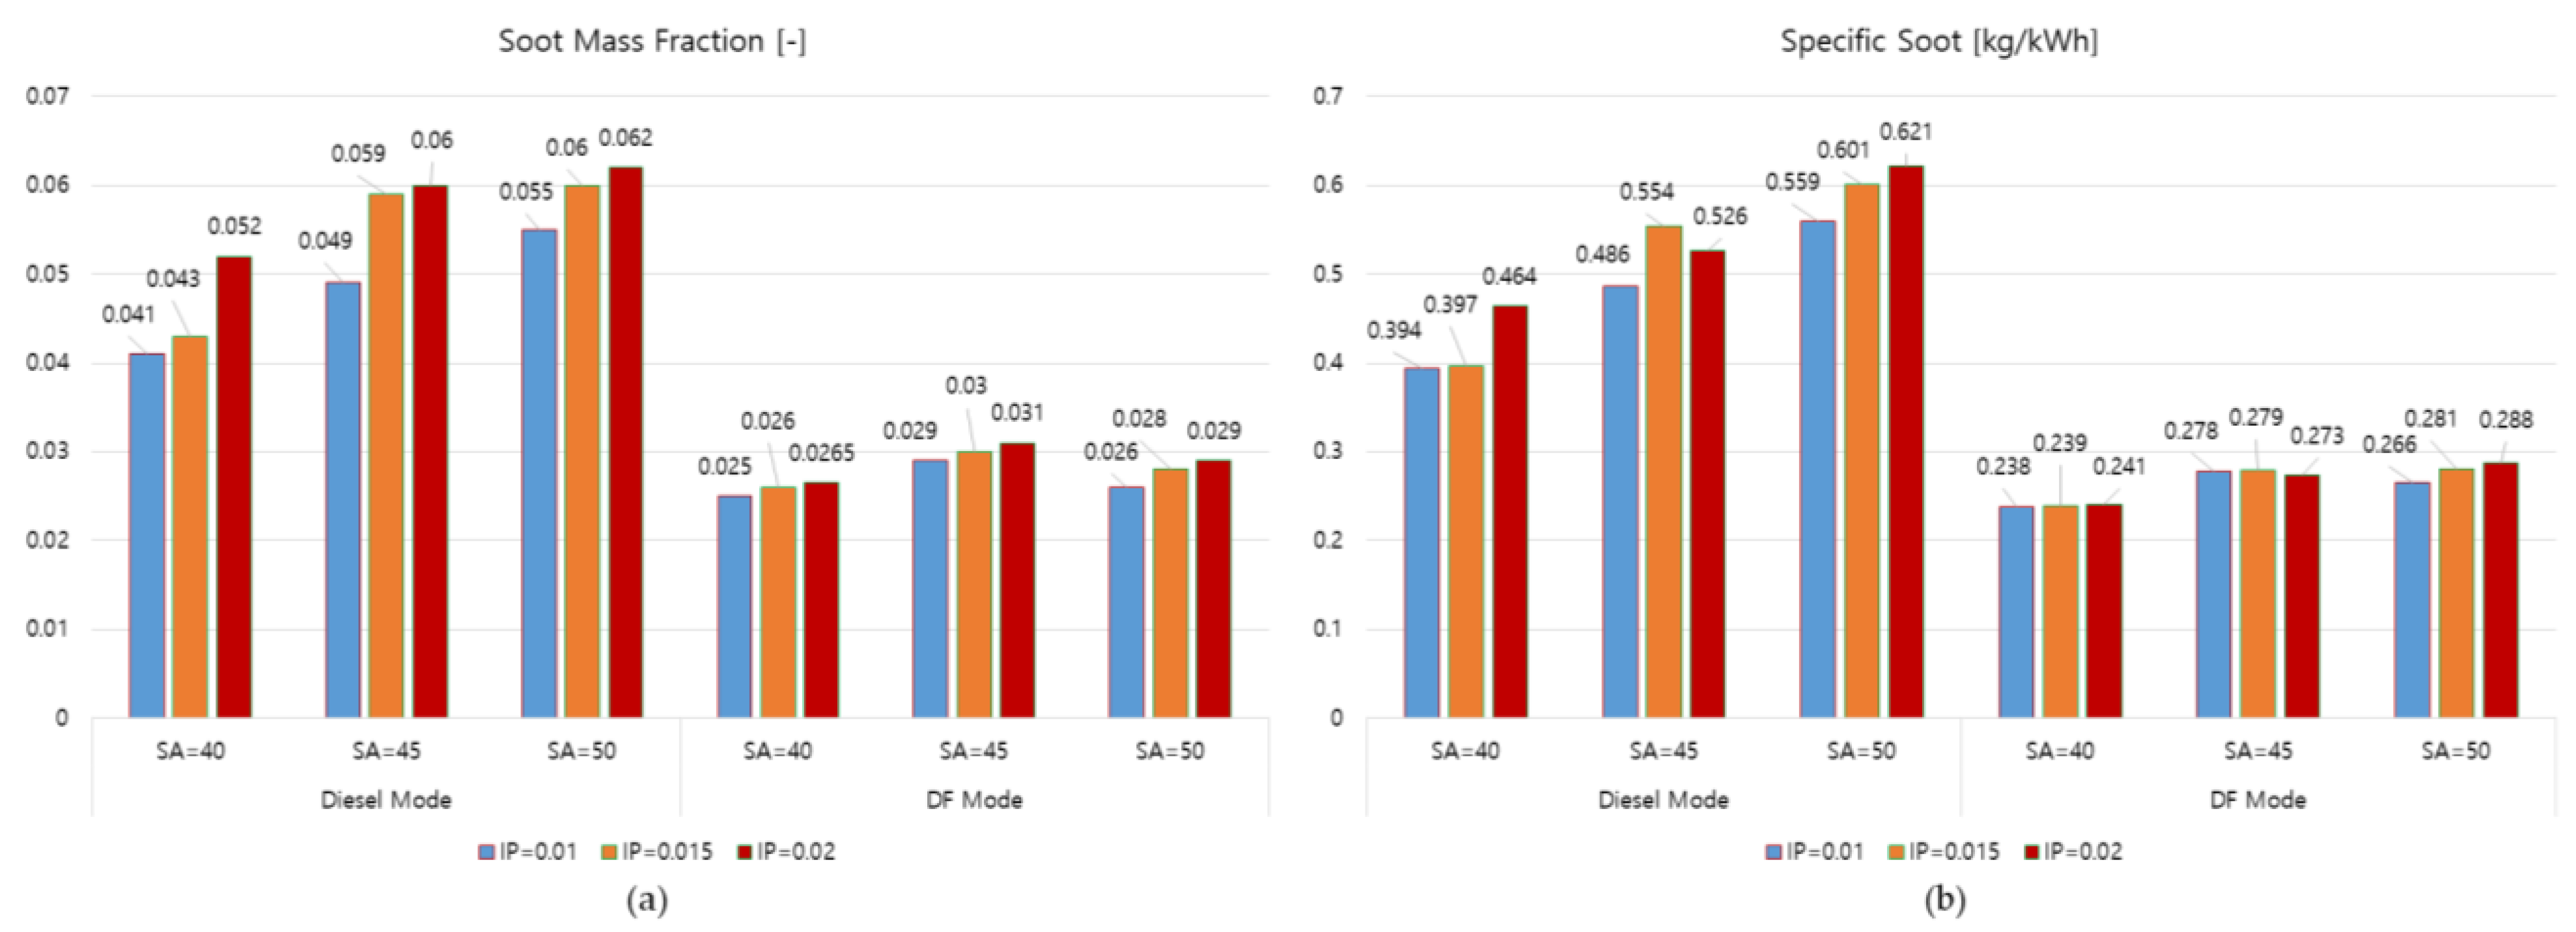
- The IP of 0.01 m with an SA of 40 degrees produced the lowest specific soot emission in both diesel and DF modes. This set of injection parameters decreased the specific soot emissions of the engine by 23.35% and 16.81% compared to when using the original set of injection parameters (IP = 0.01/SA = 45) in the diesel and DF mode, respectively. It is thus considered to be the optimal parameter that should be set for the fuel injector to reduce soot emissions in both diesel and DF modes.
- -
- The IP of 0.01 m with an SA of 45 degrees produced the lowest specific CO2 emission in both diesel and DF modes. This set of injection parameters is thus considered to be the optimal parameters that should be set for the fuel injector to reduce CO2 emissions in both diesel and DF modes.
- -
- The IP of 0.01 m helps to reduce heat losses through heat transfer from the combustion gas inside the engine cylinder to the engine combustion chamber walls.
Author Contributions
Funding
Institutional Review Board Statement
Informed Consent Statement
Data Availability Statement
Conflicts of Interest
Appendix A
Appendix A.1. Thermal NO Formation Reaction Mechanism
Appendix A.2. Thermal NO Formation Reaction Rates
References
- Thomson, H.; Corbett, J.J.; Winebrake, J.J. Natural gas as a marine fuel. Energy Policy 2015, 87, 153–167. [Google Scholar] [CrossRef] [Green Version]
- Wang, Z.; Zhou, S.; Feng, Y.; Zhu, Y. EGR modeling and fuzzy evaluation of Low-Speed Two-Stroke marine diesel engines. Sci. Total Environ. 2020, 706, 135444. [Google Scholar] [CrossRef] [PubMed]
- Bilgili, L. Life cycle comparison of marine fuels for IMO 2020 Sulphur Cap. Sci. Total Environ. 2021, 774, 145719. [Google Scholar] [CrossRef]
- Nations, U. COVID-19 and maritime transport: Impact and responses. In United Nations Conference on Trade and Development (UNCTAD); Routledge: New York, NY, USA, 2020. [Google Scholar]
- Kim, H.J.; Park, S.H.; Lee, C.S. Impact of fuel spray angles and injection timing on the combustion and emission characteristics of a high-speed diesel engine. Energy 2016, 107, 572–579. [Google Scholar] [CrossRef]
- Wei, S.; Ji, K.; Leng, X.; Wang, F.; Liu, X. Numerical simulation on effects of spray angle in a swirl chamber combustion system of DI (direct injection) diesel engines. Energy 2014, 75, 289–294. [Google Scholar] [CrossRef]
- Shu, J.; Fu, J.; Liu, J.; Ma, Y.; Wang, S.; Deng, B.; Zeng, D. Effects of injector spray angle on combustion and emissions characteristics of a natural gas (NG)-diesel dual fuel engine based on CFD coupled with reduced chemical kinetic model. Appl. Energy 2019, 233, 182–195. [Google Scholar] [CrossRef]
- Banapurmath, N.; Marikatti, M.K.; Hunashyal, A.; Tewari, P. Combustion characteristics of a four-stroke CI engine operated on Honge and Jatropha oil methyl ester–ethanol blends when directly injected and dual fuelled with CNG induction. Int. J. Sustain. Eng. 2011, 4, 145–152. [Google Scholar] [CrossRef]
- Decan, G.; Lucchini, T.; D’Errico, G.; Verhelst, S. A novel technique for detailed and time-efficient combustion modeling of fumigated dual-fuel internal combustion engines. Appl. Therm. Eng. 2020, 174, 115224. [Google Scholar] [CrossRef]
- Wei, L.; Geng, P. A review on natural gas/diesel dual fuel combustion, emissions and performance. Fuel Process. Technol. 2016, 142, 264–278. [Google Scholar] [CrossRef]
- Pham, V.C.; Choi, J.-H.; Rho, B.-S.; Kim, J.-S.; Park, K.; Park, S.-K.; Le, V.V.; Lee, W.-J. A numerical study on the combustion process and emission characteristics of a natural gas-diesel dual-fuel marine engine at full load. Energies 2021, 14, 1342. [Google Scholar] [CrossRef]
- Pham, V.C.; Rho, B.-S.; Kim, J.-S.; Lee, W.-J.; Choi, J.-H. Effects of various fuels on combustion and emission characteristics of a four-stroke dual-fuel marine engine. J. Mar. Sci. Eng. 2021, 9, 1072. [Google Scholar] [CrossRef]
- Solutions, M.E. MAN B&W ME-GI Installation in Very Large or Ultra Large Container Vessels. 2450 Copenhagen SV, Denmark, October 2018. Available online: https://www.man-es.com/docs/default-source/document-sync/b-w-me-gi-installation-in-very-large-or-ultra-large-container-vessel-eng.pdf?sfvrsn=2366ce2e_0 (accessed on 8 March 2022).
- Nemati, A.; Fathi, V.; Barzegar, R.; Khalilarya, S. Numerical investigation of the effect of injection timing under various equivalence ratios on energy and exergy terms in a direct injection SI hydrogen fueled engine. Int. J. Hydrog. Energy 2013, 38, 1189–1199. [Google Scholar] [CrossRef]
- Nehmer, D.A.; Reitz, R.D. Measurement of the effect of injection rate and split injections on diesel engine soot and NOx emissions. SAE Trans. 1994, 103, 1030–1041. [Google Scholar]
- Tow, T.; Pierpont, D.; Reitz, R.D. Reducing particulate and NO x emissions by using multiple injections in a heavy duty DI diesel engine. SAE Trans. 1994, 103, 1403–1417. [Google Scholar]
- Han, Z.; Uludogan, A.; Hampson, G.J.; Reitz, R.D. Mechanism of soot and NOx emission reduction using multiple-injection in a diesel engine. SAE Trans. 1996, 105, 837–852. [Google Scholar]
- Montgomery, D.; Reitz, R.D. Six-mode cycle evaluation of the effect of EGR and multiple injections on particulate and NOx emissions from a DI diesel engine. SAE Trans. 1996, 105, 356–373. [Google Scholar]
- Pierpont, D.; Montgomery, D.; Reitz, R.D. Reducing particulate and NOx using multiple injections and EGR in a DI diesel. SAE Trans. 1995, 104, 171–183. [Google Scholar]
- Nygård, A.; Altimira, M.; Semlitsch, B.; Wittberg, L.P.; Fuchs, L. Analysis of Vortical Structures in Intermittent Jets. In Proceedings of the 5th International Conference on Jets, Wakes and Separated Flows (ICJWSF2015), Stockholm, Denmark, 15–18 June 2015; Springer: Berlin/Heidelberg, Germany, 2016; pp. 3–10. [Google Scholar]
- Seol, J.-H.; Pham, V.C.; Lee, W.-J. Effects of the Multiple Injection Strategy on Combustion and Emission Characteristics of a Two-Stroke Marine Engine. Energies 2021, 14, 6821. [Google Scholar] [CrossRef]
- Maghbouli, A.; Yang, W.; An, H.; Li, J.; Shafee, S. Effects of injection strategies and fuel injector configuration on combustion and emission characteristics of a DI diesel engine fueled by bio-diesel. Renew. Energy 2015, 76, 687–698. [Google Scholar] [CrossRef]
- Mobasheri, R.; Peng, Z. A Computational Investigation into the Effects of Included Spray Angle on Heavy-Duty Diesel Engine Operating Parameters; SAE Technical Paper; SAE International: Warrendale, PA, USA, 2012; ISSN 0148-7191. [Google Scholar]
- Yoon, S.H.; Cha, J.P.; Lee, C.S. An investigation of the effects of spray angle and injection strategy on dimethyl ether (DME) combustion and exhaust emission characteristics in a common-rail diesel engine. Fuel Process. Technol. 2010, 91, 1364–1372. [Google Scholar] [CrossRef]
- Park, S.W.; Reitz, R.D. Optimization of fuel/air mixture formation for stoichiometric diesel combustion using a 2-spray-angle group-hole nozzle. Fuel 2009, 88, 843–852. [Google Scholar] [CrossRef]
- Dolak, J.; Reitz, R. Optimization of the piston geometry of a diesel engine using a two-spray-angle nozzle. Proc. Inst. Mech. Eng. Part D J. Automob. Eng. 2011, 225, 406–421. [Google Scholar] [CrossRef]
- Taghavifar, H.; Taghavifar, H.; Mardani, A.; Mohebbi, A. Exhaust emissions prognostication for DI diesel group-hole injectors using a supervised artificial neural network approach. Fuel 2014, 125, 81–89. [Google Scholar] [CrossRef]
- Siewert, R.M. Spray Angle and Rail Pressure Study for Low NOx Diesel Combustion; SAE Technical Paper; SAE International: Warrendale, PA, USA, 2007; ISSN 0148-7191. [Google Scholar]
- Kitasei, T.; Yamada, J.; Shoji, T.; Shiino, S.; Mori, K. Influence of the Different Fuel Spray Wall Impingement Angles on Smoke Emission in a DI-Diesel Engine; SAE Technical Paper; SAE International: Warrendale, PA, USA, 2008; ISSN 0148-7191. [Google Scholar]
- Kim, H.; Reitz, R.D.; Kong, S.-C. Modeling Combustion and Emissions of HSDI Diesel Engines Using Injectors with Different Included Spray Angles; SAE Technical Paper; SAE International: Warrendale, PA, USA, 2006; ISSN 0148-7191. [Google Scholar]
- Fang, T.; Coverdill, R.E.; Chia-fon, F.L.; White, R.A. Effects of injection angles on combustion processes using multiple injection strategies in an HSDI diesel engine. Fuel 2008, 87, 3232–3239. [Google Scholar] [CrossRef]
- Lim, J.; Min, K. The Effects of Spray Angle and Piston Bowl Shape on Diesel Engine Soot Emissions Using 3-D CFD Simulation; SAE Technical Paper; SAE International: Warrendale, PA, USA, 2005; ISSN 0148-7191. [Google Scholar]
- ANSYS, Inc. ANSYS Fluent Theory Guide. 2022. Available online: https://www.ansys.com/ (accessed on 8 March 2022).
- ANSYS, Inc. Geometry Decomposition for Sector Combustion Simulation. Volume Fluent 19.2. 2022. Available online: https://www.ansys.com/ (accessed on 8 March 2022).
- National Center for Biotechnology Information. PubChem Compound. Decane–Compound Summary. Available online: https://pubchem.ncbi.nlm.nih.gov/compound/Decane (accessed on 25 February 2022).
- Friend, D.G.; Ely, J.F.; Ingham, H. Thermophysical properties of methane. J. Phys. Chem. Ref. Data 1989, 18, 583–638. [Google Scholar] [CrossRef]
- Durbin, P.A. Near-wall turbulence closure modeling without “damping functions”. Theor. Comput. Fluid Dyn. 1991, 3, 1–13. [Google Scholar]
- Jia, L.; Yu, Y.; Li, Z.-P.; Qin, S.-N.; Guo, J.-R.; Zhang, Y.-Q.; Wang, J.-C.; Zhang, J.-C.; Fan, B.-G.; Jin, Y. Study on the Hg0 removal characteristics and synergistic mechanism of iron-based modified biochar doped with multiple metals. Bioresour. Technol. 2021, 332, 125086. [Google Scholar] [CrossRef]
- Pope, S.B. PDF methods for turbulent reactive flows. Prog. Energy Combust. Sci. 1985, 11, 119–192. [Google Scholar] [CrossRef]
- Rao, V.; Honnery, D. A comparison of two NOx prediction schemes for use in diesel engine thermodynamic modelling. Fuel 2013, 107, 662–670. [Google Scholar] [CrossRef]
- Brookes, S.; Moss, J. Predictions of soot and thermal radiation properties in confined turbulent jet diffusion flames. Combust. Flame 1999, 116, 486–503. [Google Scholar] [CrossRef]
- Kong, S.-C.; Reitz, R. Use of detailed chemical kinetics to study HCCI engine combustion with consideration of turbulent mixing effects. J. Eng. Gas. Turbines Power 2002, 124, 702–707. [Google Scholar] [CrossRef]
- Montazeri, H.; Blocken, B. CFD simulation of wind-induced pressure coefficients on buildings with and without balconies: Validation and sensitivity analysis. Build. Environ. 2013, 60, 137–149. [Google Scholar] [CrossRef]
- Meng, F.-Q.; He, B.-J.; Zhu, J.; Zhao, D.-X.; Darko, A.; Zhao, Z.-Q. Sensitivity analysis of wind pressure coefficients on CAARC standard tall buildings in CFD simulations. J. Build. Eng. 2018, 16, 146–158. [Google Scholar] [CrossRef]
- Celik, I.B.G.U.; Roache, P.J.; Freitas, C.J.; Coleman, H.; Raad, P.E. Procedure for Estimation and Reporting of Uncertainty Due to Discretization in CFD Applications. J. Fluids Eng. 2008, 130, 078001-1–078001-4. [Google Scholar]
- Savli, M. Turbulence Kinetic Energy–TKE; Faculty of Mathematics and Physics, University of Ljubljana: Ljubljana, Slovenia, 2012; p. 9. [Google Scholar]
- Heywood, J.B. Internal Combustion Engine Fundamentals; McGraw-Hill Education: New York, NY, USA, 1998. [Google Scholar]
- Shahbaz, M.; Jüngst, N.; Grzeszik, R.; Kaiser, S. Endoscopic fuel film, chemiluminescence, and soot incandescence imaging in a direct-injection spark-ignition engine. Proc. Combust. Inst. 2021, 38, 5869–5877. [Google Scholar] [CrossRef]
- Mansurov, Z. Combust. Explos. Shock Waves 2005, 41, 727–744. [Google Scholar] [CrossRef]
- Zhang, Q.; Li, M.; Shao, S. Combustion process and emissions of a heavy-duty engine fueled with directly injected natural gas and pilot diesel. Appl. Energy 2015, 157, 217–228. [Google Scholar] [CrossRef]
- Blauwens, J.; Smets, B.; Peeters, J. Mechanism of “prompt” no formation in hydrocarbon flames. Symp. (Int.) Combust. 1977, 16, 1055–1064. [Google Scholar] [CrossRef]
- Flower, W.L.; Hanson, R.K.; Kruger, C.H. Kinetics of the reaction of nitric oxide with hydrogen. Symp. (Int.) Combust. 1975, 15, 823–832. [Google Scholar] [CrossRef]
- Monat, J.P.; Hanson, R.K.; Kruger, C.H. Shock tube determination of the rate coefficient for the reaction N2 + O → NO + N. Symp. (Int.) Combust. 1979, 17, 543–552. [Google Scholar] [CrossRef]
- Baulch, D.; Drysdale, D.; Horne, D.; Lloyd, A. Evaluated Kinetic Data for High Temperature Reactions; Butterworths: London, UK, 1973; Volumes 1–2. [Google Scholar]
- Hanson, R.K.; Salimian, S. Survey of rate constants in the N/H/O system. In Combustion Chemistry; Springer: Berlin/Heidelberg, Germany, 1984; pp. 361–421. [Google Scholar]


| Parameter | Value | Unit |
|---|---|---|
| Name of Engine | 5G70ME-C9.5-GI | |
| Type of Engine | 2-Stroke Dual-Fuel Engine | |
| Pilot Fuel Supplying Method | Direct Injection | |
| Gas Fuel Supplying Method | Direct Injection | |
| No. of Pilot Injector | 3 | |
| No. of Gas Injector | 3 | |
| No. of Cylinder | 5 | |
| Cylinder Bore x Stroke | 700 × 3256 | mm |
| Compression Ratio | 13.7 | - |
| Connecting Rod Length | 4075 | mm |
| Rated Speed | 70 | rpm |
| Rated Power @ Rated Speed | 10,225 | kW |
| Indicated Mean Effective Pressure (IMEP) | 15.8 | bar |
| Mesh Properties and Qualities | |
|---|---|
| Type of elements | Hexahedral |
| No. of nodes at the TDC | 63,903 |
| No. of elements at the TDC | 66,715 |
| Inflation | Total Thickness |
| Maximum thickness [mm] | 1.2 |
| Number of layers [-] | 5 |
| Growth rate [-] | 1.2 |
| Maximum aspect ratio [-] | 17.07 |
| Maximum skewness ratio [-] | 0.78 |
| Minimum orthogonal quality [-] | 0.55 |
| Simulation Case | Injection Position (IP) [Unit: m] | |||
|---|---|---|---|---|
| 0.01 | 0.015 | 0.02 | ||
| Spray Angle (SA) [Unit: degree] | 40 | SA = 40/IP = 0.01 | SA = 40/IP = 0.015 | SA = 40/IP = 0.02 |
| 45 | SA = 45/IP = 0.01 | SA = 45/IP = 0.015 | SA = 45/IP = 0.02 | |
| 50 | SA = 50/IP = 0.01 | SA = 50/IP = 0.015 | SA = 50/IP = 0.02 | |
| Fuel | Diesel | NG | Unit |
|---|---|---|---|
| Density | 730 | 0.657 | kg/m3 @ 25 °C, 1 at |
| Chemical name/formula | n-Decane/C10H22 | Methane/CH4 | |
| Lower calorific value | 42,000 | 50,000 | kJ/kg |
| Molecular weight | 142.284 | 16.043 | g/mol |
| Boiling point | 174 | −162 | °C |
| Auto-ignition temperature | 223 | 537 | °C |
| Specific heat capacity (Cp) | 2090 | 35.69 | J/mol·K @ 25 °C |
| Stoichiometric air–fuel ratio | 14.98 | 17.19 | kg/kg |
| Model | Description | |
|---|---|---|
| Combustion | Non-premixed combustion model coupling with the PDF reduced chemical mechanism | |
| Emission | NO | Extended Zeldovich |
| Soot | Moss–Brookes model | |
| Fuel injection | Spray | Discrete Phase Model (DPM) |
| Breakup | KHRT | |
| Ignition | Auto-ignition | |
| Collision | Stochastic Collision model | |
| Turbulence | Standard k-ε model | |
| Boundary Names | Boundary Types | Specific Conditions/Values |
|---|---|---|
| Piston | Movable wall | Temp./297 °C |
| Liner | Layering wall | Temp./197 °C |
| Cylinder head | Stationary wall | Temp./297 °C |
| Segment cut | Cyclic | |
| Initial Conditions | Values | |
| Scavenging air temp. | 46 °C | |
| Scavenging air press. | 2.2 Bar | |
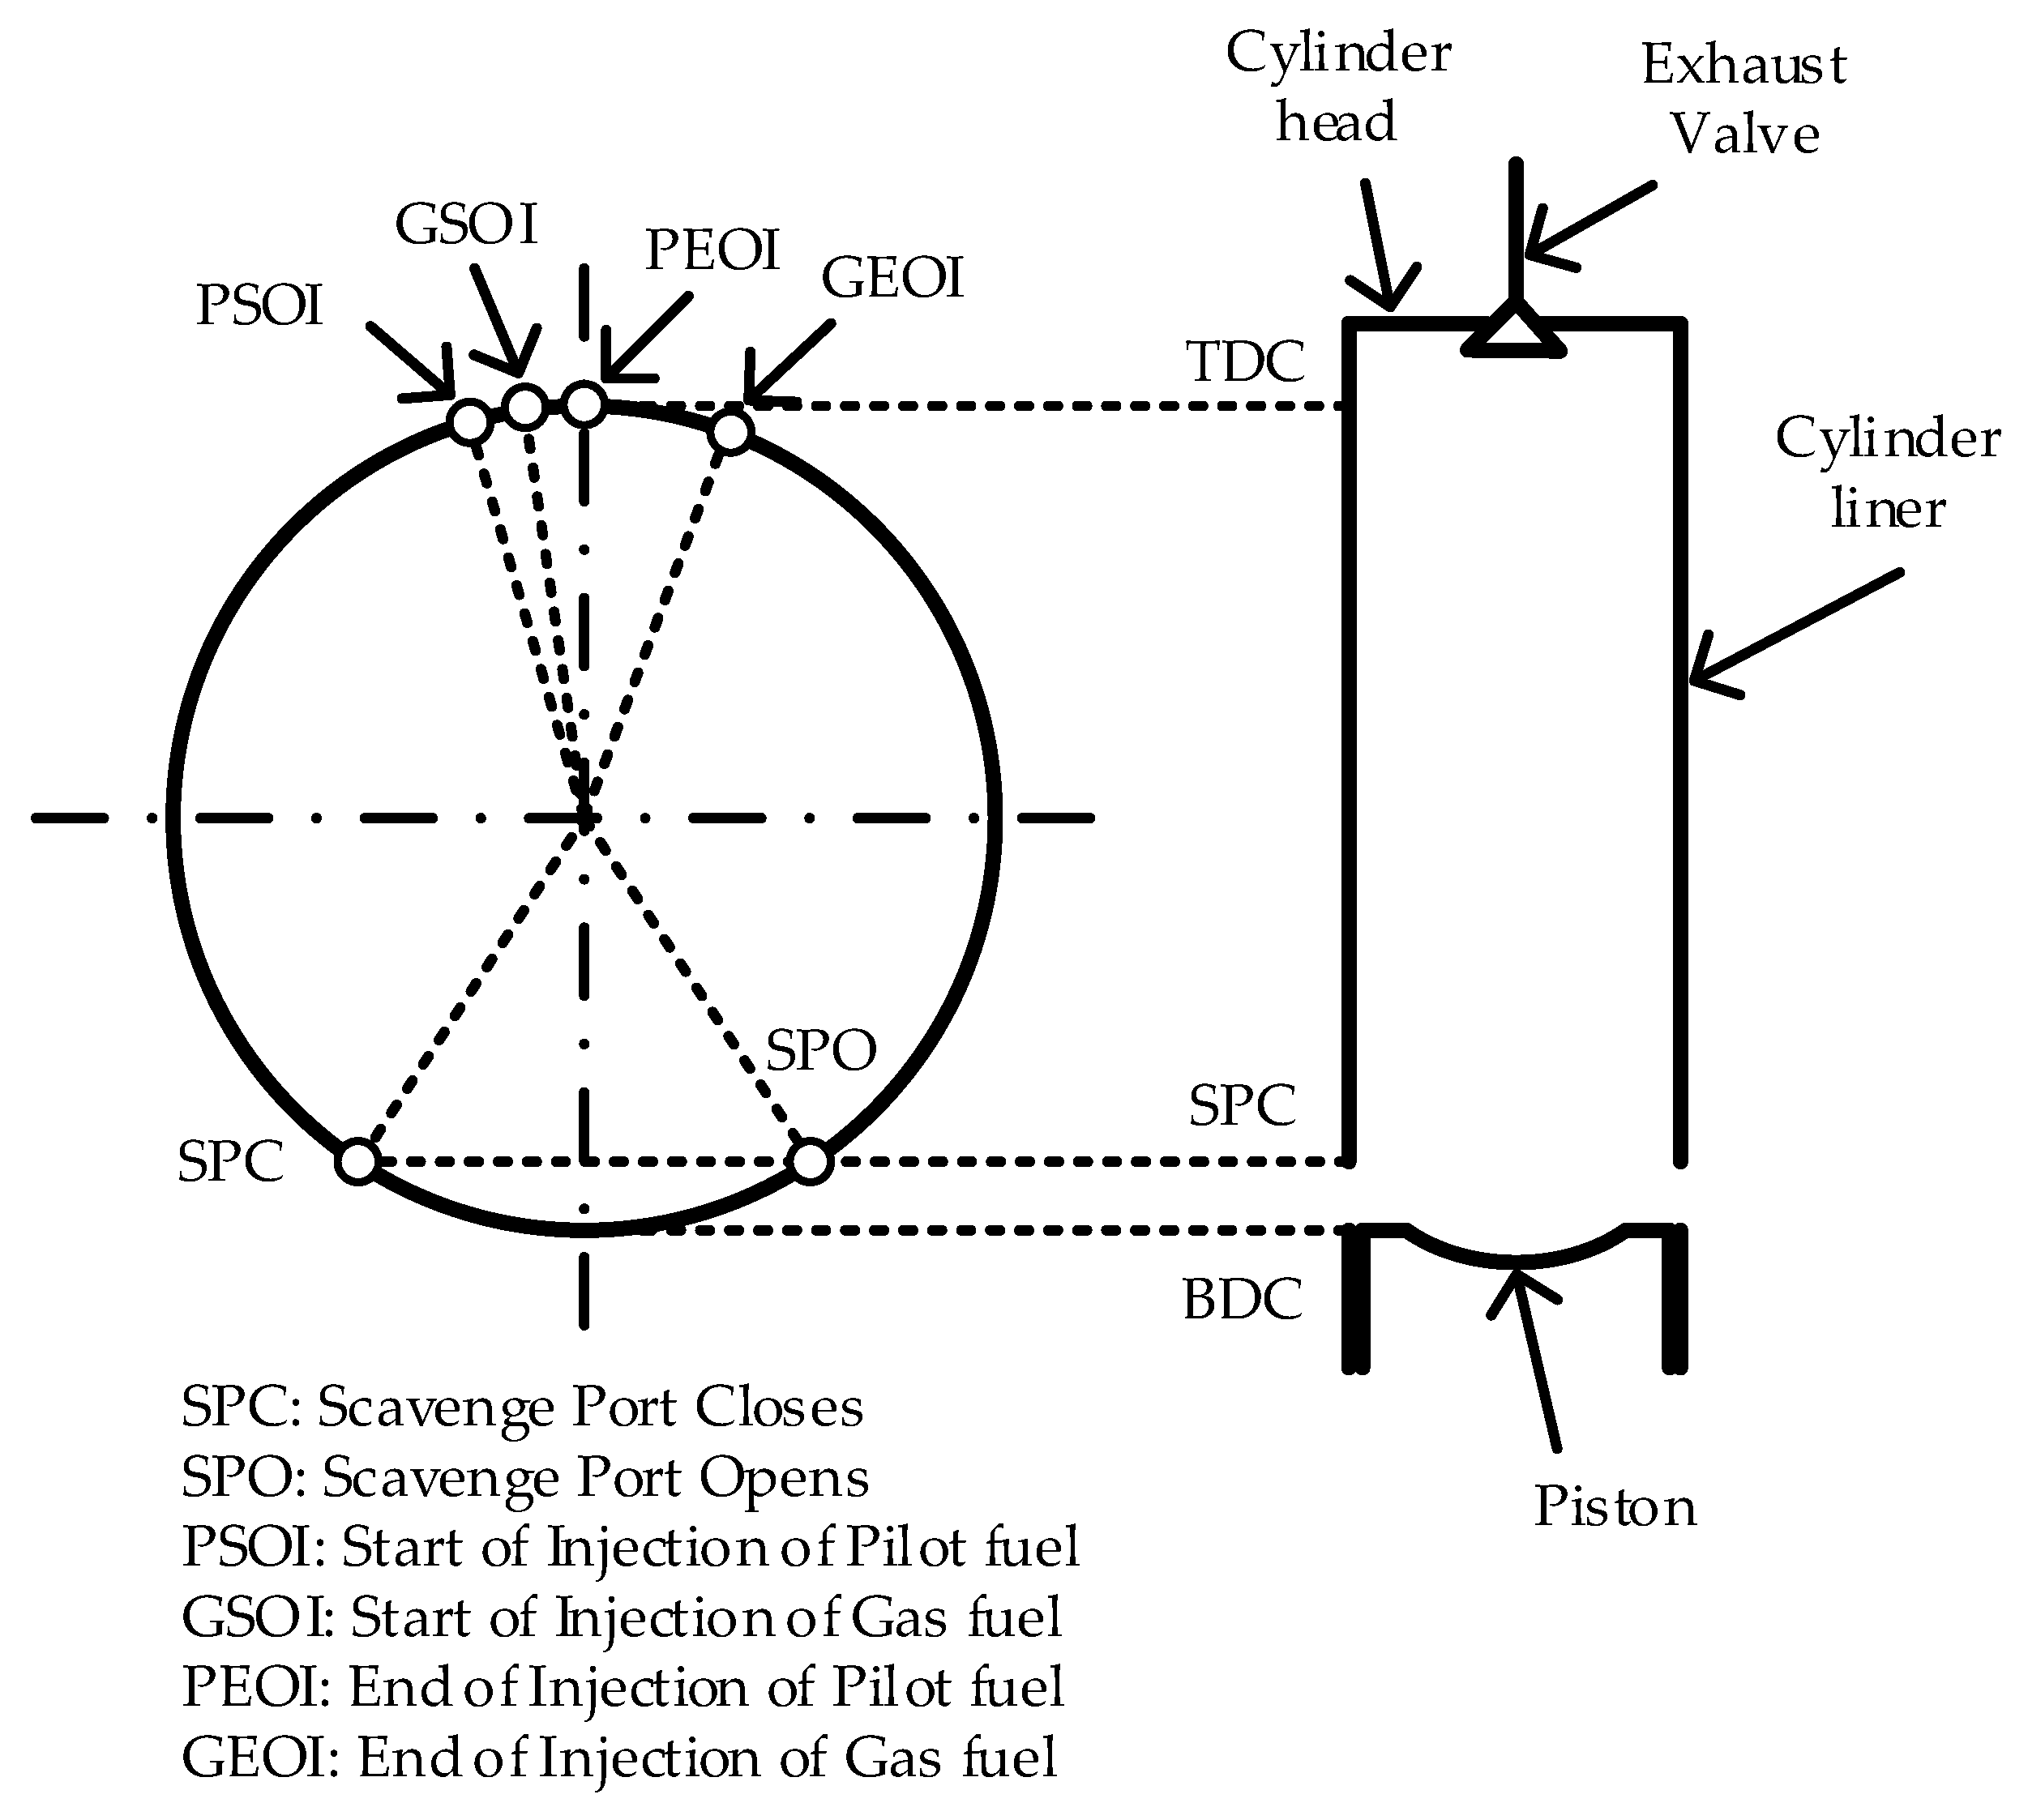
| SPC | 30 CAD ABDC | |
| EVO | 30 CAD BBDC | |
| Start of injection (SOI) | Pilot fuel | 12 CAD BTDC |
| Gaseous fuel | 10 CAD BTDC | |
| End of injection (EOI) | Pilot fuel | TDC |
| Gaseous fuel | 20 CAD ATDC | |
| Mesh Metrics | Coarse | Medium | Fine | |
|---|---|---|---|---|
| No. of Nodes at the BDC | 908,868 | 1,204,763 | 1,692,454 | |
| No. of Elements at the BDC | 875,672 | 1,164,920 | 1,642,512 | |
| Quality | Max. Aspect Ratio | 26.295 | 26.161 | 23.472 |
| Max. Skewness | 0.609 | 0.652 | 0.623 | |
| Min. Orthogonal | 0.599 | 0.529 | 0.484 | |
| Calculation Time | 48 h | 60 h | 84 h | |
Publisher’s Note: MDPI stays neutral with regard to jurisdictional claims in published maps and institutional affiliations. |
© 2022 by the authors. Licensee MDPI, Basel, Switzerland. This article is an open access article distributed under the terms and conditions of the Creative Commons Attribution (CC BY) license (https://creativecommons.org/licenses/by/4.0/).
Share and Cite
Kim, J.-S.; Lee, W.-J.; Pham, V.C.; Choi, J.-H. A Numerical Study on Fuel Injection Optimization for a ME-GI Dual-Fuel Marine Engine Based on CFD Analysis. Appl. Sci. 2022, 12, 3614. https://doi.org/10.3390/app12073614
Kim J-S, Lee W-J, Pham VC, Choi J-H. A Numerical Study on Fuel Injection Optimization for a ME-GI Dual-Fuel Marine Engine Based on CFD Analysis. Applied Sciences. 2022; 12(7):3614. https://doi.org/10.3390/app12073614
Chicago/Turabian StyleKim, Jun-Soo, Won-Ju Lee, Van Chien Pham, and Jae-Hyuk Choi. 2022. "A Numerical Study on Fuel Injection Optimization for a ME-GI Dual-Fuel Marine Engine Based on CFD Analysis" Applied Sciences 12, no. 7: 3614. https://doi.org/10.3390/app12073614
APA StyleKim, J.-S., Lee, W.-J., Pham, V. C., & Choi, J.-H. (2022). A Numerical Study on Fuel Injection Optimization for a ME-GI Dual-Fuel Marine Engine Based on CFD Analysis. Applied Sciences, 12(7), 3614. https://doi.org/10.3390/app12073614